 filings.tools
FactSet Research Systems (FDS) 10-K risk factor changes: FY2016 vs FY2015
The 2016-08-31 10-K against the 2015-08-31 one, compared heading by heading and sentence by sentence. One of these filings carries no fiscal year tag, so its year is the calendar year of the period end.
Item 1A39 rewritten42 added13 removed54 unchanged
All filing items1,212 rewritten790 added677 removed1,145 unchanged
Summary
counted, not written
- Item 1A headings could not be compared: only 0 carried over between the two years, which usually means one filing was read wrongly, so none is reported as new or removed.
- Sentence by sentence, 790 added, 677 removed, 1,212 rewritten and 1,145 unchanged across 21 items that differ.
Sentences by item
21 items, with every count and a link to each item that changed
Underlined words on a shaded ground are new in FY2016; struck-through words were in FY2015. Sentences that are wholly new or wholly gone are labelled rather than marked.
Item 1A. RISK FACTORS
39 rewritten, 42 added, 13 removed, 54 unchanged
As a consequence, operating results for a particular future period are difficult to predict, and, therefore, prior results are not necessarily indicative of [removed: results to be expected in] future [removed: periods.][added: performance.]
[removed: _FactSet] [added: FactSet] must ensure the protection and privacy of client [removed: data_][added: data]
Breaches of Company security measures could expose FactSet, its clients or the individuals affected to a risk of loss or misuse of this information, potentially resulting in litigation and liability for the Company, as well as the loss of existing or potential clients and damage to the [removed: Company] [added: Company’s] brand and reputation.
[removed: _FactSet_ _must] [added: FactSet must] continue to introduce new products and enhancements [removed: to_ _maintain] [added: to maintain] its technological [removed: position_][added: position]
[removed: _FactSet] [added: FactSet] must hire and retain key qualified [removed: personnel_][added: personnel]
[removed: _A] [added: A] decline in equity [removed: returns] and/or fixed income [added: returns] may impact the buying power of investment management [removed: clients_][added: clients]
Approximately [removed: 82.5%] [added: 82.6%] of the Company’s annual subscription value is derived from its investment management clients.
An equity market decline not only depresses assets under management but could cause a significant increase in redemption [removed: requests to move money out of equities and into other asset classes.][added: requests.]
[removed: _U__ncertainty, consolidation_ _and] [added: Uncertainty, consolidation and] business failures in the global investment banking industry may cause FactSet to lose clients and [removed: users_][added: users]
FactSet’s sell-side clients that perform M&A advisory work, capital markets services and equity research, account for approximately [removed: 17.5%] [added: 17.4%] of its revenues.
A significant portion of these revenues relate to services deployed by [removed: large, bulge bracket] [added: the largest] banks.
[removed: _Volatility] [added: Volatility] in the financial markets may delay the spending pattern of clients and reduce future ASV [removed: growth_][added: growth]
The decision to purchase the FactSet service often requires management-level [removed: sponsorship] [added: sponsorship,] which often leads FactSet to engage in relatively lengthy sales efforts.
[removed: _Competition] [added: Competition] in FactSet’s [removed: industry_ _may] [added: industry may] cause price reductions or loss of market [removed: share_][added: share]
[removed: However, future] [added: Future] competitive pricing pressures may result in decreased sales volumes and price reductions, resulting in lower revenues.
[removed: _Increased] [added: Increased] accessibility to free or relatively inexpensive information sources may reduce demand for [removed: FactSet_][added: FactSet]
Each year, [removed: more and more] [added: an increasing amount of] free or relatively inexpensive information becomes available, particularly through the Internet, and this trend may continue.
The availability of free or relatively inexpensive information may reduce demand for [removed: FactSet.][added: FactSet’s products.]
[removed: _Exposure] [added: Exposure] to fluctuations in currency exchange rates that could negatively impact financial results and cash [removed: flows_][added: flows]
[removed: The Company faces exposure to adverse movements in foreign currency exchange rates as 70% of FactSet’s employees and 48% of its leased office space are located outside the U.S.] These exposures may change over time [removed: as business practices evolve,] and they could have a material adverse impact on the Company’s financial results and cash flows.
The Company’s primary exposures relate to expenses denominated in British Pound Sterling, [removed: Euros, Japanese Yen,] [added: Euro,] Indian [removed: Rupee] [added: Rupee, Japanese Yen] and Philippine Peso.
This exposure has increased over the past 12 months primarily as the Company’s international employee base has risen [removed: 12%] [added: 17%] since August 31, [removed: 2014 and represented 70% of the FactSet workforce at August 31,] 2015.
FactSet’s non-U.S. dollar denominated revenues expected to be recognized over the next [removed: twelve] [added: 12] months are estimated to be [removed: $30.7 million] [added: $20.0 million,] while its non-U.S. dollar denominated expenses are estimated to be [removed: $205.4] [added: $213.3] million, [removed: which translates into] [added: resulting in] a net foreign currency exposure of [removed: $174.7] [added: $193.3] million.
Although FactSet believes that its foreign exchange hedging policies are reasonable and prudent under the circumstances, the Company’s attempt to hedge against these risks may not be successful, [removed: resulting in] [added: which could cause] an adverse impact on its results of operations.
[removed: _A] [added: A] prolonged or recurring outage at FactSet’s data centers could result in reduced service and the loss of [removed: clients_][added: clients]
FactSet’s business is dependent on its ability to [removed: rapidly and efficiently] process substantial volumes of data and transactions [added: rapidly and efficiently] on its computer-based networks and systems.
FactSet maintains back-up facilities for each of its major data centers to minimize the risk that any such event will disrupt [removed: operations, however, a loss of the Company’s services may induce its clients to seek alternative data suppliers and any such losses or damages incurred by FactSet could have a material adverse effect on its business.][added: operations.]
[removed: _The] [added: The] negotiation of contract terms supporting new and existing [removed: data_ _sets] [added: data sets] or [removed: products_][added: products]
FactSet [removed: is a provider of global financial and economic information on companies worldwide, aggregating] [added: aggregates] third party content from more than 220 data suppliers, [removed: 100] [added: 115] news sources and [removed: 80] [added: 85] exchanges.
Clients have access to the data and content found within the FactSet [removed: databases, which they can combine and utilize in nearly all of the Company’s applications.][added: databases.]
These databases are important to the Company’s operations as they provide clients with key [removed: information such as company fundamentals, estimates, global equity ownership, M&A data, events and transcripts, earnings and other equity and fixed income data.][added: information.]
[removed: _Third] [added: Third] parties may [removed: claim_ _FactSet_ _infringes] [added: claim FactSet infringes] upon their intellectual property [removed: rights_][added: rights]
Responding to these claims may require the Company to enter into royalty and licensing agreements on less favorable terms, enter into settlements, stop selling or [removed: to] redesign affected products, [removed: or to] pay damages or [removed: to] satisfy indemnification commitments with the Company’s clients or vendors under contractual provisions of various license arrangements.
[removed: _Changes] [added: Changes] in securities laws and regulations may increase expenses or may harm [removed: demand_][added: demand]
In addition, clients subject to investigations or legal proceedings may be adversely [removed: impacted] [added: impacted,] possibly leading to their liquidation, bankruptcy, receivership, reductions in assets under management, or diminished operations that would adversely affect the Company’s revenues.
[removed: _Adverse] [added: Adverse] resolution of litigation or governmental investigations may harm FactSet’s operating [removed: results_][added: results]
Unfavorable resolution of lawsuits [removed: or governmental investigations] could have a material adverse effect on the Company’s business, operating results or financial condition.
[removed: ITEM] [added: ITEM] 1B.
UNRESOLVED STAFF [removed: COMMENTS][added: COMMENTS]
A dramatic shift from active to passive investing could negatively impact user count growth
The predominant investment strategy today is active investing, which attempts to outperform the market.
The goal of active management is to beat a particular benchmark.
The majority of mutual funds are actively managed.
Analyzing market trends, the economy and the company-specific factor, active managers are constantly searching out information and gathering insights to help them make their investment decisions.
Passive management, or indexing, is an investment management approach based on investing in exactly the same securities, and in the same proportions, as an index such Dow Jones Industrial Average or the S&P 500.
It is called passive because portfolio managers don't make decisions about which securities to buy and sell; the managers merely follow the same methodology of constructing a portfolio as the index uses.
The main advantage of active management is the possibility that the managers will be able to outperform the index due to their superior skills.
They can make informed investment decisions based on their experiences, insights, knowledge and ability to identify opportunities that can translate into superior performance.
The main advantage of passive investing is that it closely matches the performance of the index.
Passive investing requires little decision-making by the manager.
The manager tries to duplicate the chosen index, tracking it as efficiently as possible.
This results in lower operating costs that are passed on to the investor in the form of lower fees.
Approximately 82.6% of the Company’s annual subscription value is derived from its investment management clients.
The prosperity of these clients is tied to equity assets under management.
In the past decade, passively managed index funds have seen greater investor interest, and this trend has become more dramatic in recent years.
A continued lessening of investor interest in actively managed equity funds could decrease demand for FactSet’s products and services.
Failure to maintain reputation
FactSet enjoys a positive reputation in the marketplace.
FactSet’s ability to attract and retain customers is affected by external perceptions of its brand and reputation.
Reputational damage from negative perceptions or publicity could affect FactSet’s ability to attract and retain clients and employees and its ability to price its products at their full value.
Although the Company monitors developments for areas of potential risk to its reputation and brand, negative perceptions or publicity could have a material adverse effect on FactSet’s business and financial results.
FactSet’s international operations involve special risks
In 2016, approximately 33% of FactSet’s revenue related to operations located outside of the U.S. In addition, a significant number of its employees, 71%, are located in offices outside of the U.S. The Company expects to continue its international growth, with international revenue accounting for an increased portion of total revenue in the future.
The Company’s international operations involve risks that differ from or are in addition to those faced by its U.S. operations.
These risks include difficulties in developing products, services and technology tailored to the needs of clients around the world, including in emerging markets; different employment laws and rules and related social and cultural factors; different regulatory and compliance requirements, including in the areas of privacy and data protection, anti-bribery and anti-corruption, trade sanctions, marketing and sales and other barriers to conducting business; cultural and language differences; diverse or less stable political, operating and economic environments and market fluctuations; civil disturbances or other catastrophic events that reduce business activity; limited recognition of FactSet’s brand; differing accounting principles and standards; restrictions on or adverse tax consequences from entity management efforts; and unexpected changes in U.S. or foreign tax laws.
If the Company is not able to efficiently adapt to or effectively manage the business in markets outside of the U.S., its business prospects and operating results could be materially and adversely affected.
In particular, political tension has been increasing in Manila, the Philippines, due to comments and the behavior over the last few months of Rodrigo Duterte, President of the Philippines.
Increasing civil unrest in Manila may make it difficult or impossible for FactSet to continue its operations there.
Although FactSet has tested business continuity plans in place for its operations there, an extended period of civil unrest that halts or significantly impedes operations could have a material adverse effect on the Company.
The Company faces exposure to adverse movements in foreign currency exchange rates as 71% of FactSet’s employees and 48% of its leased office space were located outside the U.S at August 31, 2016.
Failure to Identify, Integrate, or Realize Anticipated Benefits of Acquisitions
FactSet may be unable to successfully identify acquisitions or may experience integration or other risks resulting from its acquisitions, leading to an adverse effect on its financial results.
As the Company continues to pursue selective acquisitions to support its business and growth strategy, it seeks to be a disciplined acquirer.
There can be no assurance that it will be able to identify suitable candidates for successful acquisition at acceptable prices.
In addition, the Company’s ability to achieve the expected returns and synergies from past and future acquisitions and alliances depends in part upon its ability to effectively integrate the offerings, technology, sales, administrative functions and personnel of these businesses into FactSet’s core business.
The Company cannot assure its acquired businesses will perform at the levels anticipated.
In addition, past and future acquisitions may subject the Company to unanticipated risks or liabilities or disrupt operations.
However, a loss of the Company’s services may induce its clients to seek alternative data suppliers.
Any such losses or damages incurred by FactSet could have a material adverse effect on its business.
Competitive pricing pressures did not have a material impact on the Company’s results of operations during fiscal 2015 or in any other fiscal year presented.
FactSet seeks to maintain contractual relationships with a minimum of two content providers for each major type of financial data, though certain data sets on which FactSet relies have a limited number of suppliers.
These data sets include, without limitation, (1) Equity Pricing from exchanges such as NASDAQ, (2) Global Exchange Indices, (3) S&P CUSIP distribution, (4) S&P Ratings and (5) Moody’s Investor Service Corporate Ratings.
FactSet is not dependent on any one third party data supplier and no single vendor or data supplier represented more than 10% of FactSet's total data expenses in any fiscal year presented.
The Company combines data from commercial databases into its own dedicated single online service, which the client accesses to perform their analysis.
_Resolution of ongoing and other probable audits by tax authorities_
FactSet is subject to income taxes in both the U.S. and numerous foreign jurisdictions.
Significant judgment is required in determining its worldwide provision for income taxes.
In the ordinary course of business, there are many transactions and calculations where the ultimate tax determination is uncertain.
The Company’s provision for income taxes, tax liability or effective tax rates in the future could be adversely affected by numerous factors including, but not limited to, income before income taxes being lower than anticipated in countries with lower statutory tax rates and higher than anticipated in countries with higher statutory tax rates, changes in the valuation of deferred tax assets and liabilities and changes in tax laws, regulations, accounting principles or interpretations thereof.
FactSet is subject to the continuous examination of its income tax returns by the Internal Revenue Service and other tax authorities.
Although FactSet believes its tax estimates are reasonable, the final determination of tax audits and any related litigation could be materially different than that which is reflected in historical income tax provisions and accruals.
There can be no assurance that the outcomes from these continuous examinations will not have an adverse effect on the Company’s results of operations, including its provision for income taxes.
An excerpt. Shown here: all 39 rewritten, 40 of 42 added and all 13 removed. The counts are complete. For every sentence, read Item 1A. RISK FACTORS in the FY2016 filing and the FY2015 filing.
Item 7. MANAGEMENT’S DISCUSSION AND ANALYSIS OF FINANCIAL CONDITION AND RESULTS OF OPERATIONS
265 rewritten, 258 added, 249 removed, 227 unchanged
The MD&A should be read in conjunction with the Consolidated Financial Statements and related Notes included in Item 8, [removed: _Financial] [added: Financial] Statements and Supplementary [removed: Data,_] [added: Data,] of this Annual Report on Form 10-K.
[removed: Executive Overview][added: Executive Overview]
FactSet is a [added: leading] provider of integrated financial information and [added: big data] analytical applications to the global investment community.
These professionals include portfolio managers, [added: wealth managers,] research and performance analysts, risk managers, [removed: marketing professionals,] sell-side equity research professionals, investment bankers and fixed income professionals.
Investment management (buy-side) clients account for [removed: 82.5%] [added: 82.6%] of our annual subscription value [removed: (“ASV”), with] [added: and] the remainder [added: is derived] from investment banking firms (sell-side) that perform [removed: Mergers & Acquisitions] [added: mergers and acquisitions] (“M&A”) advisory work, capital markets services and equity research.
[removed: _2015] [added: 2016] Year in [removed: Review_][added: Review]
This fiscal year marked our [removed: 37th] [added: 38th] year of operation, our [removed: 35th] [added: 36th] consecutive year of revenue growth and our [removed: 19th] [added: 20th] consecutive year of earnings growth as a public company.
| Diluted EPS | | $ | [removed: 5.71] [added: 8.19] | | | $ | [removed: 4.92 |] [added: 5.71] | | | [removed: 16.1%] | [added: NM] | |
| Free Cash [removed: Flow(2)] [added: Flow(1)] | | $ | [removed: 280.8] [added: 283.4] | | | $ | [removed: 247.3 |] [added: 280.8] | | | [removed: 13.5%] | [added: 0.9%] | |
[removed: _Returning] [added: Returning] Value to [removed: Stockholders_][added: Stockholders]
On May [removed: 12, 2015,] [added: 6, 2016,] our Board of Directors approved a [removed: 12.8%] [added: 13.6%] increase in the regular quarterly [removed: dividend,] [added: dividend] beginning with the dividend payment in June [removed: 2015 of $0.44] [added: 2016 which was $0.50] per share, or [removed: $1.76] [added: $2.00] per share per annum.
In [removed: addition,] [added: fiscal 2016,] we repurchased [added: 1.5 million shares for $232.3 million under the existing share repurchase program compared to] 1.7 million shares for $252.8 million under the existing share repurchase program during fiscal 2015.
With our dividends and [added: our] share [removed: repurchases] [added: repurchases, in the aggregate,] we have returned [removed: $322.8] [added: $431.0] million [removed: in the aggregate] to [removed: stockholders] [added: shareholders] over the past 12 months.
[removed: _Capital Expenditures_][added: Capital Expenditures]
Capital expenditures were $25.7 million during fiscal 2015, up from $17.7 million [removed: a year ago.][added: in fiscal 2014.]
[removed: This expense included] [added: The remainder of our capital expenditures was primarily for purchases of] more servers for our existing data centers, [removed: purchasing] [added: additional] laptop computers and peripherals for [added: new] employees, [removed: upgrading] [added: upgrades to] existing computer systems and [removed: improving] [added: improvements to our] telecommunication equipment.
[removed: _Continued Focus on] Client [removed: Service_][added: Service / Consultants]
Client [removed: touches are] [added: satisfaction is] a key metric by which we measure the success of our service.
According to our fiscal [removed: 2015] [added: 2016] global client satisfaction survey, [removed: 97%] [added: 96%] of respondents were satisfied or very satisfied with FactSet’s support, consistent with the prior year.
Our reward for investing in a consulting group comprised of [removed: approximately 1,400] [added: several hundred] individuals is client loyalty, as evidenced by an annual client retention rate of greater than 95% of ASV as of August 31, [removed: 2015.][added: 2016.]
As of August 31, [removed: 2015,] [added: 2016,] employee headcount was [removed: 7,360,] [added: 8,375,] up [removed: 10.9%] [added: 13.8%] from a year ago.
Of our total employees, [removed: 2,238] [added: 2,407] were located in the U.S., [removed: 832] [added: 849] in Europe and [removed: 4,290] [added: 5,119] in Asia Pacific.
Approximately [removed: 54%] [added: 55%] of our employees were involved with content collection, 24% [removed: work] [added: worked] in product development, software and systems engineering, another [removed: 19% conduct] [added: 18% conducted] sales and consulting services and the remaining 3% provided administrative support.
We are proud to have received the following accolades during fiscal [removed: 2015:][added: 2016:]
| | ● | Named as one of the “100 Best Workplaces for [added: Women” and “Best Workplaces for] Millennials” in the U.S. by [removed: Fortune.] [added: Great Place to Work®] |
| | ● | Named as one of the [removed: “20 Great] [added: “Best] Workplaces in [removed: Technology” by Great Place to Work®.] [added: France”] |
[removed: Results] [added: Results] of [removed: Operations][added: Operations]
| [removed: (in] [added: _(in] thousands, except per share [removed: data) Years Ended August 31,] [added: data)_] | | [removed: 2015] [added: 2016] | | | | [removed: 2014] [added: 2015] | | | | Change | | | | [removed: 2014] [added: 2015] | | | | [removed: 2013] [added: 2014] | | | | Change | | |
| Cost of services | | [removed: | 405,339 | | |] [added: $] | [removed: 353,686] [added: 487,409] | | | [added: $] | [removed: 14.6%] [added: 405,339] | | | [added: $] | 353,686 | | [removed: | | 306,379 | | | | 15.4% | |]
| Selling, general and administrative [removed: | | | 269,511 |] [added: (“SG&A”)] | | | [removed: 264,430] [added: 290,007] | | | | [removed: 1.9%] [added: 269,511] | | | | 264,430 | | [removed: | | 282,314 | | | | (6.3)% | |]
| Operating income | | [removed: | 331,918 | | |] [added: $] | [removed: 302,219] [added: 349,676] | | | [added: $] | [removed: 9.8%] [added: 331,918] | | | [added: $] | 302,219 | | [removed: | | 269,419 | | | | 12.2% | |]
| Net income | | $ | [removed: 241,051] [added: 338,815] | | | $ | [removed: 211,543 | | | | 13.9%] [added: 241,051] | | | $ | 211,543 | | [removed: | $ | 198,637 | | | | 6.5% | |]
| Diluted earnings per common share | | $ | [removed: 5.71] [added: 8.19] | | | $ | [removed: 4.92 | | | | 16.1%] [added: 5.71] | | | $ | 4.92 | | [removed: | $ | 4.45 | | | | 10.6% | |]
| Diluted weighted average common shares | | | [removed: 42,235] [added: 41,365] | | | | [removed: 42,970] [added: 42,235] | | | | | | | | [removed: 42,970] [added: 42,235] | | | | [removed: 44,624] [added: 42,970] | | | | | |
[removed: _Revenues_][added: Revenues]
[removed: _Fiscal] [added: Fiscal] 2015 compared to Fiscal [removed: 2014_][added: 2014]
Our revenue growth drivers during fiscal 2015 were increases in ASV, clients and users, accelerated demand for our fixed income portfolio products, portfolio analytics [removed: (“PA”)] suite of products, sales of equity attribution and [removed: multi asset] [added: multi-asset] class risk models, additional purchases of our Portfolio Services solutions, expansion of our proprietary content, and continued growth of our RMS offering.
Annual Subscription Value [added: Growth]
[removed: ASV] [added: Annual subscription value] at [removed: a] [added: any] given point in time represents the forward-looking revenues for the next [removed: 12] [added: twelve] months from all subscription services [added: currently] being supplied to [removed: our] clients.
[removed: We have seen accelerated] [added: Our U.S. buy-side sales team saw sustained] demand for our fixed income portfolio products, [removed: PA suite of products, sales of equity attribution and multi asset] [added: multi-asset] class risk [removed: models.][added: and stress testing, attribution and publishing products.]
| | ● | Key Metrics |
We deliver insight and information to investment professionals through our analytics, service, content, and technology.
By integrating comprehensive datasets and analytics across asset classes with client data, we support the workflow of both buy-side and sell-side clients.
From streaming real-time data to historical information, including quotes, estimates, news and commentary, FactSet offers unique and third-party content through desktop, wireless, and off-platform solutions.
Our wide application suite offers tools and resources including company and industry analyses, full screening tools, portfolio analysis, risk profiles, alpha-testing, portfolio optimization and research management solutions.
Recent additions to our offering include a complete services solution focused on verifying, cleaning and loading portfolio data across asset classes, and an execution management system through our acquisition of Portware.
Our revenues are derived from subscriptions to products and services such as workstations, analytics, enterprise data and content, research management and trade execution.
Fiscal 2016 results continued our positive topline growth.
Revenue was up 12.0% while annual subscription value (“ASV”) increased 8.8% organically.
The pressures our clients have experienced in the past 12 months have not abated and we have dedicated ourselves to helping them navigate an uncertain environment.
As of August 31, 2016, ASV totaled $1.15 billion, an increase of $92.0 million over the prior year.
In addition, clients and users reached new highs of 3,092 and 65,655, respectively, in fiscal 2016.
This included $120.0 million relating to an accelerated share repurchase agreement (“ASR Agreement”) which we entered into in July 2016.
In 2016, we sought to strengthen and expand our core business model.
Our strategic acquisition of Portware in October 2015 has provided a new stream of revenue and growth.
Portware revenues have grown in double-digits since the acquisition and Portware is now break-even on an earnings per share basis.
Additionally, we sold our Market Metrics business in July 2016 and recognized an after-tax gain of $81.7 million in the fourth quarter of fiscal 2016.
The sale allowed us to sharpen our focus on our long-term growth drivers and our mission to deliver world-class insight and information through our analytics, service, content and technology.
Our investment in product, coupled with the acquisition of Portware, now allows us to address an increasingly greater percentage of our clients’ enterprise workflow.
Our robust Portfolio Analytics solutions have been the cornerstone of our growth in the middle office.
With a growing interest in passive investment instruments, such as exchange-traded funds (“ETFs”), our effort to build out our ETF content and analytics product suite has made significant strides in fiscal 2016.
We now have 29 ETFs in the marketplace based upon FactSet content and over 40 benchmarks.
The first FactSet branded ETF, the SPDR FactSet Innovative Technology ETF, launched in January 2016.
As a testament to our broadening suite of premium products and the strength of our business and service model FactSet was awarded “Best Overall Provider,” "Best Research Provider" and "Best Analytics Provider" by Inside Market Data in May 2016,.
We were also named the “Best Data Analytics Provider” by Waters Technology in July 2016.
Other recognition included “Best Research and Analytics Tool” award for our wealth management tools at the annual Systems in the City Awards.
Portware also earned “Best Buy-side EMS” for the third time and was included on Global Finance’s first annual list of forex leaders, "The Innovators 2015 – Foreign Exchange."
A client-centric approach has always been a key foundation of our success at FactSet.
In fiscal 2016, FactSet employees made over 45,000 client consulting visits, over 182,000 consulting calls and handled over 282,000 client questions.
In addition, our new support desk in Manila, the Philippines handled over 5,000 client emails.
During fiscal 2016, over 1,600 clients attended live or online FactSet training sessions and we saw a 7% increase in online learning registration.
Excluding the acquired Portware workforce and employees of the divested Market Metrics business, headcount increased 13.4% from a year ago.
The increases were primarily in positions that differentiate us in the market – software engineering, client service and content.
In order to optimize costs, we have invested in expanding our footprint and talent pool in India and the Philippines, where we now have a combined workforce of over 4,800.
Additionally, in fiscal 2016, we opened offices in Melbourne, Australia and Los Angeles, California.
| | ● | Ranked #89 on Fortune’s “100 Best Companies to Work For.” The only Connecticut-based company to make the list, we were recognized for our focus on career development and providing employees a variety of opportunities and experiences to learn. |
| | ● | Ranked #41 on Great Place to Work® “2016 Best Workplaces in the U.K.” The report highlighted our collaborative culture and marks our eighth appearance on the list. |
Key Metrics
The following is a review of our key metrics:
| | | As of and for the Year ended August 31, | | | | | | | | | | |
| --- | --- | --- |
| | ● | Management Changes |
We combine content regarding companies and securities from major markets all over the globe into a single online platform of information and analytics.
By consolidating content from hundreds of databases with powerful analytics, FactSet supports the investment process from initial research to published results for buy and sell-side professionals.
Our applications provide users access to company and industry analyses, multicompany comparisons, company screening, portfolio analysis, predictive risk measurements, alphatesting, portfolio optimization and simulation, real-time news and quotes and tools to value and analyze fixed income securities and portfolios.
With Microsoft® Office integration, wireless access and customizable options, we offer a complete financial workflow solution.
Our revenues are derived from month-to-month subscriptions to services, databases and financial applications.
Fiscal 2015 was a successful year for FactSet as we once again attained record levels of revenue, operating income, net income and diluted earnings per share.
Our record results demonstrate the continued success of the FactSet brand.
We grew organic ASV by $88.4 million compared to $64.6 million a year ago, which resulted in an organic ASV growth rate of 9.2%, up from 7.3% last year.
Our ASV growth rate of 9.2% helped us surpass the $1 billion milestone in total ASV and end the year at $1.058 billion.
The acceleration in ASV to 9.2% was also our highest rate of growth in over three years, while our 13.0% diluted earnings per share increase in the fourth quarter of fiscal 2015 represented our 21st consecutive quarter of double-digit adjusted EPS growth.
In addition, clients and users reached record highs of 2,976 and 62,205, respectively, in fiscal 2015, including a quarterly record of 3,210 users during the fourth quarter.
_Growth in each Key Metric_
Growth during fiscal 2015 was driven by delivering comprehensive workflow solutions to our clients, improvements in the functionality of our product line including portfolio analytics, enhancements to our technological infrastructure, expansion of our proprietary data and a continued focus on client service.
As a result, each of the following key operating metrics experienced growth over the past 12 months ($ in millions, except client and user counts):
| Key Metric | | 2015 | | | | 2014 | | | | Change | | | |
| --- | --- | --- | --- | --- | --- | --- | --- | --- | --- | --- | --- | --- | --- |
| ASV | | $ | 1,057.8 | | | $ | 963.6 | | | | 9.8%(1) | | |
| Revenues | | $ | 1,006.8 | | | $ | 920.3 | | | | 9.4% | | |
| Clients | | | 2,976 | | | | 2,743 | | | | 8.5% | | |
| Users | | | 62,205 | | | | 54,596 | | | | 13.9% | | |
| | _(1)_ | _ASV grew 9.2% organically year over year._ |
Additionally, our annual client retention was greater than 95% of ASV as of August 31, 2015, consistent with last year.
However, when expressed as a percentage of clients, our annual retention rate was 94%, up from 93% a year ago.
Approximately $13.8 million, or 54%, of our capital expenditures during fiscal 2015 were for purchases of computer equipment.
The remaining 46% of our capital expenditures were used to build out our offices primarily in New York, New York, Austin, Texas and Manila, the Philippines during fiscal 2015.
_Product Developments to Enhance our Workflow Solutions_
At FactSet, we are dedicated to building tools to support the workflows of our traditional Asset Management and Investment Banking base, as well as to extend our core competency to encompass Wealth Managers, Sales & Trading, Private Equity and Hedge Funds.
In fiscal 2015, we introduced unique product innovations and applications across our segments which have improved the speed, usability and discoverability of our workstation.
In addition to making the application more intuitive, we also released new site-wide search functionality which allows users to discover reports and applications.
In support of data integrity, we released FactSet Portfolio Services to offer robust and transparent data reconciliations and standardized custom reporting options across regions and asset classes.
FactSet Geographical Revenue Exposure (GeoRev), a recently released data set, enhances the way a user can view company revenues by geographic country and regional categories.
_Content and Technology_
Our product capabilities and goals are not possible without investments in content.
We are focused on metrics that measure the impact of our content used by our clients; timeliness, accuracy, completeness, coverage and usage.
Highlights of fiscal 2015 enhancements to our proprietary content are as follows:
_FactSet Enterprise Data Governance_
As a major publisher of financial content, FactSet continues to optimize its data governance model by employing enterprise level standards for entity and security reference data.
Leveraging these enterprise standards enables us to connect effectively all of its proprietary and third party content through a consistent reference data framework.
An excerpt. Shown here: 40 of 265 rewritten, 40 of 258 added and 40 of 249 removed. The counts are complete. For every sentence, read Item 7. MANAGEMENT’S DISCUSSION AND ANALYSIS OF FINANCIAL CONDITION AND RESULTS OF OPERATIONS in the FY2016 filing and the FY2015 filing.
Item 7A. QUANTITATIVE AND QUALITATIVE DISCLOSURES ABOUT MARKET RISK
22 rewritten, 9 added, 2 removed, 23 unchanged
[removed: Foreign] [added: Foreign] Currency Exchange [removed: Risk][added: Risk]
We conduct business outside the U.S. in several currencies including the British Pound Sterling, Euro, [removed: Japanese Yen,] Indian [removed: Rupee] [added: Rupee, Japanese Yen] and Philippine Peso.
[removed: Our] [added: Over the next 12 months, our] non-U.S. dollar denominated revenues expected to be recognized [removed: over the next twelve months] are estimated to be [removed: $30.7] [added: $20.0] million while our non-U.S. dollar denominated expenses are [removed: estimated to be $205.4] [added: $213.3] million, which translates into a net foreign currency exposure of [removed: $174.7 million.][added: $193.3 million per year.]
As of August 31, [removed: 2015,] [added: 2016,] we maintained the following foreign currency forward contracts to hedge our foreign currency exposure:
| | ● | [removed: _Indian Rupee_ \-] [added: Indian Rupee -] foreign currency forward contracts to hedge approximately 75% of our Indian Rupee exposure through the [removed: second] [added: first] quarter of fiscal [removed: 2018.] [added: 2019.] |
| | ● | [removed: _British Pound_ _Sterling_ _\-_] [added: British Pound Sterling -] foreign currency forward contracts to hedge approximately 50% of our British Pound Sterling exposure through the [removed: second] [added: fourth] quarter of fiscal [removed: 2016.] [added: 2017.] |
[removed: | | ● | _Euro -_ foreign currency forward contracts to] [added: We] hedge approximately 50% of our [removed: Euro] [added: British Pound Sterling] exposure through the fourth quarter of fiscal [removed: 2016. |][added: 2017, thus reducing our currency risk.]
[removed: As of August 31, 2015, the] [added: The] gross notional value of foreign [removed: exchange] [added: currency forward] contracts to purchase Indian Rupees with U.S. dollars was [removed: Rs.4.0 billion.][added: Rs.]
[removed: The] [added: As of August 31, 2016, the] gross notional value of foreign [removed: exchange] [added: currency forward] contracts to purchase British Pound Sterling with U.S. dollars was [removed: £10.5] [added: £23.1] million.
There were no other outstanding foreign [removed: exchange] [added: currency] forward contracts [removed: at] [added: as of] August 31, [removed: 2015.][added: 2016.]
A loss on derivatives of [removed: $0.6] [added: $0.5] million was recorded into operating income in fiscal [removed: 2015,] [added: 2016,] compared to a loss of [removed: $0.3] [added: $0.6] million a year ago.
[removed: These transactions are designated and accounted for as cash flow hedges in accordance with applicable accounting guidance_._] The changes in fair value for these foreign currency forward contracts are initially reported as a component of accumulated other comprehensive loss and subsequently reclassified into operating expenses when the hedged exposure affects earnings.
A sensitivity analysis was performed based on the estimated fair value of all foreign currency forward contracts outstanding at August 31, [removed: 2015.][added: 2016.]
If the U.S. dollar had been 10% weaker, the fair value of outstanding foreign currency forward contracts would have increased by [removed: $8.6] [added: $7.1] million, which would have had an immaterial impact on our [removed: consolidated balance sheet.][added: Consolidated Balance Sheet.]
Had we not had any hedges in place as of August 31, [removed: 2015,] [added: 2016,] a hypothetical 10% weaker U.S. dollar against all foreign currencies from the quoted foreign currency exchange rates at August 31, [removed: 2015,] [added: 2016,] would result in a decrease in operating income by [removed: $15.2] [added: $18.2] million over the next [removed: twelve] [added: 12] months.
A hypothetical 10% weaker U.S. dollar against all foreign currencies at August 31, [removed: 2015] [added: 2016] would increase the fair value of total assets by [removed: $28.4] [added: $29.5] million and equity by [removed: $25.6] [added: $26.6] million.
[removed: Interest] [added: Interest] Rate [removed: Risk][added: Risk]
The fair market value of our cash and investments at August 31, [removed: 2015] [added: 2016,] was [removed: $182.4] [added: $252.6] million.
Our investments consist of certificates of deposits with original maturities greater than three months, but less than one year and, as such, are classified as [removed: investments (short-term) on] [added: Investments within] our [removed: consolidated balance sheet.][added: Consolidated Balance Sheet.]
As of August 31, [removed: 2015,] [added: 2016,] the fair value of our long-term debt was [removed: $35.0] [added: $300.0] million, which approximated its carrying amount [removed: given its floating interest rate basis] and was determined based on quoted market prices for debt with a similar maturity.
The debt bears interest on the outstanding principal amount at a rate equal to [removed: 0.50%] [added: 0.75%] plus the Eurodollar rate, which is [removed: defined in the agreement as the rate per annum] equal to one-month LIBOR.
During fiscal [removed: 2015] [added: 2016] we paid [removed: approximately $0.1] [added: $3.1] million in interest on our outstanding Loan [removed: amount.][added: amount compared to $0.1 million in the prior year.]
4.2 billion
These transactions are designated and accounted for as cash flow hedges in accordance with applicable accounting guidance.
On June 23, 2016, the UK held a referendum in which British citizens approved an exit from the EU, commonly referred to as “Brexit.” As a result of the referendum, the global markets and currencies have been adversely impacted, including a sharp decline in the value of the British Pound Sterling as compared to the U.S. dollar.
Volatility in exchange rates is expected to continue in the short term as the UK negotiates its exit from the EU.
In the longer term, any impact from Brexit on us will depend, in part, on the outcome of tariff, trade, regulatory and other negotiations.
Although it is unknown what the result of those negotiations will be, it is possible that new terms may adversely affect our operations and financial results.
Cash and Cash Equivalents
Debt
Assuming all terms of our outstanding long-term debt remained the same, a hypothetical 25 basis point change (up or down) in the one-month LIBOR rate would result in a $0.8 million change in our annual interest expense.
| --- | --- | --- |
The gross notional value of foreign exchange contracts to purchase Euros with U.S. dollars was €18.1 million.
Item 1. Business
91 rewritten, 85 added, 146 removed, 72 unchanged
[removed: _Overview_][added: Business Overview]
FactSet [removed: Research Systems Inc. (the “Company” or “FactSet”) is a provider of] [added: provides] integrated financial information and [added: big data] analytical applications [removed: to] [added: for] the global investment community.
These professionals include portfolio managers, [added: wealth managers,] research and performance analysts, risk managers, [removed: marketing professionals,] sell-side equity research professionals, investment [removed: bankers] [added: bankers,] and fixed income professionals.
The Company’s revenues are derived from subscriptions to [removed: services, content] [added: products] and [removed: financial applications.][added: services such as workstations, analytics, enterprise data, research management, and trade execution.]
[removed: _Corporate History_][added: Corporate History]
FactSet [added: Research Systems Inc. (the “Company” or “FactSet”)] was founded in 1978 and has been publicly held since 1996.
The Company is dual listed on the New York Stock Exchange [added: (“NYSE”)] and the NASDAQ Stock Market [added: (“NASDAQ”)] under the symbol “FDS.” Fiscal [removed: 2015] [added: 2016] marked the Company’s [removed: 37th] [added: 38th] year of operation, its [removed: 35th] [added: 36th] consecutive year of revenue growth and its [removed: 19th] [added: 20th] consecutive year of earnings growth as a public company.
[removed: 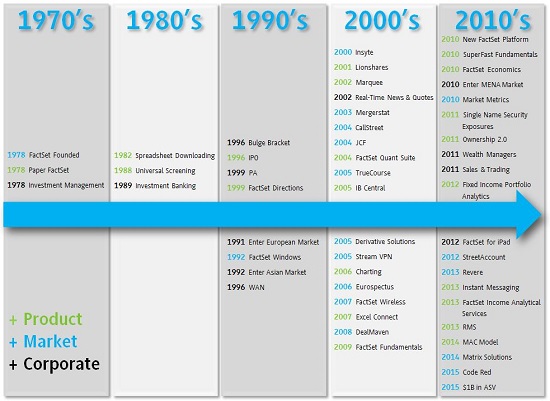][added: |  | 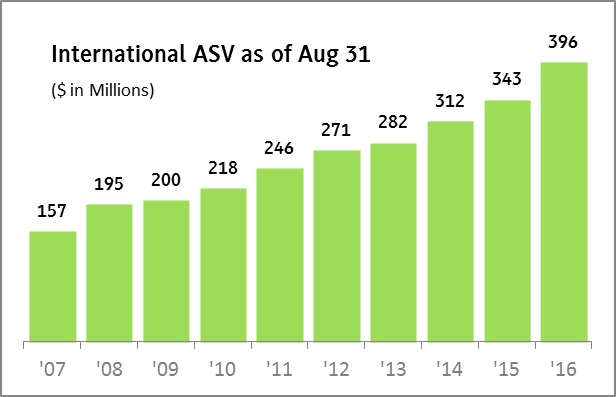 |]
[removed: FactSet’s Chairman and] [added: Philip Snow –] Chief Executive [removed: Officer, Philip A.][added: Officer_.]
[removed: Philip Snow,] [added: Mr. Snow] was named [removed: CEO,] [added: Chief Executive Officer] effective July 1, 2015.
[removed: On January 21, 2015, FactSet hired] [added: |] Scott [added: G.] Miller [removed: as the Company’s new] [added: | 48 |] Executive Vice President, Global Director of [removed: Sales.][added: Sales | 2015 |]
[removed: In addition, on March 16, 2015, FactSet appointed] [added: |] Mark [added: J.] Hale [removed: as the Company’s new] [added: | 43 |] Executive Vice President, Chief Operating [removed: Officer.][added: Officer | 2015 |]
[removed: _Business Strategy_][added: Business Strategy]
[removed: A few years ago, the Company embarked on] [added: FactSet launched its multi-phase project,] Project NextGen, [removed: a multi-phase initiative designed] [added: several years ago] to [removed: transition] [added: evolve] away from large mainframe computers to a more distributed environment powered by a vast array of smaller, faster and more cost-effective machines.
[removed: _Dedication to] Client Service and [removed: Support_][added: Support]
This client-focused dedication helped FactSet's [removed: increase its] [added: achieve a] client retention rate [removed: to] [added: of] more than 95% of [removed: ASV] [added: ASV,] and 94% when expressed as a percentage of clients, [removed: an increase from 93% as of] [added: consistent with] the [removed: end of fiscal 2014.][added: prior year.]
As of August 31, [removed: 2015,] [added: 2016,] employee headcount was [removed: 7,360] [added: 8,375] up [removed: 10.9%] [added: 13.8%] from a year ago.
Of [removed: this total, 2,238 employees] [added: FactSet’s total employees, 2,407] were located in the U.S., [removed: 832] [added: 849] in Europe and [removed: 4,290] [added: 5,119] in [removed: the] Asia [removed: Pacific region.][added: Pacific.]
Approximately [removed: 54%] [added: 55%] of the Company’s employees [removed: are] [added: were] involved with content collection, 24% [removed: work] [added: worked] in product development, software and systems engineering, another [removed: 19% conduct] [added: 18% conducted] sales and consulting services and the remaining 3% [removed: provide] [added: provided] administrative support.
[removed: FactSet believes that its current relations with employees are good,] Company management keeps employees informed of decisions and encourages and implements employee suggestions whenever practicable.
As of August 31, [removed: 2015,] [added: 2016,] approximately [removed: 142] [added: 155] FactSet employees within certain French subsidiaries were represented by a mandatory works council.
FactSet is proud to have received the following accolades in fiscal [removed: 2015:][added: 2016:]
| | ● | Ranked [removed: #48] [added: #89] on Fortune’s “100 Best Companies to Work [removed: For.”] [added: For”] |
| | ● | Recognized as one of the UK’s “Best [removed: Workplaces.”] [added: Workplaces”] |
| | ● | Included in the [removed: “2015] [added: “2016] Best Places to Work in [removed: France.”] [added: France”] |
| | ● | Named as one of the [added: “30 Best Workplaces in Finance and Insurance” and] “100 Best Workplaces for Millennials” in the U.S. by [removed: Fortune.] [added: _Fortune_] |
[removed: _Client] [added: Client] Subscription [removed: Growth_][added: Growth]
Annual subscription value [added: (“ASV”)] at any given point in time represents the forward-looking revenues for the next twelve months from all subscription services currently being supplied to clients.
At August 31, [removed: 2015,] [added: 2016,] ASV was [removed: $1.058] [added: $1.15] billion, up [removed: 9.2%] [added: 8.8%] organically from a year ago.
During fiscal [removed: 2015,] [added: 2016,] FactSet added [removed: 183] [added: 116] net new [removed: clients (excluding 50 new clients acquired from the acquisition of Code Red),] [added: clients,] increasing the number of clients by [removed: 6.7%] [added: 3.9%] over the prior year.
In terms of users, [removed: 7,609] [added: 3,450] net new users were added during fiscal [removed: 2015, the highest year over year growth total ever.][added: 2016.]
FactSet saw healthy progression in the number of users at both its buy-side and sell-side [removed: clients as growth in the initial public offering (“IPO”) and M&A marketplaces helped boost the Company’s banking clients in 2015.][added: clients.]
The following [removed: provides] [added: charts provide] a [removed: snap shot] [added: snapshot] view of FactSet’s ASV growth over the past 10 fiscal years.
| [removed: 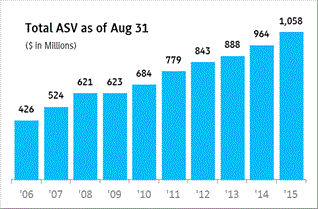 |] [added: 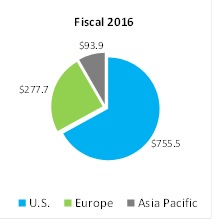] | [removed: 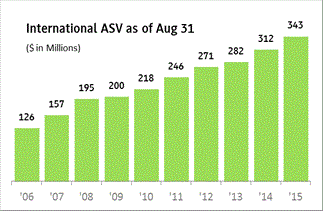] [added: 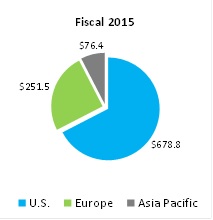] | [added: 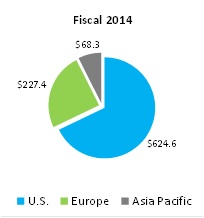] |
[removed: _Financial] [added: Financial] Information on Geographic [removed: Areas_][added: Areas]
Operating segments are defined as components of an enterprise that engage in business activities from which they may earn revenues and incur expenses, whose operating results are regularly reviewed by the enterprise’s chief operating decision maker [removed: (“CODM”)] to make decisions about resources to be allocated to the segment and assess its performance, and for which discrete financial information is available.
[added: Senior management, along with the CEO, constitute] FactSet’s [removed: CODM is its Chief Executive Officer, who] [added: chief operating decision making group and] is responsible for making decisions about resources allocated amongst the operating segments based on actual results.
Financial information, including revenues, operating income and long-lived assets related to the Company’s operations in each geographic area are presented in Note 7, [removed: _Segment_ _Information,_] [added: _Segment Information_,] in the Notes to the Company’s Consolidated Financial Statements included in Item 8.
[removed: _Third_ _Party Data Content_][added: Third Party Content]
FactSet aggregates third party content from more than 220 data suppliers, [removed: 100] [added: 115] news sources and [removed: 80] [added: 85] exchanges into its own dedicated online service which [removed: the client accesses] [added: clients access] to perform their analyses.
The Company delivers insight and information to investment professionals through its analytics, service, content, and technology.
By integrating comprehensive datasets and analytics across asset classes with client data, FactSet supports the workflow of both buy-side and sell-side clients.
From streaming real-time data to historical information, including quotes, estimates, news and commentary, FactSet offers unique and third-party content through desktop, wireless and off-platform solutions.
The Company’s wide application suite offers tools and resources including company and industry analyses, full screening tools, portfolio analysis, risk profiles, alpha-testing, portfolio optimization and research management solutions.
Recent additions to FactSet’s offering include a complete services solution focused on verifying, cleaning and loading portfolio data across asset classes, and an execution management system through its acquisition of Portware.
In fiscal 2016, FactSet earned recognition as the “Best Overall Provider” of market data, research and analytics from Inside Market Data (“IMD”).
It was named “Best Data Analytics Provider” in the annual rankings announced by Waters Technology.
FactSet was also honored with the “Best Research and Analytics Tool” award at the annual Systems in the City Awards presented in London by Goodacre UK.
The awards added to a long list of achievements for FactSet in fiscal 2016, including “Best Research Provider” and “Best Analytics Provider” by IMD in May 2016 and earning a spot for the eighth time as one of Fortune’s “100 Best Companies to Work For”.
In October 2015, FactSet completed its acquisition of Portware, LLC (“Portware”), an award-winning, multi-asset execution management system (“EMS”).
The addition of Portware enables FactSet to support client workflows in additional segments of the investment process.
Together, FactSet and Portware expect to provide the investment community with state-of-the-art analytic and execution applications across more of the portfolio lifecycle, from analyst to portfolio manager to trader.
FactSet also announced in July 2016 the sale of its market research business focused on advisor-sold investments and insurance, consisting of Market Metrics and Matrix-Data Limited (collectively “Market Metrics”).
The divestment of this business is consistent with the Company’s long-term strategic direction and commitment to delivering value to shareholders.
The increase in ASV during fiscal 2016 was primarily driven by the Analytics, Content & Technology Solutions (“CTS”), Research Management Solutions (“RMS”) and Portware businesses.
This net number reflects a reduction of 41 clients due to the sale of the Market Metrics business.
| --- | --- |
Financial information at the operating segment level is reviewed jointly by the Chief Executive Officer (“CEO”) and senior management.
Senior management consists of executives who directly report to the CEO, comprising the Chief Financial Officer, Chief Operating Officer, Global Head of Sales, General Counsel, Chief Human Resources Officer and three senior directors in charge of product strategy.
Workstations
FactSet’s most widely known product is its flagship FactSet workstation, deployed on thousands of desks around the globe.
In fiscal 2016, user growth was 5.5%, and there are now more than 65,000 global FactSet users.
In the workstation, FactSet has focused on optimizing speed and responsiveness and on building out unique content sets.
Such unique content includes its StreetAccount news content, Revere Geographic Revenue data, and the addition of real time fixed income pricing through a third party partnership.
With increased regulatory scrutiny and regulations, FactSet RMS has also driven growth.
As one of the largest providers of RMS in the industry, FactSet is used by firms of all asset classes, from the startup hedge fund to the largest institutional asset managers, and from small endowments to the largest pensions and sovereign wealth funds.
FactSet RMS helps clients institutionalize and optimize their research workflow providing a solution that boosts cross-firm collaboration, helps create transparency to ensure compliance, and promotes business continuity.
Analytics
Investment professionals want to focus on producing results.
They need in-depth insight, powerful analytics, and comprehensive datasets integrated seamlessly with their portfolios.
FactSet helps to solve this need by integrating petabytes of data each day (from clients, FactSet’s own unique content and hundreds of third-party providers), as well as by offering multi-asset class analytics, performance, and risk.
FactSet Portfolio Analysis is a multi-asset class, global solution that helps investment professionals spend more time discovering alpha and less time managing their portfolios.
Portfolio Analysis is an interactive tool that helps portfolio managers make smarter decisions with a flexible, multi-tile interface of reports and charts.
FactSet’s Multi-Asset Class (MAC) model helps users understand risk factors across different asset types and classes.
Additionally, the Company has enhanced its offering with client-requested functionality such as a linear MAC model, fixed income optimization, and the DTS (Duration Times Spread) attribution model.
Content and Technology Solutions (CTS)
FactSet is focused on delivering value to its clients in the way they want to consume it.
This delivery includes offering powerful analytics and comprehensive datasets through desktop, mobile and web interfaces, as well as giving clients direct access to insight and information outside of the Workstation through cloud-based application program interfaces (“APIs”), data feeds and white label solutions.
The CTS suite includes a growing number of standardized data feeds that complement and mirror the data in the FactSet workstation.
These capabilities and data solutions are powering a growing number of workflows for the middle and front office.
FactSet combines content regarding companies and securities from major markets all over the globe into a single online platform of information and analytics.
By consolidating content from hundreds of databases with powerful analytics, FactSet supports the investment process from initial research to published results for buy and sell-side professionals.
The Company’s applications provide users access to company and industry analyses, multicompany comparisons, company screening, portfolio analysis, predictive risk measurements, alphatesting, portfolio optimization and simulation, real-time news and quotes and tools to value and analyze fixed income securities and portfolios.
With Microsoft® Office integration, wireless access and customizable options, FactSet offers a complete financial workflow solution.
Revenues are derived from month-to-month subscriptions to services, databases and financial applications.
Investment management (buy-side) clients account for 82.5% of annual subscription value (“ASV”), with the remainder from investment banking firms (sell-side) that perform Mergers & Acquisitions (“M&A”) advisory work, capital markets services and equity research.
Today, FactSet continues to uphold its key corporate values: having an intelligent workforce; offering exceptional client service; embracing long-term growth strategies; being a thought leader; providing a friendly work environment; performing community service; innovating within the financial industry; and embracing global diversity.
As of August 31, 2015, FactSet has a market capitalization of $6.5 billion, up 22.6% over last year.
The Company currently has 38 office locations in 21 countries employing 7,360 individuals.
In March 2015, FactSet was ranked #48 on Fortune’s “100 Best Companies to Work For,” marking the Company’s seventh appearance on the list in the last eight years.
FactSet was also recognized as one of the UK’s “Best Workplaces” by the Great Place to Work® Institute UK for the seventh consecutive year, listed in Crain’s “Chicago’s Best Places to Work” for the third year in a row and included in the “2015 Best Places to Work in France” list for the fourth consecutive year.
In addition, in July 2015 the Company was awarded the Best Research and Analytics tool at the 2015 Systems in the City Awards.
The following timeline depicts the Company’s history with the financial information services industry since its founding:
_M__anagement Changes_
Hadley, stepped down as CEO effective July 1, 2015.
He remains an employee of FactSet and serves as the Chairman of its Board of Directors.
During Mr. Hadley’s tenure as CEO, the Company’s annual revenue growth rate exceeded 14%, diluted EPS grew from $0.49 to $5.71 per share and over $2 billion was returned to stockholders in the form of cash dividends and share repurchases.
FactSet’s President, F.
Mr. Snow, age 51, was also elected to the Board of Directors, effective March 16, 2015.
Mr. Miller succeeded Michael Frankenfield and reports directly to Mr. Snow.
Mr. Frankenfield, who has been with FactSet since 1989 and had been in his current role since 2009, remains with the Company as a Vice Chairman and works in a senior executive sales advisory position.
Mr. Hale succeeded Peter Walsh and reports directly to Mr. Snow.
Mr. Walsh, who has been with FactSet since 1999 and had been in his current role since 2009, remains with the Company focusing on various discrete projects.
Lastly, in June 2015, FactSet hired Edward Baker-Greene, its first-ever Chief Human Resources Officer, to oversee and grow its critically important employee talent pool.
FactSet’s business strategy is to be a leading provider of integrated financial information and analytical applications to the global investment community by consolidating data content with powerful analytics on a single platform, while providing superior individual desktop client service.
Since its founding, the Company has used its dedicated workforce, technological proficiency and unwavering commitment to client service to drive revenue and earnings per share growth as well increase its international reach, headcount, and ultimately, its competitive edge.
In 2015, FactSet engaged in numerous strategic initiatives aimed at building and strengthening key pillars supporting its plans for future growth including its scalability, its rich pool of talent and the pursuit of innovation.
_Scale_
Operating the business at scale is about optimization, not duplication, of efforts.
FactSet is highly focused on wisely allocating its resources to drive the greatest results across its segments.
The result is a more modern look and feel, a dramatic increase in the speed of the user experience and a robust platform that will allow FactSet to build innovative, cutting-edge products that meet our clients’ needs today and tomorrow.
The early years of FactSet’s evolution saw significant attention paid towards building a great product and establishing a loyal client following.
Though these goals will always remain core priorities for the Company, in looking towards the future, there is a strong need to increase focus on the infrastructure that supports the business.
In fiscal 2015, FactSet brought greater definition to these integral components of the business through the realignment of its product management and strategy teams.
These efforts have enabled the Company to better scale its operations for future growth while simultaneously enhancing its world-class product offerings and services.
Client service is a key component of the Company’s business model, with 62,205 users of FactSet spread across 2,976 clients in over 50 countries worldwide as of August 31, 2015.
In addition to unlimited access to the Company’s global support desk, each client is assigned a consultant who works to become familiar with the user’s needs and processes.
These consultants train users, assist on projects and answer any inquires the client may have.
The consultant role has evolved through the years as FactSet has expanded its client base and products.
FactSet aims to hire consultants to specialize in the products for user type, so that it can more effectively route support desk calls and create roles within consulting that encourage proactive support.
An excerpt. Shown here: 40 of 91 rewritten, 40 of 85 added and 40 of 146 removed. The counts are complete. For every sentence, read Item 1. Business in the FY2016 filing and the FY2015 filing.
Item 3. LEGAL PROCEEDINGS
1 rewritten, 1 added, 0 removed, 5 unchanged
[removed: ITEM 4. MINE] [added: MINE] SAFETY [removed: DISCLOSURES][added: DISCLOSURES]
ITEM 4.
Cover and table of contents
18 rewritten, 7 added, 3 removed, 31 unchanged
10-K 1 [removed: fds20150831_10k.htm] [added: fds20161020_10k.htm] FORM 10-K
[added: |] ☒ [added: |] Annual Report pursuant to Section 13 or 15(d) of the Securities Exchange Act of 1934 [added: |]
For the fiscal year ended August 31, [removed: 2015][added: 2016]
[added: |] ☐ [added: |] Transition Report pursuant to Section 13 or 15(d) of the Securities Exchange Act of 1934 [added: |]
FACTSET [removed: RESEARCH] [added: RESEARCH] SYSTEMS INC.
[removed: ][added: |  |]
| Delaware (State or other jurisdiction of incorporation or organization) | 13-3362547 (I.R.S. Employer Identification No.) | [removed: |]
601 Merritt [removed: 7, Norwalk,] [added: 7, Norwalk,] Connecticut 06851
Name of each exchange on which registered: New York Stock Exchange [removed: and The] [added: and The] NASDAQ Stock Market LLC
| [removed: |] Large accelerated filer ☒ | [added: |] Accelerated filer ☐ |
| [removed: |] Non-Accelerated filer ☐ (Do not check if a smaller reporting company) | [added: |] Smaller Reporting Company ☐ |
The aggregate market value of the registrant’s common stock held by non-affiliates of the registrant based upon the closing price of a share of the registrant’s common stock on February [removed: 27, 2015,] [added: 29, 2016,] the last business day of the registrant’s most recently completed second fiscal quarter, as reported by the New York Stock Exchange on that date, was [removed: $6,345,491,456.][added: $6,049,252,249.]
The number of shares outstanding of the registrant’s common stock, as of October [removed: 20, 2015,] [added: 25, 2016,] was [removed: 41,448,927.][added: 39,935,323.]
Portions of the registrant’s definitive Proxy Statement dated October [removed: 30, 2015,] [added: 31, 2016,] for the [removed: 2015] [added: 2016] Annual Meeting of Stockholders to be held on December [removed: 15, 2015,] [added: 20, 2016,] are incorporated by reference into Part III of this Annual Report on Form 10-K where indicated.
For The Fiscal Year Ended August 31, [removed: 2015][added: 2016]
| [removed: PART I | |] [added: PART I] | | |
| | | [removed: | |] Page |
Risk Factors [removed: 14][added: 12]
UNITED STATES
| --- | --- |
| --- | --- |
| --- |
| --- | --- |
| | | |
| | | |
UNITED STATES
| --- | --- | --- | --- | --- |
| | | | | |
Item 1B. Unresolved Staff Comments 16
2 rewritten, 3 added, 1 removed, 2 unchanged
Properties [removed: 17][added: 16]
Legal Proceedings [removed: 18][added: 16]
| | | |
| | | |
| | | |
| | | | | |
Item 4. Mine Safety Disclosures 16
6 rewritten, 8 added, 1 removed, 5 unchanged
| [removed: PART II | |] [added: PART II] | | |
Market for Registrant’s Common Equity, Related Stockholder Matters and Issuer Purchases of Equity Securities [removed: 19][added: 17]
Selected Financial Data [removed: 21][added: 19]
Management’s Discussion and Analysis of Financial Condition and Results of Operations [removed: 22][added: 20]
Quantitative and Qualitative Disclosures About Market Risk [removed: 42][added: 40]
Financial Statements and Supplementary Data [removed: 44][added: 42]
| | | |
| | | |
| | | |
| | | |
| | | |
| | | |
| | | |
| | | |
| | | | | |
Item 9. Changes in and Disagreements with Accountants on Accounting and Financial Disclosure 82
1 rewritten, 2 added, 1 removed, 1 unchanged
Controls and Procedures [removed: 85][added: 82]
| | | |
| | | |
| | | | | |
Item 9B. Other Information 82
9 rewritten, 11 added, 1 removed, 7 unchanged
| [removed: PART III | |] [added: PART III] | | |
Directors, Executive Officers and Corporate Governance [removed: 86][added: 83]
Executive Compensation [removed: 86][added: 83]
Security Ownership of Certain Beneficial Owners and Management and Related Stockholder Matters [removed: 86][added: 83]
Certain Relationships and Related Transactions, and Director Independence [removed: 86][added: 83]
Principal Accounting Fees and Services [removed: 86][added: 83]
| [removed: PART IV | |] [added: PART IV] | | |
Exhibits, Financial Statement Schedules [removed: 87][added: 84]
| Signatures | | [removed: | | 89] [added: 86] |
| | | |
| | | |
| | | |
| | | |
| | | |
| | | |
| | | |
| | | |
| | | |
| | | |
| | | |
| | | | | |
Item 2. PROPERTIES
4 rewritten, 29 added, 24 removed, 1 unchanged
At August 31, [removed: 2015,] [added: 2016,] the Company [removed: leases] [added: leased] approximately 202,000 square feet of office space at its headquarters in Norwalk, Connecticut.
[removed: The] [added: Additionally, the Company has] data content collection centers located in Hyderabad, India and Manila, the Philippines [added: which] benefit all of the [removed: Companies] [added: Company’s] operating segments.
Including new lease agreements executed during fiscal [removed: 2015,] [added: 2016,] the Company’s worldwide leased office space increased to approximately [removed: 909,000] [added: 1,072,000] square feet at August 31, [removed: 2015,] [added: 2016,] up [removed: 72,000] [added: 163,000] square [removed: feet] [added: feet,] or [removed: 8.6%] [added: 18%,] from August 31, [removed: 2014.][added: 2015, and includes properties at the following locations:]
The Company believes the amount of leased office space as of August 31, [removed: 2015] [added: 2016] is adequate for its current needs and that additional space is available for lease to meet any future needs.
| Segment | Location |
| --- | --- |
| United States | Atlanta, Georgia |
| | Austin, Texas |
| | Boston, Massachusetts |
| | Chicago, Illinois |
| | Jackson, Wyoming |
| | Los Angeles, California |
| | Manchester, New Hampshire |
| | New York, New York |
| | San Francisco, California |
| | Toronto, Canada |
| | Tuscaloosa, Alabama |
| | Youngtown, Ohio |
| Europe | Avon, France |
| | Amsterdam, The Netherlands |
| | Dubai, United Arab Emirates |
| | Frankfurt, Germany |
| | London, England |
| | Milan, Italy |
| | Paris, France |
| | Riga, Latvia |
| Asia Pacific | Hong Kong |
| | Singapore |
| | Chennai, India |
| | Mumbai, India |
| | Melbourne, Australia |
| | Sydney, Australia |
| | Tokyo, Japan |
In addition, FactSet leases office space for its U.S. reportable segment in New York, New York; Boston, Massachusetts; Chicago, Illinois; San Francisco, California; Austin, Texas; Jackson, Wyoming; Atlanta, Georgia; Tuscaloosa, Alabama; Newark, Ridgewood and Piscataway, New Jersey; Manchester, New Hampshire; Reston, Virginia, Youngstown, Ohio, and Toronto, Canada.
The Company’s European segment operates in leased office space in London, England; Paris and Avon, France; Amsterdam, the Netherlands; Frankfurt, Germany; Dubai, United Arab Emirates; Milan, Italy; and Riga, Latvia.
Office space in Tokyo, Japan; Hong Kong; Singapore; Mumbai, India; and Sydney, Australia are leased by FactSet for its Asia Pacific operating segment.
Total minimum rental payments associated with the leases are recorded as rent expense (a component of selling, general and administrative expenses) on a straight-line basis over the periods of the respective non-cancelable lease terms.
In fiscal 2015, FactSet entered into the following new lease agreements:
| | ● | _Boston, Massachusetts__:_ A new lease amendment was signed to extend and expand the Company’s existing office space in Boston by 4,809 rentable square feet. At the time of signing, the renewal resulted in incremental future minimum rental payments of $6.6 million through June 2022. |
| --- | --- | --- |
| | | |
| | ● | _Hyderabad, India__:_ \- A new lease amendment was entered into during November 2014 to renew the Company’s existing office space in Hyderabad. At the time of signing, the renewal resulted in incremental future minimum rental payments of $2.2 million over the non-cancelable lease term through November 2019. \- A new lease agreement was entered into during April 2015 for 43,830 square feet of new office space in Hyderabad. At the time of signing, the new lease agreement resulted in incremental future minimum rental payments of $1.8 million over the lease term through September 2020. |
| | ● | _Manila, Philippines__:_ A new lease agreement was entered into during April 2015 for 13,043 square feet of new office space in Manila. At the time of signing, the new lease agreement resulted in incremental future minimum rental payments of $1.5 million over the non-cancelable lease term through June 2020. |
| | ● | _New York, New York__:_ A new lease amendment was signed to extend and expand the Company’s existing office space in New York by 19,979 rentable square feet. At the time of signing, the renewal resulted in incremental future minimum rental payments of $21.2 million through August 2031. The amendment included approximately $1.9 million in tenant allowances. |
| | ● | _Norwalk, Connecticut:_ A new lease amendment was signed to extend and expand the Company’s office space at its headquarters in Norwalk by 9,587 rentable square feet. At the time of signing, the renewal resulted in incremental future minimum rental payments of $0.9 million through December 2019. |
| | ● | _London, England:_ A new lease agreement was entered into in July 2015 for 15,051 square feet of new office space in London. At the time of signing, the new lease agreement resulted in incremental future minimum rental payments of $21.1 million over the non-cancelable lease term through March 2031. |
At August 31, 2015, the Company’s lease commitments for office space provide for the following future minimum rental payments under non-cancelable operating leases with remaining terms in excess of one year (in thousands):
| Years Ended August 31, | | Minimum Lease Payments | | |
| --- | --- | --- | --- | --- |
| | | | | |
| 2016 | | $ | 22,695 | |
| 2017 | | | 28,002 | |
| 2018 | | | 27,373 | |
| 2019 | | | 25,974 | |
| 2020 | | | 20,129 | |
| Thereafter | | | 145,929 | |
| Total | | $ | 270,102 | |
Item 5. MARKET FOR REGISTRANT’S COMMON EQUITY, RELATED STOCKHOLDER MATTERS AND ISSUER PURCHASES OF EQUITY SECURITIES
27 rewritten, 14 added, 12 removed, 16 unchanged
| [removed: (a)] [added: (a)] | [removed: Market Information,] [added: Market Information,] Holders and [removed: Dividends] [added: Dividends] |
_Market Information_ [removed: _-_] [added: -] FactSet common stock is listed on the New York Stock Exchange [added: (“NYSE”)] and the NASDAQ Stock Market under the symbol FDS.
The following table sets forth, for each fiscal period indicated, the high and low sales prices per share of the Company’s common stock as reported on the [removed: New York Stock Exchange.][added: NYSE:]
| | | [removed: First] [added: First] | | | | [removed: Second] [added: Second] | | | | [removed: Third] [added: Third] | | | | [removed: Fourth] [added: Fourth] | | |
_Holders of Record_ [removed: _–_] [added: –] As of October [removed: 20, 2015,] [added: 25, 2016,] there were approximately [removed: 127,277] [added: 142,883] holders of record of FactSet common stock.
The closing price of FactSet’s common stock on October [removed: 20, 2015] [added: 25, 2016,] was [removed: $168.00] [added: $153.04] per share as reported on the [removed: New York Stock Exchange.][added: NYSE.]
[removed: _Dividends -_] [added: _Dividends_ -] In fiscal [removed: 2015,] [added: 2016,] the Company’s Board of Directors declared the following dividends:
| [removed: Declaration Date] [added: Declaration Date] | | [removed: Dividends] [added: Dividends] Per Share of Common [removed: Stock] [added: Stock] | | | [removed: Type] [added: Type] | [removed: Record Date] [added: Record Date] | | [removed: Total] [added: Total] Amount (in [removed: thousands)] [added: thousands)] | | | [removed: Payment Date] [added: Payment Date] |
| August [removed: 10, 2015] [added: 5, 2016] | | $ | [removed: 0.44] [added: 0.50] | | Regular (cash) | August 31, [removed: 2015] [added: 2016] | | $ | [removed: 18,179] [added: 20,019] | | September [removed: 15, 2015] [added: 20, 2016] |
| May [removed: 12, 2015(1)] [added: 6, 2016(1)] | | $ | [removed: 0.44] [added: 0.50] | | Regular (cash) | May [removed: 29, 2015] [added: 31, 2016] | | $ | [removed: 18,274] [added: 20,171] | | June [removed: 16, 2015] [added: 21, 2016] |
| February [removed: 11, 2015] [added: 5, 2016] | | $ | [removed: 0.39] [added: 0.44] | | Regular (cash) | February [removed: 27, 2015] [added: 29, 2016] | | $ | [removed: 16,236] [added: 18,044] | | March [removed: 17, 2015] [added: 15, 2016] |
| November [removed: 12, 2014] [added: 6, 2015] | | $ | [removed: 0.39] [added: 0.44] | | Regular (cash) | November [removed: 28, 2014] [added: 30, 2015] | | $ | [removed: 16,216] [added: 18,208] | | December [removed: 16, 2014] [added: 15, 2015] |
| [added: |] _(1)_ | _On May [removed: 12, 2015, FactSet’s Board] [added: 6, 2016,_ _FactSet’s_ _Board] of Directors approved a [removed: 12.8%] [added: 13.6%] increase in the regular quarterly [removed: dividend,] [added: dividend] beginning with the dividend payment in June [removed: 2015] [added: 2016] which was [removed: $0.44] [added: $0.50] per share, or [removed: $1.76] [added: $2.00] per share per [removed: annum._] [added: an__num._] |
Future dividend payments will depend on the Company’s earnings, capital requirements, financial condition and other factors considered relevant by [removed: FactSet] [added: FactSet,] and is subject to final determination by the Company’s Board of Directors.
| [removed: (b)] [added: (b)] | [removed: Recent] [added: Recent] Sales of Unregistered [removed: Securities] [added: Securities] |
There were no sales of unregistered equity securities in fiscal [removed: 2015.][added: 2016.]
| [removed: (c)] [added: (c)] | [removed: Issuer] [added: Issuer] Purchases of Equity [removed: Securities] [added: Securities] |
The following table provides a month-to-month summary of the share repurchase activity under the current stock repurchase program during the three months ended August 31, [removed: 2015] [added: 2016] (in thousands, except per share data):
| [removed: Period] [added: Period] | | [removed: Total] [added: Total] number of shares [removed: purchased] [added: purchased] | | | | [removed: Average] [added: Average] price paid per [removed: share] [added: share] | | | | [removed: Total] [added: Total] number of [removed: shares purchased] [added: shares purchased] as part of [removed: publicly announced] [added: publicly announced] plans or [removed: programs] [added: programs] | | | | [removed: Maximum] [added: Maximum] number of [removed: shares (or] [added: shares (or] approximate dollar value) that may yet [removed: be purchased] [added: be purchased] under the plans or [removed: programs (1)] [added: programs (1)] | | |
| _(1)_ | _Repurchases may be made from time to time in the open market and privately negotiated transactions, subject to market conditions. No minimum number of shares to be repurchased has been [removed: fixed._ _There] [added: fixed. There] is no timeframe to complete the repurchase program and it is expected that share repurchases will be paid using existing and future cash generated by operations._ |
_Securities Authorized for Issuance under Equity Compensation Plans_ _–_ Information regarding securities authorized for issuance under equity compensation plans is incorporated by reference from the Company’s Proxy Statement filed on October [removed: 30, 2015] [added: 31, 2016,] for its [removed: 2015] [added: 2016] Annual Meeting of Stockholders.
The annual changes for the five-year period shown in the graph below are based on the assumption that $100 had been invested in FactSet common stock, the Standard & Poor’s 500 Index, the NYSE Composite Index and the Dow Jones U.S. Financial Services Index on August 31, [removed: 2010,] [added: 2011,] and that all quarterly dividends were reinvested at the average of the closing stock prices at the beginning and end of the quarter.
The total cumulative dollar returns shown on the graph represent the value that such investments would have had on August 31, [removed: 2015.][added: 2016.]
[removed: 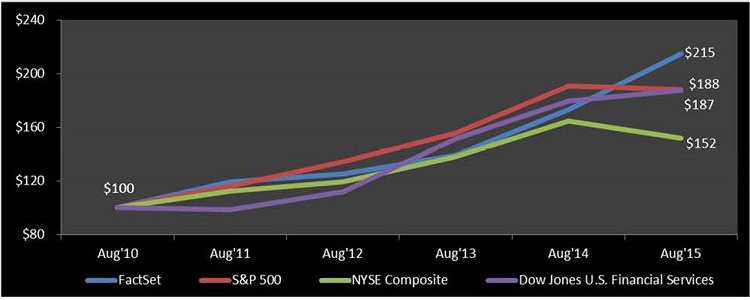][added: | 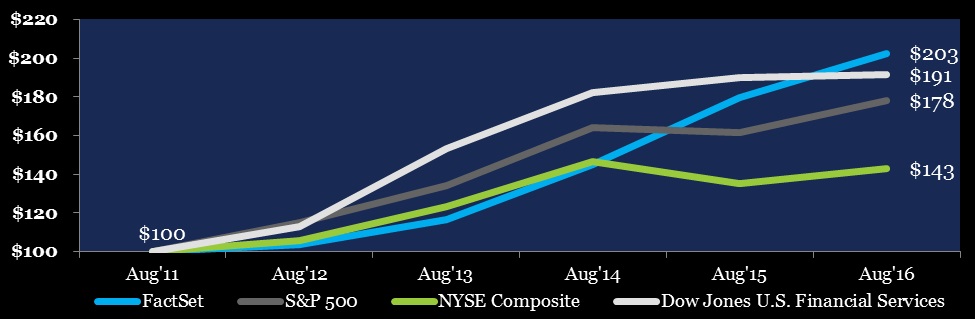 |]
| | | [removed: 2015] [added: 2016] | | | | [removed: 2014] [added: 2015] | | | | [removed: 2013] [added: 2014] | | | | [removed: 2012] [added: 2013] | | | | [removed: 2011] [added: 2012] | | | | [removed: 2010] [added: 2011] | | |
| Dow Jones U.S. Financial Services Index | | $ | [removed: 187] [added: 191] | | | $ | [removed: 180] [added: 190] | | | $ | [removed: 151] [added: 182] | | | $ | [removed: 112] [added: 153] | | | $ | [removed: 99] [added: 113] | | | $ | 100 | |
_The information contained in the above graph shall not been deemed to be soliciting material or filed or incorporated by reference in future filings with the SEC, or subject to the liabilities of Section 18 of the Securities Exchange Act of 1934, except to the extent that FactSet specifically_ _incorporates it by reference into a document filed under the Securities [removed: Act_ _of] [added: Act of] 1933 or the Securities Exchange Act of 1934._
| 2016 | | | | | | | | | | | | | | | | |
| High | | $ | 177.28 | | | $ | 173.77 | | | $ | 160.34 | | | $ | 179.73 | |
| Low | | $ | 153.00 | | | $ | 135.95 | | | $ | 143.08 | | | $ | 149.39 | |
| --- | --- | --- |
| June 2016 | | | 35,000 | | | $ | 157.43 | | | | 35,000 | | | $ | 354,205 | |
| July 2016(2) | | | 163,000 | | | $ | 164.81 | | | | 163,000 | | | $ | 207,342 | |
| August 2016 | | | 60,000 | | | $ | 173.09 | | | | 60,000 | | | $ | 196,956 | |
| | | | 258,000 | | | | | | | | 258,000 | | | | | |
| _(2)_ | _In addition to purchases made under the Company’s existing repurchase program, on July 1, 2016 FactSet entered into an accelerated share repurchase agreement (the “ASR Agreement”) to repurchase $120.0 million of FactSet’s common stock. The Company received 595,607 shares of its common stock on that date which was approximately 80% of the total number of shares of common stock expected to be repurchased under the ASR Agreement. The final settlement of the ASR Agreement occur__red_ _in the first quarter of fiscal 2017_ _with FactSet receiving an additional 102,916 shares of its common stock._ |
| --- |
| | | | | | | | | | | | | | | | | | | | | | | | | |
| FactSet Research Systems Inc. | | $ | 203 | | | $ | 180 | | | $ | 145 | | | $ | 116 | | | $ | 104 | | | $ | 100 | |
| S&P 500 Index | | $ | 178 | | | $ | 162 | | | $ | 164 | | | $ | 134 | | | $ | 115 | | | $ | 100 | |
| NYSE Composite Index | | $ | 143 | | | $ | 135 | | | $ | 147 | | | $ | 123 | | | $ | 106 | | | $ | 100 | |
| | | | | | | | | | | | | | | | | |
| 2014 | | | | | | | | | | | | | | | | |
| High | | $ | 115.39 | | | $ | 119.08 | | | $ | 114.82 | | | $ | 129.28 | |
| Low | | $ | 101.07 | | | $ | 101.41 | | | $ | 102.31 | | | $ | 107.02 | |
| June 2015 | | | 157,811 | | | $ | 164.02 | | | | 157,811 | | | $ | 186,222 | |
| July 2015 | | | 271,572 | | | $ | 162.55 | | | | 271,572 | | | $ | 142,678 | |
| August 2015 | | | 50,000 | | | $ | 168.76 | | | | 50,000 | | | $ | 134,240 | |
| | | | 479,383 | | | $ | 163.68 | | | | 479,383 | | | | | |
| | | For the Years Ended August 31, | | | | | | | | | | | | | | | | | | | | | | |
| FactSet Research Systems Inc. | | $ | 215 | | | $ | 173 | | | $ | 139 | | | $ | 125 | | | $ | 120 | | | $ | 100 | |
| S&P 500 Index | | $ | 188 | | | $ | 191 | | | $ | 156 | | | $ | 134 | | | $ | 116 | | | $ | 100 | |
| NYSE Composite Index | | $ | 152 | | | $ | 165 | | | $ | 138 | | | $ | 120 | | | $ | 112 | | | $ | 100 | |
Item 6. SELECTED FINANCIAL DATA
24 rewritten, 7 added, 5 removed, 10 unchanged
This financial data should be read in conjunction with Item 7, [removed: _Management’s] [added: Management’s] Discussion and Analysis of Financial Condition and Results of [removed: Operations_] [added: Operations] and Item 8, [removed: _Financial] [added: Financial] Statements and Supplementary [removed: Data_,] [added: Data,] of this Annual Report on Form 10-K.
[removed: Consolidated] [added: Consolidated] Statements of Income [removed: Data][added: Data]
| [added: _(in thousands)_] | | [added: 2016 | | | |] 2015 | | | | 2014 | | [removed: 2013] | | [removed: |] [added: 2013] | [removed: 2012] | | [removed: 2011] | [added: 2012] | | |
| Revenues | | $ | [added: 1,127,092 | | | $ |] 1,006,768 | | | $ | 920,335 | [added: | |] $ | 858,112 | | | $ | 805,793 | [removed: $] | [removed: 726,510 | | |]
| Operating income | | [added: $] | [removed: 331,918] [added: 349,676] | (1) | | [added: $] | [removed: 302,219] [added: 331,918] | [added: (4)] | [removed: 269,419] | [removed: (4)] [added: $] | [added: 302,219] | | [removed: 272,990] | [added: $] | [removed: 238,335] [added: 269,419] | (7) | | [added: $ | 272,990 | |]
| Provision for income taxes | | [added: $] | [added: 122,178 | | | $ |] 92,703 | | | [added: $] | 91,921 | | [removed: 72,273] | [removed: |] [added: $] | [added: 72,273] | [removed: 85,896] | | [removed: 67,912] [added: $] | [added: 85,896] | |
| Net income | | [added: $] | [removed: 241,051] [added: 338,815] | (2) | | [added: $] | [removed: 211,543] [added: 241,051] | [added: (5)] | [removed: 198,637] | [removed: (5)] [added: $] | [added: 211,543] | | [removed: 188,809] | [added: $] | [removed: 171,046] [added: 198,637] | (8) | | [added: $ | 188,809 | |]
| Diluted earnings per common share | | $ | [removed: 5.71] [added: 8.19] | (3) | | $ | [removed: 4.92 | $ | 4.45] [added: 5.71] | (6) | | $ | [removed: 4.12] [added: 4.92] | [added: | |] $ | [removed: 3.61] [added: 4.45] | (9) | | [added: $ | 4.12 | |]
| Weighted average common shares (diluted) | | | [added: 41,365 | | | |] 42,235 | | | | 42,970 | | [removed: 44,624] | | [removed: |] [added: 44,624] | [removed: 45,810] | | [removed: 47,355] | [added: 45,810] | |
| Cash dividends declared per common share | | $ | [added: 1.88 | | | $ |] 1.66 | | | $ | 1.48 | [added: | |] $ | 1.32 | | | $ | 1.16 | [removed: $] | [removed: 1.00 | | |]
[removed: | Consolidated] [added: Consolidated] Balance Sheet [removed: Data | | | | | | | | | | | | | | | | | |][added: Data]
| [removed: (in thousands)] | | [added: As of] August 31, | | | | | | | | | | | | | | | | [added: | | |]
| Cash and cash equivalents | | $ | [added: 228,407 | | | $ |] 158,914 | | | $ | 116,378 | [added: | |] $ | 196,627 | | | $ | 189,044 | [removed: $] | [removed: 181,685 | | |]
| Accounts receivable, net of reserves | | [added: $] | [added: 97,797 | | | $ |] 95,064 | | | [added: $] | 90,354 | | [removed: 73,290] | [removed: |] [added: $] | [added: 73,290] | [removed: 74,251] | | [removed: 75,004] [added: $] | [added: 74,251] | |
| Goodwill and intangible assets, net | | [added: $] | [added: 546,076 | | | $ |] 348,339 | | | [added: $] | 327,463 | | [removed: 280,796] | [removed: |] [added: $] | [added: 280,796] | [removed: 289,162] | | [removed: 274,575] [added: $] | [added: 289,162] | |
| Total assets | | [added: $] | [added: 1,019,161 | | | $ |] 736,671 | | | [added: $] | 663,212 | | [removed: 690,197] | [removed: |] [added: $] | [added: 690,197] | [removed: 694,143] | | [removed: 657,440] [added: $] | [added: 694,143] | |
| Non-current liabilities | | [added: $] | [added: 343,570 | | | $ |] 65,307 | | | [added: $] | 24,839 | | [removed: 30,165] | [removed: |] [added: $] | [added: 30,165] | [removed: 28,703] | | [removed: 32,829] [added: $] | [added: 28,703] | |
| Total stockholders’ equity | | $ | [added: 517,381 | | | $ |] 531,584 | | | $ | 511,082 | [added: | |] $ | 541,779 | | | $ | 552,264 | [removed: $] | [removed: 515,188 | | |]
| [removed: (1)] [added: (4)] | Operating income in fiscal 2015 includes [removed: a] pre-tax charges of $3.0 million related to the vesting of performance-based equity instruments and $3.2 million primarily from changes in the senior leadership responsible for the Company’s salesforce. |
| [removed: (2)] [added: (5)] | Fiscal 2015 net income includes $2.1 million (after-tax) of incremental expenses related to the vesting of performance-based equity instruments, $2.2 million (after-tax) related to the changes in the senior leadership responsible for the Company’s salesforce and income tax benefits of $8.8 million primarily from the reenactment of the U.S. Federal R&D Tax Credit in December 2014, finalizing prior year tax returns and other discrete items. |
| [removed: (3)] [added: (6)] | Diluted EPS for fiscal 2015 includes the net effect of a $0.21 increase in diluted EPS from the [removed: reenactment of the U.S. Federal R&D tax credit, finalizing prior year] [added: income] tax [removed: returns and other discrete items] [added: benefits] partially offset by a $0.05 decrease from the vesting of performance-based equity instruments and a $0.05 decrease from the changes in the senior leadership responsible for the Company’s salesforce. |
| [removed: (4)] [added: (7)] | Operating income for fiscal 2013 includes pre-tax charges totaling $18.3 million related to the vesting of performance-based stock options granted in connection with the acquisitions of Market Metrics and StreetAccount. |
| [removed: (5)] [added: (8)] | Fiscal 2013 net income includes $12.9 million (after-tax) of incremental expenses related to the vesting of performance-based stock options granted in connection with the acquisitions of Market Metrics and StreetAccount and income tax benefits of $7.2 million primarily from the reenactment of the U.S. Federal R&D [removed: tax credit] [added: Tax Credit] in January [removed: 2013] [added: 2013,] and finalizing prior year tax returns. |
| [removed: (6)] [added: (9)] | Diluted EPS for fiscal 2013 includes the net effect of a $0.29 decrease [removed: for] [added: from] the vesting of performance-based [removed: options] [added: options,] partially offset by a $0.16 increase in diluted EPS from the [removed: reenactment of the U.S. Federal R&D tax credit and finalizing prior year] [added: income] tax [removed: returns.] [added: benefits.] |
| | | For the year ended August 31, | | | | | | | | | | | | | | | | | | |
| --- | --- | --- | --- | --- | --- | --- | --- | --- | --- | --- | --- | --- | --- | --- | --- | --- | --- | --- | --- | --- |
| _(in thousands, except per share data)_ | | 2016 | | | | 2015 | | | | 2014 | | | | 2013 | | | | 2012 | | |
| --- | --- | --- | --- | --- | --- | --- | --- | --- | --- | --- | --- | --- | --- | --- | --- | --- | --- | --- | --- | --- |
| (1) | Operating income in fiscal 2016 includes pre-tax charges of $4.6 million related primarily to legal matters, $2.8 million from restructuring actions initiated by the Company and $1.8 million related to a change in the vesting of performance-based equity options. |
| (2) | Fiscal 2016 net income includes $3.3 million (after-tax) of non-recurring items related primarily to legal matters, $2.0 million (after-tax) from restructuring actions initiated by the Company, $1.2 million (after-tax) related to a change in the vesting of performance-based equity instruments, income tax benefits of $10.5 million primarily from the permanent reenactment of the U.S. Federal R&D Tax Credit, finalizing prior year tax returns and other discrete items and a gain of $81.7 million (after-tax) related to the sale of FactSet’s Market Metrics business in July 2016. |
| (3) | Diluted EPS for fiscal 2016 includes the net effect of a $2.01 increase in diluted EPS from the gain on sale and a $0.25 increase in diluted EPS from the income tax benefits, partially offset by a $0.08 decrease from the non-recurring items related primarily to legal matters, a $0.05 decrease from the restructuring actions and a $0.03 decrease from a change in the vesting of performance-based equity instruments. |
| (in thousands, except per share data) | | Years Ended August 31, | | | | | | | | | | | | | | | |
| --- | --- | --- | --- | --- | --- | --- | --- | --- | --- | --- | --- | --- | --- | --- | --- | --- | --- |
| (7) | Fiscal 2011 operating income includes a pre-tax charge of $7.9 million related to an increase in the estimated number of performance-based stock options that will vest. The revised estimate reflects a higher performance level than previously estimated and accordingly, increased the number of performance-based options that will vest and be expensed. |
| (8) | Net income for fiscal 2011 includes $5.4 million (after-tax) of incremental expenses related to an increase in the estimated number of performance-based stock options that will vest and income tax benefits of $6.3 million primarily from finalizing prior year tax returns and the reenactment of the U.S. Federal R&D tax credit in December 2010. |
| (9) | Included in fiscal 2011 diluted EPS were income tax benefits of $0.13 from finalizing prior year tax returns and the reenactment of the U.S. Federal R&D tax credit partially offset by an $0.11 decrease related to an increase in the estimated number of performance-based stock options that will vest and be expensed. |
Item 8. FINANCIAL STATEMENTS AND SUPPLEMENTARY DATA
670 rewritten, 300 added, 204 removed, 609 unchanged
[removed: Index] [added: Index] to Consolidated Financial [removed: Statements][added: Statements]
| [removed: _Consolidated] [added: Consolidated] Financial [removed: Statements:_ |] [added: Statements:] | [added: Page] |
| Management’s Statement of Responsibility for Financial Statements | [removed: | 45] [added: 43] |
| Management’s Report on Internal Control over Financial Reporting | [removed: | 45] [added: 43] |
| Reports of Independent Registered Public Accounting Firms | [removed: | 46-48] [added: 44-45] |
| Consolidated Statements of Income for the years ended August 31, [removed: 2015, 2014] [added: 2016, 2015] and [removed: 2013 |] [added: 2014] | [removed: 49] [added: 46] |
| Consolidated Statements of Comprehensive Income for the years ended August 31, [removed: 2015, 2014] [added: 2016, 2015] and [removed: 2013 |] [added: 2014] | [removed: 50] [added: 47] |
| Consolidated Balance Sheets at August 31, [removed: 2015] [added: 2016] and [removed: 2014 |] [added: 2015] | [removed: 51] [added: 48] |
| Consolidated Statements of Cash Flows for the years ended August 31, [removed: 2015, 2014] [added: 2016, 2015] and [removed: 2013 |] [added: 2014] | [removed: 52] [added: 49] |
| Consolidated Statements of Changes in Stockholders’ Equity for the years ended August 31, [removed: 2015, 2014] [added: 2016, 2015] and [removed: 2013 |] [added: 2014] | [removed: 53] [added: 50] |
| Notes to the Consolidated Financial Statements | [removed: | 54] [added: 51] |
| [removed: _Financial] [added: Financial] Statement [removed: Schedule:_ |] [added: Schedule:] | |
| Schedule II – Valuation and Qualifying Accounts | [removed: | 87] [added: 84] |
[removed: Management’s] [added: Management’s] Statement of Responsibility for Financial [removed: Statements][added: Statements]
In compliance with the Sarbanes-Oxley Act of 2002, FactSet assessed its internal control over financial reporting as of August 31, [removed: 2015] [added: 2016,] and issued a report (see below).
The independent registered public accounting firm has full and free access to the Audit Committee and [added: has] met with the committee, with and without management present.
[removed: Management’s Report on] [added: Management’s Report on] Internal [removed: Control over] [added: Control over] Financial [removed: Reporting][added: Reporting]
Management (with the participation of the principal executive officer and principal financial officer) conducted an evaluation of the effectiveness of FactSet’s internal control over financial reporting based on the framework in [removed: _Internal] [added: Internal] Control—Integrated [removed: Framework_] [added: Framework] (2013) issued by the Committee of Sponsoring Organizations of the Treadway [removed: Commission.][added: Commission except for the internal controls of Portware LLC which constituted 2.1% of net assets as of August 31, 2016 and 3.4% of revenues for the year then ended .]
Based on this evaluation, management concluded that FactSet’s internal control over financial reporting was effective as of August 31, [removed: 2015.][added: 2016.]
Ernst & Young LLP, an independent registered public accounting firm, has audited the effectiveness of FactSet’s internal control over financial reporting and has issued a report on FactSet’s internal control over financial reporting, which is included in their report on page [removed: 47.][added: 46.]
[removed: Report] [added: Report] of Independent Registered Public Accounting [removed: Firm][added: Firm]
[removed: The Board of Directors and Stockholders of] FactSet Research Systems Inc.
We have audited the accompanying consolidated balance sheets of FactSet Research Systems Inc. as of August 31, [removed: 2015] [added: 2016] and [removed: 2014,] [added: 2015,] and the related consolidated statements of income, comprehensive income, stockholders' equity and cash flows for each of the [removed: two] [added: three] years in the period ended August 31, [removed: 2015.][added: 2016.]
In our opinion, the financial statements referred to above present fairly, in all material respects, the consolidated financial position of FactSet Research Systems Inc. at August 31, [removed: 2015] [added: 2016] and [removed: 2014,] [added: 2015,] and the consolidated results of its operations and its cash flows for each of the [removed: two] [added: three] years in the period ended August 31, [removed: 2015,] [added: 2016,] in conformity with U.S. generally accepted accounting principles.
We also have audited, in accordance with the standards of the Public Company Accounting Oversight Board (United States), FactSet Research Systems Inc.'s internal control over financial reporting as of August 31, [removed: 2015,] [added: 2016,] based on criteria established in Internal Control-Integrated Framework issued by the Committee of Sponsoring Organizations of the Treadway Commission (2013 framework), and our report dated October [removed: 30, 2015] [added: 31, 2016] expressed an unqualified opinion thereon.
We have audited FactSet Research Systems Inc.’s internal control over financial reporting as of August 31, [removed: 2015,] [added: 2016,] based on criteria established in Internal Control—Integrated Framework issued by the Committee of Sponsoring Organizations of the Treadway Commission (2013 framework) (the COSO criteria).
In our opinion, FactSet Research Systems Inc. maintained, in all material respects, effective internal control over financial reporting as of August 31, [removed: 2015,] [added: 2016,] based on the COSO criteria.
[removed: Report] [added: Report] of [removed: Independent Registered Public] [added: Independent Registered Public] Accounting [removed: Firm][added: Firm]
[removed: (In] [added: | _(In] thousands, except per share [removed: data)][added: data)_ | | 2016 | | | | 2015 | | | | 2014 | | |]
| [added: | |] Years [removed: Ended] [added: ended] August 31, | | [removed: 2015] | | | | [removed: 2014] | | | | [removed: 2013] | [removed: | |]
| Revenues | | $ | [removed: 1,006,768] [added: 1,127,092] | | | $ | [removed: 920,335] [added: 1,006,768] | | | $ | [removed: 858,112] [added: 920,335] | |
| Cost of services | | | [removed: 405,339] [added: 487,409] | | | | [removed: 353,686] [added: 405,339] | | | | [removed: 306,379] [added: 353,686] | |
| Selling, general and administrative | | | [removed: 269,511] [added: 290,007] | | | | [removed: 264,430] [added: 269,511] | | | | [removed: 282,314] [added: 264,430] | |
| Total operating expenses | | | [removed: 674,850] [added: 777,416] | | | | [removed: 618,116] [added: 674,850] | | | | [removed: 588,693] [added: 618,116] | |
| Operating income | | | [removed: 331,918] [added: 349,676] | | | | [removed: 302,219] [added: 331,918] | | | | [removed: 269,419] [added: 302,219] | |
| [removed: Other] [added: Total other] income | | | [removed: 1,836] [added: 111,317] | | | | [removed: 1,245] [added: 1,836] | | | | [removed: 1,491] [added: 1,245] | |
| Income before income taxes | | | [removed: 333,754] [added: 460,993] | | | | [removed: 303,464] [added: 333,754] | | | | [removed: 270,910] [added: 303,464] | |
| Provision for income taxes | | | [removed: 92,703] [added: 122,178] | | | | [removed: 91,921] [added: 92,703] | | | | [removed: 72,273] [added: 91,921] | |
| Net income | | $ | [removed: 241,051] [added: 338,815] | | | $ | [removed: 211,543] [added: 241,051] | | | $ | [removed: 198,637] [added: 211,543] | |
| Basic earnings per common share | | $ | [removed: 5.80] [added: 8.29] | | | $ | [removed: 4.98] [added: 5.80] | | | $ | [removed: 4.53] [added: 4.98] | |
| | |
| | |
| | |
| October 31, 2016 | October 31, 2016 |
October 31, 2016
As indicated in the accompanying Management’s Report on Internal Control over Financial Reporting, management’s assessment of and conclusion on the effectiveness of internal control over financial reporting did not include the internal controls of Portware, LLC, which is included in the 2016 consolidated financial statements of FactSet Research Systems Inc. and constituted 2.1% of net assets as of August 31, 2016 and 3.4% of revenues for the year then ended.
Our audit of internal control over financial reporting of FactSet Research Systems Inc. also did not include an evaluation of the internal control over financial reporting of Portware, LLC.
October 31, 2016
| Other income (expense) | | | | | | | | | | | | |
| Gain on sale of business | | | 112,453 | | | | — | | | | — | |
| Interest (expense), net of interest income | | | (1,136 | ) | | | 1,836 | | | | 1,245 | |
FactSet Research Systems Inc.
FactSet Research Systems Inc.
| | | August 31, | | | | | | |
| Cash and cash equivalents | | $ | 228,407 | | | $ | 158,914 | |
FactSet Research Systems Inc.
| | | Years ended August 31, | | | | | | | | | | |
| Net income | | $ | 338,815 | | | $ | 241,051 | | | $ | 211,543 | |
| Gain on sale of business | | | (112,453 | ) | | | — | | | | — | |
| Proceeds from sale of business, net | | | 153,137 | | | | — | | | | — | |
FactSet Research Systems Inc.
| | | Years ended August 31, | | | | | | | | | | |
| _(In thousands)_ | | 2016 | | | | 2015 | | | | 2014 | | |
| Stock-based compensation expense | | | 29,793 | | | | 26,371 | | | | 22,891 | |
| Tax benefits from share-based payment arrangements | | | 18,205 | | | | 28,948 | | | | 11,955 | |
| Accelerated share repurchase | | | (24,000 | ) | | | — | | | | — | |
| Stock-based compensation adjustment associated with disposition | | | (942 | ) | | | — | | | | — | |
| Net income | | | 338,815 | | | | 241,051 | | | | 211,543 | |
| Net income | | | 338,815 | | | | 241,051 | | | | 211,543 | |
| Purchases of common stock upon restricted stock vesting | | | (4,544 | ) | | | (3,141 | ) | | | (4,414 | ) |
| Stock-based compensation expense | | | 29,793 | | | | 26,371 | | | | 22,891 | |
| Tax benefits from share-based payment arrangements | | | 18,205 | | | | 28,948 | | | | 11,955 | |
| Repurchases of common stock | | | (352,283 | ) | | | (253,076 | ) | | | (275,415 | ) |
| Foreign currency translation adjustments | | | (23,644 | ) | | | (25,263 | ) | | | 7,895 | |
| Stock-based compensation adjustment associated with disposition | | | (942 | ) | | | — | | | | — | |
| Net unrealized (loss) gain on cash flow hedges, net of tax | | | (857 | ) | | | (868 | ) | | | 5,357 | |
| Dividends | | | (76,539 | ) | | | (68,904 | ) | | | (62,558 | ) |
1.
FactSet delivers insight and information to investment professionals through its analytics, service, content, and technology.
By integrating comprehensive datasets and analytics across asset classes with client data, FactSet supports the workflow of both buy-side and sell-side clients.
| | | Page |
| | | |
| October 30, 2015 | October 30, 2015 |
Those standards require that we plan and perform the audit to obtain reasonable assurance about whether the financial statements are free of material misstatement.
Stamford, Connecticut
October 30, 2015
We believe that our audit provides a reasonable basis for our opinion.
We also have audited, in accordance with the standards of the Public Company Accounting Oversight Board (United States), the consolidated balance sheets of FactSet Research Systems Inc. as of August 31, 2015 and 2014, and the related consolidated statements of income, comprehensive income, stockholders’ equity and cash flows for each of the two years in the period ended August 31, 2015 of FactSet Research Systems Inc. and our report dated October 30, 2015 expressed an unqualified opinion thereon.
In our opinion, the consolidated statements of income and comprehensive income, of shareholders’ equity and of cash flows for the year ended August 31, 2013 present fairly, in all material respects, the results of operations and cash flows of FactSet Research Systems Inc. and its subsidiaries (the “Company”) for the year ended August 31, 2013, in conformity with accounting principles generally accepted in the United States of America.
In addition, in our opinion, the financial statement schedule for the year ended August 31, 2013 presents fairly, in all material respects, the information set forth therein when read in conjunction with the related consolidated financial statements.
These financial statements and financial statement schedule are the responsibility of the Company's management.
Our responsibility is to express an opinion on these financial statements and financial statement schedule based on our audit.
We conducted our audit of these statements in accordance with the standards of the Public Company Accounting Oversight Board (United States).
An audit includes examining, on a test basis, evidence supporting the amounts and disclosures in the financial statements, assessing the accounting principles used and significant estimates made by management, and evaluating the overall financial statement presentation.
/s/ PRICEWATERHOUSECOOPERS LLP
October 30, 2013
| | | | | | | | | | | | | |
| --- | --- | --- | --- | --- | --- | --- | --- | --- |
| CURRENT ASSETS | | | | | | | | |
| NON-CURRENT LIABILITIES | | | | | | | | |
| Cash and cash equivalents at beginning of year | | | 116,378 | | | | 196,627 | | | | 189,044 | |
1.
FactSet combines content regarding companies and securities from major markets all over the globe into a single online platform of information and analytics.
By consolidating content from hundreds of databases with powerful analytics, FactSet supports the investment process from initial research to published results for buy and sell-side professionals.
The Company’s applications provide users access to company and industry analyses, multicompany comparisons, company screening, portfolio analysis, predictive risk measurements, alphatesting, portfolio optimization and simulation, real-time news and quotes and tools to value and analyze fixed income securities and portfolios.
With Microsoft® Office integration, wireless access and customizable options, FactSet offers a complete financial workflow solution.
Goodwill has resulted from the acquisitions of the Insyte, LionShares, Mergerstat, CallStreet, JCF, TrueCourse, Derivative Solutions, AlphaMetrics, Global Filings, DealMaven, Thomson Fundamentals, Market Metrics, StreetAccount, Revere, Matrix, ETF.com and Code Red businesses.
Goodwill resulting from the acquisitions of LionShares, Mergerstat, TrueCourse, Derivative Solutions, Market Metrics, StreetAccount, Revere and Matrix are income tax-deductible based on the structure of the acquisition.
In February 2013, the FASB issued an accounting standard update to require reclassification adjustments from other comprehensive income to be presented either in the financial statements or in the notes to the financial statements.
_Cumulative Translation Adjustments_
In March 2013, the FASB issued an accounting standard update requiring an entity to release into net income the entire amount of a cumulative translation adjustment related to its investment in a foreign entity when as a parent it either sells a part or all of its investment in a foreign entity or no longer holds a controlling financial interest in a subsidiary or group of assets within a foreign entity.
In applying the revenue model to contracts within its scope, an entity will identify the contract with a client, identify the performance obligations in the contract, determine the transaction price, allocate the transaction price to the performance obligations in the contract and recognize revenue when (or as) the entity satisfies a performance obligation.
If the arrangement does not contain a software license, the customer would account for the arrangement as a service contract.
4.
| | | Fair Value Measurements at Reporting Date Using | | | | | | | | | | | | | | |
FactSet did not have any long-term debt as of August 31, 2014.
| | ● | _Euro -_ foreign currency forward contracts to hedge approximately 50% of its Euro exposure through the fourth quarter of fiscal 2016. |
| Philippine Peso | | | — | | | | 6,500 | | | | — | | | | 115 | |
4.0 billion.
The gross notional value of foreign exchange contracts to purchase British Pound Sterling with U.S. dollars was £10.5 million.
An excerpt. Shown here: 40 of 670 rewritten, 40 of 300 added and 40 of 204 removed. The counts are complete. For every sentence, read Item 8. FINANCIAL STATEMENTS AND SUPPLEMENTARY DATA in the FY2016 filing and the FY2015 filing.
Item 9A. CONTROLS AND PROCEDURES
7 rewritten, 7 added, 0 removed, 6 unchanged
[removed: Evaluation] [added: Evaluation] of Disclosure Controls and [removed: Procedures][added: Procedures]
[removed: Changes] [added: Changes] in Internal Control over Financial [removed: Reporting][added: Reporting]
There have been no changes in the Company’s internal control over financial reporting (as such term is defined in Rules 13a-15(f) and 15d-15(f) under the Exchange Act) during the fourth quarter of fiscal [removed: 2015] [added: 2016] that have materially affected, or are reasonably likely to materially affect, the Company’s internal control over financial reporting.
[removed: Management’s] [added: Management’s] Report on Internal Control over Financial [removed: Reporting][added: Reporting]
[removed: Report] [added: Report] of Independent Registered Public Accounting [removed: Firm][added: Firm]
[removed: ITEM] [added: ITEM] 9B.
OTHER [removed: INFORMATION][added: INFORMATION]
In October 2015, FactSet acquired Portware, LLC (“Portware”).
Refer to Note 8, _Business Combinations_, in the Notes to the Consolidated Financial Statements for further discussion of the acquisition.
The Company is currently in the process of integrating the internal controls and procedures of Portware into its internal controls over financial reporting.
As provided under the Sarbanes-Oxley Act of 2002 and the applicable rules and regulations of the Securities and Exchange Commission, FactSet will include the internal controls and procedures of Portware in its annual assessment of the effectiveness of its internal control over financial reporting for the 2017 fiscal year.
Management assessed the effectiveness of the Company’s internal control over financial reporting as of August 31, 2016, except for the internal controls of Portware which constituted 2.1% of net assets and 3.4% of revenues as included in FactSet’s Consolidated Financial Statements for the year ended August 31, 2016.
In making this assessment, management used the criteria set forth by the Committee of Sponsoring Organizations of the Treadway Commission (COSO) in Internal Control—Integrated Framework.
Based on this assessment and those criteria, management believes that the Company maintained effective internal control over financial reporting as of August 31, 2016.
Item 10. DIRECTORS, EXECUTIVE OFFICERS AND CORPORATE GOVERNANCE
6 rewritten, 0 added, 0 removed, 0 unchanged
The information required by this item relating to [removed: our] [added: FactSet’s] directors and nominees, regarding compliance with Section 16(a) of the Securities Act of 1934, and regarding [removed: our] [added: its] Audit Committee is included under the captions “Corporate Governance” and “Security Ownership of Certain Beneficial Owners and Management” and contained in the definitive Proxy Statement dated October [removed: 30, 2015,] [added: 31, 2016,] all of which information is incorporated herein by reference.
Pursuant to General Instruction G(3) of Form 10-K, the information required by this item relating to [removed: our] [added: FactSet’s] executive officers is included under the caption “Executive Officers” of the Company’s definitive Proxy Statement dated October [removed: 30, 2015,] [added: 31, 2016,] all of which information is incorporated herein by reference.
[removed: We have] [added: The Company has] adopted a code of ethics that applies to [removed: our] [added: its] principal executive officer and all members of [removed: our] [added: its] finance department, including the principal financial officer and principal accounting officer.
This code of ethics, which consists of the “Code of Ethical Conduct for Financial Managers,” is posted on [removed: our] [added: FactSet’s] website, along with the charters of committees of [removed: our] [added: its] Board of Directors.
The Internet address for [removed: our] [added: the Company’s] Website is www.factset.com, and the code of ethics may be found in the “Investor Relations” section under “Corporate Governance.” All employees, officers and directors are also subject to [removed: our] [added: FactSet’s] “Code of Business Conduct and Ethics,” also posted on the “Corporate Governance” page of [removed: our] [added: the] website and the same information is available in print free of charge to any stockholder who submits a written request to the Company’s Investor Relations department at its corporate headquarters at 601 Merritt 7, Norwalk, Connecticut 06851.
[removed: We intend] [added: The Company intends] to satisfy any disclosure requirement under Item 5.05 of Form 8-K regarding an amendment to, or waiver from, a provision of this code of ethics by posting such information on [removed: our] [added: its] website, at the address and general location specified above.
Item 11. EXECUTIVE COMPENSATION
1 rewritten, 0 added, 0 removed, 0 unchanged
The information required by this item relating to [removed: our] [added: FactSet’s] executive compensation is included under the caption “Executive Compensation” contained in the definitive Proxy Statement dated October [removed: 30, 2015,] [added: 31, 2016,] all of which information is incorporated herein by reference.
Item 12. SECURITY OWNERSHIP OF CERTAIN BENEFICIAL OWNERS AND MANAGEMENT AND RELATED STOCKHOLDER MATTERS
1 rewritten, 0 added, 0 removed, 0 unchanged
The information required by this item relating to security ownership of certain beneficial owners and management is included under the caption “Security Ownership of Certain Beneficial Owners and Management” and the information required by this item relating to securities authorized for issuance under equity compensation plans is included under the caption “Equity Compensation Plan Information,” in the definitive Proxy Statement dated October [removed: 30, 2015,] [added: 31, 2016,] all of which information is incorporated herein by reference.
Item 13. CERTAIN RELATIONSHIPS AND RELATED TRANSACTIONS, AND DIRECTOR INDEPENDENCE
1 rewritten, 0 added, 0 removed, 0 unchanged
The information required by this item relating to review, approval or ratification of transactions with related persons is included under the caption “Certain Relationships and Related Transactions” and the information required by this item relating to director independence is included under the caption “Corporate Governance” contained in the definitive Proxy Statement dated October [removed: 30, 2015,] [added: 31, 2016,] all of which information is incorporated herein by reference.
Item 14. PRINCIPAL ACCOUNTING FEES AND SERVICES
1 rewritten, 0 added, 0 removed, 1 unchanged
The information required by this item is included under the caption “Proposal 2: Ratification of Independent Registered Public Accounting Firm” in the definitive Proxy Statement dated October [removed: 30, 2015,] [added: 31, 2016,] all of which information is incorporated herein by reference.
Item 15. EXHIBITS, FINANCIAL STATEMENT SCHEDULES
16 rewritten, 7 added, 15 removed, 75 unchanged
[removed: Schedule] [added: Schedule] II – Valuation and Qualifying [removed: Accounts][added: Accounts]
Years [removed: Ended] [added: ended] August 31, [removed: 2015, 2014,] [added: 2016, 2015] and [removed: 2013] [added: 2014] (in thousands):
| 2015 | | $ | 1,662 | | | $ | [removed: 2.268] [added: 2,268] | | | $ | 2,350 | | | $ | 1,580 | |
| 10.7 | | The FactSet Research Systems Inc. 2008 Employee Stock Purchase Plan, as Amended and Restated [removed: (9)] [added: (10)] |
| [removed: 23.1] [added: 23] | | Consent of Ernst & Young LLP |
| [removed: _(9)_] [added: _(10)_] | _Incorporated by reference to the Company’s Registration Statement on Form S-8 (File No. 333-201498)._ |
| Date: October [removed: 30, 2015] [added: 31, 2016] | /s/ F. PHILIP SNOW |
| [removed: /S/] [added: /s/] F. PHILIP SNOW [added: F. Philip Snow] | | Chief Executive Officer and Director [added: (Principal Executive Officer)] | October [removed: 30, 2015] [added: 31, 2016] | |
| /s/ MAURIZIO NICOLELLI [added: Maurizio Nicolelli] | | Senior Vice President, Chief Financial Officer [added: (Principal Financial Officer)] | October [removed: 30, 2015] [added: 31, 2016] | |
| /s/ MATTHEW J. MCNULTY [added: Matthew J. McNulty] | | Vice President, Controller [added: (Principal Accounting Officer)] | October [removed: 30, 2015] [added: 31, 2016] | |
| [removed: /S/] [added: /s/] PHILLIP A. HADLEY [added: Philip A. Hadley] | | Chairman | October [removed: 30, 2015] [added: 31, 2016] | |
| [removed: /S/] [added: /s/] JAMES J. MCGONIGLE [added: James J. McGonigle] | | Lead Independent Director | October [removed: 30, 2015] [added: 31, 2016] | |
| [removed: /S/] [added: /s/] ROBIN A. ABRAMS [added: Robin A. Abrams] | | Director | October [removed: 30, 2015] [added: 31, 2016] | |
| [removed: /S/] [added: /s/] SCOTT A. BILLEADEAU [added: Scott A. Billeadeau] | | Director | October [removed: 30, 2015] [added: 31, 2016] | |
| [removed: /S/] [added: /s/] JOSEPH E. LAIRD, JR. [added: Joseph E. Laird, Jr.] | | Director | October [removed: 30, 2015] [added: 31, 2016] | |
| /s/ JOSEPH R. ZIMMEL [added: Joseph R. Zimmel] | | Director | October [removed: 30, 2015] [added: 31, 2016] | |
| 2016 | | $ | 1,580 | | | $ | 1,917 | | | $ | 1,976 | | | $ | 1,521 | |
| _(9)_ | _Incorporated by reference to the Company’s Registration Statement on Form S-8 (File No. 333-156649)._ |
| | |
| | |
| /s/ MALCOLM FRANK Malcolm Frank | | Director | October 31, 2016 | |
| /s/ SHEILA B. JORDAN Sheila B. Jordan | | Director | October 31, 2016 | |
| /s/ LAURIE SIEGEL Laurie Siegel | | Director | October 31, 2016 | |
| 2013 | | $ | 1,830 | | | $ | 1,580 | | | $ | 1,766 | | | $ | 1,644 | |
| 10.1 | | Severance Agreement dated September 20, 1999 between FactSet Research Systems Inc. and Peter G. Walsh |
| 23.2 | | Consent of PricewaterhouseCoopers LLP |
| | | |
| F. Philip Snow | | (Principal Executive Officer) | | |
| Maurizio Nicolelli | | (Principal Financial Officer) | | |
| Matthew J. McNulty | | (Principal Accounting Officer) | | |
| Philip A. Hadley | | | | |
| James J. McGonigle | | | | |
| Robin A. Abrams | | | | |
| Scott A. Billeadeau | | | | |
| Joseph E. Laird, Jr. | | | | |
| /S/ WALTER F. SIEBECKER | | Director | October 30, 2015 | |
| Walter F. Siebecker | | | | |
| Joseph R. Zimmel | | | | |