 filings.tools
Fair Isaac (FICO) 10-K risk factor changes: FY2016 vs FY2015
The 2016-09-30 10-K against the 2015-09-30 one, compared heading by heading and sentence by sentence. One of these filings carries no fiscal year tag, so its year is the calendar year of the period end.
Item 1A33 rewritten14 added1 removed461 unchanged
All filing items756 rewritten313 added200 removed2,348 unchanged
Summary
counted, not written
- Item 1A headings could not be compared: only 0 carried over between the two years, which usually means one filing was read wrongly, so none is reported as new or removed.
- Sentence by sentence, 313 added, 200 removed, 756 rewritten and 2,348 unchanged across 16 items that differ.
Sentences by item
21 items, with every count and a link to each item that changed
Underlined words on a shaded ground are new in FY2016; struck-through words were in FY2015. Sentences that are wholly new or wholly gone are labelled rather than marked.
Item 1A. Risk Factors
33 rewritten, 14 added, 1 removed, 461 unchanged
If our DM strategy is not successful, we may not be able to grow our business, growth may occur more slowly than we [removed: anticipate] [added: anticipate,] or our revenues and profits may decline.
We expect that revenues derived from our scoring solutions, fraud solutions, [removed: and] customer management solutions and tools will continue to account for a substantial portion of our total revenues for the foreseeable future.
Our growth and the success of our DM strategy depend upon our ability to develop and sell new products or suites of [removed: products] [added: products,] including the development and sale of our cloud-based product offerings.
If we are unable to develop new products, or if we are not successful in introducing new products, we may not be able to grow our [removed: business,] [added: business] or growth may occur more slowly than we anticipate.
Software errors in our products could affect the ability of our products to work with other hardware or software products, could delay the development or release of new products or new versions of [removed: products] [added: products,] and could adversely affect market acceptance of our products.
The loss of or a significant change in a relationship with one of these credit reporting agencies with respect to their distribution of our products or with respect to our myFICO® offerings, the loss of or a significant change in a relationship with a major customer, the loss of or a significant change in a relationship with a significant third-party distributor (including credit card [removed: processors)] [added: processors),] or the delay of significant revenues from these sources, could have a material adverse effect on our revenues and results of operations.
Failure of our existing and future distributors to generate significant revenues, demands by such distributors to change the terms on which they offer our [removed: products] [added: products,] or our failure to establish additional distribution or sales and marketing [removed: alliances] [added: alliances,] could have a material adverse effect on our business, operating results and financial condition.
| • | an acquisition may not further our business strategy as we expected, we may not integrate [removed: an] acquired [removed: company] [added: operations] or technology as successfully as we expected or we may overpay for our investments, or otherwise not realize the expected return, which could adversely affect our business or operating results; |
| • | our operating results or financial condition may be adversely impacted by claims or liabilities we assume from an acquired company, business, product or technology, including claims [removed: from] [added: by] government agencies, terminated employees, current or former customers, former stockholders or other third parties; pre-existing contractual relationships of an acquired company we would not have otherwise entered into; unfavorable revenue recognition or other accounting treatment as a result of an acquired company’s practices; and intellectual property claims or disputes; |
| • | consumer [added: or customer] dissatisfaction with, or problems caused by, the performance of our products; |
We may also recruit skilled technical professionals from other countries to work in the [removed: U.S] [added: U.S.,] and from the [removed: U.S,] [added: U.S.] and other countries to work abroad.
If we fail to maintain sufficient data sourcing relationships with our customers and business alliances, or if they decline to provide such data due to [removed: legal] privacy concerns, competition concerns, prohibitions or a lack of permission from their customers or partners, we could lose access to required data and our products, and the development of new products, might become less effective.
To date, we have relied primarily on a combination of copyright, patent, trade secret, and trademark laws, and nondisclosure and other contractual restrictions on copying and [removed: distribution] [added: distribution,] to protect our proprietary technology.
If our security measures are breached as a result of third-party action, employee error, malfeasance or otherwise, and as a result, someone obtains unauthorized access to our [removed: system] [added: systems] or to consumer or customer information, our reputation may be damaged, our business may suffer and we could incur significant liability.
Any security compromise in our industry, whether actual or perceived, could harm our reputation, erode customer confidence in the effectiveness of our security measures, negatively impact our ability to attract new customers, cause existing customers to curtail or cease their use of our products and services or subject us to [removed: third-party lawsuits, regulatory fines or other action or liability, which could materially and adversely affect our business and operating results.][added: third-]
If we experience [removed: a sustained interruption of our telecommunication systems,] [added: system interruptions,] it could harm our business.
Systems or network [added: interruptions, including] interruptions [added: experienced in connection with our cloud-based and other product offerings,] could delay and disrupt our ability to develop, deliver or maintain our products and services, causing harm to our business and reputation and resulting in loss of customers or revenue.
These interruptions can include [added: software or hardware malfunctions, communication failures, outages or other failures of third party environments or service providers,] fires, floods, earthquakes, power losses, equipment failures and other events beyond our control.
| • | enterprise resource [removed: planning (“ERP”),] [added: planning,] customer relationship [removed: management (“CRM”),] [added: management,] and customer communication and mobility solution providers; |
| • | business process management [removed: solution] [added: and decision rules management] providers; |
| • | account/workflow management software providers; [removed: and] |
| • | software tools companies supplying modeling, rules, or analytic development [removed: tools.] [added: tools; collections and recovery solutions providers; entity resolution and social network analysis solutions providers; and] |
| • | Use of data by creditors and consumer reporting agencies. Examples in the U.S. include the Fair Credit Reporting [removed: Act (“FCRA”),] [added: Act,] as amended by the Fair and Accurate Credit Transactions [removed: Act (“FACTA”);] [added: Act;] |
| • | Fair lending laws, such as the Truth In Lending Act [removed: (“TILA”)] and Regulation Z, as amended by the Credit Card Accountability Responsibility and Disclosure Act of [removed: 2009 (“Credit CARD Act of 2009”), and] [added: 2009,] the Equal Credit Opportunity Act [removed: (“ECOA”)] and Regulation [removed: B;] [added: B, and the Fair Housing Act;] |
| • | Privacy and security laws and regulations that limit the use and disclosure of personally identifiable information or require security procedures, including but not limited to the provisions of the Financial Services Modernization Act of 1999, also known as the Gramm Leach Bliley Act (“GLBA”); the Health Insurance Portability and Accountability Act of [removed: 1996 (“HIPAA”)] [added: 1996,] as amended by the Health Information Technology for Economic and Clinical Health [added: Act; the Cybersecurity] Act [removed: (“HITECH”);] [added: of 2015;] the [removed: Uniting] [added: Department of Commerce’s National Institute of Standards] and [removed: Strengthening America by Providing Appropriate Tools Required to Intercept] [added: Technology’s Cybersecurity Framework;] and [removed: Obstruct Terrorism Act of 2001 (“USA Patriot Act”);] identity theft, file freezing, security breach notification and similar state privacy laws; |
| • | Extension of credit to consumers through the Electronic Fund Transfers Act and Regulation E, as well as [removed: nongovernmental] [added: non‑governmental] VISA and MasterCard electronic payment standards; |
| • | The application or extension of consumer protection laws, [removed: including,] [added: such as the Consumer Financial Protection Act, the Fair Debt Collection Practices Act, the Servicemembers Civil Relief Act, and the Military Lending Act, and] laws governing the use of the Internet and telemarketing, advertising, endorsements and testimonials and credit repair; |
| • | Laws and regulations applicable to operations in other countries, for example, the European Union’s [removed: Privacy Directive] [added: General Data Protection Regulation,] and the Foreign Corrupt Practices Act; |
| • | Sarbanes-Oxley Act [removed: (“SOX”)] requirements to maintain and verify internal process controls, including controls for material event awareness and notification; |
| • | Financial regulatory reform stemming from the Dodd-Frank Wall Street Reform and Consumer Protection Act and the many regulations mandated by that Act, including regulations issued by, and the supervisory and investigative authority of, the Bureau of Consumer Financial [removed: Protection (“CFPB”);] [added: Protection;] and |
Privacy legislation such as GLBA or the European Union’s [removed: Privacy Directive] [added: General Data Protection Regulation] may also affect the nature and extent of the products or services that we can provide to customers, as well as our ability to collect, monitor and disseminate information subject to privacy protection.
During fiscal [removed: 2015, 73%] [added: 2016, 74%] of our revenues were derived from sales of products and services to the banking and insurance industries.
During fiscal [removed: 2015, 40%] [added: 2016, 36%] of our revenues were derived from business outside the U.S. As part of our growth strategy, we plan to continue to pursue opportunities outside the U.S., including opportunities in countries with economic systems that are in early stages of development and that may not mature sufficiently to result in growth for our business.
party lawsuits, regulatory fines or other action or liability, which could materially and adversely affect our business and operating results.
| • | cloud-based customer engagement and risk management solutions providers. |
| • | Laws and regulations applicable to our customer communication clients and their use of our products and services, including the Telephone Consumer Protection Act and regulations promulgated thereunder; |
| • | Regulatory expectations for management of third parties (e.g., vendors, contractors, suppliers, distributors), such as OCC Bulletin 2013-29; Federal Reserve Supervisory Letter 13-19 / CA 13-21; Federal Housing Finance Agency Advisory Bulletin AB 2014-07; CFPB Bulletin 2012-03; and FFIEC Outsourcing Technology Services June 2004; |
| • | Regulations applicable to anti-money laundering, such as the Bank Secrecy Act, as amended by the Uniting and Strengthening America by Providing Appropriate Tools Required to Intercept and Obstruct Terrorism Act of 2001; |
For example, on June 23, 2016, the United Kingdom (U.K.) held a referendum in which voters approved an exit from the European Union, commonly referred to as “Brexit”.
As a result of the referendum, it is expected that the British government will begin negotiating the terms of the U.K.’s future relationship with the European Union.
Although it is unknown what those terms will be, the announcement of Brexit caused, and may continue to create, volatility in global stock markets and regional and global economic uncertainty, which may cause our customers to closely monitor their costs and reduce their spending budget on our products and services.
| | |
| --- | --- |
| | |
| --- | --- |
| | |
| --- | --- |
| • | The implementation of the Emergency Economic Stabilization Act of 2008 by federal regulators to manage the financial crisis in the U.S.; |
Item 7. Management’s Discussion and Analysis of Financial Condition and Results of Operations
173 rewritten, 78 added, 45 removed, 388 unchanged
[removed: During fiscal 2015, we continued to generate significant free] [added: We utilized our] cash [removed: flow used] to enhance shareholder value through investments in long-term growth initiatives; acquisitions of relevant technologies and products that strengthen our portfolio and competitive position; and our share repurchase [removed: program.][added: programs.]
[removed: Our full suite of applications available through the FICO® Analytic Cloud provide product offerings] [added: We expanded our traditional on-premises software into cloud-based solutions] in our Applications and [removed: Tools] [added: Decision Management Software (formerly “Tools”)] segments to provide growth opportunities with customers that can benefit from the affordability and simplicity of [removed: cloud-based] [added: these] solutions.
[removed: For our Scores segment, the] [added: The] FICO® Score Open Access [removed: program] [added: program, which allows our participating clients to provide their customers with a free FICO® Score along with content to help them understand the FICO® Score their lender uses,] continued its expansion during the current year.
[removed: In addition, during fiscal 2015, we launched a] [added: This] partnership [removed: program with Experian, a leading global information services provider, making] [added: provides consumers] the FICO® Score [removed: available to consumers, who can now go to Experian.com to access the credit score] [added: that] lenders [removed: use] most [added: commonly use in evaluating credit] when determining applicant eligibility for new credit cards, car loans, mortgages or other lines of [removed: credit.][added: credit and can be accessed through Experian.com.]
With our strong portfolio of products now in [removed: place,] [added: place and the accelerating growth] we are [removed: shifting] [added: experiencing in our cloud-based offerings, we shifted] some of our resources to distribution [removed: of] [added: in] our expanded market.
[removed: This] [added: During] fiscal [removed: year,] [added: 2016,] we [removed: incurred severance charges to reallocate expenses from building out products to] [added: expanded] our distribution and go-to-market for both the Applications and [removed: Tools] [added: Decision Management Software] segments, which [removed: includes] [added: include] significant sales training and increasing sales resources to reach new market segments.
During fiscal [removed: 2015,] [added: 2016,] we repurchased approximately [removed: 1.7] [added: 1.3] million shares [removed: for] [added: at] a total [removed: cost] [added: repurchase price] of [removed: $130.7] [added: $138.4] million.
As of September 30, [removed: 2015,] [added: 2016,] we had [removed: $119.3] [added: $230.0] million remaining under our current stock repurchase program.
Total revenues for fiscal [removed: 2015] [added: 2016] were [removed: $838.8] [added: $881.4] million, an increase of [removed: 6%] [added: 5%] from [removed: $789.0] [added: $838.8] million in fiscal [removed: 2014.][added: 2015.]
[removed: Revenue in each of our segments increased, with Applications, Scores] [added: Our Applications] and [removed: Tools increasing] [added: Decision Management Software segments increased] by [removed: 4%, 11%] [added: 1%] and [removed: 7%] [added: 2%] in fiscal [removed: 2015] [added: 2016] compared to fiscal [removed: 2014,] [added: 2015,] respectively.
We derive a significant portion of revenue internationally, and [removed: 40%] [added: 36%] and [removed: 42%] [added: 40%] of total consolidated revenues were derived from clients outside the U.S. during fiscal [removed: 2015] [added: 2016] and [removed: 2014,] [added: 2015,] respectively.
A significant portion of our revenues are derived from the sale of products and services within the banking (including consumer credit) industry, and [removed: 69%] [added: 72%] and [removed: 74%] [added: 69%] of our revenues were derived from within this industry during fiscal [removed: 2015] [added: 2016] and [removed: 2014,] [added: 2015,] respectively.
Arrangements with transactional or unit-based pricing accounted for [added: 69% and] 67% of our revenues during fiscal [removed: 2015] [added: 2016] and [removed: 2014.][added: 2015, respectively.]
Operating income for fiscal [removed: 2015] [added: 2016] was [removed: $137.5] [added: $169.6] million, [removed: a decrease] [added: an increase] of [removed: 15%] [added: 23%] from [removed: $161.9] [added: $137.5] million in fiscal [removed: 2014.][added: 2015.]
The margin [removed: decrease] [added: increase] was primarily attributable to [removed: an increase in our restructuring cost related to the write-down of facilities, our continued investment in the areas of cloud computing and SaaS, and an increase in our professional services delivery cost, partially offset by] a higher percentage of revenues derived from our higher-margin products including revenues generated from our Experian [removed: agreement.][added: agreement, no restructuring cost in the current year following the write-down of facilities in the prior year and a decrease in our professional services delivery cost.]
Net income [removed: decreased 9%] [added: increased 27%] to [removed: $86.5] [added: $109.4] million in fiscal [removed: 2015] [added: 2016] from [removed: $94.9] [added: $86.5] million in fiscal [removed: 2014] [added: 2015] primarily due to the [removed: decrease] [added: increase] in operating margin, partially offset by lower income tax [removed: expense,] [added: expense in fiscal 2015,] largely driven by a favorable tax [removed: adjustment in fiscal 2015.][added: adjustment.]
Diluted earnings per share for fiscal [removed: 2015] [added: 2016] was [removed: $2.65, a decrease] [added: $3.39, an increase] of [removed: 3%] [added: 28%] from [removed: $2.72] [added: $2.65] in fiscal [removed: 2014.][added: 2015.]
Although many of our contracts contain non-cancelable terms, most of our bookings are transactional or service related that [removed: are dependent] [added: depend] upon estimates such as volume of transactions, number of active accounts, or number of hours incurred.
| Quarter ended September 30, [removed: 2014] [added: 2016] | $ | [removed: 85.8] [added: 80.3] | | | [removed: 26] [added: 20] | % | | [removed: 12] [added: 13] | | | [removed: 22] [added: 37] | |
| [added: |] Year [removed: ended] [added: Ended] September 30, [removed: 2014] | [removed: $] | [removed: 362.3] | | | [removed: 38] | [removed: %] | | [removed: 63] | | | [removed: NM(a)] | [added: 2016 to 2015] | [added: | | | 2015 to 2014 | | | | 2016 to 2015 | | | 2015 to 2014 | |]
Transactional and maintenance bookings were [removed: 31%] [added: 35%] and [removed: 29%] [added: 31%] of total bookings for the years ended September 30, [removed: 2015] [added: 2016] and [removed: 2014,] [added: 2015,] respectively.
Professional services bookings were [added: 45% and] 47% of total bookings for the years ended September 30, [removed: 2015] [added: 2016] and [removed: 2014.][added: 2015, respectively.]
License bookings were [removed: 22%] [added: 20%] and [removed: 24%] [added: 22%] of total bookings for the years ended September 30, [removed: 2015] [added: 2016] and [removed: 2014,] [added: 2015,] respectively.
We are organized into the following three reportable segments: Applications, Scores and [removed: Tools.][added: Decision Management Software.]
Comparative segment revenues, operating income, and related financial information for the years ended September 30, [removed: 2015, 2014] [added: 2016, 2015] and [removed: 2013] [added: 2014] are set forth in Note 17 to the accompanying consolidated financial statements.
The following tables set forth certain summary information on a segment basis related to our revenues for fiscal [removed: 2015, 2014] [added: 2016, 2015] and [removed: 2013:][added: 2014:]
| Segment | [added: 2016 | | | |] 2015 | | | | 2014 | | | | [removed: 2013] [added: 2016 to 2015] | | | | 2015 to 2014 | | | | [removed: 2014] [added: 2016] to [removed: 2013 |] [added: 2015] | | | 2015 to 2014 | | [removed: | 2014 to 2013 | |]
| Applications | $ | [removed: 526,274] [added: 532,642] | | | $ | [removed: 504,256] [added: 526,274] | | | $ | [removed: 476,084] [added: 504,256] | | | $ | [removed: 22,018] [added: 6,368] | | | $ | [removed: 28,172] [added: 22,018] | | | [removed: 4] [added: 1] | % | | [removed: 6] [added: 4] | % |
| Scores | [removed: 207,007] [added: 241,059] | | | | [removed: 186,469] [added: 207,007] | | | | [removed: 180,813] [added: 186,469] | | | | [removed: 20,538] [added: 34,052] | | | | [removed: 5,656] [added: 20,538] | | | | [removed: 11] [added: 16] | % | | [removed: 3] [added: 11] | % |
| Total [removed: Revenues] | $ | [removed: 838,781] [added: 881,356] | | | $ | [removed: 788,985] [added: 838,781] | | | $ | [removed: 743,444] [added: 788,985] | | | [removed: 49,796] [added: 42,575] | | | | [removed: 45,541] [added: 49,796] | | | | [removed: 6] [added: 5] | % | | 6 | % |
| Segment | [removed: 2015] [added: 2016] | | | [removed: 2014] [added: 2015] | | | [removed: 2013] [added: 2014] | |
| Applications | [removed: 63] [added: 61] | % | | [removed: 64] [added: 63] | % | | 64 | % |
| Scores | [removed: 25] [added: 27] | % | | [removed: 24] [added: 25] | % | | 24 | % |
| Total [removed: Revenues] | 100 | % | | 100 | % | | 100 | % |
| | [added: 2016 | | | |] 2015 | | | | 2014 | | | | [removed: 2013] [added: 2016 to 2015] | | | | 2015 to 2014 | | | | [removed: 2014] [added: 2016] to [removed: 2013 |] [added: 2015] | | | 2015 to 2014 | | [removed: | 2014 to 2013 | |]
| Transactional and maintenance | $ | [removed: 320,596] [added: 328,472] | | | $ | [removed: 313,316] [added: 320,596] | | | $ | [removed: 306,738] [added: 313,316] | | | $ | [removed: 7,280] [added: 7,876] | | | $ | [removed: 6,578] [added: 7,280] | | | 2 | % | | 2 | % |
| Professional services | [removed: 124,562] [added: 138,775] | | | | [removed: 121,100] [added: 124,562] | | | | [removed: 110,081] [added: 121,100] | | | | [removed: 3,462] [added: 14,213] | | | | [removed: 11,019] [added: 3,462] | | | | [removed: 3] [added: 11] | % | | [removed: 10] [added: 3] | % |
| License | [removed: 81,116] [added: 65,395] | | | | [removed: 69,840] [added: 81,116] | | | | [removed: 59,265] [added: 69,840] | | | | [removed: 11,276] [added: (15,721] | | [added: )] | | [removed: 10,575] [added: 11,276] | | | | [removed: 16] [added: (19] | [removed: %] [added: )%] | | [removed: 18] [added: 16] | % |
| Total | $ | [removed: 526,274] [added: 532,642] | | | $ | [removed: 504,256] [added: 526,274] | | | $ | [removed: 476,084] [added: 504,256] | | | [removed: 22,018] [added: 6,368] | | | | [removed: 28,172] [added: 22,018] | | | | [removed: 4] [added: 1] | % | | [removed: 6] [added: 4] | % |
Applications segment revenues increased $22.0 million in fiscal 2015 from [removed: fiscal] 2014 primarily due to an $11.1 million increase in our compliance solutions, a $10.0 million increase in our fraud solutions, and a $4.1 million increase in our customer communication services, partially offset by a $3.3 million decrease in our marketing solutions.
During fiscal 2016, our growth initiatives continued to generate significant free cash flow.
Our software solutions are available through the FICO® Analytic Cloud, and we are adding delivery via third-party cloud environments, which are offered through large vendors in other geographic locations across the world.
We continue to offer our solutions on-premises for many customers who prefer to install and run our software in-house.
In addition, we introduced the FICO® Decision Management Suite 2.0 (“DMS”), which provides an easy way for customers to evaluate, customize, deploy and scale state-of-the-art analytics.
The DMS allows customers to quickly integrate our tools and components with their data, helping organizations of all sizes realize the promise of advanced analytics and decision management in a cost-effective, scalable cloud or on-premise solution.
For our Scores segment, our industry leading business-to-business FICO® Scores expanded further into the larger, faster growing U.S. consumer market.
Through this program, we now have more than 180 million consumers with access to their free FICO® Score.
The partnership agreement we launched in fiscal 2015 with Experian, a leading global information services provider, continued to accelerate during the current year.
We have partnered and continue to pursue additional partners, to distribute the FICO® Scores with their product offerings sold directly to consumers.
In addition, we are pursuing opportunities to make the FICO® Scores available to third-parties for affinity, white-labeled programs to further penetrate and expand the markets where our scores are available.
Our acquisition of Quadmetrics, a provider of enterprise security assessment analytics, accelerates our efforts to provide a suite of complementary cyber-related analytics solutions to market.
In fiscal 2017, we expect to broaden our investment into product delivery, support and infrastructure operations.
Revenue in each of our segments increased, with our Scores segment the primary driver increasing by 16% in fiscal 2016 compared to fiscal 2015.
Operating margin increased to 19% from 16%.
| Year ended September 30, 2016 | $ | 378.0 | | | 40 | % | | 57 | | | NM(a) | |
| Decision Management Software | 107,655 | | | | 105,500 | | | | 98,260 | | | | 2,155 | | | | 7,240 | | | | 2 | % | | 7 | % |
| Decision Management Software | 12 | % | | 12 | % | | 12 | % |
The increase in compliance solutions was primarily attributable to our acquisition of TONBELLER in January 2015.
The increase in business-to-consumer services was primarily attributable to revenue generated from the agreement with Experian that launched in December 2014 and made FICO® Scores available to consumers on Experian.com.
The increase in business-to-business scores was primarily attributable to an increase in our transactional scores driven by new originations, account management and prescreen.
Decision Management Software
Decision Management Software segment revenues increased $2.2 million in fiscal 2016 from 2015 primarily attributable to an increase in services revenue, largely due to an increase in our FICO® Decision Management Platform product partially offset by a decrease in our FICO® Blaze Advisor product.
Cost of revenues as a percentage of revenues decreased to 30% during fiscal year 2016 from 32% during fiscal 2015.
The increase in direct materials was primarily attributable to an increase in telecommunications cost associated with the increase in our customer communications services subscription based revenue.
The fiscal year 2016 over 2015 increase of $4.8 million in research development expenses was primarily attributable to a $6.7 million increase in personnel and labor costs, partially offset by a $2.1 million decrease in outside services.
The increase in personnel and labor costs was primarily driven by an increase in incentive cost and our continued investment in the areas of cloud computing and software-as-a-service (“SaaS”), as well as several new products primarily in the Decision Management Software segment.
The decrease in outside services was primarily attributable to fewer internal projects utilizing temporary resources.
The $28.9 million increase was primarily attributable to a $23.5 million increase in labor and personnel costs and a $1.6 million increase in marketing expenses.
The increase in marketing expenses was primarily attributable to our investment in expanding and refining our distribution capabilities.
There were no restructuring or acquisition-related expenses incurred during fiscal 2016.
| | 2016 | | | | 2015 | | | | 2014 | | |
The increase in our effective tax rate in fiscal 2016 compared to 2015 was primarily due to a higher percentage of revenue in higher taxing jurisdictions during the current year, and the favorable settlement of the fiscal 2006-2009 state audits and the 2010 foreign transfer pricing assessment in fiscal 2015, partially offset by higher foreign tax credits, research credits and domestic production deduction credits in fiscal 2016.
As of September 30, 2016, we have not made a provision for U.S. or additional foreign withholding taxes on approximately $45.3 million of the excess of the amount for financial reporting over the tax basis of investments in foreign subsidiaries.
We intend to reinvest the earnings of its non-U.S. subsidiaries in those operations indefinitely, except where we are able to repatriate these earnings to the United States without material incremental tax provision.
The determination and estimation of the future income tax consequences in all relevant taxing jurisdictions involves the application of highly complex tax laws in the countries involved, particularly in the United States, and is based on our tax profile in the year of earnings repatriation.
Accordingly, it is not practicable to estimate the amount of deferred tax liability related to investments in these foreign subsidiaries.
| Segment | 2016 | | | | 2015 | | | | 2014 | | | | 2016 to 2015 | | | | 2015 to 2014 | | | | 2016 to 2015 | | | 2015 to 2014 | |
| Decision Management Software | (3,660 | | ) | | (6,350 | | ) | | 4,203 | | | | 2,690 | | | | (10,553 | | ) | | (42 | )% | | (251 | )% |
| | 2016 | | | | 2015 | | | | 2014 | | | | 2016 | | | 2015 | | | 2014 | |
| | 2016 | | | | 2015 | | | | 2014 | | | | 2016 | | | 2015 | | | 2014 | |
We have more than 100 million consumers with access to their free score through the FICO® Score Open Access program, which allows our participating clients to provide their customers with a free FICO® Score along with materials to help them understand what affects their score.
Our acquisition of TONBELLER addresses the rapidly growing demand for integrated, enterprise-class financial crime and compliance solutions.
We leveraged the financial crime and compliance technology to integrate with our existing fraud detection and analytics to provide broader, more responsive fraud solutions for our customers.
Operating margin decreased to 16% from 21%.
| Tools | 105,500 | | | | 98,260 | | | | 86,547 | | | | 7,240 | | | | 11,713 | | | | 7 | % | | 14 | % |
| Tools | 12 | % | | 12 | % | | 12 | % |
The increase was partially offset by a $5.3 million decrease in our marketing solutions and a $3.2 million decrease in our customer management solutions.
The increase in collections & recovery solutions was primarily attributable to an increase in services revenues.
The decrease in marketing solutions was primarily attributable to the early termination of a large customer in fiscal 2013, partially offset by a large deal entered into in fiscal 2014 to develop customized software solutions for a new customer.
The decrease in customer management solutions was primarily attributable to a decrease in license revenue.
The increase in our business-to-consumer services was attributable to a $4.2 million increase in direct sales generated from the myFICO.com website, partially offset by a $0.7 million decrease in royalties derived from scores sold indirectly to consumers through credit reporting agencies.
The increase in our business-to-business scores revenues was primarily attributable to increased software revenue related to our Global FICO® Score.
Tools
Tools segment revenues increased $11.7 million in fiscal 2014 from 2013 primarily due to an $8.5 million increase in our optimization tools and a $2.2 million increase in our predictive modeling tools.
The increase in optimization tools was primarily attributable to increased license sales on our FICO® Decision Optimizer and FICO® Xpress Optimization products.
The increase in predictive modeling tools was primarily attributable to increased services revenue related to our FICO® Model Central™ product.
| | Year Ended September 30, | | | | | | | | | | | | 2015 to 2014 | | | | 2014 to 2013 | | | | 2015 to 2014 | | | 2014 to 2013 | |
The increase in allocated facilities cost was primarily attributable to leased office space assumed from our acquisitions of CR Software and Infoglide in fiscal 2013, and InfoCentricity in fiscal 2014.
The decrease in direct materials was primarily attributable to a decrease in software license sales that incur royalties cost.
The $16.5 million increase was attributable to an $11.5 million increase in personnel and labor costs, a $3.0 million increase in outside services cost, and a $2.0 million increase in allocated facilities cost, all driven by our continued investment in the areas of cloud computing and SaaS.
The fiscal year 2014 over 2013 increase of $9.8 million in selling, general and administrative expenses was primarily attributable to a $7.9 million increase in labor and personnel costs and a $2.3 million increase in marketing cost.
The increase in marketing cost was primarily attributable to several new marketing programs implemented in fiscal 2014.
Selling, general and administrative expenses as a percentage of revenues decreased to 35% for the year ended September 30, 2014 from 36% for the year ended September 30, 2013 primarily attributable to FICO shifting resources to research and development efforts in the areas of cloud computing and SaaS.
In fiscal 2013, we incurred $1.0 million in acquisition-related cost mainly associated with our CR Software and Infoglide acquisitions.
We also incurred net charges totaling $2.5 million consisting of severance costs and costs for vacating excess leased space.
Cash payments for all the severance costs were paid during fiscal 2013.
Cash payments for all the facilities charges have been paid by the end of fiscal 2014.
The decrease in our effective tax rate in fiscal 2014 compared to fiscal 2013 was due primarily to the favorable settlement of the fiscal 2010 - 2012 Federal IRS audits and secondarily to a higher percentage of revenue in lower taxing jurisdictions.
As of September 30, 2015 we have reported $52.8 million of unremitted earnings of the international subsidiaries in our consolidated income.
U.S. income taxes have not been provided on undistributed earnings of international subsidiaries.
It is our intention to reinvest these earnings permanently or to repatriate the earnings only when it is tax efficient to do so.
The amount of the unrecognized deferred tax liability depends on judgment required to analyze the withholding tax due, the applicable tax law and related tax treaties, and factual circumstances in effect at the time of any such distribution, therefore, we believe it is not practicable at this time to reliably determine the amount of the unrecognized deferred tax liability related to our undistributed earnings.
If circumstances change and it becomes apparent that some or all of the undistributed earnings of a subsidiary will be remitted in the next twelve months and income taxes have not been recognized by the parent entity, the parent entity shall accrue as an expense of the current period income taxes attributable to that remittance.
| Tools | (6,350 | | ) | | 4,203 | | | | 19,469 | | | | (10,553 | | ) | | (15,266 | | ) | | (251 | )% | | (78 | )% |
The increase in segment revenues was primarily attributable to two large multi-year license transactions in fraud solutions and increased transactional and services revenues in customer communication solutions.
Segment operating income as a percentage of segment revenues for Applications increased to 34% from 30% primarily due to FICO shifting resources to cloud computing mainly in the Tools segment, a reduction in sales workforce as part of our restructuring during the first quarter of our fiscal 2014, as well as increased sales of higher-margin software products.
The $12.0 million increase in Scores segment operating income was attributable to a $6.4 million decrease in segment operating expenses and a $5.6 million increase in segment revenues.
Segment operating income as a percentage of segment revenues for Scores increased to 76% from 72% mainly due to an increase in sales of our higher-margin software products, as well as decreased third-party data cost as a result of favorable terms in a renewed agreement with one credit reporting agency in May 2013.
Segment operating income as a percentage of segment revenues for Tools decreased to 4% from 22% mainly due to an increase in the research and development efforts related to our cloud-based FICO® Decision Management Platform as well as our FICO® Model Central™ Solution.
The $38.9 million increase was mainly attributable to a $40.4 million increase caused by the timing of receipts and payments in our ordinary course of business, including a $29.2 million increase caused by timing of payment on accrued compensation and employee benefits.
An excerpt. Shown here: 40 of 173 rewritten, 40 of 78 added and 40 of 45 removed. The counts are complete. For every sentence, read Item 7. Management’s Discussion and Analysis of Financial Condition and Results of Operations in the FY2016 filing and the FY2015 filing.
Item 7A. Quantitative and Qualitative Disclosures about Market Risk
17 rewritten, 5 added, 5 removed, 45 unchanged
The following table presents the principal amounts and related weighted-average yields for our investments with interest rate risk at September 30, [removed: 2015] [added: 2016] and [removed: 2014:][added: 2015:]
| | September 30, [removed: 2015] [added: 2016] | | | | | | | | | | | September 30, [removed: 2014] [added: 2015] | | | | | | | | | |
| Cash and cash equivalents | $ | [removed: 86,120] [added: 75,926] | | | $ | [removed: 86,120] [added: 75,926] | | | [removed: 0.95] [added: 0.17] | % | | $ | [removed: 105,075] [added: 86,120] | | | $ | [removed: 105,075] [added: 86,120] | | | [removed: 0.03] [added: 0.95] | % |
See Management’s Discussion and Analysis of Financial Condition and Results of Operations — Capital Resources and [removed: Liquidity, above,] [added: Liquidity] for additional information on the Senior Notes.
The following table presents the principal amounts, carrying amounts, and fair values for the Senior Notes at September 30, [removed: 2015] [added: 2016] and [removed: 2014:][added: 2015:]
| | September 30, [removed: 2015] [added: 2016] | | | | | | | | | | | | September 30, [removed: 2014] [added: 2015] | | | | | | | | | | |
| The 2008 Senior Notes | $ | 131,000 | | | $ | 131,000 | | | $ | [removed: 144,009] [added: 139,902] | | | $ | [removed: 202,000] [added: 131,000] | | | $ | [removed: 202,000] [added: 131,000] | | | $ | [removed: 214,170] [added: 144,009] | |
| The 2010 Senior Notes | $ | [removed: 245,000] [added: 185,000] | | | $ | [removed: 245,000] [added: 185,000] | | | $ | [removed: 257,563] [added: 195,715] | | | $ | 245,000 | | | $ | 245,000 | | | $ | [removed: 248,557] [added: 257,563] | |
We had [removed: $232.0] [added: $255.0] million in borrowings outstanding at a weighted average interest of [removed: 1.601%] [added: 1.661%] under the credit facility as of September 30, [removed: 2015.][added: 2016.]
The following tables summarize our outstanding foreign currency forward contracts, by [removed: currency] [added: currency,] at September 30, [removed: 2015] [added: 2016] and [removed: 2014:][added: 2015:]
| | Contract Amount | | | | | | | | Fair Value | | [removed: |]
| | Foreign Currency | | | | US$ | | | | US$ | | [removed: |]
| | (In thousands) | | | | | | | | | | [removed: |]
| Sell foreign currency: | | | | | | | | | | | [removed: |]
| Buy foreign currency: | | | | | | | | | | | [removed: |]
| British pound (GBP) | GBP | [removed: 6,795] [added: 7,721] | | | $ | [removed: 11,000] [added: 10,000] | | | — | | [removed: |]
The foreign currency forward contracts were entered into on September 30 of each fiscal year; therefore, the fair value was $0 on September 30, [removed: 2015] [added: 2016] and [removed: 2014.][added: 2015.]
| | | | | | | | | | | |
| --- | --- | --- | --- | --- | --- | --- | --- | --- | --- | --- |
| | | | | | | | | | | |
| | September 30, 2016 | | | | | | | | | |
| Euro (EUR) | EUR | 7,850 | | | $ | 8,743 | | | — | |
| | | | | | | | | | | | |
| --- | --- | --- | --- | --- | --- | --- | --- | --- | --- | --- | --- |
| | September 30, 2014 | | | | | | | | | | |
| Canadian dollar (CAD) | CAD | 3,300 | | | $ | 2,960 | | | $ | — | |
| Euro (EUR) | EUR | 3,800 | | | $ | 4,790 | | | — | | |
Item 1. Business
52 rewritten, 22 added, 14 removed, 268 unchanged
We also help businesses improve [removed: noncustomer] [added: non-customer] decisions such as transaction and claims processing.
| • | Applications. This segment includes pre-configured decision management applications designed for a specific type of business problem or process [removed: -] [added: —] such as marketing, account origination, customer management, fraud, collections and insurance claims management [removed: -] [added: —] as well as associated professional services. These applications are available to our customers as on-premises software, and many are available as hosted, software-as-a-service (“SaaS”) applications through the FICO® Analytic Cloud. |
| • | Scores. This segment includes our business-to-business scoring solutions and services, our [added: business-to-consumer scoring solutions and services including] myFICO® solutions for consumers, and associated professional services. Our scoring solutions give our clients access to analytics that can be easily integrated into their transaction streams and decision-making processes. Our scoring solutions are distributed through major credit reporting agencies worldwide, as well as services through which we provide our scores to clients directly. |
| • | [removed: Tools.] [added: Decision Management Software (formerly“Tools”).] This segment is composed of analytic and decision management software tools that clients can use to create their own custom decision management applications, our new FICO® Decision Management Suite, as well as associated professional services. These tools are available to our customers as on-premises software or through the FICO® Analytic Cloud. |
Comparative segment revenues, operating income and related financial information for fiscal [removed: 2015, 2014] [added: 2016, 2015] and [removed: 2013] [added: 2014] are set forth in Note 17 to the accompanying consolidated financial statements.
| • | Data management and [added: transaction] profiling that bring extensive consumer information to every decision. |
Our applications primarily serve clients in the banking, insurance, [added: telecommunications,] healthcare, retail and public sectors.
During fiscal [removed: 2015,] [added: 2016,] we continued to expand our product offerings for the FICO® Analytic Cloud, resulting in increased sales opportunities by accommodating small to [removed: midsize] [added: mid-size] businesses that benefit from the affordability and simplicity of cloud-based solutions.
Within our [removed: applications] [added: Applications] segment our fraud solutions accounted for [removed: 23%,] [added: 20%,] 23% and [removed: 22%] [added: 23%] of total revenues in each of fiscal [removed: 2015, 2014] [added: 2016, 2015] and [removed: 2013,] [added: 2014,] respectively; our customer management solutions accounted for 9%, [removed: 10%] [added: 9%] and [removed: 11%] [added: 10%] of total [removed: revenues,] [added: revenues] in each of these periods, respectively; and our [removed: collections & recovery solutions] [added: customer communication services] accounted for [removed: 9%] [added: 9%, 8% and 8%] of total revenues for each of these [removed: periods.][added: periods, respectively.]
Additionally, we provide TRIAD services and similar credit account management services through third-party credit card processors worldwide, including [removed: the] two [added: of the] largest processors in the [removed: U.S., First Data Resources, Inc. and Total System Services, Inc.][added: U.S.]
Fraud [added: and Security] Management Applications
Falcon® Fraud Manager examines transaction, cardholder, account, customer, device and merchant data to detect a wide range of payment card fraud quickly and [removed: accurately.][added: accurately utilizing artificial intelligence technology.]
[removed: The] [added: Separately, the FICO®] Card Alert Service [removed: identifies] [added: prevents ATM debit fraud by identifying] counterfeit payment cards and [removed: reports] [added: reporting] them to issuers.
[removed: By combining these solutions with its legacy fraud analytics, such as those used in FICO® Falcon® Fraud Manager,] FICO [removed: now] offers a comprehensive modular set of [added: compliance] solutions to fight money-laundering, [removed: fraud,] terrorist financing, and to fulfill custom requirements for governance, risk and compliance.
FICO® Debt Manager™ is [removed: now] available [added: both on premises and] in the [removed: cloud.][added: FICO® Analytic Cloud.]
FICO® Score is a three-digit score ranging from [removed: 300-850.][added: 300—850.]
We license credit bureau scoring services and related consulting directly to users in banking through the FICO® PreScore® service for prescreening solicitation [removed: candidates and the FICO® Score Delivery Service for account review.][added: candidates.]
They are [removed: sold] [added: distributed] directly by us through our myFICO® service and through licensed distribution [removed: partners.][added: partners, including Experian and certain lenders, for use in customer and noncustomer programs.]
[removed: In fiscal 2015, we made] [added: We make] available the 19 most widely used versions of the FICO® Score from the three major [added: U.S.] credit bureaus through our myFICO® service, representing approximately 95% of all FICO® Scores sold and used by lenders.
Consumers can use the myFICO.com website to purchase their FICO® [removed: Scores] [added: Scores,] including credit reports associated with the scores, explanations of the factors affecting their scores, and customized information on how to manage their scores.
Consumers can also subscribe to monitoring services, which deliver alerts via email and text when changes to a user’s [removed: FICO] [added: FICO®] Scores or other credit report content are detected.
In addition, consumers can purchase identity theft monitoring products that alert consumers of potential risks of identity fraud with comprehensive detection, [removed: defense,] [added: defense] and identity restoration services.
The myFICO® products and subscription offerings are available online at [removed: www.myfico.com and are also available to consumers through numerous other partners.][added: www.myfico.com.]
We provide analytic and decision management platforms and tools that businesses use to build their own tailored, analytically powered decision management applications [removed: on-premises or] [added: on-premises,] within the FICO® Analytic [removed: Cloud.][added: Cloud or via third-party cloud environments such as Amazon Web Services.]
In contrast to our packaged applications developed for specific industry solutions, our tools [removed: add] [added: platform adds] scalable and flexible decision management capabilities to virtually any application or operational system.
During fiscal [removed: 2015,] [added: 2016,] FICO [removed: enhanced] [added: continued to enhance] the FICO® Decision Management Suite, a collection of tools for building, extending, deploying and scaling applications and solutions.
The Decision Management Suite includes the FICO® Decision Management [removed: Platform] [added: Platform, along] with [removed: tools] [added: capabilities] for building and customizing [removed: decision] [added: predictive analytic, decisioning, and optimization] components and services; developing, orchestrating and publishing analytics-powered [removed: applications,] [added: applications;] and visualizing, analyzing and reporting data trends.
[added: The FICO®] Decision Management Suite [removed: tools are] [added: is] available in the FICO® Analytic Cloud and on-premises; businesses can choose either or both deployments depending on their specific needs, IT environments and other factors.
| • | Rules Management. The FICO® Blaze Advisor® decision rules management system is used to design, develop, execute and maintain rules-based business applications. The Blaze Advisor system enables business users to propose and preview the impact of changes to decisioning logic, to review and approve proposed changes, and commit those changes to production decisioning, all without demanding IT cycles. The Blaze Advisor system is sold as an end-user tool and is also the rules engine within several of our decision management applications. The Blaze Advisor system, available in six languages, is a multi-platform solution that: embeds rules management within existing applications; supports Web Services and service-oriented [removed: architecture (“SOA”),] [added: architecture,] Java 2 Enterprise Edition [removed: (“J2EE”)] platforms, Microsoft .NET and COBOL for z/OS mainframes; and is the first rules engine to support Java, .NET and COBOL deployment of the same rules. It also incorporates the exclusive Rete III rules execution technology, which improves the efficiency and speed with which the Blaze Advisor® system is able to process and execute complex, high-volume decision rules. FICO’s solution for rules management in the cloud is called FICO® Decision Modeler. |
| • | Predictive Modeling. FICO® [removed: Model] [added: Decision] Central™ is a comprehensive offering to help banks and other organizations, including insurance, retail and health care companies, maximize the power of their predictive [added: and decision] models and meet stricter regulations for model management. It complements FICO® Model Builder, which enables the user to develop and deploy sophisticated predictive models for use in automated decisions. This software is based on the methodology and tools FICO uses to build both client-level and industry-level predictive models and scorecards, which we have developed over more than 40 years, and includes additional algorithms for rapidly discovering variable relationships, predictive interactions and optimal segmentation. The predictive models produced can be embedded in custom production applications or one of our Decision Management applications and can also be executed in the FICO® Blaze Advisor® system. FICO’s solution set for predictive modeling in the cloud is called FICO® Analytic Modeler. |
| • | enterprise resource planning [removed: (“ERP”)] and customer relationship management [removed: (“CRM”)] packaged solutions providers; |
| • | business process management and [removed: business] [added: decision] rules management providers; |
We also compete with traditional advertising agencies and companies’ [removed: own] internal information technology and analytics departments.
In the fraud solutions market for health care insurance, we compete with Emdeon, [removed: Ingenix,] [added: OptumInsight,] ViPS, MedStat, Detica, a division of BAE, SAS, Verisk Analytics and IBM.
End users of our products include [removed: all] [added: 98] of the 100 largest financial institutions in the U.S., and two-thirds of the largest 100 banks in the world.
Our clients also include more than 700 insurers, including [added: nine of] the top ten U.S. property and casualty insurers; more than 400 retailers and general merchandisers, including more than one-third of the top 100 U.S. retailers; more than 150 government or public agencies; and more than 150 healthcare and pharmaceuticals companies, including [removed: eight] [added: seven] of the world’s top ten pharmaceuticals companies.
All of the top ten companies on the [removed: 2015] [added: 2016] Fortune 500 list use FICO’s solutions.
During fiscal [removed: 2015, 2014] [added: 2016, 2015] and [removed: 2013,] [added: 2014,] revenues generated from our agreements with Equifax, TransUnion and Experian collectively accounted for [removed: 16%, 15% and] [added: 19%,] 16% [added: and 15%] of our total revenues, respectively.
Revenues from international customers, including end users and resellers, amounted to [removed: 40%, 42% and] [added: 36%,] 40% [added: and 42%] of our total revenues in fiscal [removed: 2015, 2014] [added: 2016, 2015] and [removed: 2013,] [added: 2014,] respectively.
In fiscal [removed: 2015,] [added: 2016,] we continued to make [removed: significant] progress with our FICO® Analytic Cloud and FICO® Decision Management Platform initiatives.
Adaptive analytics, a form of self-learning models, can also be employed to accelerate our customers’ response to evolving fraud tactics.
In addition to our Falcon products, we offer a wide range of solutions focused on preventing and detecting a variety of financial crimes.
FICO® Application Fraud Manager helps businesses prevent both first- and third-party fraud during the application process.
By preventing fraud prior to account origination we help our customers avoid future losses as well as unnecessary collections costs.
These solutions are based on the acquisition of TONBELLER Aktiengesellschaft (“TONBELLER”) combined with FICO’s legacy fraud analytics, such as those used in FICO® Falcon® Fraud Manager.
FICO’s cybersecurity products utilize predictive analytics to deliver enterprise-level risk assessments as well as prioritization of tactical cyber threat response.
The FICO® Enterprise Security Score, based on the acquisition of QuadMetrics, Inc. (“QuadMetrics”) in 2016, provides an empirically derived score that conveys the security posture of an organization and the likelihood of a material data breach in the next 12 months.
The score is used to manage the cyber risk of an enterprise as well as risks introduced by trusted business partners.
Separately, FICO® Falcon® Cybersecurity Analytics utilizes advanced streaming self-learning models to help organizations detect and remediate cyber attacks by reducing the dwell time between when an attack occurs and when it is recognized.
These products can be used independently or together as part of a comprehensive cyber risk management program.
In 2016 we introduced FICO® Score XD, which expands the scorable population using alternative credit data.
FICO® Score XD looks at public records and property data, and a consumer’s history with mobile, landline phone and cable payments, to generate scores on the same 300—850 scale as standard FICO® Scores.
FICO® Score XD is available to lenders from LexisNexis Risk Solutions and Equifax.
Decision Management Software
In fiscal 2016, we upgraded and enhanced much of the functionality in the suite, including:
| • | FICO® Decision Management Platform, the fundamental backbone of the Suite, to dramatically improve performance, data interchange, model tracking and user collaboration; |
| • | FICO® Decision Management Streaming (formerly known as Data Management Integration Platform) to improve scale, performance and versatility; and |
| • | FICO® Decision Central™ (formerly known as Model Central), an analytic and decision model management tool, to expand its versatility and usability across a much broader range of implementations and use cases. |
| | |
| --- | --- |
Decision Management Software
Cybersecurity.
These include credit offer prescreening, insurance claims management and others.
In addition to the Falcon products, we offer FICO® Card Alert Service.
Card Alert Service is a solution for fighting ATM debit fraud.
In fiscal 2015, FICO acquired TONBELLER Aktiengesellschaft (“TONBELLER”), a provider of financial crime prevention and compliance solutions for financial institutions, banks, insurance companies and industrial corporations.
During 2015 we announced a pilot program for a new FICO® Score we refer to as FICO® Score XD to expand the scorable population using alternative data.
The pilot will run into fiscal 2016 in partnership with Equifax and LexisNexis.
The FICO® Score Open Access program allows participating clients to provide their customers with a FICO® Score along with materials to help them understand what affects their score at no fee to the consumer.
In addition, we offer the FICO® Custom Credit Education program where lenders can license enhanced credit education tools to include in their consumer financial education programs.
Tools
In fiscal 2015, we added two new products to the suite:
| • | FICO® Big Data Analyzer, a purpose-built analytics environment that enables a broad range of users to collaboratively explore data and discover new insights from any type and size of data on Hadoop; and |
| • | FICO® Data Management Integration Platform, a streaming analytics and real-time distributed processing platform. |
Cyber Security.
In addition, the laws of some foreign countries do not protect proprietary rights to the same extent as do the laws of the U.S..
An excerpt. Shown here: 40 of 52 rewritten, all 22 added and all 14 removed. The counts are complete. For every sentence, read Item 1. Business in the FY2016 filing and the FY2015 filing.
Cover and table of contents
27 rewritten, 5 added, 5 removed, 76 unchanged
For the fiscal year ended September 30, [removed: 2015][added: 2016]
As of March 31, [removed: 2015,] [added: 2016,] the aggregate market value of the registrant’s common stock held by non-affiliates of the registrant was [removed: $2,098,972,006] [added: $2,262,902,883] based on the last transaction price as reported on the New York Stock Exchange on such date.
The number of shares of common stock outstanding on October [removed: 30, 2015] [added: 28, 2016] was [removed: 31,076,089] [added: 30,940,696] (excluding [removed: 57,780,694] [added: 57,916,087] shares held by the Company as treasury stock).
Items 10, 11, 12, 13 and 14 of Part III incorporate information by reference from the definitive proxy statement for the Annual Meeting of Stockholders to be held on February [removed: 24, 2016.][added: 14, 2017.]
| Item 1. | [removed: [Business](#s94BF110E8B8A54669C1263821CE636CC)] [added: [Business](#sA46F5AC3703250DFB203C157F6E5EF15)] | [removed: [3](#s94BF110E8B8A54669C1263821CE636CC)] [added: [3](#sA46F5AC3703250DFB203C157F6E5EF15)] |
| Item 1A. | [Risk [removed: Factors](#sDD781EB8B3D8533F81494FCC920A2694)] [added: Factors](#sDF7199120BEC5DBB907BD527A7412D62)] | [removed: [13](#sDD781EB8B3D8533F81494FCC920A2694)] [added: [13](#sDF7199120BEC5DBB907BD527A7412D62)] |
| Item 1B. | [Unresolved Staff [removed: Comments](#s70E760D82D585A77917DE63E752DF002)] [added: Comments](#s436F0089D3D2593FB8C44B3A1EF13631)] | [removed: [23](#s70E760D82D585A77917DE63E752DF002)] [added: [23](#s436F0089D3D2593FB8C44B3A1EF13631)] |
| Item 2. | [removed: [Properties](#sAFADBC09069E506095042A68FF12D075)] [added: [Properties](#s9CB387A1ED355D60BEE82BEA8F61795E)] | [removed: [23](#sAFADBC09069E506095042A68FF12D075)] [added: [23](#s9CB387A1ED355D60BEE82BEA8F61795E)] |
| Item 3. | [Legal [removed: Proceedings](#s83022415B6CF575AB4ECB2DD2E8B7CDB)] [added: Proceedings](#s6DFE5A5CA2F7552FA839A27280C9468A)] | [removed: [23](#s83022415B6CF575AB4ECB2DD2E8B7CDB)] [added: [23](#s6DFE5A5CA2F7552FA839A27280C9468A)] |
| Item 4. | [Mine Safety [removed: Disclosures](#sAD481BEFC61B59ACB31D9AD9605CFE02)] [added: Disclosures](#s7B2813EC932B5A9198C26A98DA7AF85D)] | [removed: [23](#sAD481BEFC61B59ACB31D9AD9605CFE02)] [added: [23](#s7B2813EC932B5A9198C26A98DA7AF85D)] |
| Item 5. | [Market for Registrant’s Common Equity, Related Stockholder Matters and Issuer Purchases of Equity [removed: Securities](#s7A516D7B29E652819C389F76688E352D)] [added: Securities](#sC6B7427CFC4C5CF8BE057D3059D2322D)] | [removed: [24](#s7A516D7B29E652819C389F76688E352D)] [added: [24](#sC6B7427CFC4C5CF8BE057D3059D2322D)] |
| Item 6. | [Selected Financial [removed: Data](#s5961883A9F5E5130AA168BE50AF06D92)] [added: Data](#sB7C4EDBA317553A0A8DDF23A201318E6)] | [removed: [25](#s5961883A9F5E5130AA168BE50AF06D92)] [added: [26](#sB7C4EDBA317553A0A8DDF23A201318E6)] |
| Item 7. | [Management’s Discussion and Analysis of Financial Condition and Results of [removed: Operations](#s4034DB7DA099526EA9ED5024762E741C)] [added: Operations](#sCAD3341E00DB55A390AE69612CE4FEEC)] | [removed: [29](#s4034DB7DA099526EA9ED5024762E741C)] [added: [29](#sCAD3341E00DB55A390AE69612CE4FEEC)] |
| Item 7A. | [Quantitative and Qualitative Disclosures About Market [removed: Risk](#s5BD616BD8E0251E2BA0F58D74B062F71)] [added: Risk](#s0C27FF2873E456CFA66FC5DAC141BB26)] | [removed: [45](#s5BD616BD8E0251E2BA0F58D74B062F71)] [added: [46](#s0C27FF2873E456CFA66FC5DAC141BB26)] |
| Item 8. | [Financial Statements and Supplementary [removed: Data](#sD56FA4B1486658A39BC3392D40704C8E)] [added: Data](#s691067C7519D5978A5AE25C8CCD02A29)] | [removed: [48](#sD56FA4B1486658A39BC3392D40704C8E)] [added: [48](#s691067C7519D5978A5AE25C8CCD02A29)] |
| Item 9. | [Changes in and Disagreements with Accountants on Accounting and Financial [removed: Disclosure](#s3BF03D15E5115BF4B4E7BA4D282D104C)] [added: Disclosure](#sCC9A2B6EDDAE5655912F829A11E874F3)] | [removed: [80](#s3BF03D15E5115BF4B4E7BA4D282D104C)] [added: [81](#sCC9A2B6EDDAE5655912F829A11E874F3)] |
| Item 9A. | [Controls and [removed: Procedures](#s85C08B39B86A5024B197CD23AF86A55F)] [added: Procedures](#s2A77D1B10B3750A5868635386E2BF90F)] | [removed: [80](#s85C08B39B86A5024B197CD23AF86A55F)] [added: [81](#s2A77D1B10B3750A5868635386E2BF90F)] |
| Item 9B. | [Other [removed: Information](#s779F2B34AF3752EE9D2676B1EFABB4BD)] [added: Information](#sD049BB1DA6595E1B9D4A37A3C960D28A)] | [removed: [81](#s779F2B34AF3752EE9D2676B1EFABB4BD)] [added: [81](#sD049BB1DA6595E1B9D4A37A3C960D28A)] |
| [PART [removed: III](#s372EB2A8DD1D5D738B5791BBBF0467A0)] [added: III](#sDC77AAB2784C59EE9E0E6AE502E88FA9)] | | |
| Item 10. | [Directors, Executive Officers and Corporate [removed: Governance](#s16EB148A475A5F4C8A23199E33047B7B)] [added: Governance](#s7106F3C8F8705EF095CBF45A6CE1CA7F)] | [removed: [82](#s16EB148A475A5F4C8A23199E33047B7B)] [added: [82](#s7106F3C8F8705EF095CBF45A6CE1CA7F)] |
| Item 11. | [Executive [removed: Compensation](#sA183276EF3AB51CDA30D758F69AF8E13)] [added: Compensation](#s3872C82BF852528293D15C760A2D94F9)] | [removed: [83](#sA183276EF3AB51CDA30D758F69AF8E13)] [added: [83](#s3872C82BF852528293D15C760A2D94F9)] |
| Item 12. | [Security Ownership of Certain Beneficial Owners and Management and Related Stockholder [removed: Matters](#s8A00AF4FCDA65F3889DED2B451E32F2C)] [added: Matters](#s17B5BEC6619C5E058F7EB827967EE003)] | [removed: [83](#s8A00AF4FCDA65F3889DED2B451E32F2C)] [added: [83](#s17B5BEC6619C5E058F7EB827967EE003)] |
| Item 13. | [Certain Relationships and Related Transactions, and Director [removed: Independence](#s64DD2B57B4D051DABDC40855D1DAF0E9)] [added: Independence](#s455CE3BA15CD5AAD8A6693E8FF937DB2)] | [removed: [83](#s64DD2B57B4D051DABDC40855D1DAF0E9)] [added: [83](#s455CE3BA15CD5AAD8A6693E8FF937DB2)] |
| Item 14. | [Principal Accountant Fees and [removed: Services](#s8F1ADAD3A3785DA29DCC06DE4D9D8417)] [added: Services](#sA3E78303142353138AB3D47766DF62F6)] | [removed: [83](#s8F1ADAD3A3785DA29DCC06DE4D9D8417)] [added: [83](#sA3E78303142353138AB3D47766DF62F6)] |
| Item 15. | [Exhibits, Financial Statement [removed: Schedules](#s7EFA88662BCA5EFDA33257F192F7940A)] [added: Schedules](#s2AE435CD834C5D119BF223AF88D7C7E7)] | [removed: [84](#s7EFA88662BCA5EFDA33257F192F7940A)] [added: [84](#s2AE435CD834C5D119BF223AF88D7C7E7)] |
Statements contained in this report that are not statements of historical fact should be considered forward-looking statements within the meaning of the Private Securities Litigation Reform Act of [removed: 1995 (the “Act”).][added: 1995.]
Readers should carefully review the disclosures and the risk factors described in this and other documents we file from time to time with the SEC, including our reports on Forms 10-Q and 8-K to be filed by the Company in fiscal [removed: 2016.][added: 2017.]
10-K 1 fico10-k2016.htm FICO 10-K 2016
| [PART I](#s6E3C91C1830B506AA83FA47EEA85D09B) | | |
| [PART II](#sFB14E19E3CBE51CB94A74BF6838825FF) | | |
| [PART IV](#sEAA4D339F2315F6FBA0B47FA1EA84E8D) | | |
| [Signatures](#sA467F52C6C08574DB77F61761C431B2B) | | [88](#sA467F52C6C08574DB77F61761C431B2B) |
10-K 1 fico10-k2015.htm 10-K
| [PART I](#sB65F3733EBA4525CBC88B5652BDD64B8) | | |
| [PART II](#s7E81AD415166540E8516BCED4751CEC2) | | |
| [PART IV](#s3383CCA7995F5DF1909AB0DBF59A3EFD) | | |
| [Signatures](#sA6043145C5A35C81B52D4F66CAE4F612) | | [88](#sA6043145C5A35C81B52D4F66CAE4F612) |
Item 2. Properties
4 rewritten, 0 added, 0 removed, 13 unchanged
| • | approximately 55,000 square feet of office space in San Jose, California in one building under a lease expiring in fiscal [removed: 2017;] [added: 2024;] this is used for our corporate headquarters and all of our segments; |
| • | approximately 101,000 square feet of office, data center, and data processing space in Roseville, Brooklyn Park and Minneapolis, Minnesota, in three buildings under leases expiring in fiscal [removed: 2016] [added: 2017] or later; [added: 16,000 square feet of] this [added: space] is [added: subleased to a third party; this is] used for all of our segments; |
| • | approximately 80,000 square feet of office space in San Diego, California in one building under a lease expiring in fiscal 2020; this is used for Applications and [removed: Tools] [added: Decision Management Software] segments. |
In addition, we lease an aggregate of approximately [removed: 275,000] [added: 280,000] square feet of office and data center space in a number of smaller domestic locations and internationally in India, the United Kingdom, China, Singapore, and several other locations.
Item 5. Market for Registrant’s Common Equity, Related Stockholder Matters and Issuer Purchases of Equity Securities
7 rewritten, 12 added, 11 removed, 24 unchanged
According to records of our transfer agent, at October [removed: 30, 2015,] [added: 28, 2016,] we had [removed: 404] [added: 380] shareholders of record of our common stock.
We paid dividends of [removed: two cents] [added: $0.02] per share on a quarterly basis during each of fiscal [removed: 2015, 2014] [added: 2016, 2015] and [removed: 2013.][added: 2014.]
| Period | Total Number of Shares Purchased (1) | | | Average Price Paid per Share | | | | [added: Total Number of Shares Purchased as Part of Publicly Announced Plans or Programs (2) | | |] Maximum Dollar Value of Shares that May Yet Be Purchased Under the Plans or Programs (2) | | |
| (1) | [removed: Represents] [added: Includes 11,153] shares delivered in satisfaction of the tax withholding obligations resulting from the vesting of restricted stock units held by employees during the quarter ended September 30, [removed: 2015.] [added: 2016.] |
| (2) | On August 18, 2014, our Board of Directors approved [removed: an open-ended] [added: a] stock repurchase program [added: following the completion of our previous program. This program was open-ended and authorized repurchases of shares of our common stock up] to [removed: acquire] [added: an aggregate cost of $250.0 million in the open market or in negotiated transactions. On July 27, 2016, following the termination of the August 2014 program, our Board of Directors approved a new stock repurchase program. The new program is open-ended and authorizes repurchases of] shares of our common stock up to an aggregate cost of $250.0 million in the open market or in negotiated transactions. |
The following graph shows the total stockholder return of an investment of $100 in cash on September 30, [removed: 2010,] [added: 2011,] in (a) the Company’s Common Stock, (b) the Standard & Poor’s 500 Stock Index and (c) the Standard & Poor’s 500 Application Software Index, in each case with reinvestment of dividends.
[removed: ][added: 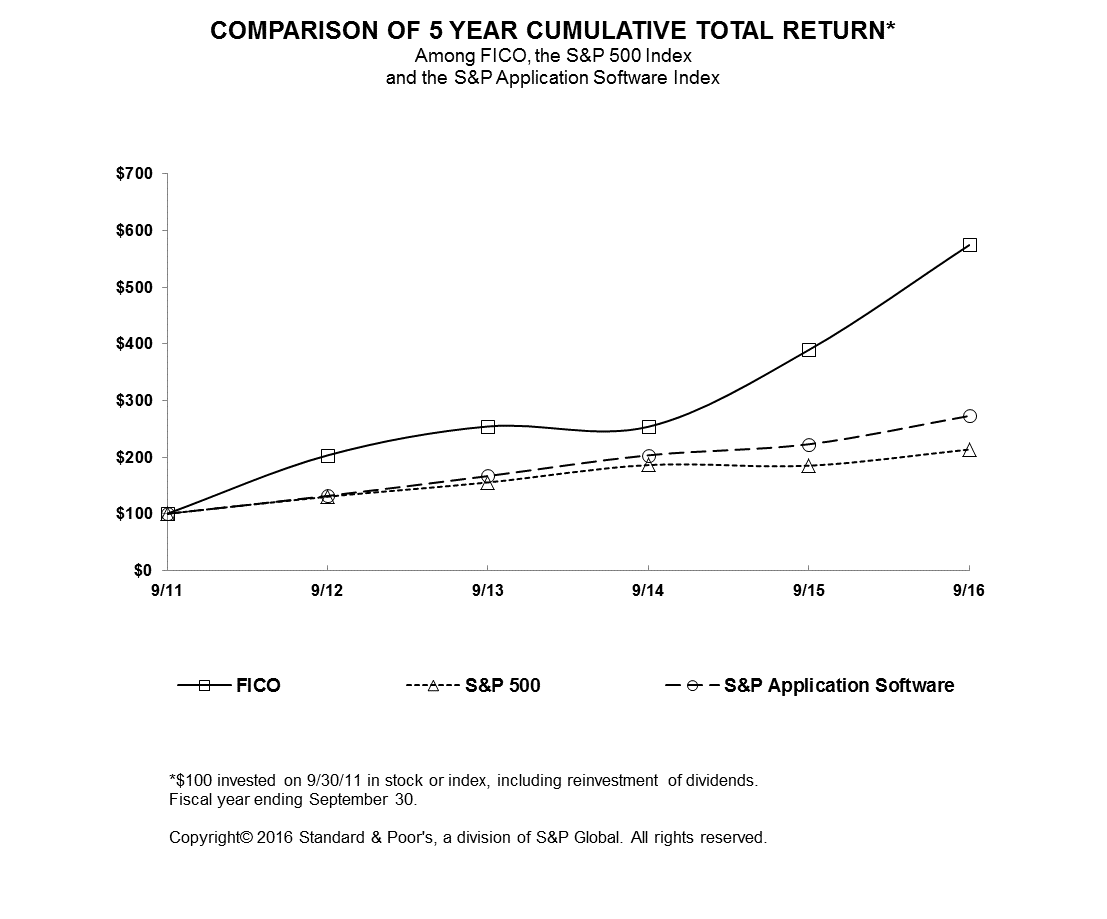]
| Fiscal 2016 | | | | | | | |
| October 1 — December 31, 2015 | $ | 97.00 | | | $ | 78.11 | |
| January 1 — March 31, 2016 | $ | 106.64 | | | $ | 80.20 | |
| April 1 — June 30, 2016 | $ | 115.87 | | | $ | 102.77 | |
| July 1 — September 30, 2016 | $ | 132.95 | | | $ | 111.73 | |
| | | | | | | | | | | | | | |
| --- | --- | --- | --- | --- | --- | --- | --- | --- | --- | --- | --- | --- | --- |
| | | | | | | | | | | | | | |
| July 1, 2016 through July 31, 2016 | 160,537 | | | $ | 116.63 | | | 154,068 | | | $ | 250,000,000 | |
| August 1, 2016 through August 31, 2016 | 32,050 | | | $ | 127.91 | | | 30,000 | | | $ | 246,165,162 | |
| September 1, 2016 through September 30, 2016 | 126,440 | | | $ | 130.60 | | | 123,806 | | | $ | 230,001,105 | |
| Total | 319,027 | | | $ | 123.30 | | | 307,874 | | | $ | 230,001,105 | |
| Fiscal 2014 | | | | | | | |
| October 1 — December 31, 2013 | $ | 63.48 | | | $ | 52.90 | |
| January 1 — March 31, 2014 | $ | 62.49 | | | $ | 50.26 | |
| April 1 — June 30, 2014 | $ | 63.87 | | | $ | 50.49 | |
| July 1 — September 30, 2014 | $ | 65.62 | | | $ | 54.38 | |
| | | | | | | | | | | |
| --- | --- | --- | --- | --- | --- | --- | --- | --- | --- | --- |
| July 1, 2015 through July 31, 2015 | 6,332 | | | $ | 91.73 | | | $ | 119,280,609 | |
| August 1, 2015 through August 31, 2015 | 2,363 | | | $ | 90.54 | | | $ | 119,280,609 | |
| September 1, 2015 through September 30, 2015 | 6,835 | | | $ | 82.53 | | | $ | 119,280,609 | |
| Total | 15,530 | | | $ | 87.50 | | | $ | 119,280,609 | |
Item 6. Selected Financial Data
14 rewritten, 0 added, 0 removed, 13 unchanged
(“CR Software”) in November 2012, Infoglide Software, Inc. (“Infoglide”) in April 2013, InfoCentricity, Inc. [removed: ("InfoCentricity")] [added: (“InfoCentricity”)] in April 2014, [removed: and] TONBELLER in January [removed: 2015.][added: 2015, and QuadMetrics in May 2016.]
| | [removed: 2015 (1)] [added: 2016] | | | | [removed: 2014] [added: 2015] (1) | | | | [removed: 2013] [added: 2014] (1) | | | | [removed: 2012] [added: 2013] (1) | | | | [removed: 2011] [added: 2012] (1) | | |
| Revenues | $ | [removed: 838,781] [added: 881,356] | | | $ | [removed: 788,985] [added: 838,781] | | | $ | [removed: 743,444] [added: 788,985] | | | $ | [removed: 676,423] [added: 743,444] | | | $ | [removed: 619,683] [added: 676,423] | |
| Operating income | [removed: 137,505] [added: 169,592] | | | | [removed: 161,868] [added: 137,505] | | | | [removed: 161,593] [added: 161,868] | | | | [removed: 168,358] [added: 161,593] | | | | [removed: 127,337] [added: 168,358] | | |
| Net income | [removed: 86,502] [added: 109,448] | | | | [removed: 94,879] [added: 86,502] | | | | [removed: 90,095] [added: 94,879] | | | | [removed: 92,004] [added: 90,095] | | | | [removed: 71,562] [added: 92,004] | | |
| Basic earnings per share | [removed: 2.75] [added: 3.52] | | | | [removed: 2.80] [added: 2.75] | | | | [removed: 2.55] [added: 2.80] | | | | [removed: 2.64] [added: 2.55] | | | | [removed: 1.82] [added: 2.64] | | |
| Diluted earnings per share | [removed: 2.65] [added: 3.39] | | | | [removed: 2.72] [added: 2.65] | | | | [removed: 2.48] [added: 2.72] | | | | [removed: 2.55] [added: 2.48] | | | | [removed: 1.79] [added: 2.55] | | |
| | [removed: 2015] [added: 2016] | | | | [removed: 2014] [added: 2015] | | | | [removed: 2013] [added: 2014] | | | | [removed: 2012] [added: 2013] | | | | [removed: 2011] [added: 2012] | | |
| Working capital | $ | [removed: 42,727] [added: 21,561] | | | $ | [removed: (52,877] [added: 42,727] | [removed: )] | | $ | [removed: 83,308] [added: (52,877] | [added: )] | | $ | [removed: 49,720] [added: 83,308] | | | $ | [removed: 217,983] [added: 49,720] | |
| Total assets | [removed: 1,230,163] [added: 1,221,052] | | | | [removed: 1,192,298] [added: 1,230,163] | | | | [removed: 1,161,547] [added: 1,192,298] | | | | [removed: 1,158,611] [added: 1,161,547] | | | | [removed: 1,129,468] [added: 1,158,611] | | |
| Senior notes | [removed: 376,000] [added: 316,000] | | | | [removed: 447,000] [added: 376,000] | | | | [removed: 455,000] [added: 447,000] | | | | [removed: 504,000] [added: 455,000] | | | | [removed: 512,000] [added: 504,000] | | |
| Revolving line of credit | [removed: 232,000] [added: 255,000] | | | | [removed: 99,000] [added: 232,000] | | | | [removed: 15,000] [added: 99,000] | | | | [removed: —] [added: 15,000] | | | | — | | |
| Stockholders’ equity | [removed: 436,998] [added: 446,828] | | | | [removed: 454,614] [added: 436,998] | | | | [removed: 530,677] [added: 454,614] | | | | [removed: 474,406] [added: 530,677] | | | | [removed: 465,494] [added: 474,406] | | |
(1) Results of operations for fiscal years 2015, 2014, [removed: 2013,] 2013 and [removed: 2011] [added: 2012] include pre-tax charges of $18.2 million, $4.3 million, $3.5 [removed: million, $5.1] million and [removed: $12.4] [added: $5.1] million, [removed: respectively] [added: respectively,] in restructuring and acquisition-related expenses.
Item 8. Financial Statements and Supplementary Data
348 rewritten, 159 added, 114 removed, 808 unchanged
We have audited the accompanying consolidated balance sheets of Fair Isaac Corporation and subsidiaries (the "Company") as of September 30, [removed: 2015] [added: 2016] and [removed: 2014,] [added: 2015,] and the related consolidated statements of income, comprehensive income, stockholders' equity, and cash flows for each of the three years in the period ended September 30, [removed: 2015.][added: 2016.]
We also have audited the Company's internal control over financial reporting as of September 30, [removed: 2015,] [added: 2016,] based on the criteria established in Internal Control - Integrated Framework (2013) issued by the Committee of Sponsoring Organizations of the Treadway Commission.
In our opinion, the consolidated financial statements referred to above present fairly, in all material respects, the financial position of the Company and subsidiaries as of September [removed: 2015] [added: 30, 2016] and [removed: 2014,] [added: 2015,] and the results of their operations and their cash flows for each of the three years in the period ended September 30, [removed: 2015,] [added: 2016,] in conformity with accounting principles generally accepted in the United States of America.
Also, in our opinion, the Company maintained, in all material respects, effective internal control over financial reporting as of September 30, [removed: 2015,] [added: 2016,] based on the criteria established in Internal Control - Integrated Framework (2013) issued by the Committee of Sponsoring Organizations of the Treadway Commission.
| | [added: 2016 | | | |] 2015 | | | | 2014 | | |
| Cash and cash [removed: equivalents | $] [added: equivalents, beginning of year] | 86,120 | | | [removed: $] | 105,075 | | [added: | | 83,178 | | |]
| Accounts receivable, net | [removed: 158,773] [added: 167,786] | | | | [removed: 155,295] [added: 158,773] | | |
| Prepaid expenses and other current assets | [removed: 41,709] [added: 23,926] | | | | [removed: 28,157] [added: 41,709] | | |
| Total current assets | [removed: 286,602] [added: 267,638] | | | | [removed: 288,527] [added: 286,602] | | |
| Marketable securities available for sale | [removed: 9,567] [added: 11,016] | | | | [removed: 8,751] [added: 9,567] | | |
| Other investments | [removed: 10,958] [added: 10,920] | | | | [removed: 11,033] [added: 10,958] | | |
| Property and equipment, net | [removed: 38,208] [added: 45,122] | | | | [removed: 36,677] [added: 38,208] | | |
| Goodwill | [removed: 814,750] [added: 798,415] | | | | [removed: 779,928] [added: 814,750] | | |
| Intangible assets, net | [removed: 47,321] [added: 33,619] | | | | [removed: 47,914] [added: 47,321] | | |
| Deferred income taxes | [removed: 15,196] [added: 47,598] | | | | [removed: 13,061] [added: 15,196] | | |
| Other assets | [removed: 7,561] [added: 6,724] | | | | [removed: 6,407] [added: 7,561] | | |
| Total assets | $ | [removed: 1,230,163] [added: 1,221,052] | | | $ | [removed: 1,192,298] [added: 1,230,163] | |
| Accounts payable | $ | [removed: 19,852] [added: 22,952] | | | $ | [removed: 22,000] [added: 19,852] | |
| Accrued compensation and employee benefits | [removed: 54,368] [added: 71,216] | | | | [removed: 56,650] [added: 54,368] | | |
| Other accrued liabilities | [removed: 30,958] [added: 27,780] | | | | [removed: 36,235] [added: 30,958] | | |
| Deferred revenue | [removed: 46,697] [added: 47,129] | | | | [removed: 56,519] [added: 46,697] | | |
| Current maturities on debt | [removed: 92,000] [added: 77,000] | | | | [removed: 170,000] [added: 92,000] | | |
| Total current liabilities | [removed: 243,875] [added: 246,077] | | | | [removed: 341,404] [added: 243,875] | | |
| Long-term debt | [removed: 516,000] [added: 494,000] | | | | [removed: 376,000] [added: 516,000] | | |
| Other liabilities | [removed: 33,290] [added: 34,147] | | | | [removed: 20,280] [added: 33,290] | | |
| Total liabilities | [removed: 793,165] [added: 774,224] | | | | [removed: 737,684] [added: 793,165] | | |
| Common stock ($0.01 par value; 200,000 shares authorized, 88,857 shares issued and [removed: 31,290] [added: 30,935] and [removed: 32,047] [added: 31,290] shares outstanding at September 30, [removed: 2015] [added: 2016] and September 30, [removed: 2014,] [added: 2015,] respectively) | [removed: 313] [added: 309] | | | | [removed: 320] [added: 313] | | |
| Paid-in-capital | [removed: 1,152,789] [added: 1,185,076] | | | | [removed: 1,129,317] [added: 1,152,789] | | |
| Treasury stock, at cost [removed: (57,567] [added: (57,922] and [removed: 56,810] [added: 57,567] shares at September 30, [removed: 2015] [added: 2016] and September 30, [removed: 2014,] [added: 2015,] respectively) | [removed: (2,033,644] [added: (2,136,760] | | ) | | [removed: (1,936,095] [added: (2,033,644] | | ) |
| Retained earnings | [removed: 1,368,255] [added: 1,475,214] | | | | [removed: 1,284,261] [added: 1,368,255] | | |
| Accumulated other comprehensive loss | [removed: (50,715] [added: (77,011] | | ) | | [removed: (23,189] [added: (50,715] | | ) |
| Total stockholders’ equity | [removed: 436,998] [added: 446,828] | | | | [removed: 454,614] [added: 436,998] | | |
| Total liabilities and stockholders’ equity | $ | [removed: 1,230,163] [added: 1,221,052] | | | $ | [removed: 1,192,298] [added: 1,230,163] | |
[removed: See accompanying notes to consolidated financial statements.][added: NOTES TO CONSOLIDATED FINANCIAL STATEMENTS]
| | [removed: 2015] [added: 2016] | | | | [removed: 2014] [added: 2015] | | | | [removed: 2013] [added: 2014] | | |
| Transactional and maintenance | $ | [removed: 564,232] [added: 605,919] | | | $ | [removed: 527,563] [added: 564,232] | | | $ | [removed: 514,304] [added: 527,563] | |
| Professional services | [removed: 151,773] [added: 169,738] | | | | [removed: 149,834] [added: 151,773] | | | | [removed: 135,194] [added: 149,834] | | |
| License | [removed: 122,776] [added: 105,699] | | | | [removed: 111,588] [added: 122,776] | | | | [removed: 93,946] [added: 111,588] | | |
| Total revenues | [removed: 838,781] [added: 881,356] | | | | [removed: 788,985] [added: 838,781] | | | | [removed: 743,444] [added: 788,985] | | |
| Cost of revenues (1) | [removed: 270,535] [added: 265,173] | | | | [removed: 249,281] [added: 270,535] | | | | [removed: 229,468] [added: 249,281] | | |
| November 10, 2016 |
| | 2016 | | | | 2015 | | |
See accompanying notes.
See accompanying notes.
| Repurchases of common stock | (1,335 | ) | | (14 | | ) | | — | | | | (138,385 | | ) | | — | | | | — | | | | (138,399 | | ) |
| Balance at September 30, 2016 | 30,935 | | | $ | 309 | | | $ | 1,185,076 | | | $ | (2,136,760 | ) | | $ | 1,475,214 | | | $ | (77,011 | ) | | $ | 446,828 | |
See accompanying notes.
See accompanying notes.
Years Ended September 30, 2016, 2015 and 2014
Years Ended September 30, 2016, 2015 and 2014
Years Ended September 30, 2016, 2015 and 2014
For fiscal 2016 and 2015, we performed a step zero qualitative analysis for our annual assessment of goodwill impairment.
There was a substantial excess of fair value over carrying value for each of our reporting units and we determined goodwill was not impaired for any of our reporting units.
Years Ended September 30, 2016, 2015 and 2014
Years Ended September 30, 2016, 2015 and 2014
Years Ended September 30, 2016, 2015 and 2014
Years Ended September 30, 2016, 2015 and 2014
New Accounting Pronouncements
In November 2015, the Financial Accounting Standards Board (“FASB”) issued ASU No. 2015-17, “Income Taxes (Topic 740): Balance Sheet Classification of Deferred Taxes” (“ASU 2015-17”).
ASU 2015-17 simplifies the presentation of deferred income taxes and requires that deferred tax liabilities and assets be classified as noncurrent in a classified statement of financial position.
ASU 2015-17 applies to all entities that present a classified statement of financial position.
ASU 2015-17 may be applied either prospectively to all deferred tax liabilities and assets or retrospectively to all periods presented.
ASU 2015-17 is effective for fiscal years and interim periods within those fiscal years beginning after December 15, 2016.
We elected to early adopt the standard prospectively as of March 31, 2016, which did not have a significant impact on our consolidated financial statements.
Years Ended September 30, 2016, 2015 and 2014
Recent Accounting Pronouncements Not Yet Adopted
In October 2016, the FASB issued ASU No. 2016-16, “Income Taxes (Topic 740): Intra-Entity Transfers of Assets Other Than Inventory” (“ASU 2016-16”).
ASU 2016-16 requires an entity to recognize the income tax consequences of an intra-entity transfer of an asset other than inventory when the transfer occurs.
The guidance is effective for fiscal years and interim periods beginning after December 15, 2017, which means it will be effective for our fiscal year beginning October 1, 2018.
ASU 2016-16 should be applied on a modified retrospective basis through a cumulative-effect adjustment directly to retained earnings at the beginning of the period of adoption.
Early adoption is permitted in the first interim period of an entity's annual financial statements.
We are currently evaluating the timing of our adoption and the impact that the updated standard will have on our consolidated financial statements.
In March 2016, the FASB issued ASU No. 2016-09, “Compensation - Stock Compensation (Topic 718): Improvements to Employee Share-Based Payment Accounting” (“ASU 2016-09”).
ASU 2016-09 simplifies several aspects of the accounting for share-based payment transactions, including the income tax consequences, classification of awards as either equity or liabilities, and classification on the statement of cash flows.
ASU 2016-09 is effective for fiscal years and interim periods within those fiscal years beginning after December 15, 2016, which means it will be effective for our fiscal year beginning October 1, 2017.
We plan to early adopt ASU 2016-09 on a prospective basis in the first quarter of our fiscal 2017 (the quarter ended December 31, 2016), which is expected to have an impact on the recording of excess tax benefits and deficiencies in our consolidated balance sheets and consolidated statements of income and comprehensive income, as well as our operating and financing cash flows on our consolidated statements of cash Flows.
The magnitude of such impact is dependent upon our future grants of stock-based compensation, our future stock price in relation to the fair value of awards on grant date and the exercise behavior of the our stock option holders.
In February 2016, the FASB issued ASU No. 2016-02, “Leases (Topic 842)” (“ASU 2016-02”), which requires lessees to put most leases on their balance sheets but recognize the expenses on their income statements in a manner similar to current practice.
ASU 2016-02 states that a lessee would recognize a lease liability for the obligation to make lease payments and a right-to-use asset for the right to use the underlying asset for the lease term.
ASU 2016-02 is effective for fiscal years and interim periods within those fiscal years beginning after December 15, 2018, which means it will be effective for our fiscal year beginning October 1, 2019.
| November 10, 2015 |
| | | | | | | | | | | | |
| --- | --- | --- | --- | --- | --- | --- | --- | --- | --- | --- | --- |
| Balance at September 30, 2012 | 34,839 | | | $ | 348 | | | $ | 1,103,611 | | | $ | (1,718,570 | ) | | $ | 1,104,825 | | | $ | (15,808 | ) | | $ | 474,406 | |
| Repurchases of common stock | (1,695 | ) | | (17 | | ) | | — | | | | (84,876 | | ) | | — | | | | — | | | | (84,893 | | ) |
| Net amortization of premium on marketable securities | — | | | | — | | | | 8 | | |
| Proceeds from maturities of marketable securities | — | | | | — | | | | 22,000 | | |
| Unsettled repurchases of common stock | $ | — | | | $ | — | | | $ | 2,141 | |
For fiscal 2015, we began our assessment with the step zero qualitative analysis because the fair value substantially exceeded the carrying value for each of our reporting units in our fiscal 2014 step one analysis.
TONBELLER is an innovative provider of financial crime and compliance (“FCC”) solutions that support the demanding regulatory compliance requirements of more than a thousand banks and commercial organizations.
This acquisition allows us to capitalize on the escalating demand for new, risk-based, integrated FCC solutions.
The major classes of assets and liabilities to which we have preliminarily allocated the purchase price are as follows:
| | | | | |
| --- | --- | --- | --- | --- |
| Consideration | | | | |
| Cash | | $ | 59,632 | |
| Acquisition-related costs (included in the Company’s consolidated statement of income for the year ended September 30, 2015 as a component of restructuring and acquisition-related expenses) | | $ | 763 | |
| Recognized amounts of identifiable assets acquired and liabilities assumed | | | | |
| Accounts receivable, net | | 5,331 | | |
| Prepaid expenses and other current assets | | 209 | | |
| Completed technology | | 2,700 | | |
| Customer relationships | | 11,600 | | |
| Trade names | | 600 | | |
| Other assets | | 112 | | |
| Accounts payable | | (1,118 | | ) |
| Accrued compensation and employee benefits | | (1,514 | | ) |
| Deferred income taxes | | (4,349 | | ) |
| Total identifiable net assets | | 13,483 | | |
| Goodwill | | 46,149 | | |
| Total | | $ | 59,632 | |
The goodwill of $46.1 million arising from the acquisition consists largely of the revenue synergies related to market expansion and more rapid innovation for our solutions.
The final purchase price allocation is subject to the completion of the final valuation of the accounts receivables acquired, which is expected to be completed as soon as is practicable but no later than January 12, 2016, and will not have a material impact on the preliminary purchase price allocation disclosed above.
In fiscal 2013, we acquired 100% of the ownership interest of CR Software, LLC for $29.6 million in cash.
We recorded $16.5 million of intangible assets, which are being amortized using the straight-line method over a weighted average useful life of approximately 8.8 years.
The goodwill of $13.7 million was allocated to our Applications segment and was not deductible for tax purposes.
We also acquired 100% of the common stock of Infoglide Software, Inc. (“Infoglide”) for $4.4 million in cash.
| Non-U.S. money market funds | — | | | | — | | | | — | | | | 9,887 | | | | — | | | | 9,887 | | |
| Cash equivalents (1) | $ | 10,326 | | | $ | 10,326 | |
| Total | $ | 19,077 | | | $ | 19,077 | |
| | | (In thousands) | | | | | | | | | |
An excerpt. Shown here: 40 of 348 rewritten, 40 of 159 added and 40 of 114 removed. The counts are complete. For every sentence, read Item 8. Financial Statements and Supplementary Data in the FY2016 filing and the FY2015 filing.
Item 9A. Controls and Procedures
4 rewritten, 0 added, 0 removed, 7 unchanged
No change in FICO’s internal control over financial reporting was identified in connection with the evaluation required by Rule 13a-15(d) of the Exchange Act that occurred during the year ended September 30, [removed: 2015,] [added: 2016,] that has materially affected, or is reasonably likely to materially affect, FICO’s internal control over financial reporting.
Under the supervision and with the participation of management, including our CEO and CFO, we conducted an evaluation of the effectiveness of our internal control over financial reporting as of September 30, [removed: 2015] [added: 2016] based on the guidelines established in [removed: 2013] Internal Control – Integrated Framework [added: (2013)] issued by the Committee of Sponsoring Organizations of the Treadway Commission.
Based on this evaluation management has concluded that our internal control over financial reporting was effective as of September 30, [removed: 2015.][added: 2016.]
Deloitte & Touche LLP, an independent registered public accounting firm that audited the consolidated financial statements included in this Annual Report on Form 10-K, has also audited the effectiveness of our internal control over financial reporting as of September 30, [removed: 2015,] [added: 2016,] as stated in their attestation report included in Part II, Item 8 of this Annual Report on Form 10-K.
Item 10. Directors, Executive Officers and Corporate Governance
11 rewritten, 0 added, 0 removed, 16 unchanged
The required information regarding our Directors is incorporated by reference from the information under the caption “Director Nominees” in our definitive proxy statement for the Annual Meeting of Stockholders to be held on February [removed: 24, 2016.][added: 14, 2017.]
| William J. Lansing | January 2012-present, Chief Executive Officer and member of the Board of Directors of the Company. February 2009-November 2010, Chief Executive Offer and President, Infospace, Inc. 2004-2007, Chief Executive Officer and President, ValueVision Media, Inc. 2001-2003, General Partner, General Atlantic LLC. 2000-2001, Chief Executive Officer, NBC Internet, Inc. 1998-2000, President/Chief Executive Officer, Fingerhut Companies, Inc. 1996-1998, Vice President, Corporate Business Development, General Electric Company. 1996, Executive Vice President, Chief Operating Office, Prodigy, Inc. 1986-1995, various positions, McKinsey & Company, Inc. | [removed: 57] [added: 58] |
| Michael J. Pung | November 2010-present, Executive Vice President and Chief Financial Officer of the Company. August 2004-November 2010, Vice President, Finance of the Company. 2000-2004, Vice President and Controller, Hubbard Media Group, LLC. 1999-2000, Controller, Capella Education, Inc. 1998-1999, Controller, U.S. Satellite Broadcasting, Inc. 1992-1998, various financial management positions with Deluxe Corporation. 1985-1992, various audit positions, including audit manager, at Deloitte & Touche LLP. | [removed: 52] [added: 53] |
| Richard S. Deal | August 2007-present, Senior Vice President, Chief Human Resources Officer of the Company. January 2001-July 2007, Vice President, Human Resources of the Company. 1998-2001, Vice President, Human Resources, Arcadia Financial, Ltd. 1993-1998, managed broad range of human resources corporate and line consulting functions with U.S. Bancorp. | [removed: 48] [added: 49] |
| Wayne Huyard | November 2014-present, Executive Vice President of Sales, Services, and Marketing of the Company. January 2014-November 2014, Consultant to the Chief Executive Officer of the Company. September 2012-November 2014, Chief Executive Officer and President, TEXbase, Inc. March 2012-May 2012, General Manager of RightNow Technologies, Oracle Corporation. July 2010-February 2012, President and Chief Operating Officer, RightNow Technologies, Inc. May 2006-May 2010, Operations and Advisory Group Executive Leadership Team Member, Cerberus Capital Management L.P. | [removed: 56] [added: 57] |
| Michael S. Leonard | November 2011-present, Vice President, Chief Accounting Officer of the Company. November 2007-November 2011, Senior Director, Finance of the Company. July 2000-November 2007, Director, Finance of the Company. 1998-2000, Controller of Natural Alternatives International, Inc. 1994-1998, various audit staff positions at KPMG LLP. | [removed: 50] [added: 51] |
| Mark R. Scadina | February 2009-present, Executive Vice President and General Counsel and Corporate Secretary of the Company. June 2007-February 2009, Senior Vice President and General Counsel and Corporate Secretary of the Company. 2003-2007, various senior positions including Executive Vice President, General Counsel and Corporate Secretary, Liberate Technologies, Inc. 1999-2003, various leadership positions including Vice President and General Counsel, Intertrust Technologies Corporation. 1994-1999, Associate, Pennie and Edmonds LLP. | [removed: 46] [added: 47] |
| James M. Wehmann | April 2012-present, Executive Vice President, Scores of the Company. November 2003-March 2012, Vice President/Senior Vice President, Global Marketing, Digital River, Inc. March 2002-June 2003, Vice President, Marketing, Brylane, Inc. September 2000-March 2002, Senior Vice President, Marketing, New Customer Acquisition, Bank One. 1993-2000, various roles, including Senior Vice President, Marketing, Fingerhut Companies, Inc. | [removed: 50] [added: 51] |
| Stuart C. Wells | April 2012-present, Executive Vice President, Chief Technology Officer of the Company. June 2010- April 2012, Head of Global Professional Services and Support of the Company (Consultant). February 2009-June 2010, CEO, and Chairman of the Board, ScaleMP. January 2007-January 2009, Senior Vice President and President, Avaya, Inc. April 2005-December 2006, Executive Vice President, Utility Computing, Sun Microsystems. | [removed: 59] [added: 60] |
The required information regarding compliance with Section 16(a) of the Securities Exchange Act is incorporated by reference from the information under the caption “Section 16(a) Beneficial Ownership Reporting Compliance” in our definitive proxy statement for the Annual Meeting of Stockholders to be held on February [removed: 24, 2016.][added: 14, 2017.]
The required information regarding the Company’s audit committee is incorporated by reference from the information under the caption “Board Meetings, Committees and Attendance” in our definitive proxy statement for the Annual Meeting of Shareholders to be held on February [removed: 24, 2016.][added: 14, 2017.]
Item 11. Executive Compensation
1 rewritten, 0 added, 0 removed, 0 unchanged
The information required by this Item is incorporated by reference from the information under the captions “Director Compensation for [removed: 2015,”] [added: 2016,”] “Executive Compensation,” and “Compensation Committee Interlocks and Insider Participation” in our definitive proxy statement for the Annual Meeting of Stockholders to be held on February [removed: 24, 2016.][added: 14, 2017.]
Item 12. Security Ownership of Certain Beneficial Owners and Management and Related Stockholder Matters
1 rewritten, 0 added, 0 removed, 0 unchanged
The information required by this Item is incorporated by reference from the information under the caption “Security Ownership Of Certain Beneficial Owners and Management” and “Executive Compensation Plan Information” in our definitive proxy statement for the Annual Meeting of Stockholders to be held on February [removed: 24, 2016.][added: 14, 2017.]
Item 13. Certain Relationships and Related Transactions, and Director Independence
1 rewritten, 0 added, 0 removed, 0 unchanged
The information required by this Item is incorporated by reference from the information under the caption “Certain Relationships and Related Transactions” in our definitive proxy statement for the Annual Meeting of Stockholders to be held on February [removed: 24, 2016.][added: 14, 2017.]
Item 14. Principal Accountant Fees and Services
1 rewritten, 0 added, 0 removed, 1 unchanged
The information required by this Item is incorporated by reference from the information under the caption “Ratification of Independent Registered Public Accounting Firm” in our definitive proxy statement for the Annual Meeting of Stockholders to be held on February [removed: 24, 2016.][added: 14, 2017.]
Item 15. Exhibits and Financial Statement Schedules
62 rewritten, 18 added, 5 removed, 221 unchanged
| [Report of independent registered public accounting [removed: firm](#sD56FA4B1486658A39BC3392D40704C8E)] [added: firm](#s691067C7519D5978A5AE25C8CCD02A29)] | [removed: [48](#sD56FA4B1486658A39BC3392D40704C8E)] [added: [48](#s691067C7519D5978A5AE25C8CCD02A29)] |
| [Consolidated balance sheets as of September 30, [removed: 2015] [added: 2016] and [removed: 2014](#sBE0B145E0A59579A97B34EDCC9AC33DA)] [added: 2015](#s18C5169A6F285EACB9A0A1CD323ACBB3)] | [removed: [49](#sBE0B145E0A59579A97B34EDCC9AC33DA)] [added: [49](#s18C5169A6F285EACB9A0A1CD323ACBB3)] |
| [Consolidated statements of income and comprehensive income for the years ended September 30, [removed: 2015, 2014] [added: 2016, 2015] and [removed: 2013](#sB3DC43B929DC5DE8A6FC5885A818354D)] [added: 2014](#sC298D6A6D2425E02B7D2161DA2E7A961)] | [removed: [50](#sB3DC43B929DC5DE8A6FC5885A818354D)] [added: [50](#sC298D6A6D2425E02B7D2161DA2E7A961)] |
| [Consolidated statements of stockholders’ equity for the years ended September 30, [removed: 2015, 2014] [added: 2016, 2015] and [removed: 2013](#sDB3A196096255DEB8ACCE41E8655C699)] [added: 2014](#s449723800F9F5A6F9DABCE252B5CE77C)] | [removed: [51](#sDB3A196096255DEB8ACCE41E8655C699)] [added: [51](#s449723800F9F5A6F9DABCE252B5CE77C)] |
| [Consolidated statements of cash flows for the years ended September 30, [removed: 2015, 2014] [added: 2016, 2015] and [removed: 2013](#s62E336659E9A597AA11236E7D5E0A3B0)] [added: 2014](#s855F616885FE55528275FA03785A077B)] | [removed: [52](#s62E336659E9A597AA11236E7D5E0A3B0)] [added: [52](#s855F616885FE55528275FA03785A077B)] |
| [Notes to consolidated financial [removed: statements](#sF9112DA7D8D852F5A322F23DD8D3977F)] [added: statements](#s613A63BC904456A792E6580D1FEAC091)] | [removed: [53](#sF9112DA7D8D852F5A322F23DD8D3977F)] [added: [53](#s613A63BC904456A792E6580D1FEAC091)] |
| [removed: 10.12] [added: 10.13] | Offer Letter entered into on May 29, 2007 with Mark R. Scadina. (Incorporated by reference to Exhibit 10.61 to the Company’s Form 10-K for the fiscal year ended September 30, 2008 (file no. 001-11689)) (1) |
| [removed: 10.13] [added: 10.14] | Letter Agreement dated January 24, 2012 by and between the Company and William J. Lansing. (Incorporated by reference to Exhibit 10.2 to the Company’s Form 8-K filed on January 26, 2012.) (1) |
| [removed: 10.14] [added: 10.15] | Letter Agreement dated February 6, 2012 by and between the Company and Michael Pung. (Incorporated by reference to Exhibit 10.1 to the Company’s Form 8-K filed on February 10, 2012.) (1) |
| [removed: 10.15] [added: 10.16] | Letter Agreement dated February 6, 2012 by and between the Company and Mark Scadina. (Incorporated by reference to Exhibit 10.3 to the Company’s Form 8-K filed on February 10, 2012.) (1) |
| [removed: 10.16] [added: 10.17] | Letter Agreement dated March 7, 2012 by and between the Company and James M. Wehmann. (Incorporated by reference to Exhibit 10.1 to the Company’s Form 10-Q for the quarter ended December 31, 2012.) (1) |
| [removed: 10.17] [added: 10.18] | Letter Agreement dated April 24, 2012 by and between the Company and Stuart C. Wells. (Incorporated by reference to Exhibit 10.2 to the Company’s Form 10-Q for the quarter ended December 31, 2012.) (1) |
| [removed: 10.18] [added: 10.19] | Letter Agreement dated November 5, 2014 by and between the Company and Wayne Huyard. (Incorporated by reference to the [removed: Company's] [added: Company’s] Form 10-Q for the quarter ended December 31, 2014.) (1) |
| [removed: 10.19] [added: 10.21] | Fair Isaac Corporation 2012 Long-Term Incentive [removed: Plan (incorporated] [added: Plan, as amended through February 24, 2016. (Incorporated] by reference to [removed: Appendix] [added: Exhibit] A of the Company’s definitive proxy statement for the [removed: 2012] [added: 2016] Annual Meeting of Stockholders, filed with the SEC on January [removed: 4, 2012.)] [added: 20, 2016.)] (1) |
| [removed: 10.20] [added: 10.22] | Form of Employee Non-Statutory Stock Option Agreement (U.S.) under the 2012 Long-Term Incentive Plan. (Incorporated by reference to Exhibit 10.2 to the Company’s Form 10-Q for the quarter ended March 31, 2012.) (1) |
| [removed: 10.21] [added: 10.23] | Form of Employee Restricted Stock Unit Award Agreement (U.S.) under the 2012 Long-Term Incentive Plan. (Incorporated by reference to Exhibit 10.3 to the Company’s Form 10-Q for the quarter ended March 31, 2012.) (1) |
| [removed: 10.22] [added: 10.24] | Form of Employee Non-Statutory Stock Option Agreement (International) under the 2012 Long-Term Incentive Plan. (Incorporated by reference to Exhibit 10.4 to the Company’s Form 10-Q for the quarter ended March 31, 2012.) (1) |
| [removed: 10.23] [added: 10.25] | Form of Employee Restricted Stock Unit Award Agreement (International) under the 2012 Long-Term Incentive Plan. (Incorporated by reference to Exhibit 10.5 to the Company’s Form 10-Q for the quarter ended March 31, 2012.) (1) |
| [removed: 10.24] [added: 10.26] | Form of Director Non-Statutory Stock Option Agreement under the 2012 Long-Term Incentive Plan. (Incorporated by reference to Exhibit 10.6 to the Company’s Form 10-Q for the quarter ended March 31, 2012.) (1) |
| [removed: 10.25] [added: 10.27] | Form of Director Restricted Stock Unit Award Agreement under the 2012 Long-Term Incentive Plan. (Incorporated by reference to Exhibit 10.7 to the Company’s Form 10-Q for the quarter ended March 31, 2012.) (1) |
| [removed: 10.26] [added: 10.28] | Form of Performance Share Unit Award Agreement (fiscal 2012 grants) under the 2012 Long-Term Incentive Plan. (Incorporated by reference to Exhibit 10.8 to the Company’s Form 10-Q for the quarter ended March 31, 2012.) (1) |
| [removed: 10.27] [added: 10.29] | Form of Performance Share Unit Award Agreement (fiscal 2013 grants) under the 2012 Long-Term Incentive Plan. (Incorporated by reference to Exhibit 10.3 to the Company’s Form 10-Q for the quarter ended December 31, 2012.) (1) |
| [removed: 10.28] [added: 10.30] | Form of Performance Share Unit Award Agreement (fiscal 2014 grants) under the 2012 Long-Term Incentive Plan. (Incorporated by reference to Exhibit 10.1 to the Company’s Form 10-Q for the quarter ended December 31, 2013.) (1) |
| [removed: 10.29*] [added: 10.31] | Form of Performance Share Unit Award Agreement (fiscal 2015 grants) under the 2012 Long-Term Incentive Plan. [added: (Incorporated by reference to Exhibit 10.29 to the Company’s Form 10-K for the fiscal year ended September 30, 2015.)] (1) |
| [removed: 10.30] [added: 10.33] | Form of Market Share Unit Agreement (fiscal 2014 grants) under the 2012 Long-Term Incentive Plan. (Incorporated by reference to Exhibit 10.2 to the Company’s Form 10-Q for the quarter ended December 31, 2013.) (1) |
| [removed: 10.31*] [added: 10.34] | Form of Market Share Unit Agreement (fiscal 2015 grants) under the 2012 Long-Term Incentive Plan. [added: (Incorporated by reference to Exhibit 10.31 to the Company’s Form 10-K for the fiscal year ended September 30, 2015.)] (1) |
| [removed: 10.32] [added: 10.36] | Amended and Restated Credit Agreement dated December 31, 2014 among the Company, Wells Fargo Securities, LLC, U.S. Bank National Association, and Wells Fargo Bank, National Association. (Incorporated by reference to Exhibit 10.1 to the Company’s Form 8-K filed on December 31, 2014.) |
| [removed: 10.33] [added: 10.37] | First Amendment to Amended and Restated Credit Agreement among the Company, Wells Fargo Bank, National Association as administrative agent and the lenders thereto dated as of April 16, 2015. (Incorporated by reference to the Exhibit 10.1 to the Company's Form 8-K filed on April 17, 2015) |
DATE: November 10, [removed: 2015][added: 2016]
| /s/ WILLIAM J. LANSING | Chief Executive Officer (Principal Executive Officer) and Director | November 10, [removed: 2015] [added: 2016] |
| /s/ MICHAEL J. PUNG | Executive Vice President and Chief Financial Officer (Principal Financial Officer) | November 10, [removed: 2015] [added: 2016] |
| /s/ MICHAEL S. LEONARD | Vice President and Chief Accounting Officer (Principal Accounting Officer) | November 10, [removed: 2015] [added: 2016] |
| /s/ A. GEORGE BATTLE | Director | November 10, [removed: 2015] [added: 2016] |
| /s/ GREG R. GIANFORTE | Director | November 10, [removed: 2015] [added: 2016] |
| /s/ BRADEN R. KELLY | Director | November 10, [removed: 2015] [added: 2016] |
| /s/ JAMES D. KIRSNER | Director | November 10, [removed: 2015] [added: 2016] |
| /s/ MARC F. MCMORRIS | Director | November 10, [removed: 2015] [added: 2016] |
| /s/ JOANNA REES | Director | November 10, [removed: 2015] [added: 2016] |
| /s/ DAVID A. REY | Director | November 10, [removed: 2015] [added: 2016] |
Annual Report On Form 10-K For The Fiscal Year Ended September 30, [removed: 2015][added: 2016]
| 10.12 | Form of Amendment to Management Agreement entered into with each of the Company’s executive officers. (Incorporated by reference to Exhibit 10.1 to the Company’s Form 10-Q for the quarter ended June 30, 2016.) (1) |
| 10.20 | Form of Amendment to Letter Agreement entered into with each of the Company’s executive officers. (Incorporated by reference to Exhibit 10.2 to the Company’s Form 10-Q for the quarter ended June 30, 2016.) (1) |
| 10.32 | Form of Performance Share Unit Award Agreement (fiscal 2016 grants) under the 2012 Long-Term Incentive Plan. (Incorporated by reference to Exhibit 10.1 to the Company’s Form 10-Q for the quarter ended December 31, 2015.) (1) |
| 10.35 | Form of Market Share Unit Award Agreement (fiscal 2016 grants) under the 2012 Long-Term Incentive Plan. (Incorporated by reference to Exhibit 10.2 to the Company’s Form 10-Q for the quarter ended December 31, 2015.) (1) |
| | |
| | |
| | |
| | |
| /s/ MARK W. BEGOR | Director | November 10, 2016 |
| Mark W. Begor | | |
| 10.12 | Form of Amendment to Management Agreement entered into with each of the Company’s executive officers. (Incorporated by reference to Exhibit 10.1 to the Company’s Form 10-Q for the quarter ended June 30, 2016.) | Incorporated by Reference |
| 10.20 | Form of Amendment to Letter Agreement entered into with each of the Company’s executive officers. (Incorporated by reference to Exhibit 10.2 to the Company’s Form 10-Q for the quarter ended June 30, 2016.) (1) | Incorporated by Reference |
| 10.32 | Form of Performance Share Unit Award Agreement (fiscal 2016 grants) under the 2012 Long-Term Incentive Plan. (Incorporated by reference to Exhibit 10.1 to the Company’s Form 10-Q for the quarter ended December 31, 2015.) (1) | Incorporated by Reference |
| 10.35 | Form of Market Share Unit Award Agreement (fiscal 2016 grants) under the 2012 Long-Term Incentive Plan. (Incorporated by reference to Exhibit 10.2 to the Company’s Form 10-Q for the quarter ended December 31, 2015.) (1) | Incorporated by Reference |
| | | |
| | | |
| | | |
| | | |
POWER OF ATTORNEY
KNOW ALL PERSONS BY THESE PRESENTS, that each person whose signature appears below constitutes and appoints Michael J.
Pung his attorney-in-fact, with full power of substitution, for him in any and all capacities, to sign any amendments to this Annual Report on Form 10-K and to file the same, with exhibits thereto and other documents in connection therewith, with the Securities and Exchange Commission, hereby ratifying and confirming all that said attorney-in-fact, or his substitute or substitutes, may do or cause to be done by virtue hereof.
| /s/ DUANE E. WHITE | Director | November 10, 2015 |
| Duane E. White | | |
An excerpt. Shown here: 40 of 62 rewritten, all 18 added and all 5 removed. The counts are complete. For every sentence, read Item 15. Exhibits and Financial Statement Schedules in the FY2016 filing and the FY2015 filing.