 filings.tools
Fair Isaac 10-K 2017-09-30
Filed 2017-11-09. 21 sections, 397K characters. Original on sec.gov · Markdown · JSON
Cover and table of contents
10-K 1 fico10-k2017.htm FICO 10-K 2017
UNITED STATES
SECURITIES AND EXCHANGE COMMISSION
Washington, D.C. 20549
Form 10-K
(Mark One)
| ý | ANNUAL REPORT PURSUANT TO SECTION 13 OR 15(d) OF THE SECURITIES EXCHANGE ACT OF 1934 |
For the fiscal year ended September 30, 2017
| o | TRANSITION REPORT PURSUANT TO SECTION 13 OR 15(d) OF THE SECURITIES EXCHANGE ACT OF 1934 [NO FEE REQUIRED] |
For the transition period from to
Commission File Number 1-11689
Fair Isaac Corporation
(Exact name of registrant as specified in its charter)
| Delaware | 94-1499887 | |
| (State or other jurisdiction of incorporation or organization) | (I.R.S. Employer Identification No.) |
| 181 Metro Drive, Suite 700 | ||
| San Jose, California | 95110-1346 | |
| (Address of principal executive offices) | (Zip Code) |
Registrant’s telephone number, including area code:
408-535-1500
Securities registered pursuant to Section 12(b) of the Act:
| (Title of Class) | (Name of each exchange on which registered) | |
| Common Stock, $0.01 par value per share | New York Stock Exchange, Inc. |
Securities registered pursuant to Section 12(g) of the Act:
None
Indicate by check mark if the registrant is a well-known seasoned issuer, as defined in Rule 405 of the Securities Act. Yes ý No o
Indicate by check mark if the registrant is not required to file reports pursuant to Section 13 or Section 15(d) of the Act. Yes o No ý
Indicate by check mark whether the registrant (1) has filed all reports required to be filed by Section 13 or 15(d) of the Securities Exchange Act of 1934 during the preceding 12 months (or for such shorter period that the registrant was required to file such reports), and (2) has been subject to such filing requirements for the past 90 days. Yes ý No o
Indicate by check mark whether the registrant has submitted electronically and posted on its corporate Web site, if any, every Interactive Data File required to be submitted and posted pursuant to Rule 405 of Regulation S-T during the preceding 12 months (or for such shorter period that the registrant was required to submit and post such files). Yes ý No o
Indicate by check mark if disclosure of delinquent filers pursuant to Item 405 of Regulation S-K is not contained herein, and will not be contained, to the best of registrant’s knowledge, in definitive proxy or information statements incorporated by reference in Part III of this Form 10-K or any amendment to this Form 10-K. ý
Indicate by check mark whether the registrant is a large accelerated filer, an accelerated filer, a non-accelerated filer, a smaller reporting company or an emerging growth company. See definitions of “large accelerated filer,” “accelerated filer,” “smaller reporting company,” and “emerging growth company” in Rule 12b-2 of the Exchange Act. (Check one):
| Large Accelerated Filer | ý | Accelerated Filer | o | ||
| Non-Accelerated Filer | o | Smaller Reporting Company | o | ||
| Emerging Growth Company | o |
If an emerging growth company, indicate by check mark if the registrant has elected not to use the extended transition period for complying with any new or revised financial accounting standards provided pursuant to Section 13(a) of the Exchange Act. o
Indicate by check mark whether the registrant is a shell company (as defined in Rule 12b-2 of the Exchange Act). Yes o No ý
As of March 31, 2017, the aggregate market value of the registrant’s common stock held by non-affiliates of the registrant was $2,637,371,198 based on the last transaction price as reported on the New York Stock Exchange on such date. This calculation does not reflect a determination that certain persons are affiliates of the registrant for any other purposes.
The number of shares of common stock outstanding on October 27, 2017 was 29,990,221 (excluding 58,866,562 shares held by the Company as treasury stock).
Items 10, 11, 12, 13 and 14 of Part III incorporate information by reference from the definitive proxy statement for the Annual Meeting of Stockholders to be held on February 28, 2018.
TABLE OF CONTENTS
FORWARD LOOKING STATEMENTS
Statements contained in this report that are not statements of historical fact should be considered forward-looking statements within the meaning of the Private Securities Litigation Reform Act of 1995. In addition, certain statements in our future filings with the Securities and Exchange Commission (“SEC”), in press releases, and in oral and written statements made by us or with our approval that are not statements of historical fact constitute forward-looking statements within the meaning of the Act. Examples of forward-looking statements include, but are not limited to: (i) projections of revenue, income or loss, earnings or loss per share, the payment or nonpayment of dividends, capital structure and other statements concerning future financial performance; (ii) statements of our plans and objectives by our management or Board of Directors, including those relating to products or services, research and development, and the sufficiency of capital resources; (iii) statements of assumptions underlying such statements, including those related to economic conditions; (iv) statements regarding business relationships with vendors, customers or collaborators, including the proportion of revenues generated from international as opposed to domestic customers; and (v) statements regarding products, their characteristics, performance, sales potential or effect in the hands of customers. Words such as “believes,” “anticipates,” “expects,” “intends,” “targeted,” “should,” “potential,” “goals,” “strategy,” and similar expressions are intended to identify forward-looking statements, but are not the exclusive means of identifying such statements. Forward-looking statements involve risks and uncertainties that may cause actual results to differ materially from those in such statements. Factors that could cause actual results to differ from those discussed in the forward-looking statements include, but are not limited to, those described in Item 1A of Part I, Risk Factors, below. The performance of our business and our securities may be adversely affected by these factors and by other factors common to other businesses and investments, or to the general economy. Forward-looking statements are qualified by some or all of these risk factors. Therefore, you should consider these risk factors with caution and form your own critical and independent conclusions about the likely effect of these risk factors on our future performance. Such forward-looking statements speak only as of the date on which statements are made, and we undertake no obligation to update any forward-looking statement to reflect events or circumstances after the date on which such statement is made to reflect the occurrence of unanticipated events or circumstances. Readers should carefully review the disclosures and the risk factors described in this and other documents we file from time to time with the SEC, including our reports on Forms 10-Q and 8-K to be filed by the Company in fiscal 2018.
PART I
Item 1. Business
GENERAL
Fair Isaac Corporation (NYSE: FICO) (together with its consolidated subsidiaries, the “Company,” which may also be referred to in this report as “we,” “us,” “our,” and “FICO”) provides products, solutions and services that enable businesses to automate, improve and connect decisions to enhance business performance. Our predictive analytics, which includes the industry-standard FICO® Score, and our decision management systems leverage the use of big data and mathematical algorithms to predict consumer behavior and power hundreds of billions of customer decisions each year.
We were founded in 1956 on the premise that data, used intelligently, can improve business decisions. Today, we help thousands of companies in over 100 countries use our decision management technology to target and acquire customers more efficiently, increase customer value, reduce fraud and credit losses, lower operating expenses, and enter new markets more profitably. Most leading banks and credit card issuers rely on our solutions, as do insurers, retailers, telecommunications providers, automotive companies, pharmaceutical companies, healthcare organizations, public agencies and organizations in other industries. We also serve consumers through online services that enable people to purchase and understand their FICO® Scores, the standard measure in the U.S. of consumer credit risk, empowering them to manage their financial health.
More information about us can be found on our principal website, www.fico.com. We make our Annual Report on Form 10-K, our Quarterly Reports on Form 10-Q and our Current Reports on Form 8-K, as well as amendments to those reports, available free of charge through our website as soon as reasonably practicable after we electronically file them with the SEC. References to our website addresses in this report are provided as a convenience and do not constitute an incorporation by reference. Information on our website is not part of this report.
PRODUCTS AND SERVICES
We use analytics to help businesses automate, improve and connect decisions across their enterprise, an approach we commonly refer to as decision management. Most of our solutions address customer engagement, including customer acquisition, customer onboarding, customer servicing and management, and customer protection. We also help businesses improve non-customer decisions such as transaction and claims processing. Our solutions enable users to make decisions that are more precise, consistent and agile, and that systematically advance business goals. This helps our clients to reduce the cost of doing business, increase revenues and profitability, reduce losses from risks and fraud, and increase customer loyalty.
Our Segments
We categorize our products and services into the following three operating segments:
| • | Applications. This segment includes pre-configured decision management applications designed for a specific type of business problem or process — such as marketing, account origination, customer management, fraud, collections and insurance claims management — as well as associated professional services. These applications are available to our customers as on-premises software, and many are available as hosted, software-as-a-service (“SaaS”) applications through the FICO® Analytic Cloud. |
| • | Scores. This segment includes our business-to-business scoring solutions and services, our business-to-consumer scoring solutions and services including myFICO® solutions for consumers, and associated professional services. Our scoring solutions give our clients access to analytics that can be easily integrated into their transaction streams and decision-making processes. Our scoring solutions are distributed through major credit reporting agencies worldwide, as well as services through which we provide our scores to clients directly. |
| • | Decision Management Software. This segment is composed of analytic and decision management software tools that clients can use to create their own custom decision management applications, our new FICO® Decision Management Suite, as well as associated professional services. These tools are available to our customers as on-premises software or through the FICO® Analytic Cloud. |
Segment revenues, operating income and related financial information for fiscal 2017, 2016 and 2015 are set forth in Note 17 to the accompanying consolidated financial statements.
Our Solutions
Our solutions involve four fundamental disciplines:
| • | Analytics, which include predictive analytics that identify risks and opportunities associated with individual customers, prospects and transactions, in order to detect patterns such as risk and fraud, as well as optimization analytics that are used to improve the design of decision logic or “strategies.” |
| • | Data management and transaction profiling that bring extensive consumer information to every decision. |
| • | Software such as decision management systems that implement business rules, models and decision strategies, often in a real-time environment, as well as software for managing customer engagement. |
| • | Consulting services that help clients make the most of investments in FICO applications, tools and scores in the shortest possible time. |
All of our solutions are designed to help businesses make decisions that are faster, more precise, more consistent and more agile, while reducing costs and risks incurred in making decisions. With the new FICO® Analytic Cloud, FICO® Decision Management Platform and FICO® Decision Management Suite, we now offer clients an increasing portfolio of applications, tools and services in the cloud, which they can use to create, customize, deploy and manage powerful analytic services.
Applications
We develop industry-tailored decision management applications, which apply analytics, data management and decision management software to specific business challenges and processes. Our applications primarily serve clients in the banking, insurance, telecommunications, healthcare, retail and public sectors. During fiscal 2017, we continued to expand our product offerings for the FICO® Analytic Cloud, resulting in increased sales opportunities by accommodating small to mid-size businesses that benefit from the affordability and simplicity of cloud-based solutions. Within our Applications segment, our fraud solutions accounted for 19%, 20% and 23% of total revenues in each of fiscal 2017, 2016 and 2015, respectively; our customer communication services accounted for 10%, 9% and 8% of total revenues for each of these periods, respectively; and our customer management solutions accounted for 8%, 9% and 9% of total revenues in each of these periods, respectively.
Marketing Applications
The chief offerings for marketing are our FICO® Analytic Offer Manager and FICO® Customer Dialogue Manager. These solutions offer a suite of products, capabilities and services designed to integrate the technology and analytic services needed to perform context-sensitive customer acquisition, cross-selling and retention programs and deliver mathematically optimized offers. Our marketing solutions enable companies that offer multiple products and use multiple channels (companies such as large financial institutions, consumer branded goods companies, pharmaceutical companies, retail merchants and hospitality companies) to execute more efficient and profitable customer interactions. Services offered in our marketing solutions include customer data integration services; services that enable real-time marketing through direct consumer interaction channels; campaign management and optimization services; interactive tools that automate the design, execution and collection of customer response data across multiple channels; and customer data collection, management and profiling services.
Originations Applications
We provide solutions that enable banks, credit unions, finance companies, alternative peer-to-peer and online lenders, auto lenders and other companies to automate and improve the processing of requests for credit or service. These solutions increase the speed and efficiency with which requests are handled, reduce losses and increase approval rates through analytics that assess applicant risk, and reduce the need for manual review by loan officers.
The latest version of our origination application, FICO® Origination Manager, is an application-to-decision processing solution, available both on premises and in the FICO® Analytic Cloud. Our other solutions include the web-based FICO® LiquidCredit® service, which is primarily focused on credit decisions and is offered largely to mid-tier banking institutions. We also offer custom and consortium-based credit risk and application fraud models.
Customer Management Applications
Our customer strategy management products and services enable businesses to automate and improve risk-based decisions for their existing customers. These solutions help businesses apply advanced analytics in account and customer decisions to increase portfolio revenue, decrease risk exposure and losses, and reduce customer attrition, while improving operational efficiencies.
We provide customer strategy management solutions for banking, telecommunications and retail. Our primary account and customer strategy management product is FICO® TRIAD® Customer Manager, a leading credit management system, available both on premises and in the FICO® Analytic Cloud. The solution is an adaptive control system, which enables businesses to rapidly adapt to changing business and internal conditions by designing and testing new strategies in a “champion/challenger” environment. The current version enables users to manage risk and communications at both the account and customer level from a single platform.
We market and sell FICO® TRIAD® Customer Manager software licenses, maintenance, consulting services, and strategy design and evaluation. Additionally, we provide TRIAD services and similar credit account management services through third-party credit card processors worldwide, including two of the largest processors in the U.S.
Fraud and Security Management Applications
Our fraud management products improve our clients’ profitability by predicting the likelihood a given transaction or customer account is experiencing fraud. Our fraud products analyze transactions in real time and generate recommendations for immediate action, which is critical to stopping third-party fraud, as well as first-party fraud and deliberate misuse of account privileges.
Our solutions are designed to detect and prevent a wide variety of fraud and risk types across multiple industries, including credit and debit payment card fraud; e-payment fraud; deposit account fraud; healthcare fraud; Medicaid and Medicare fraud; and property and casualty insurance claims fraud, including workers' compensation fraud. FICO fraud solutions protect financial institutions, insurance companies and government agencies from losses and damaged customer relationships caused by fraud and related criminal behavior.
Our leading fraud detection solution is the FICO® Falcon® Platform, recognized as a leader in global payment card fraud detection. The Falcon® Platform examines transaction, cardholder, account, customer, device and merchant data to detect a wide range of payment card fraud quickly and accurately utilizing artificial intelligence technology. It analyzes payment transactions in real time, assesses the risk of fraud in a fraud score, and provides the ability for user-defined variables and rules strategies to be used in conjunction with the fraud score to prevent fraud while expediting legitimate transactions. Adaptive analytics, a form of self-learning models, can also be employed to accelerate our customers’ response to evolving fraud tactics.
FICO® Fraud Predictor with Merchant Profiles is used in conjunction with the Falcon® Platform to improve fraud detection rates through the inclusion of merchant profiles, which is especially important for online transactions. Merchant profiles are built using fraud and transactional data that include characteristics revealing which merchants have a history of higher fraud volumes, and which purchase types and ticket sizes have most often been fraudulent at a particular merchant, among others.
In addition to our Falcon products, we offer a wide range of solutions focused on preventing and detecting a variety of financial crimes. FICO® Application Fraud Manager helps businesses prevent both first- and third-party fraud during the application process. By preventing fraud prior to account origination we help our customers avoid future losses as well as unnecessary collections costs. Separately, the FICO® Card Alert Service prevents ATM debit fraud by identifying counterfeit payment cards and reporting them to issuers. The service analyzes daily transactions from participating networks, and uses this data to identify common points of compromise and suspect cards most likely to incur fraud.
FICO® Insurance Fraud Manager uses advanced unsupervised predictive modeling techniques to detect health care claims fraud, abuse and errors as soon as unusual behavior patterns emerge. Insurance Fraud Manager is used by both public and private health care payers to detect and prevent fraud in both pre- and post-pay fraud investigation environments.
FICO offers a comprehensive modular set of compliance solutions to fight money-laundering, terrorist financing, and to fulfill custom requirements for governance, risk and compliance. These solutions are based on the acquisition of TONBELLER Aktiengesellschaft (“TONBELLER”) combined with FICO’s legacy fraud analytics, such as those used in the FICO® Falcon® Platform.
FICO’s cybersecurity products utilize predictive analytics to deliver enterprise-level risk assessments as well as prioritization of tactical cyber threat response. The FICO® Enterprise Security Score provides an empirically derived score that conveys the security posture of an organization and the likelihood of a material data breach in the next 12 months. The score is used to manage the cyber risk of an enterprise as well as risks introduced by trusted business partners. Separately, FICO® Falcon® Cybersecurity Analytics utilizes advanced streaming self-learning models to help organizations detect and remediate cyber attacks by reducing the dwell time between when an attack occurs and when it is recognized. These products can be used independently or together as part of a comprehensive cyber risk management program.
Collections & Recovery Applications
FICO® Debt Manager™ solution and FICO® PlacementsPlus® service automate the full cycle of collections and recovery, including early collections, late collections, asset disposal, agency placement, recovery, litigation, bankruptcy, asset management and residual balance recovery. PlacementsPlus service facilitates control over the distribution and management of accounts to agencies, attorneys, debt buyers and internal recovery departments. FICO Debt Management Solutions also include assessments, models and scores, predictive analytics, advanced customer engagement, optimization and speech analytics capabilities. FICO® Debt Manager™ is available both on premises and in the FICO® Analytic Cloud.
Customer Communication Services
FICO® Customer Communication Services provide customer engagement, fraud resolution, and collections solutions in the cloud. It enables leading financial services institutions, utilities, telecommunications firms, insurers, and other businesses to engage in automated two-way communications. It allows businesses to reach customers in real time using short message service (“SMS”), mobile applications, automated voice, email and other channels; resolve matters such as verification of suspicious credit or debit card transactions; request missed payments; and resolve customer service issues. FICO® Customer Communication Services, combined with FICO’s decision management applications, allow businesses to execute and resolve customer interactions while improving customer outcomes.
Analytic Services
We perform custom predictive, descriptive and decision modeling and related analytic projects for clients in multiple industries to address business processes across the customer life cycle. This work leverages our analytic methodologies and expertise to solve risk management and marketing challenges for a single business, using that business’s data and industry best practices to develop a highly customized solution. Most of this work falls under predictive analytics, decision analysis and optimization, which provide greater insight into customer preferences and future customer behavior. Within decision analysis and optimization, we apply data and proprietary algorithms to the design of customer treatment strategies.
Scores
Our FICO® Scores are used in the majority of U.S. credit decisions, by nearly all of the major banks, credit card organizations, mortgage lenders and auto loan originators. These credit scores, developed based on third-party data, provide a consistent and objective measure of an individual’s credit risk. Credit grantors use our FICO® Scores in a variety of ways: to prescreen candidates for marketing programs; to evaluate applicants for new credit; and to manage existing customer accounts. FICO® Score is a three-digit score ranging from 300-850. They are calculated by running data from the three U.S. national credit reporting agencies, Experian, TransUnion and Equifax, through one of several proprietary scoring models developed by FICO. Lenders generally pay the credit reporting agencies scoring fees based on usage, and the credit reporting agencies pay an associated fee to us. FICO® Score 9, the most recent version of the FICO® Score, was released in early fiscal 2015.
While the core FICO® Score is the foundation of our scoring portfolio, we offer a number of other broad-based scores, including several specific FICO® Industry Scores. We also develop various custom scores for our financial services clients. The FICO® Score XD expands the scorable population using alternative credit data. FICO® Score XD looks at public records and property data, and a consumer’s history with mobile, landline phone and cable payments, to generate scores on the same 300-850 scale as standard FICO® Scores. FICO® Score XD is available to lenders from LexisNexis Risk Solutions and Equifax.
Outside the U.S., we offer the FICO® Score for consumers, and in some cases for small and medium enterprises, through credit reporting agencies in 16 countries worldwide. We have installed client-specific versions of the FICO® Score in nine countries. Like FICO® Scores in the U.S., these scores help lenders in multiple countries leverage the FICO® Score’s predictive analysis to assess the risk of marketing prospects and credit applicants. FICO® Scores are in use or being implemented in 20 different countries across five continents outside the U.S.
We also have scoring systems for insurance underwriters and marketers. They use the same underlying statistical technology as our FICO® Scores, but are designed to predict applicant or policyholder insurance loss ratio for automobile or homeowners’ coverage. Our insurance scores are available in the U.S. and Canada. We license credit bureau scoring services and related consulting directly to users in banking through the FICO® PreScore® service for prescreening solicitation candidates.
We also provide FICO® Score based products, education and information on FICO® Scores to consumers. They are distributed directly by us through our myFICO® service and through licensed distribution partners, including Experian and certain lenders, for use in customer and noncustomer programs.
The myFICO® products and subscription offerings are available online at www.myfico.com. Consumers can use the myFICO.com website to purchase their FICO® Scores, including credit reports associated with the scores, explanations of the factors affecting their scores, and customized information on how to manage their scores. We make available the 28 most widely used versions of the FICO® Score from the three major U.S. credit bureaus through our myFICO® service, representing approximately 95% of all FICO® Scores sold and used by lenders. Customers can use products to simulate how taking specific actions would affect their FICO® Score. Consumers can also subscribe to monitoring services, which deliver alerts via email and text when changes to a user’s FICO® Scores or other credit report content are detected. In addition, consumers can purchase identity theft monitoring products that alert consumers of potential risks of identity fraud with comprehensive detection and identity restoration services.
Decision Management Software
We provide analytic and decision management platforms and tools that businesses use to build their own tailored, analytically powered decision management applications on-premises, within the FICO® Analytic Cloud or via third-party cloud environments such as Amazon Web Services. In contrast to our packaged applications developed for specific industry solutions, our tools platform adds scalable and flexible decision management capabilities to virtually any application or operational system. These tools are sold as licensed software, and can be used standalone, or in conjunction with third-party solutions to advance a client’s decision management initiatives. We use these tools as common software components for our own decision management solutions, described above in the Applications section. They are also key components of our decision management architecture. We also partner with third-party providers within given industry markets and with major software companies to embed our tools within existing applications.
During fiscal 2017, FICO continued to enhance the FICO® Decision Management Suite, a collection of tools for building, extending, deploying and scaling applications and solutions. The Decision Management Suite includes the FICO® Decision Management Platform, along with capabilities for building and customizing predictive analytic, decisioning, and optimization components and services; developing, orchestrating and publishing analytics-powered applications; and visualizing, analyzing and reporting data trends. The FICO® Decision Management Suite is available in the FICO® Analytic Cloud and on-premises; businesses can choose either or both deployments depending on their specific needs, IT environments and other factors. Recent upgrades and enhancements to the functionality in the suite include:
| • | FICO® Decision Management Platform, the fundamental backbone of the Suite, which dramatically improves performance, data interchange, model tracking and user collaboration; |
| • | FICO® Decision Management Streaming (formerly known as Data Management Integration Platform), which improves scale, performance and versatility; and |
| • | FICO® Decision Central™ (formerly known as Model Central), an analytic and decision model management tool, which expands its versatility and usability across a much broader range of implementations and use cases. |
The FICO® Decision Management Suite combines big data, predictive analytics and decision execution together in an easy-to-use development environment. It enables organizations to rapidly create innovative analytic applications; dramatically increase developer and business user productivity with support for a broad range of analytic and decision tools; and execute decisions in real time. It also empowers business analysts and other domain experts to modify systems in real time without IT involvement, providing organizations with the agility they need to rapidly respond to customer, regulatory and business changes.
The principal products offered are software tools for:
| • | Rules Management. The FICO® Blaze Advisor® decision rules management system is used to design, develop, execute and maintain rules-based business applications. The Blaze Advisor system enables business users to propose and preview the impact of changes to decisioning logic, to review and approve proposed changes, and commit those changes to production decisioning, all without demanding IT cycles. The Blaze Advisor system is sold as an end-user tool and is also the rules engine within several of our decision management applications. The Blaze Advisor system, available in six languages, is a multi-platform solution that: embeds rules management within existing applications; supports Web Services and service-oriented architecture, Java 2 Enterprise Edition platforms, Microsoft .NET and COBOL for z/OS mainframes; and is the first rules engine to support Java, .NET and COBOL deployment of the same rules. It also incorporates the exclusive Rete III rules execution technology, which improves the efficiency and speed with which the Blaze Advisor® system is able to process and execute complex, high-volume decision rules. FICO’s solution for rules management in the cloud is called FICO® Decision Modeler. |
| • | Predictive Modeling. FICO® Decision Central™ is a comprehensive offering to help banks and other organizations, including insurance, retail and health care companies, maximize the power of their predictive and decision models and meet stricter regulations for model management. It complements FICO® Model Builder, which enables the user to develop and deploy sophisticated predictive models for use in automated decisions. This software is based on the methodology and tools FICO uses to build both client-level and industry-level predictive models and scorecards, which we have developed over more than 40 years, and includes additional algorithms for rapidly discovering variable relationships, predictive interactions and optimal segmentation. The predictive models produced can be embedded in custom production applications or one of our Decision Management applications and can also be executed in the FICO® Blaze Advisor® system. FICO’s solution set for predictive modeling in the cloud is called FICO® Analytic Modeler. |
| • | Optimization. FICO® Xpress Optimization Suite provides operations research professionals with world-class solvers and high-productivity tools to quickly design and deliver custom, mathematically optimal solutions for a wide range of industry problems. Xpress includes a powerful modeling and programming language, with robust scalability, to quickly model and solve even the largest optimization problems. Xpress tools are licensed to end users, consultants and independent software vendors in several industries, and are a core component within FICO® Decision Optimizer. Decision Optimizer is a software tool that enables complex, large-scale optimizations involving dozens of networked action-effect models, and enables exploration and simulation of many optimized scenarios along an efficient frontier of options. The data-driven strategies produced by these tools can be executed by the FICO® Blaze Advisor® system or one of our Decision Management applications. FICO’s solution for executing optimization services in the cloud is called FICO® Optimization Modeler. |
COMPETITION
The market for our advanced solutions is intensely competitive and is constantly changing. Our competitors vary in size and in the scope of the products and services they offer. We encounter competition from a number of sources, including:
| • | in-house analytic and systems developers; |
| • | scoring model builders; |
| • | enterprise resource planning and customer relationship management packaged solutions providers; |
| • | business intelligence solutions providers; |
| • | business process management and decision rules management providers; |
| • | providers of credit reports and credit scores; |
| • | providers of automated application processing services; |
| • | data vendors; |
| • | neural network developers and artificial intelligence system builders; |
| • | third-party professional services and consulting organizations; |
| • | providers of account/workflow management software; |
| • | software companies supplying modeling, rules, or analytic development tools; collections and recovery solutions providers; entity resolution and social network analysis solutions providers; and |
| • | providers of cloud-based customer engagement and risk management solutions. |
We believe our competitors are unable to provide the mix of products, expertise in predictive analytics and their integration with decision management software, and enhanced customer management capabilities we are able to deliver. However, certain competitors may have larger shares of particular geographic or product markets than we do.
Applications
The competition for our Applications varies by both application and industry.
In the marketing services market, we compete with Acxiom, Epsilon, Equifax, Experian, Harte-Hanks, InfoUSA, KnowledgeBase, Merkle and TargetBase, among others. We also compete with traditional advertising agencies and companies’ internal information technology and analytics departments.
In the customer origination market, we compete with Experian, Equifax, and CGI, among others.
In the customer strategy management market, we compete with Experian, among others.
In the fraud management market for banking, we compete primarily with Actimize, a division of NICE Systems, Experian, Detica, a division of BAE, SAS and ACI Worldwide. In the fraud solutions market for health care insurance, we compete with Emdeon, OptumInsight, ViPS, MedStat, Detica, a division of BAE, SAS, Verisk Analytics and IBM. Verisk Analytics and SAS also compete in the property and casualty insurance claims fraud market.
In the collections and recovery market, we compete with both outside suppliers and in-house scoring and computer systems departments for software and ASP servicing. Major competitors include CGI, Experian, and various boutique firms, along with the three major U.S. credit reporting agencies and Experian-Scorex for scoring and optimization projects.
Scores
In this segment, we compete with both outside suppliers and in-house analytics departments for scoring business. Primary competitors among outside suppliers of scoring models are the three major credit reporting agencies in the U.S. and Canada, which are also our partners in offering our scoring solutions, Experian, TransUnion and TransUnion International, Equifax, and VantageScore (a joint venture entity established by the major U.S. credit reporting agencies). Additional competitors include CRIF and other credit reporting agencies outside the U.S., and other data providers like LexisNexis and ChoicePoint, some of which also represent FICO partners.
For our direct-to-consumer services that deliver credit scores, credit reports and consumer credit education services, we compete with other direct to consumer credit and identity services.
Decision Management Software
Our primary competitors in this segment include IBM, SAS, Pegasystems and Angoss.
Competitive Factors
We believe the principal competitive factors affecting our markets include: technical performance; access to unique proprietary databases; availability in SaaS format; product attributes like adaptability, scalability, interoperability, functionality and ease-of-use; product price; customer service and support; the effectiveness of sales and marketing efforts; existing market penetration; and reputation. Although we believe our products and services compete favorably with respect to these factors, we may not be able to maintain our competitive position against current and future competitors.
MARKETS AND CUSTOMERS
Our products and services serve clients in multiple industries, including primarily banking, insurance, retail, healthcare and public agencies. End users of our products include 98 of the 100 largest financial institutions in the U.S., and two-thirds of the largest 100 banks in the world. Our clients also include more than 700 insurers, including nine of the top ten U.S. property and casualty insurers; more than 400 retailers and general merchandisers, including more than one-third of the top 100 U.S. retailers; more than 150 government or public agencies; and more than 150 healthcare and pharmaceuticals companies, including seven of the world’s top ten pharmaceuticals companies. All of the top ten companies on the 2017 Fortune 500 list use FICO’s solutions. In addition, our consumer services are marketed to an estimated 200 million U.S. consumers whose credit relationships are reported to the three major U.S. credit reporting agencies.
In the U.S., we market our products and services primarily through our own direct sales organization that is organized around vertical markets. Sales groups are based in our headquarters and in field offices strategically located both in and outside the U.S. We also market our products through indirect channels, including alliance partners and other resellers.
Our scores are marketed and sold through credit reporting agencies. During fiscal 2017, 2016 and 2015, revenues generated from our agreements with Experian, TransUnion and Equifax collectively accounted for 20%, 19% and 16% of our total revenues, respectively.
Outside the U.S., we market our products and services primarily through our subsidiary sales organizations. Our subsidiaries license and support our products in their local countries as well as within other foreign countries where we do not operate through a direct sales subsidiary. We also market our products through resellers and independent distributors in international territories not covered by our subsidiaries' direct sales organizations.
Our largest market segments outside the U.S. are the United Kingdom and Canada. In addition, we have delivered products to users in more than 100 countries.
Revenues from international customers, including end users and resellers, amounted to 36%, 36% and 40% of our total revenues in fiscal 2017, 2016 and 2015, respectively. See Note 17 to the accompanying consolidated financial statements for a summary of our operating segments and geographic information.
TECHNOLOGY
We specialize in analytics software and decision management technologies that analyze data and drive decision strategies and customer engagement. We maintain active research in a number of fields for the purposes of deriving greater insight and predictive value from data, making various forms of data more usable and valuable to the model-building process, and automating and applying analytics to the various processes involved in making high-volume decisions in real time.
We are widely recognized as a leader in predictive analytics due to our pioneering work in credit scoring and fraud detection. We believe that our tools and processes are among the very best commercially available, and that we are uniquely able to integrate advanced analytic, software and data technologies into mission-critical business solutions that offer superior returns on investment.
In fiscal 2017, we continued to make progress with our FICO® Analytic Cloud and FICO® Decision Management Platform initiatives. We have made many of our software solutions, which were previously available only as on-premises software installations, into SaaS solutions hosted on our cloud. The FICO® Decision Management Suite enables clients to use FICO tools, along with rapid application development tools and visualization tools, to quickly develop their own decision management applications and services. We continue to add functionality to the platform as well as host additional FICO applications in the cloud. These ongoing initiatives are driven by enhancing our core technical capabilities listed below, and extending them through partnerships with other technology providers as well as through employing open source software.
Principal Areas of Expertise
Predictive Modeling. Predictive modeling identifies and mathematically represents underlying relationships in historical data in order to explain the data and make predictions or classifications about future events. Our models summarize large quantities of data to amplify its value. Predictive models typically analyze current and historical data on individuals to produce easily understood metrics such as scores. These scores rank-order individuals by likely future performance, e.g., their likelihood of making credit payments on time, or of responding to a particular offer for services. We also include in this category models that detect the likelihood of a transaction being fraudulent. Our predictive models are frequently operationalized in mission-critical transactional systems and drive decisions and actions in near real time. A number of analytic methodologies underlie our products in this area. These include proprietary applications of both linear and nonlinear mathematical programming algorithms, in which one objective is optimized within a set of constraints, and advanced neural systems, which learn complex patterns from large data sets to predict the probability that a new individual will exhibit certain behaviors of business interest. We also apply various related statistical techniques for analysis and pattern detection within large datasets, and have enhanced our abilities to derive insights and predictive variables from various forms of so-called big data, including unstructured data, such as text.
Decision Analysis and Optimization. Decision analysis refers to the broad quantitative field that deals with modeling, analyzing and optimizing decisions made by individuals, groups and organizations. Whereas predictive models analyze multiple aspects of individual behavior to forecast future behavior, decision analysis analyzes multiple aspects of a given decision to identify the most effective action to take to reach a desired result. We have developed an integrated approach to decision analysis that incorporates the development of a decision model that mathematically maps the entire decision structure; proprietary optimization technology that identifies the most effective strategies, given both the performance objective and constraints; the development of designed testing required for active, continuous learning; and the robust extrapolation of an optimized strategy to a wider set of scenarios than historically encountered. Our optimization capabilities also include a proprietary mathematical modeling and programming language, an easy-to-use development environment, and a state-of-the-art set of optimization algorithms.
Transaction Profiling. Transaction profiling is a patent-protected technique used to extract meaningful information and reduce the complexity of transaction data used in modeling. Many of our products operate using transactional data, such as credit card purchase transactions, or other types of data that change over time. In its raw form, this data is very difficult to use in predictive models for several reasons. First, an isolated transaction contains very little information about the behavior of the individual who generated the transaction. In addition, transaction patterns change rapidly over time. Finally, this type of data can often be highly complex. To overcome these issues, we have developed a set of techniques that transform raw transactional data into a mathematical representation that reveals latent information, and which make the data more usable by predictive models. This profiling technology accumulates data across multiple transactions of many types to create and update profiles of transaction patterns. These profiles enable our neural network models to efficiently and effectively make accurate assessments of, for example, fraud risk and credit risk within real-time transaction streams.
Customer Data Integration. Decisions made on customers or prospects can benefit from data stored in multiple sources, both inside and outside the enterprise. We have focused on developing data integration processes that are able to assemble and integrate those disparate data sources into a unified view of the customer or household, through the application of persistent keying technology. This data can include structured or unstructured data. Recent innovations include a solution that can integrate multiple data sources in real time and make them available for analysis and decisions.
Decision Management Software. In order to make a decision strategy operational, various steps and rules need to be programmed or exported into the business's software infrastructure, where they can communicate with front-end, customer-facing systems and back-end systems such as billing systems. We have developed software systems, sometimes known as decision engines and decision rules management systems, which perform the necessary functions to execute a decision strategy. Our software includes very efficient programs for these functions, facilitating, for example, business user definition of extremely complex decision strategies using graphical user interfaces; simultaneous testing of hundreds of decision strategies in “champion/challenger” (test/control) mode; high-volume processing and analysis of transactions in real time; integration of multiple data sources; and execution of predictive models for improved behavior forecasts and finer segmentation. Decision management software is an integral part of our decision management applications, described earlier.
Customer Engagement. We have advanced technology for customer engagement, which enables the execution of decisions and customer contact through SMS, email, automated voice, mobile applications and other channels. This technology enables FICO to extend decision management beyond the rendering of the decision to the final resolution with a customer, using the most effective method of communication for a given event and customer. Integrating this technology with our decision management systems has proven to decrease costs, improve staff efficiency, increase customer satisfaction and improve the return from marketing, fraud and collections activities.
Social Network Analysis. We have advanced technology for identity resolution and social network analysis, which enables users to understand the relationships between their organization, customers, events, and third-party actors. Businesses can perform real-time searches across their enterprise data to find, match, and link similar entities and uncover hidden relationship between people, places and things. This technology complements FICO’s capabilities in the area of fraud and marketing analytics.
Cybersecurity. We continue to seek projects in the cybersecurity and security information and event management space that leverage FICO’s streaming analytics, transaction profiling and unsupervised modeling technologies. These technologies include those successfully leveraged by our fraud management systems, including the FICO® Falcon® Platform, and new methods we believe to be unique approaches for detecting certain types of cyber security threats.
Research and Development Activities
Our research and development expenses were $110.9 million, $103.7 million and $98.8 million in fiscal 2017, 2016 and 2015, respectively. We believe that our future success depends on our ability to continually maintain and improve our core technologies, enhance our existing products, and develop new products and technologies that meet an expanding range of markets and customer requirements. In the development of new products and enhancements to existing products, we use our own development tools extensively.
We have traditionally relied primarily on the internal development of our products. Based on timing and cost considerations, however, we have acquired, and in the future may consider acquiring, technology or products from third parties.
PRODUCT PROTECTION AND TRADEMARKS
We rely on a combination of patent, copyright, trademark and trade secret laws and confidentiality agreements and procedures to protect our proprietary rights.
We retain the title to and protect the suite of models and software used to develop scoring models as a trade secret. We also restrict access to our source code and limit access to and distribution of our software, documentation and other proprietary information. We have generally relied upon the laws protecting trade secrets and upon contractual nondisclosure safeguards and restrictions on transferability to protect our software and proprietary interests in our product and service methodology and know-how. Our confidentiality procedures include invention assignment and proprietary information agreements with our employees and independent contractors, and nondisclosure agreements with our distributors, strategic partners and customers. We also claim copyright protection for certain proprietary software and documentation.
We have patents on many of our technologies and have patent applications pending on other technologies. The patents we hold may not be upheld as valid and may not prevent the development of competitive products. In addition, patents may never be issued on our pending patent applications or on any future applications that we may submit. We currently hold 166 U.S. and 17 foreign patents with 86 applications pending.
Despite our precautions, it may be possible for competitors or users to copy or reproduce aspects of our software or to obtain information that we regard as trade secrets. In addition, the laws of some foreign countries do not protect proprietary rights to the same extent as do the laws of the U.S. Patents and other protections for our intellectual property are important, but we believe our success and growth will depend principally on such factors as the knowledge, ability, experience and creative skills of our personnel, new products, frequent product enhancements and name recognition.
We have developed technologies for research projects conducted under agreements with various U.S. government agencies or their subcontractors. Although we have acquired commercial rights to these technologies, the U.S. government typically retains ownership of intellectual property rights and licenses in the technologies that we develop under these contracts. In some cases, the U.S. government can terminate our rights to these technologies if we fail to commercialize them on a timely basis. In addition, under U.S. government contracts, the government may make the results of our research public, which could limit our competitive advantage with respect to future products based on funded research.
We have used, registered and/or applied to register certain trademarks and service marks for our technologies, products and services. We currently have 36 trademarks registered in the U.S. and select foreign countries.
PERSONNEL
As of September 30, 2017, we employed 3,299 persons worldwide. Of these, 169 full-time employees were located in our San Jose, California office, 366 full-time employees were located in our San Diego, California office, 187 full-time employees were located in our San Rafael, California office, 186 full-time employees were located in our Roseville, Minnesota office, 130 full-time employees were located in our Fairfax, Virginia office, 786 full-time employees were located in our India-based offices and 344 full-time employees were located in our United Kingdom-based offices. None of our employees are covered by a collective bargaining agreement other than to the extent mandated by applicable law in certain foreign jurisdictions, and no work stoppages have been experienced.
Information regarding our executive officers is included in Item 10, Directors, Executive Officers and Corporate Governance, of this Annual Report on Form 10-K.
Item 1A. Risk Factors
Risks Related to Our Business
We continue to expand the pursuit of our Decision Management strategy, and we may not be successful, which could cause our growth prospects and results of operations to suffer.
We continue to expand the pursuit of our business objective to become a leader in helping businesses automate and improve decisions across their enterprises, an approach that we commonly refer to as Decision Management, or “DM.” Our DM strategy is designed to enable us to increase our business by selling multiple products to clients, as well as to enable the development of custom client solutions that may lead to opportunities to develop new proprietary scores or other new proprietary products. Our DM strategy is also increasingly focused on the delivery of our products through cloud-based deployments. The market may be unreceptive to our general DM business approach, including being unreceptive to purchasing multiple products from us, unreceptive to our customized solutions, or unreceptive to our cloud-based offerings. As we continue to pursue our DM strategy, we may experience volatility in our revenues and operating results caused by various factors, including differences in revenue recognition treatment between our cloud-based offerings and on-premise software licenses, the timing of investments and other expenditures necessary to develop and operate our cloud-based offerings, and the adoption of new sales and delivery methods. If our DM strategy is not successful, we may not be able to grow our business, growth may occur more slowly than we anticipate, or our revenues and profits may decline.
We derive a substantial portion of our revenues from a small number of products and services, and if the market does not continue to accept these products and services, our revenues will decline.
We expect that revenues derived from our scoring solutions, fraud solutions, customer communication services, customer management solutions and decision management software will continue to account for a substantial portion of our total revenues for the foreseeable future. Our revenues will decline if the market does not continue to accept these products and services. Factors that might affect the market acceptance of these products and services include the following:
| • | changes in the business analytics industry; |
| • | changes in technology; |
| • | our inability to obtain or use key data for our products; |
| • | saturation or contraction of market demand; |
| • | loss of key customers; |
| • | industry consolidation; |
| • | failure to successfully adopt cloud-based technologies; |
| • | failure to execute our selling approach; and |
| • | inability to successfully sell our products in new vertical markets. |
If we are unable to access new markets or develop new distribution channels, our business and growth prospects could suffer.
We expect that part of the growth that we seek to achieve through our DM strategy will be derived from the sale of DM products and service solutions in industries and markets we do not currently serve. We also expect to grow our business by delivering our DM solutions through additional distribution channels. If we fail to penetrate these industries and markets to the degree we anticipate utilizing our DM strategy, or if we fail to develop additional distribution channels, we may not be able to grow our business, growth may occur more slowly than we anticipate, or our revenues and profits may decline.
If we are unable to develop successful new products or if we experience defects, failures and delays associated with the introduction of new products, our business could suffer serious harm.
Our growth and the success of our DM strategy depend upon our ability to develop and sell new products or suites of products, including the development and sale of our cloud-based product offerings. If we are unable to develop new products, or if we are not successful in introducing new products, we may not be able to grow our business or growth may occur more slowly than we anticipate. In addition, significant undetected errors or delays in new products or new versions of products may affect market acceptance of our products and could harm our business, financial condition or results of operations. In the past, we have experienced delays while developing and introducing new products and product enhancements, primarily due to difficulties developing models, acquiring data, and adapting to particular operating environments or certain client or other systems. We have also experienced errors or “bugs” in our software products, despite testing prior to release of the products. Software errors in our products could affect the ability of our products to work with other hardware or software products, could delay the development or release of new products or new versions of products, and could adversely affect market acceptance of our products. Errors or defects in our products that are significant, or are perceived to be significant, could result in rejection of our products, damage to our reputation, loss of revenues, diversion of development resources, an increase in product liability claims, and increases in service and support costs and warranty claims.
We rely on relatively few customers, as well as our contracts with the three major credit reporting agencies, for a significant portion of our revenues and profits. Many of our customers are significantly larger than we are and may have greater bargaining power. The businesses of our largest customers depend, in large part, on favorable macroeconomic conditions. If these customers are negatively impacted by weak global economic conditions, global economic volatility or the terms of these relationships otherwise change, our revenues and operating results could decline.
Most of our customers are relatively large enterprises, such as banks, credit card processors, insurance companies, healthcare firms, telecommunications providers, retailers and public agencies. As a result, many of our customers and potential customers are significantly larger than we are and may have sufficient bargaining power to demand reduced prices and favorable nonstandard terms.
In addition, the U.S. and other key international economies have experienced in the past a downturn in which economic activity was impacted by falling demand for a variety of goods and services, restricted credit, poor liquidity, reduced corporate profitability, volatility in credit, equity and foreign exchange markets, bankruptcies and overall uncertainty with respect to the economy. The European Union (“E.U.”) continues to face great economic uncertainty which could impact the overall world economy or various other regional economies. The potential for economic disruption presents considerable risks to our business, including potential bankruptcies or credit deterioration of financial institutions with which we have substantial relationships. Such disruption could result in a decline in the volume of transactions that we execute for our customers.
We also derive a substantial portion of our revenues and operating income from our contracts with the three major credit reporting agencies, Experian, TransUnion and Equifax, and other parties that distribute our products to certain markets. The loss of or a significant change in a relationship with one of these credit reporting agencies with respect to their distribution of our products or with respect to our myFICO® offerings, the loss of or a significant change in a relationship with a major customer, the loss of or a significant change in a relationship with a significant third-party distributor (including credit card processors), or the delay of significant revenues from these sources, could have a material adverse effect on our revenues and results of operations.
We rely on relationships with third parties for marketing, distribution and certain services. If we experience difficulties in these relationships, our future revenues may be adversely affected.
Most of our products rely on distributors, and we intend to continue to market and distribute our products through existing and future distributor relationships. Our Scores segment relies on, among others, Experian, TransUnion and Equifax. Failure of our existing and future distributors to generate significant revenues, demands by such distributors to change the terms on which they offer our products, or our failure to establish additional distribution or sales and marketing alliances, could have a material adverse effect on our business, operating results and financial condition. In addition, certain of our distributors presently compete with us and may compete with us in the future, either by developing competitive products themselves or by distributing competitive offerings. For example, Experian, TransUnion and Equifax have developed a credit scoring product to compete directly with our products and are collectively attempting to sell the product. Competition from distributors or other sales and marketing partners could significantly harm sales of our products and services.
Our acquisition and divestiture activities may disrupt our ongoing business and may involve increased expenses, and we may not realize the financial and strategic goals contemplated at the time of a transaction.
We have acquired and expect to continue to acquire companies, businesses, products, services and technologies. Acquisitions involve significant risks and uncertainties, including:
| • | our ongoing business may be disrupted and our management’s attention may be diverted by acquisition, transition or integration activities; |
| • | an acquisition may not further our business strategy as we expected, we may not integrate acquired operations or technology as successfully as we expected or we may overpay for our investments, or otherwise not realize the expected return, which could adversely affect our business or operating results; |
| • | we may be unable to retain the key employees, customers and other business partners of the acquired operation; |
| • | we may have difficulties entering new markets where we have no or limited direct prior experience or where competitors may have stronger market positions; |
| • | our operating results or financial condition may be adversely impacted by claims or liabilities we assume from an acquired company, business, product or technology, including claims by government agencies, terminated employees, current or former customers, former stockholders or other third parties; pre-existing contractual relationships of an acquired company we would not have otherwise entered into; unfavorable revenue recognition or other accounting treatment as a result of an acquired company’s practices; and intellectual property claims or disputes; |
| • | we may fail to identify or assess the magnitude of certain liabilities or other circumstances prior to acquiring a company, business, product or technology, which could result in unexpected litigation or regulatory exposure, unfavorable accounting treatment, unexpected increases in taxes due, a loss of anticipated tax benefits or other adverse effects on our business, operating results or financial condition; |
| • | we may not realize the anticipated increase in our revenues from an acquisition for a number of reasons, including if a larger than predicted number of customers decline to renew their contracts, if we are unable to sell the acquired products to our customer base or if contract models of an acquired company do not allow us to recognize revenues on a timely basis; |
| • | we may have difficulty incorporating acquired technologies or products with our existing product lines and maintaining uniform standards, architecture, controls, procedures and policies; |
| • | our use of cash to pay for acquisitions may limit other potential uses of our cash, including stock repurchases, dividend payments and retirement of outstanding indebtedness; |
| • | to the extent we issue a significant amount of equity securities in connection with future acquisitions, existing stockholders may be diluted and earnings per share may decrease; and |
| • | we may experience additional or unexpected changes in how we are required to account for our acquisitions pursuant to U.S. generally accepted accounting principles, including arrangements we assume from an acquisition. |
We have also divested ourselves of businesses in the past and may do so again in the future. Divestitures involve significant risks and uncertainties, including:
| • | disruption of our ongoing business; |
| • | reductions of our revenues or earnings per share; |
| • | unanticipated liabilities, legal risks and costs; |
| • | the potential loss of key personnel; |
| • | distraction of management from our ongoing business; and |
| • | impairment of relationships with employees and customers as a result of migrating a business to new owners. |
Because acquisitions and divestitures are inherently risky, our transactions may not be successful and may have a material adverse effect on our business, results of operations, financial condition or cash flows. Acquisitions of businesses having a significant presence outside the U.S. will increase our exposure to the risks of conducting operations in international markets.
Charges to earnings resulting from acquisitions may adversely affect our operating results.
Under business combination accounting standards, we recognize the identifiable assets acquired and the liabilities assumed in acquired companies generally at their acquisition-date fair values and separately from goodwill. Goodwill is measured as the excess amount of consideration transferred, which is also generally measured at fair value, and the net of the amounts of the identifiable assets acquired and the liabilities assumed as of the acquisition date. Our estimates of fair value are based upon assumptions believed to be reasonable but which are inherently uncertain. After we complete an acquisition, the following factors could result in material charges and adversely affect our operating results and may adversely affect our cash flows:
| • | impairment of goodwill or intangible assets, or a reduction in the useful lives of intangible assets acquired; |
| • | amortization of intangible assets acquired; |
| • | identification of, or changes to, assumed contingent liabilities, both income tax and non-income tax related, after our final determination of the amounts for these contingencies or the conclusion of the measurement period (generally up to one year from the acquisition date), whichever comes first; |
| • | costs incurred to combine the operations of companies we acquire, such as transitional employee expenses and employee retention, redeployment or relocation expenses; |
| • | charges to our operating results to maintain certain duplicative pre-merger activities for an extended period of time or to maintain these activities for a period of time that is longer than we had anticipated, charges to eliminate certain duplicative pre-merger activities, and charges to restructure our operations or to reduce our cost structure; and |
| • | charges to our operating results resulting from expenses incurred to effect the acquisition. |
Substantially all of these costs will be accounted for as expenses that will decrease our net income and earnings per share for the periods in which those costs are incurred. Charges to our operating results in any given period could differ substantially from other periods based on the timing and size of our future acquisitions and the extent of integration activities. A more detailed discussion of our accounting for business combinations and other items is presented in the “Critical Accounting Policies and Estimates” section of Management’s Discussion and Analysis of Financial Condition and Results of Operations (Item 7).
Our reengineering initiative may cause our growth prospects and profitability to suffer.
As part of our management approach, we implemented an ongoing reengineering initiative designed to grow revenues through strategic resource allocation and improve profitability through cost reductions. Our reengineering initiative may not be successful over the long term as a result of our failure to reduce expenses at the anticipated level, or a lower, or no, positive impact on revenues from strategic resource allocation. If our reengineering initiative is not successful over the long term, our revenues, results of operations and business may suffer.
The occurrence of certain negative events may cause fluctuations in our stock price.
The market price of our common stock may be volatile and could be subject to wide fluctuations due to a number of factors, including variations in our revenues and operating results. We believe that you should not rely on period-to-period comparisons of financial results as an indication of future performance. Because many of our operating expenses are fixed and will not be affected by short-term fluctuations in revenues, short-term fluctuations in revenues may significantly impact operating results. Additional factors that may cause our stock price to fluctuate include the following:
| • | variability in demand from our existing customers; |
| • | failure to meet the expectations of market analysts; |
| • | changes in recommendations by market analysts; |
| • | the lengthy and variable sales cycle of many products, combined with the relatively large size of orders for our products, increases the likelihood of short-term fluctuation in revenues; |
| • | consumer or customer dissatisfaction with, or problems caused by, the performance of our products; |
| • | the timing of new product announcements and introductions in comparison with our competitors; |
| • | the level of our operating expenses; |
| • | changes in competitive and other conditions in the consumer credit, banking and insurance industries; |
| • | fluctuations in domestic and international economic conditions; |
| • | our ability to complete large installations, and to adopt and configure cloud-based deployments, on schedule and within budget; |
| • | acquisition-related expenses and charges; and |
| • | timing of orders for and deliveries of software systems. |
In addition, the financial markets have at various times experienced significant price and volume fluctuations that have particularly affected the stock prices of many technology companies and financial services companies, and these fluctuations sometimes have been unrelated to the operating performance of these companies. Broad market fluctuations, as well as industry-specific and general economic conditions, may negatively affect our business and require us to record an impairment charge related to goodwill, which could adversely affect our results of operations, stock price and business.
Our products have long and variable sales cycles. If we do not accurately predict these cycles, we may not forecast our financial results accurately, and our stock price could be adversely affected.
We experience difficulty in forecasting our revenues accurately because the length of our sales cycles makes it difficult for us to predict the quarter in which sales will occur. In addition, our selling approach is complex as we look to sell multiple products and services across our customers’ organizations. This makes forecasting of revenues in any given period more difficult. As a result of our sales approach and lengthening sales cycles, revenues and operating results may vary significantly from period to period. For example, the sales cycle for licensing our products typically ranges from 60 days to 18 months. Customers are often cautious in making decisions to acquire our products because purchasing our products typically involves a significant commitment of capital and may involve shifts by the customer to a new software and/or hardware platform or changes in the customer’s operational procedures. This may cause customers, particularly those experiencing financial stress, to make purchasing decisions more cautiously. Delays in completing sales can arise while customers complete their internal procedures to approve large capital expenditures and test and accept our applications. Consequently, we face difficulty predicting the quarter in which sales to expected customers will occur and experience fluctuations in our revenues and operating results. If we are unable to accurately forecast our revenues, our stock price could be adversely affected.
We typically have revenue-generating transactions concentrated in the final weeks of a quarter, which may prevent accurate forecasting of our financial results and cause our stock price to decline.
Large portions of our customer agreements are consummated in the weeks immediately preceding quarter end. Before these agreements are consummated, we create and rely on forecasted revenues for planning, modeling and earnings guidance. Forecasts, however, are only estimates and actual results may vary for a particular quarter or longer periods of time. Consequently, significant discrepancies between actual and forecasted results could limit our ability to plan, budget or provide accurate guidance, which could adversely affect our stock price. Any publicly-stated revenue or earnings projections are subject to this risk.
The failure to recruit and retain additional qualified personnel could hinder our ability to successfully manage our business.
Our DM strategy and our future success will depend in large part on our ability to attract and retain experienced sales, consulting, research and development, marketing, technical support and management personnel. The complexity of our products requires highly trained customer service and technical support personnel to assist customers with product installation and deployment. The labor market for these individuals is very competitive due to the limited number of people available with the necessary technical skills and understanding and may become more competitive with general market and economic improvement. We cannot be certain that our compensation strategies will be perceived as competitive by current or prospective employees. This could impair our ability to recruit and retain personnel. We have experienced difficulty in recruiting qualified personnel, especially technical, sales and consulting personnel, and we may need additional staff to support new customers and/or increased customer needs. We may also recruit skilled technical professionals from other countries to work in the U.S., and from the U.S. and other countries to work abroad. Limitations imposed by immigration laws in the U.S. and abroad and the availability of visas in the countries where we do business could hinder our ability to attract necessary qualified personnel and harm our business and future operating results. There is a risk that even if we invest significant resources in attempting to attract, train and retain qualified personnel, we will not succeed in our efforts, and our business could be harmed. The failure of the value of our stock to appreciate may adversely affect our ability to use equity and equity-based incentive plans to attract and retain personnel, and may require us to use alternative and more expensive forms of compensation for this purpose.
The failure to obtain certain forms of model construction data from our customers or others could harm our business.
Our business requires that we develop or obtain a reliable source of sufficient amounts of current and statistically relevant data to analyze transactions and update our products. In most cases, these data must be periodically updated and refreshed to enable our products to continue to work effectively in a changing environment. We do not own or control much of the data that we require, most of which is collected privately and maintained in proprietary databases. Customers and key business alliances provide us with the data we require to analyze transactions, report results and build new models. Our DM strategy depends in part upon our ability to access new forms of data to develop custom and proprietary analytic tools. If we fail to maintain sufficient data sourcing relationships with our customers and business alliances, or if they decline to provide such data due to privacy concerns, competition concerns, prohibitions or a lack of permission from their customers or partners, we could lose access to required data and our products, and the development of new products, might become less effective. Third parties have asserted copyright and other intellectual property interests in these data, and these assertions, if successful, could prevent us from using these data. Any interruption of our supply of data could seriously harm our business, financial condition or results of operations.
We will continue to rely upon proprietary technology rights, and if we are unable to protect them, our business could be harmed.
Our success depends, in part, upon our proprietary technology and other intellectual property rights. To date, we have relied primarily on a combination of copyright, patent, trade secret, and trademark laws, and nondisclosure and other contractual restrictions on copying and distribution, to protect our proprietary technology. This protection of our proprietary technology is limited, and our proprietary technology could be used by others without our consent. In addition, patents may not be issued with respect to our pending or future patent applications, and our patents may not be upheld as valid or may not prevent the development of competitive products. Any disclosure, loss, invalidity of, or failure to protect our intellectual property could negatively impact our competitive position, and ultimately, our business. There can be no assurance that our protection of our intellectual property rights in the U.S. or abroad will be adequate or that others, including our competitors, will not use our proprietary technology without our consent. Furthermore, litigation may be necessary to enforce our intellectual property rights, to protect our trade secrets, or to determine the validity and scope of the proprietary rights of others. Such litigation could result in substantial costs and diversion of resources and could harm our business, financial condition or results of operations.
Some of our technologies were developed under research projects conducted under agreements with various U.S. government agencies or subcontractors. Although we have commercial rights to these technologies, the U.S. government typically retains ownership of intellectual property rights and licenses in the technologies developed by us under these contracts, and in some cases can terminate our rights in these technologies if we fail to commercialize them on a timely basis. Under these contracts with the U.S. government, the results of research may be made public by the government, limiting our competitive advantage with respect to future products based on our research.
If we are subject to infringement claims, it could harm our business.
We expect that products in the industry segments in which we compete, including software products, will increasingly be subject to claims of patent and other intellectual property infringement as the number of products and competitors in our industry segments grow. We may need to defend claims that our products infringe intellectual property rights, and as a result we may:
| • | incur significant defense costs or substantial damages; |
| • | be required to cease the use or sale of infringing products; |
| • | expend significant resources to develop or license a substitute non-infringing technology; |
| • | discontinue the use of some technology; or |
| • | be required to obtain a license under the intellectual property rights of the third party claiming infringement, which license may not be available or might require substantial royalties or license fees that would reduce our margins. |
Moreover, in recent years, individuals and groups that are non-practicing entities, commonly referred to as “patent trolls”, have purchased patents and other intellectual property assets for the purpose of making claims of infringement in order to extract settlements. From time to time, we may receive threatening letters or notices or may be the subject of claims that our solutions and underlying technology infringe or violate the intellectual property rights of others. Responding to such claims, regardless of their merit, can be time consuming, costly to defend in litigation, divert management's attention and resources, damage our reputation and brand, and cause us to incur significant expenses.
If our security measures are compromised or unauthorized access to customer or consumer data is otherwise obtained, our products and services may be perceived as not being secure, customers may curtail or cease their use of our products and services, our reputation may be damaged and we could incur significant liabilities.
Our business requires the storage, transmission and utilization of sensitive consumer and customer information. Many of our products are provided by us through the Internet. Security breaches could expose us to a risk of loss, the unauthorized disclosure of consumer or customer information, litigation, indemnity obligations and other liability. If our security measures are breached as a result of third-party action, employee error, malfeasance or otherwise, and as a result, someone obtains unauthorized access to our systems or to consumer or customer information, our reputation may be damaged, our business may suffer and we could incur significant liability. Because the techniques used to obtain unauthorized access, or to sabotage systems, change frequently and generally are not recognized until launched against a target, we may be unable to anticipate these techniques or to implement adequate preventative measures. Malicious third parties may also conduct attacks designed to temporarily deny customers access to our services. Security compromises experienced by our competitors, by our distributors, by our customers or by us may lead to public disclosures, which may lead to widespread negative publicity. Any security compromise in our industry, whether actual or perceived, could harm our reputation, erode customer confidence in the effectiveness of our security measures, negatively impact our ability to attract new customers, cause existing customers to curtail or cease their use of our products and services, cause regulatory or industry changes that impact our products and services, or subject us to third-party lawsuits, regulatory fines or other action or liability, all of which could materially and adversely affect our business and operating results.
Protection from system interruptions is important to our business. If we experience system interruptions, it could harm our business.
Systems or network interruptions, including interruptions experienced in connection with our cloud-based and other product offerings, could delay and disrupt our ability to develop, deliver or maintain our products and services, causing harm to our business and reputation and resulting in loss of customers or revenue. These interruptions can include software or hardware malfunctions, communication failures, outages or other failures of third party environments or service providers, fires, floods, earthquakes, power losses, equipment failures and other events beyond our control.
Risks Related to Our Industry
Our ability to increase our revenues will depend to some extent upon introducing new products and services. If the marketplace does not accept these new products and services, our revenues may decline.
We have a significant share of the available market in portions of our Scores segment and for certain services in our Applications segment, specifically, the markets for account management services at credit card processors and credit card fraud detection software. To increase our revenues, we must enhance and improve existing products and continue to introduce new products and new versions of existing products that keep pace with technological developments, satisfy increasingly sophisticated customer requirements and achieve market acceptance. We believe much of the future growth of our business and the success of our DM strategy will rest on our ability to continue to expand into newer markets for our products and services. Such areas are relatively new to our product development and sales and marketing personnel. Products that we plan to market in the future are in various stages of development. We cannot assure you that the marketplace will accept these products. If our current or potential customers are not willing to switch to or adopt our new products and services, either as a result of the quality of these products and services or due to other factors, such as economic conditions, our revenues will decrease.
If we fail to keep up with rapidly changing technologies, our products could become less competitive or obsolete.
In our markets, technology changes rapidly, and there are continuous improvements in computer hardware, network operating systems, programming tools, programming languages, operating systems, database technologies, cloud-based technologies and the use of the Internet. If we fail to enhance our current products and develop new products in response to changes in technology or industry standards, or if we fail to bring product enhancements or new product developments to market quickly enough, our products could rapidly become less competitive or obsolete. Our future success will depend, in part, upon our ability to:
| • | innovate by internally developing new and competitive technologies; |
| • | use leading third-party technologies effectively; |
| • | continue to develop our technical expertise; |
| • | anticipate and effectively respond to changing customer needs; |
| • | initiate new product introductions in a way that minimizes the impact of customers delaying purchases of existing products in anticipation of new product releases; and |
| • | influence and respond to emerging industry standards and other technological changes. |
If our competitors introduce new products and pricing strategies, it could decrease our product sales and market share, or could pressure us to reduce our product prices in a manner that reduces our margins.
We may not be able to compete successfully against our competitors, and this inability could impair our capacity to sell our products. The market for business analytics is new, rapidly evolving and highly competitive, and we expect competition in this market to persist and intensify. Our regional and global competitors vary in size and in the scope of the products and services they offer, and include:
| • | in-house analytic and systems developers; |
| • | scoring model builders; |
| • | enterprise resource planning, customer relationship management, and customer communication and mobility solution providers; |
| • | business intelligence solutions providers; |
| • | credit report and credit score providers; |
| • | business process management and decision rules management providers; |
| • | process modeling tools providers; |
| • | automated application processing services providers; |
| • | data vendors; |
| • | neural network developers and artificial intelligence system builders; |
| • | third-party professional services and consulting organizations; |
| • | account/workflow management software providers; |
| • | software tools companies supplying modeling, rules, or analytic development tools; collections and recovery solutions providers; entity resolution and social network analysis solutions providers; and |
| • | cloud-based customer engagement and risk management solutions providers. |
We expect to experience additional competition from other established and emerging companies, as well as from other technologies. For example, certain of our fraud solutions products compete against other methods of preventing credit card fraud, such as credit cards that contain the cardholder’s photograph; smart cards; cardholder verification and authentication solutions; biometric measures on devices including fingerprint and face matching; and other card authorization techniques and user verification techniques. Many of our anticipated competitors have greater financial, technical, marketing, professional services and other resources than we do, and industry consolidation is creating even larger competitors in many of our markets. As a result, our competitors may be able to respond more quickly to new or emerging technologies and changes in customer requirements. They may also be able to devote greater resources than we can to develop, promote and sell their products. Many of these companies have extensive customer relationships, including relationships with many of our current and potential customers. Furthermore, new competitors or alliances among competitors may emerge and rapidly gain significant market share. For example, Experian, TransUnion and Equifax have formed an alliance that has developed a credit scoring product competitive with our products. If we are unable to respond as quickly or effectively to changes in customer requirements as our competition, our ability to expand our business and sell our products will be negatively affected.
Our competitors may be able to sell products competitive to ours at lower prices individually or as part of integrated suites of several related products. This ability may cause our customers to purchase products that directly compete with our products from our competitors. Price reductions by our competitors could negatively impact our margins, and could also harm our ability to obtain new long-term contracts and renewals of existing long-term contracts on favorable terms.
Laws and regulations in the U.S. and abroad that apply to us or to our customers may expose us to liability, cause us to incur significant expense, affect our ability to compete in certain markets, limit the profitability of or demand for our products, or render our products obsolete. If these laws and regulations require us to change our products and services, it could adversely affect our business and results of operations. New legislation or regulations, or changes to existing laws and regulations, may also negatively impact our business and increase our costs of doing business.
Laws and governmental regulation affect how our business is conducted and, in some cases, subject us to the possibility of government supervision and future lawsuits arising from our products and services. Laws and governmental regulation also influence our current and prospective customers’ activities, as well as their expectations and needs in relation to our products and services. Laws and regulations that may affect our business and our current and prospective customers’ activities include, but are not limited to, those in the following significant regulatory areas:
| • | Use of data by creditors and consumer reporting agencies (e.g., the U.S. Fair Credit Reporting Act); |
| • | Laws and regulations that limit the use of credit scoring models (e.g., state “mortgage trigger” or “inquiries” laws, state insurance restrictions on the use of credit-based insurance scores, and the E.U. Consumer Credit Directive); |
| • | Fair lending laws (e.g., the U.S. Truth In Lending Act and Regulation Z, the Equal Credit Opportunity Act and Regulation B, and the Fair Housing Act); |
| • | Privacy and security laws and regulations that limit the use and disclosure of personally identifiable information, require security procedures, or otherwise apply to the collection, processing, storage, use and transmission of protected data (e.g., the U.S. Financial Services Modernization Act of 1999, also known as the Gramm Leach Bliley Act; the E.U. Data Protection Directive and the country-specific regulations that implement that directive; the U.S. Health Insurance Portability and Accountability Act of 1996, as amended by the Health Information Technology for Economic and Clinical Health Act; the Cybersecurity Act of 2015; the U.S. Department of Commerce’s National Institute of Standards and Technology’s Cybersecurity Framework; and identity theft, file freezing, security breach notification and similar state privacy laws); |
| • | Extension of credit to consumers through the Electronic Fund Transfers Act and Regulation E, as well as non‑governmental VISA and MasterCard electronic payment standards; |
| • | Regulations and guidelines applicable to secondary market participants (e.g., Fannie Mae and Freddie Mac) that could have an impact on our products; |
| • | Laws and regulations applicable to our customer communication clients and their use of our products and services (e.g., the Telemarketing Sales Rule, Telephone Consumer Protection Act and regulations promulgated thereunder); |
| • | Laws and regulations applicable to our insurance clients and their use of our insurance products and services; |
| • | The application or extension of consumer protection laws, including implementing regulations (e.g., the Consumer Financial Protection Act, the Federal Trade Commission Act, the Fair Debt Collection Practices Act, the Servicemembers Civil Relief Act, the Military Lending Act, and the Credit Repair Organizations Act); |
| • | Laws and regulations governing the use of the Internet and social media, telemarketing, advertising, endorsements and testimonials; |
| • | Anti-bribery and corruption laws and regulations (e.g., the Foreign Corrupt Practices Act); |
| • | Financial regulatory standards (e.g., Sarbanes-Oxley Act requirements to maintain and verify internal process controls, including controls for material event awareness and notification); |
| • | Regulatory requirements for managing third parties (e.g., vendors, contractors, suppliers and distributors); |
| • | Anti-money laundering laws and regulations (e.g., the Bank Secrecy Act and the USA Patriot Act); |
| • | Financial regulatory reform stemming from the Dodd-Frank Wall Street Reform and Consumer Protection Act and the many regulations mandated by that Act, including regulations issued by, and the supervisory and investigative authority of, the Bureau of Consumer Financial Protection; and |
| • | Laws and regulations regarding export controls as they apply to FICO products delivered in non-U.S. countries. |
In addition, many U.S. and foreign jurisdictions have passed, or are currently contemplating, a variety of consumer protection, privacy, and data security laws and regulations that may relate to our business or affect the demand for our products and services. For example, on April 14, 2016, the European Parliament formally adopted the General Data Protection Regulation (the “GDPR”), which will supersede the existing Data Protection Directive of 95/46/EC in 2018. The GDPR imposes more stringent operational requirements for entities processing personal information and greater penalties for noncompliance. The costs and other burdens of compliance with privacy and data security laws and regulations could negatively impact the use and adoption of our solutions and reduce overall demand for them. Additionally, concerns regarding data privacy may cause our customers, or their customers and potential customers, to resist providing the data necessary to allow us to deliver our solutions effectively. Even the perception that the privacy of personal information is not satisfactorily protected or does not meet regulatory requirements could inhibit sales of our solutions and any failure to comply with such laws and regulations could lead to significant fines, penalties or other liabilities. Any such decrease in demand or incurred fines, penalties or other liabilities could have a material adverse effect on our business, results of operations, and financial condition.
In addition to existing laws and regulations, changes in the U.S. or foreign legislative, judicial, regulatory or consumer environments could harm our business, financial condition or results of operations. The laws and regulations above, and changes to them, could affect the demand for or profitability of our products, including scoring and consumer products. New laws and regulations pertaining to our customers could cause them to pursue new strategies, reducing the demand for our products.
Our revenues depend, to a great extent, upon conditions in the banking (including consumer credit) and insurance industries. If our clients’ industries experience uncertainty, it will likely harm our business, financial condition or results of operations.
During fiscal 2017, 76% of our revenues were derived from sales of products and services to the banking and insurance industries. Global economic uncertainty experienced in the U.S. and other key international economies in the past produced substantial stress, volatility, illiquidity and disruption of global credit and other financial markets, resulting in the bankruptcy or acquisition of, or government assistance to, several major domestic and international financial institutions. The potential for disruptions presents considerable risks to our businesses and operations. These risks include potential bankruptcies or credit deterioration of financial institutions, many of which are our customers. Such disruption would result in a decline in the revenue we receive from financial and other institutions.
While the rate of account growth in the U.S. bankcard industry has been slow and many of our large institutional customers have consolidated in recent years, we have generated most of our revenue growth from our bankcard-related scoring and account management businesses by selling and cross-selling our products and services to large banks and other credit issuers. As the banking industry continues to experience contraction in the number of participating institutions, we may have fewer opportunities for revenue growth due to reduced or changing demand for our products and services that support customer acquisition programs of our customers. In addition, industry contraction could affect the base of recurring revenues derived from contracts in which we are paid on a per-transaction basis as formerly separate customers combine their operations under one contract. There can be no assurance that we will be able to prevent future revenue contraction or effectively promote future revenue growth in our businesses.
While we are attempting to expand our sales of consumer credit, banking and insurance products and services into international markets, the risks are greater as these markets are also experiencing substantial disruption and we are less well-known in them.
Risks Related to External Conditions
Material adverse developments in global economic conditions, or the occurrence of certain other world events, could affect demand for our products and services and harm our business.
Purchases of technology products and services and decisioning solutions are subject to adverse economic conditions. When an economy is struggling, companies in many industries delay or reduce technology purchases, and we experience softened demand for our decisioning solutions and other products and services. Global economic uncertainty has produced substantial stress, volatility, illiquidity and disruption of global credit and other financial markets in the past. Any economic uncertainty can negatively affect the businesses and purchasing decisions of companies in the industries we serve. The potential for disruptions presents considerable risks to our businesses and operations. If global economic conditions experience stress and negative volatility, or if there is an escalation in regional or global conflicts or terrorism, we will likely experience reductions in the number of available customers and in capital expenditures by our remaining customers, longer sales cycles, deferral or delay of purchase commitments for our products and increased price competition, which may adversely affect our business, results of operations and liquidity.
For example, on June 23, 2016, the United Kingdom (“U.K.”) held a referendum in which voters approved an exit from the E.U., commonly referred to as “Brexit.” As a result of the referendum, on March 29, 2017, the U.K. triggered Article 50 of the Lisbon Treaty formally starting negotiations regarding its exit from the E.U. The U.K. has two years to complete these negotiations, and the future relationship between the U.K. and the E.U. remains unknown. Brexit has caused, and may continue to create, volatility in global stock markets and regional and global economic uncertainty, which may cause our customers to closely monitor their costs and reduce their spending budget on our products and services.
Whether or not recent or new legislative or regulatory initiatives or other efforts successfully stabilize and add liquidity to the financial markets, we may need to modify our strategies, businesses or operations, and we may incur additional costs in order to compete in a changed business environment. Given the volatile nature of the global economic environment and the uncertainties underlying efforts to stabilize it, we may not timely anticipate or manage existing, new or additional risks, as well as contingencies or developments, which may include regulatory developments and trends in new products and services. Our failure to do so could materially and adversely affect our business, financial condition, results of operations and prospects.
In operations outside the U.S., we are subject to unique risks that may harm our business, financial condition or results of operations.
A growing portion of our revenues is derived from international sales. During fiscal 2017, 36% of our revenues were derived from business outside the U.S. As part of our growth strategy, we plan to continue to pursue opportunities outside the U.S., including opportunities in countries with economic systems that are in early stages of development and that may not mature sufficiently to result in growth for our business. Accordingly, our future operating results could be negatively affected by a variety of factors arising out of international commerce, some of which are beyond our control. These factors include:
| • | general economic and political conditions in countries where we sell our products and services; |
| • | difficulty in staffing and efficiently managing our operations in multiple geographic locations and in various countries; |
| • | effects of a variety of foreign laws and regulations, including restrictions on access to personal information; |
| • | import and export licensing requirements; |
| • | longer payment cycles; |
| • | reduced protection for intellectual property rights; |
| • | currency fluctuations; |
| • | changes in tariffs and other trade barriers; and |
| • | difficulties and delays in translating products and related documentation into foreign languages. |
There can be no assurance that we will be able to successfully address each of these challenges in the near term. Additionally, some of our business will be conducted in currencies other than the U.S. dollar. Foreign currency transaction gains and losses are not currently material to our cash flows, financial position or results of operations. However, an increase in our foreign revenues could subject us to increased foreign currency transaction risks in the future.
In addition to the risk of depending on international sales, we have risks incurred in having research and development personnel located in various international locations. We currently have a substantial portion of our product development staff in international locations, some of which have political and developmental risks. If such risks materialize, our business could be damaged.
Our anti-takeover defenses could make it difficult for another company to acquire control of FICO, thereby limiting the demand for our securities by certain types of purchasers or the price investors are willing to pay for our stock.
Certain provisions of our Restated Certificate of Incorporation, as amended, could make a merger, tender offer or proxy contest involving us difficult, even if such events would be beneficial to the interests of our stockholders. These provisions include giving our board the ability to issue preferred stock and determine the rights and designations of the preferred stock at any time without stockholder approval. The rights of the holders of our common stock will be subject to, and may be adversely affected by, the rights of the holders of any preferred stock that may be issued in the future. The issuance of preferred stock, while providing flexibility in connection with possible acquisitions and other corporate purposes, could have the effect of making it more difficult for a third party to acquire, or discouraging a third party from acquiring, a majority of our outstanding voting stock. These factors and certain provisions of the Delaware General Corporation Law may have the effect of deterring hostile takeovers or otherwise delaying or preventing changes in control or changes in our management, including transactions in which our stockholders might otherwise receive a premium over the fair market value of our common stock.
If we experience changes in tax laws or adverse outcomes resulting from examination of our income tax returns, it could adversely affect our results of operations.
We are subject to federal and state income taxes in the U.S. and in certain foreign jurisdictions. Significant judgment is required in determining our worldwide provision for income taxes. Our future effective tax rates could be adversely affected by changes in tax laws, by our ability to generate taxable income in foreign jurisdictions in order to utilize foreign tax losses, and by the valuation of our deferred tax assets. In addition, we are subject to the examination of our income tax returns by the Internal Revenue Service and other tax authorities. We regularly assess the likelihood of adverse outcomes resulting from such examinations to determine the adequacy of our provision for income taxes. There can be no assurance that the outcomes from such examinations will not have an adverse effect on our operating results and financial condition.
Item 1B. Unresolved Staff Comments
Not applicable.
Item 2. Properties
Our properties consist primarily of leased office facilities for sales, data processing, research and development, consulting and administrative personnel. Our principal locations include:
| • | approximately 55,000 square feet of office space in San Jose, California in one building under a lease expiring in fiscal 2024; this is used for our corporate headquarters and all of our segments; |
| • | approximately 124,000 square feet of office space in San Rafael, California in one building under a lease expiring in fiscal 2020; this is used for all of our segments; |
| • | approximately 96,000 square feet of office and data center in Roseville and Brooklyn Park, Minnesota, in two buildings under leases expiring in fiscal 2018 and 2023, respectively; 16,000 square feet of this space is subleased to a third party; this is used for all of our segments; and |
| • | approximately 80,000 square feet of office space in San Diego, California in one building under a lease expiring in fiscal 2020; this is used for Applications and Decision Management Software segments. |
In addition, we lease an aggregate of approximately 306,000 square feet of office and data center space in a number of smaller domestic locations and internationally in India, the United Kingdom, China, Singapore, and several other locations. We believe that suitable additional space will be available to accommodate future needs. See Note 18 to the accompanying consolidated financial statements for information regarding our obligations under leases.
Item 3. Legal Proceedings
Not Applicable.
Item 4. Mine Safety Disclosures
Not Applicable.
PART II
Item 5. Market for Registrant’s Common Equity, Related Stockholder Matters and Issuer Purchases of Equity Securities
Market Information
Our common stock trades on the New York Stock Exchange under the symbol: FICO. According to records of our transfer agent, at October 27, 2017, we had 366 shareholders of record of our common stock.
The following table shows the high and low sales prices for our stock, as listed on the New York Stock Exchange for each quarter in the last two fiscal years:
| High | Low | ||||||
| Fiscal 2016 | |||||||
| October 1 — December 31, 2015 | $ | 97.00 | $ | 78.11 | |||
| January 1 — March 31, 2016 | $ | 106.64 | $ | 80.20 | |||
| April 1 — June 30, 2016 | $ | 115.87 | $ | 102.77 | |||
| July 1 — September 30, 2016 | $ | 132.95 | $ | 111.73 | |||
| Fiscal 2017 | |||||||
| October 1 — December 31, 2016 | $ | 126.00 | $ | 109.77 | |||
| January 1 — March 31, 2017 | $ | 133.14 | $ | 118.95 | |||
| April 1 — June 30, 2017 | $ | 140.64 | $ | 125.71 | |||
| July 1 — September 30, 2017 | $ | 147.02 | $ | 131.52 |
Dividends
We paid dividends of $0.02 per share on a quarterly basis during each of fiscal 2015 and 2016, and the first and second quarters of our fiscal 2017. In May 2017, our Board of Directors discontinued cash dividend payments in favor of using our excess cash flow for share repurchases.
Unregistered Sales of Equity Securities and Use of Proceeds
Not applicable.
Issuer Purchases of Equity Securities
| Period | Total Number of Shares Purchased (1) | Average Price Paid per Share | Total Number of Shares Purchased as Part of Publicly Announced Plans or Programs (2) | Maximum Dollar Value of Shares that May Yet Be Purchased Under the Plans or Programs (2) | |||||||||
| July 1, 2017 through July 31, 2017 | 145,429 | $ | 141.15 | 140,000 | $ | 89,727,312 | |||||||
| August 1, 2017 through August 31, 2017 | 110,828 | $ | 139.56 | 110,000 | $ | 74,375,781 | |||||||
| September 1, 2017 through September 30, 2017 | 270,142 | $ | 139.50 | 270,000 | $ | 36,711,201 | |||||||
| Total | 526,399 | $ | 139.97 | 520,000 | $ | 36,711,201 |
| (1) | Includes 6,399 shares delivered in satisfaction of the tax withholding obligations resulting from the vesting of restricted stock units held by employees during the quarter ended September 30, 2017. |
| (2) | In July 2016, our Board of Directors approved a stock repurchase program following the completion of our previous program. This program was open-ended and authorized repurchases of shares of our common stock up to an aggregate cost of $250.0 million in the open market or in negotiated transactions. In October 2017, our Board of Directors approved a new stock repurchase program following the completion of the July 2016 program. The new program is open-ended and authorizes repurchases of shares of our common stock up to an aggregate cost of $250.0 million in the open market or in negotiated transactions. |
Performance Graph
The following graph shows the total stockholder return of an investment of $100 in cash on September 30, 2012, in (a) the Company’s Common Stock, (b) the Standard & Poor’s 500 Stock Index and (c) the Standard & Poor’s 500 Application Software Index, in each case with reinvestment of dividends. We do not believe there are any publicly traded companies that compete with us across the full spectrum of our product and service offerings.
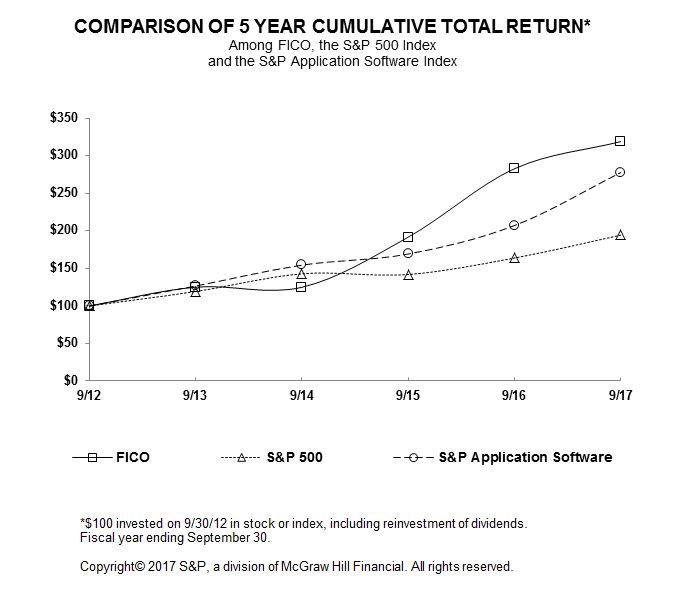
Item 6. Selected Financial Data
We acquired CR Software, LLC. (“CR Software”) in November 2012, Infoglide Software, Inc. (“Infoglide”) in April 2013, InfoCentricity, Inc. (“InfoCentricity”) in April 2014, TONBELLER in January 2015, and QuadMetrics in May 2016. Results of operations from the acquisitions are included prospectively from their respective acquisition dates and did not materially impact comparability of the data presented below.
| Year Ended September 30, | |||||||||||||||||||
| 2017 (1) | 2016 | 2015 (1) | 2014 (1) | 2013 (1) | |||||||||||||||
| (In thousands, except per share data) | |||||||||||||||||||
| Revenues | $ | 932,169 | $ | 881,356 | $ | 838,781 | $ | 788,985 | $ | 743,444 | |||||||||
| Operating income | 177,200 | 169,592 | 137,505 | 161,868 | 161,593 | ||||||||||||||
| Net income | 128,256 | 109,448 | 86,502 | 94,879 | 90,095 | ||||||||||||||
| Basic earnings per share | 4.16 | 3.52 | 2.75 | 2.80 | 2.55 | ||||||||||||||
| Diluted earnings per share | 3.98 | 3.39 | 2.65 | 2.72 | 2.48 | ||||||||||||||
| Dividends declared per share | 0.04 | 0.08 | 0.08 | 0.08 | 0.08 |
| September 30, | |||||||||||||||||||
| 2017 | 2016 | 2015 | 2014 | 2013 | |||||||||||||||
| (In thousands) | |||||||||||||||||||
| Working capital | $ | (15,724 | ) | $ | 21,561 | $ | 42,727 | $ | (52,877 | ) | $ | 83,308 | |||||||
| Total assets | 1,255,620 | 1,220,676 | 1,230,163 | 1,192,298 | 1,161,547 | ||||||||||||||
| Senior notes | 244,000 | 316,000 | 376,000 | 447,000 | 455,000 | ||||||||||||||
| Revolving line of credit | 361,000 | 255,000 | 232,000 | 99,000 | 15,000 | ||||||||||||||
| Stockholders’ equity | 426,537 | 446,828 | 436,998 | 454,614 | 530,677 |
(1) Results of operations for fiscal years 2017, 2015, 2014 and 2013 include pre-tax charges of $4.5 million, $18.2 million, $4.3 million and $3.5 million, respectively, in restructuring and acquisition-related expenses.
Item 7. Management’s Discussion and Analysis of Financial Condition and Results of Operations
Our Management’s Discussion and Analysis of Financial Condition and Results of Operations (“MD&A”) includes the following: a business overview that provides a high-level summary of our strategies and initiatives, financial results and bookings trends that affect our business; a more detailed analysis of our results of operations; our liquidity and capital resources, which discusses key aspects of our statements of cash flows, changes in our balance sheets and our financial commitments; and a summary of our critical accounting policies and estimates we believe are important to understanding the assumptions and judgments incorporated in our reported financial results. Our MD&A should be read in conjunction with Item 8, Financial Statements and Supplementary Data, of this Annual Report on Form 10-K. The following discussion contains forward-looking statements that are subject to risks and uncertainties. Actual results may differ from those referred to herein due to a number of factors, including but not limited to risks described in Item 1A, Risk Factors, in this Annual Report on Form 10-K.
BUSINESS OVERVIEW
Strategies and Initiatives
During fiscal 2017, our growth initiatives continued to generate significant free cash flow. We utilized our cash to enhance shareholder value through investments in long-term growth initiatives and our share repurchase programs.
While we continued to offer on-premise solutions for many customers who prefer to install and run our software in-house, we continued our expansion into cloud-based solutions in our Applications and Decision Management Software segments to provide growth opportunities with customers that can benefit from the affordability and simplicity of these solutions. The majority of our software solutions are available through the FICO® Analytic Cloud, and during fiscal 2017, we added Amazon Web Services, Inc. (“AWS”) as our primary cloud infrastructure provider. We have migrated several core applications, including the Decision Management Suite, to AWS and will migrate additional applications over the next three years. Our cloud bookings accounted for 24% and 26% of our total bookings during fiscal 2017 and 2016, respectively, directly demonstrating the willingness among our customers to engage our cloud-based solutions.
For our Scores segment, our industry leading business-to-business FICO® Scores expanded further into the larger, faster growing U.S. consumer market. The FICO® Score Open Access program, which allows our participating clients to provide their customers with a free FICO® Score along with content to help them understand the FICO® Score their lender uses, continued its expansion during the current year. We commenced this program in 2014 and now have more than 250 million consumer accounts with access to their free FICO® Score. The partnership agreement we launched in fiscal 2015 with Experian, a leading global information services provider, also continued to accelerate during the current year. This partnership provides consumers the FICO® Score that lenders most commonly use in evaluating credit when determining applicant eligibility for new credit cards, car loans, mortgages or other lines of credit and can be accessed through Experian.com. During fiscal 2017, we announced the FICO Financial Inclusion Initiative, a global effort to increase access to affordable credit for consumers and businesses with limited or no credit history, through the use of alternative data. We continue to pursue additional partners to distribute FICO® Scores with their product offerings sold directly to consumers. In addition, we are pursuing opportunities to make FICO® Scores available to third-parties for affinity, white-labeled programs to further penetrate and expand the markets where our scores are available.
We also returned significant cash to shareholders through our stock repurchase program. During fiscal 2017, we repurchased approximately 1.5 million shares at a total repurchase price of $193.3 million. As of September 30, 2017, we had $36.7 million remaining under our then-current stock repurchase program.
Overview of Financial Results
Total revenues for fiscal 2017 were $932.2 million, an increase of 6% from $881.4 million in fiscal 2016. Revenue in each of our segments increased, with our Scores segment the primary driver increasing by 10% in fiscal 2017 compared to fiscal 2016. Our Applications and Decision Management Software segments increased by 4% and 5% in fiscal 2017 compared to fiscal 2016, respectively. We derive a significant portion of revenues internationally, and 36% of total consolidated revenues were derived from clients outside the U.S. during each of fiscal 2017 and 2016. A significant portion of our revenues are derived from the sale of products and services within the banking (including consumer credit) industry, and 74% and 72% of our revenues were derived from within this industry during fiscal 2017 and 2016, respectively. In addition, we derive a significant share of revenues from transactional or unit-based software license fees, transactional fees derived under credit scoring, data processing, data management and SaaS subscription services arrangements, and annual software maintenance fees. Arrangements with transactional or unit-based pricing accounted for 70% and 69% of our revenues during fiscal 2017 and 2016, respectively. Revenue fluctuations in our business are primarily driven by changes in the transactional volume and license fees.
Operating income for fiscal 2017 was $177.2 million, an increase of 4% from $169.6 million in fiscal 2016. Operating margin was 19% for each of fiscal 2017 and 2016. Net income increased 17% to $128.3 million in fiscal 2017 from $109.4 million in fiscal 2016 and net margin increased to 14% from 12%. The increases were primarily driven by our adoption of ASU No. 2016-09, “Compensation - Stock Compensation (Topic 718): Improvements to Employee Share-Based Payment Accounting” (“ASU 2016-09”), effective October 1, 2016, as further described in Notes 1 and 13 to the accompanying consolidated financial statements. Diluted earnings per share for fiscal 2017 was $3.98, an increase of 17% from $3.39 in fiscal 2016.
Bookings
Management regards the volume of bookings achieved as an important indicator of future revenues, but they are not comparable to nor a substitute for an analysis of our revenues. Bookings represent contracts signed in the current reporting period that generate current and future revenue streams. We estimate bookings as of the end of the period in which a contract is signed and initial booking estimates are not updated in future periods for changes between estimated and actual results. Our calculations have varying degrees of certainty depending on the revenue type and individual contract terms. They are subject to a number of risks and uncertainties concerning timing and contingencies affecting product delivery and performance, and estimates consider contract terms, knowledge of the marketplace and experience with our customers, among other factors. Actual revenue and the timing thereof could differ materially from our initial estimates.
Although many of our contracts contain non-cancelable terms, most of our bookings are transactional or service related that depend upon estimates such as volume of transactions, number of active accounts, or number of hours incurred. Since these estimates cannot be considered fixed or firm, we do not believe it is appropriate to characterize bookings as backlog. The following paragraphs discuss the key assumptions used to calculate bookings and the susceptibility of these assumptions to variability for each revenue type.
Transactional and Maintenance Bookings
We calculate transactional bookings as the total estimated volume of transactions or number of accounts under contract, multiplied by the contractual rate. Transactional contracts generally span multiple years and require estimate
Showing the first 8K of 96K characters. Open the full section
Item 7A. Quantitative and Qualitative Disclosures about Market Risk
Market Risk Disclosures
We are exposed to market risk related to changes in interest rates and foreign exchange rates. We do not use derivative financial instruments for speculative or trading purposes.
Interest Rate
We maintain an investment portfolio consisting of bank deposits and money market funds. The funds provide daily liquidity and may be subject to interest rate risk and fall in value if market interest rates increase. We do not expect our operating results or cash flows to be affected to any significant degree by a sudden change in market interest rates. The following table presents the principal amounts and related weighted-average yields for our investments with interest rate risk at September 30, 2017 and 2016:
| September 30, 2017 | September 30, 2016 | ||||||||||||||||||||
| Cost Basis | Carrying Amount | Average Yield | Cost Basis | Carrying Amount | Average Yield | ||||||||||||||||
| (Dollars in thousands) | |||||||||||||||||||||
| Cash and cash equivalents | $ | 105,618 | $ | 105,618 | 0.56 | % | $ | 75,926 | $ | 75,926 | 0.17 | % |
In May 2008, we issued $275 million of senior notes to a group of institutional investors in a private placement (the “2008 Senior Notes”). In July 2010 we issued an additional $245 million of senior notes to a group of institutional investors in a private placement (the “2010 Senior Notes” and, with the 2008 Senior Notes, the “Senior Notes”). The fair value of the Senior Notes may increase or decrease due to various factors, including fluctuations in market interest rates and fluctuations in general economic conditions. See Management’s Discussion and Analysis of Financial Condition and Results of Operations — Capital Resources and Liquidity for additional information on the Senior Notes. The following table presents the carrying amounts and fair values for the Senior Notes at September 30, 2017 and 2016:
| September 30, 2017 | September 30, 2016 | ||||||||||||||
| Carrying Amounts | Fair Value | Carrying Amounts | Fair Value | ||||||||||||
| (In thousands) | |||||||||||||||
| The 2008 Senior Notes | $ | 131,000 | $ | 134,250 | $ | 131,000 | $ | 139,902 | |||||||
| The 2010 Senior Notes | 113,000 | 119,106 | 185,000 | 195,715 | |||||||||||
| Debt issuance costs | (199 | ) | $ | (199 | ) | (376 | ) | (376 | ) | ||||||
| Total | $ | 243,801 | $ | 253,157 | $ | 315,624 | $ | 335,241 |
We have interest rate risk with respect to our $500 million unsecured revolving line of credit. Interest on amounts borrowed under the credit facility is based on (i) a base rate, which is the greater of (a) the prime rate and (b) the Federal Funds rate plus 0.500% and (c) the one-month LIBOR rate plus 1.000%, plus, in each case, an applicable margin, or (ii) an adjusted LIBOR rate plus an applicable margin. The applicable margin for base rate borrowings ranges from 0% to 0.875% and for LIBOR borrowings ranges from 1.000% to 1.875% and is determined based on our consolidated leverage ratio. A change in interest rates on this variable rate debt impacts the interest incurred and cash flows, but does not impact the fair value of the instrument. We had $361.0 million in borrowings outstanding at a weighted average interest of 2.365% under the credit facility as of September 30, 2017.
Foreign Currency Forward Contracts
We use derivative instruments to manage risks caused by fluctuations in foreign exchange rates. The primary objective of our derivative instruments is to protect the value of foreign-currency-denominated receivable and cash balances from the effects of volatility in foreign exchange rates that might occur prior to conversion to their functional currencies. We principally utilize foreign currency forward contracts, which enable us to buy and sell foreign currencies in the future at fixed exchange rates and economically offset changes in foreign exchange rates. We routinely enter into contracts to offset exposures denominated in the British pound and Euro.
Foreign-currency-denominated receivable and cash balances are remeasured at foreign exchange rates in effect on the balance sheet date with the effects of changes in foreign exchange rates reported in other income (expense), net. The forward contracts are not designated as hedges and are marked to market through other income (expense), net. Fair value changes in the forward contracts help mitigate the changes in the value of the remeasured receivable and cash balances attributable to changes in foreign exchange rates. The forward contracts are short-term in nature and typically have average maturities at inception of less than three months.
The following tables summarize our outstanding foreign currency forward contracts, by currency, at September 30, 2017 and 2016:
| September 30, 2017 | ||||||||||
| Contract Amount | Fair Value | |||||||||
| Foreign Currency | US$ | US$ | ||||||||
| (In thousands) | ||||||||||
| Sell foreign currency: | ||||||||||
| Euro (EUR) | EUR | 5,050 | $ | 5,968 | — | |||||
| Buy foreign currency: | ||||||||||
| British pound (GBP) | GBP | 9,341 | $ | 12,500 | — |
| September 30, 2016 | ||||||||||
| Contract Amount | Fair Value | |||||||||
| Foreign Currency | US$ | US$ | ||||||||
| (In thousands) | ||||||||||
| Sell foreign currency: | ||||||||||
| Euro (EUR) | EUR | 7,850 | $ | 8,743 | — | |||||
| Buy foreign currency: | ||||||||||
| British pound (GBP) | GBP | 7,721 | $ | 10,000 | — |
The foreign currency forward contracts were entered into on September 30 of each fiscal year; therefore, the fair value was $0 on September 30, 2017 and 2016.
Item 8. Financial Statements and Supplementary Data
REPORT OF INDEPENDENT REGISTERED PUBLIC ACCOUNTING FIRM
To the Board of Directors and Stockholders of
Fair Isaac Corporation
San Jose, California
We have audited the accompanying consolidated balance sheets of Fair Isaac Corporation and subsidiaries (the "Company") as of September 30, 2017 and 2016, and the related consolidated statements of income and comprehensive income, stockholders' equity, and cash flows for each of the three years in the period ended September 30, 2017. We also have audited the Company's internal control over financial reporting as of September 30, 2017, based on the criteria established in Internal Control - Integrated Framework (2013) issued by the Committee of Sponsoring Organizations of the Treadway Commission. The Company's management is responsible for these financial statements, for maintaining effective internal control over financial reporting, and for its assessment of the effectiveness of internal control over financial reporting, included in the accompanying Management’s Report on Internal Control over Financial Reporting. Our responsibility is to express an opinion on these financial statements and an opinion on the Company's internal control over financial reporting based on our audits.
We conducted our audits in accordance with the standards of the Public Company Accounting Oversight Board (United States). Those standards require that we plan and perform the audit to obtain reasonable assurance about whether the financial statements are free of material misstatement and whether effective internal control over financial reporting was maintained in all material respects. Our audits of the financial statements included examining, on a test basis, evidence supporting the amounts and disclosures in the financial statements, assessing the accounting principles used and significant estimates made by management, and evaluating the overall financial statement presentation. Our audit of internal control over financial reporting included obtaining an understanding of internal control over financial reporting, assessing the risk that a material weakness exists, and testing and evaluating the design and operating effectiveness of internal control based on the assessed risk. Our audits also included performing such other procedures as we considered necessary in the circumstances. We believe that our audits provide a reasonable basis for our opinions.
A company's internal control over financial reporting is a process designed by, or under the supervision of, the company's principal executive and principal financial officers, or persons performing similar functions, and effected by the company's board of directors, management, and other personnel to provide reasonable assurance regarding the reliability of financial reporting and the preparation of financial statements for external purposes in accordance with generally accepted accounting principles. A company's internal control over financial reporting includes those policies and procedures that (1) pertain to the maintenance of records that, in reasonable detail, accurately and fairly reflect the transactions and dispositions of the assets of the company; (2) provide reasonable assurance that transactions are recorded as necessary to permit preparation of financial statements in accordance with generally accepted accounting principles, and that receipts and expenditures of the company are being made only in accordance with authorizations of management and directors of the company; and (3) provide reasonable assurance regarding prevention or timely detection of unauthorized acquisition, use, or disposition of the company's assets that could have a material effect on the financial statements.
Because of the inherent limitations of internal control over financial reporting, including the possibility of collusion or improper management override of controls, material misstatements due to error or fraud may not be prevented or detected on a timely basis. Also, projections of any evaluation of the effectiveness of the internal control over financial reporting to future periods are subject to the risk that the controls may become inadequate because of changes in conditions, or that the degree of compliance with the policies or procedures may deteriorate.
In our opinion, the consolidated financial statements referred to above present fairly, in all material respects, the financial position of the Company and subsidiaries as of September 30, 2017 and 2016, and the results of their operations and their cash flows for each of the three years in the period ended September 30, 2017, in conformity with accounting principles generally accepted in the United States of America. Also, in our opinion, the Company maintained, in all material respects, effective internal control over financial reporting as of September 30, 2017, based on the criteria established in Internal Control - Integrated Framework (2013) issued by the Committee of Sponsoring Organizations of the Treadway Commission.
| /s/ Deloitte & Touche LLP |
| San Diego, CA |
| November 9, 2017 |
FAIR ISAAC CORPORATION
CONSOLIDATED BALANCE SHEETS
| September 30, | |||||||
| 2017 | 2016 | ||||||
| (In thousands, except par value data) | |||||||
| Assets | |||||||
| Current assets: | |||||||
| Cash and cash equivalents | $ | 105,618 | $ | 75,926 | |||
| Accounts receivable, net | 168,586 | 167,786 | |||||
| Prepaid expenses and other current assets | 36,727 | 23,926 | |||||
| Total current assets | 310,931 | 267,638 | |||||
| Marketable securities available for sale | 13,791 | 11,016 | |||||
| Other investments | 11,724 | 10,920 | |||||
| Property and equipment, net | 40,703 | 45,122 | |||||
| Goodwill | 804,414 | 798,415 | |||||
| Intangible assets, net | 21,185 | 33,619 | |||||
| Deferred income taxes | 47,204 | 47,598 | |||||
| Other assets | 5,668 | 6,348 | |||||
| Total assets | $ | 1,255,620 | $ | 1,220,676 | |||
| Liabilities and Stockholders’ Equity | |||||||
| Current liabilities: | |||||||
| Accounts payable | $ | 19,510 | $ | 22,952 | |||
| Accrued compensation and employee benefits | 77,610 | 71,216 | |||||
| Other accrued liabilities | 32,104 | 27,780 | |||||
| Deferred revenue | 55,431 | 47,129 | |||||
| Current maturities on debt | 142,000 | 77,000 | |||||
| Total current liabilities | 326,655 | 246,077 | |||||
| Long-term debt | 462,801 | 493,624 | |||||
| Other liabilities | 39,627 | 34,147 | |||||
| Total liabilities | 829,083 | 773,848 | |||||
| Commitments and contingencies | |||||||
| Stockholders’ equity: | |||||||
| Preferred stock ($0.01 par value; 1,000 shares authorized; none issued and outstanding) | — | — | |||||
| Common stock ($0.01 par value; 200,000 shares authorized, 88,857 shares issued and 30,243 and 30,935 shares outstanding at September 30, 2017 and September 30, 2016, respectively) | 302 | 309 | |||||
| Paid-in-capital | 1,195,431 | 1,188,913 | |||||
| Treasury stock, at cost (58,614 and 57,922 shares at September 30, 2017 and September 30, 2016, respectively) | (2,301,097 | ) | (2,136,760 | ) | |||
| Retained earnings | 1,598,395 | 1,471,377 | |||||
| Accumulated other comprehensive loss | (66,494 | ) | (77,011 | ) | |||
| Total stockholders’ equity | 426,537 | 446,828 | |||||
| Total liabilities and stockholders’ equity | $ | 1,255,620 | $ | 1,220,676 |
See accompanying notes.
FAIR ISAAC CORPORATION
CONSOLIDATED STATEMENTS OF INCOME AND COMPREHENSIVE INCOME
| | | | | | | | | | | | | | --- | --- | --- |
Showing the first 8K of 137K characters. Open the full section
Item 9. Changes in and Disagreements with Accountants on Accounting and Financial Disclosure
Not applicable.
Item 9A. Controls and Procedures
Evaluation of Disclosure Controls and Procedures
An evaluation was carried out under the supervision and with the participation of FICO’s management, including the Chief Executive Officer (“CEO”) and Chief Financial Officer (“CFO”), of the effectiveness of the design and operation of FICO’s disclosure controls and procedures (as defined in Rule 13a-15(e) under the Securities Exchange Act of 1934, as amended (the “Exchange Act”)) as of the end of the period covered by this annual report. Based on that evaluation, the CEO and CFO have concluded that FICO’s disclosure controls and procedures are effective to ensure that information required to be disclosed by FICO in reports that it files or submits under the Exchange Act is recorded, processed, summarized and reported within the time periods specified in SEC rules and forms. In addition, the disclosure controls and procedures ensure that information required to be disclosed is accumulated and communicated to management, including the CEO and CFO, allowing timely decisions regarding required disclosure.
Changes in Internal Control over Financial Reporting
No change in FICO’s internal control over financial reporting was identified in connection with the evaluation required by Rule 13a-15(d) of the Exchange Act that occurred during the year ended September 30, 2017, that has materially affected, or is reasonably likely to materially affect, FICO’s internal control over financial reporting.
Management’s Report on Internal Control over Financial Reporting
Our management is responsible for establishing and maintaining adequate internal control over financial reporting, as defined in Rule 13a-15(f) and 15d-15(f) under the Exchange Act. Under the supervision and with the participation of management, including our CEO and CFO, we conducted an evaluation of the effectiveness of our internal control over financial reporting as of September 30, 2017 based on the guidelines established in Internal Control – Integrated Framework (2013) issued by the Committee of Sponsoring Organizations of the Treadway Commission. Based on this evaluation management has concluded that our internal control over financial reporting was effective as of September 30, 2017.
Deloitte & Touche LLP, an independent registered public accounting firm that audited the consolidated financial statements included in this Annual Report on Form 10-K, has also audited the effectiveness of our internal control over financial reporting as of September 30, 2017, as stated in their attestation report included in Part II, Item 8 of this Annual Report on Form 10-K.
Item 9B. Other Information
Not applicable.
PART III
Item 10. Directors, Executive Officers and Corporate Governance
The required information regarding our Directors is incorporated by reference from the information under the caption “Director Nominees” in our definitive proxy statement for the Annual Meeting of Stockholders to be held on February 28, 2018.
Our current executive officers are as follows:
| Name | Positions Held | Age |
| William J. Lansing | January 2012-present, Chief Executive Officer and member of the Board of Directors of the Company. February 2009-November 2010, Chief Executive Offer and President, Infospace, Inc. 2004-2007, Chief Executive Officer and President, ValueVision Media, Inc. 2001-2003, General Partner, General Atlantic LLC. 2000-2001, Chief Executive Officer, NBC Internet, Inc. 1998-2000, President/Chief Executive Officer, Fingerhut Companies, Inc. 1996-1998, Vice President, Corporate Business Development, General Electric Company. 1996, Executive Vice President, Chief Operating Office, Prodigy, Inc. 1986-1995, various positions, McKinsey & Company, Inc. | 59 |
| Michael J. Pung | November 2010-present, Executive Vice President and Chief Financial Officer of the Company. August 2004-November 2010, Vice President, Finance of the Company. 2000-2004, Vice President and Controller, Hubbard Media Group, LLC. 1999-2000, Controller, Capella Education, Inc. 1998-1999, Controller, U.S. Satellite Broadcasting, Inc. 1992-1998, various financial management positions with Deluxe Corporation. 1985-1992, various audit positions, including audit manager, at Deloitte & Touche LLP. | 54 |
| Richard S. Deal | November 2015-present, Executive Vice President, Chief Human Resources Officer of the Company. August 2007-November 2015, Senior Vice President, Chief Human Resources Officer of the Company. January 2001-August 2007, Vice President, Human Resources of the Company. 1998-2001, Vice President, Human Resources, Arcadia Financial, Ltd. 1993-1998, managed broad range of human resources corporate and line consulting functions with U.S. Bancorp. | 50 |
| Wayne Huyard | November 2014-present, Executive Vice President of Sales, Services, and Marketing of the Company. January 2014-November 2014, Consultant to the Chief Executive Officer of the Company. September 2012-November 2014, Chief Executive Officer and President, TEXbase, Inc. March 2012-May 2012, General Manager of RightNow Technologies, Oracle Corporation. July 2010-February 2012, President and Chief Operating Officer, RightNow Technologies, Inc. May 2006-May 2010, Operations and Advisory Group Executive Leadership Team Member, Cerberus Capital Management L.P. | 58 |
| Michael S. Leonard | November 2011-present, Vice President, Chief Accounting Officer of the Company. November 2007-November 2011, Senior Director, Finance of the Company. July 2000-November 2007, Director, Finance of the Company. 1998-2000, Controller of Natural Alternatives International, Inc. 1994-1998, various audit staff positions at KPMG LLP. | 52 |
| Mark R. Scadina | February 2009-present, Executive Vice President and General Counsel and Corporate Secretary of the Company. June 2007-February 2009, Senior Vice President and General Counsel and Corporate Secretary of the Company. 2003-2007, various senior positions including Executive Vice President, General Counsel and Corporate Secretary, Liberate Technologies, Inc. 1999-2003, various leadership positions including Vice President and General Counsel, Intertrust Technologies Corporation. 1994-1999, Associate, Pennie and Edmonds LLP. | 48 |
| James M. Wehmann | April 2012-present, Executive Vice President, Scores of the Company. November 2003-March 2012, Vice President/Senior Vice President, Global Marketing, Digital River, Inc. March 2002-June 2003, Vice President, Marketing, Brylane, Inc. September 2000-March 2002, Senior Vice President, Marketing, New Customer Acquisition, Bank One. 1993-2000, various roles, including Senior Vice President, Marketing, Fingerhut Companies, Inc. | 52 |
| Stuart C. Wells | April 2012-present, Executive Vice President, Chief Technology Officer of the Company. June 2010- April 2012, Head of Global Professional Services and Support of the Company (Consultant). February 2009-June 2010, CEO, and Chairman of the Board, ScaleMP. January 2007-January 2009, Senior Vice President and President, Avaya, Inc. April 2005-December 2006, Executive Vice President, Utility Computing, Sun Microsystems. | 61 |
The required information regarding compliance with Section 16(a) of the Securities Exchange Act is incorporated by reference from the information under the caption “Section 16(a) Beneficial Ownership Reporting Compliance” in our definitive proxy statement for the Annual Meeting of Stockholders to be held on February 28, 2018.
FICO has adopted a Code of Ethics for Senior Financial Management that applies to the Company’s Chief Executive Officer, Chief Financial Officer, Controller and other employees performing similar functions who have been identified by the Chief Executive Officer. We have posted the Code of Ethics on our website located at www.fico.com. FICO intends to satisfy the disclosure requirement under Item 5.05 of Form 8-K regarding an amendment to, or a waiver from, this Code of Ethics by posting such information on its website. FICO also has a Code of Conduct and Business Ethics applicable to all directors, officers and employees, which is also available at the web site cited above.
The required information regarding the Company’s audit committee is incorporated by reference from the information under the caption “Board Meetings, Committees and Attendance” in our definitive proxy statement for the Annual Meeting of Shareholders to be held on February 28, 2018.
Item 11. Executive Compensation
The information required by this Item is incorporated by reference from the information under the captions “Director Compensation for 2017,” “Executive Compensation,” and “Compensation Committee Interlocks and Insider Participation” in our definitive proxy statement for the Annual Meeting of Stockholders to be held on February 28, 2018.
Item 12. Security Ownership of Certain Beneficial Owners and Management and Related Stockholder Matters
The information required by this Item is incorporated by reference from the information under the caption “Security Ownership Of Certain Beneficial Owners and Management” and “Executive Compensation Plan Information” in our definitive proxy statement for the Annual Meeting of Stockholders to be held on February 28, 2018.
Item 13. Certain Relationships and Related Transactions, and Director Independence
The information required by this Item is incorporated by reference from the information under the caption “Certain Relationships and Related Transactions” in our definitive proxy statement for the Annual Meeting of Stockholders to be held on February 28, 2018.
Item 14. Principal Accountant Fees and Services
The information required by this Item is incorporated by reference from the information under the caption “Ratification of Independent Registered Public Accounting Firm” in our definitive proxy statement for the Annual Meeting of Stockholders to be held on February 28, 2018.
PART IV
Item 15. Exhibits and Financial Statement Schedules
- Consolidated Financial Statements:
- Financial Statement Schedules
All financial statement schedules are omitted as the required information is not applicable or as the information required is included in the consolidated financial statements and related notes.
- Exhibits:
| 31.1* | Rule 13a-14(a)/15d-14(a) Certifications of CEO. |
| 31.2* | Rule 13a-14(a)/15d-14(a) Certifications of CFO. |
| 32.1* | Section 1350 Certification of CEO. |
| 32.2* | Section 1350 Certification of CFO. |
| 101.INS | XBRL Instance Document. |
| 101.SCH | XBRL Taxonomy Extension Schema Document. |
| 101.CAL | XBRL Taxonomy Extension Calculation Linkbase Document. |
| 101.DEF | XBRL Taxonomy Extension Definition Linkbase Document. |
| 101.LAB | XBRL Taxonomy Extension Label Linkbase Document. |
| 101.PRE | XBRL Taxonomy Extension Presentation Linkbase Document. |
| (1) | Management contract or compensatory plan or arrangement. |
| * | Filed herewith. |
SIGNATURES
Pursuant to the requirements of Section 13 or 15(d) of the Securities Exchange Act of 1934, as amended, the Registrant has duly caused this report to be signed on its behalf by the undersigned, thereunto duly authorized.
| FAIR ISAAC CORPORATION | ||
| By | /s/ MICHAEL J. PUNG | |
| Michael J. Pung | ||
| Executive Vice President and Chief Financial Officer |
DATE: November 9, 2017
Pursuant to the requirements of the Securities Exchange Act of 1934, as amended, this report has been signed below by the following persons on behalf of the registrant and in the capacities and on the dates indicated.
| /s/ WILLIAM J. LANSING | Chief Executive Officer (Principal Executive Officer) and Director | November 9, 2017 |
| William J. Lansing | ||
| /s/ MICHAEL J. PUNG | Executive Vice President and Chief Financial Officer (Principal Financial Officer) | November 9, 2017 |
| Michael J. Pung | ||
| /s/ MICHAEL S. LEONARD | Vice President and Chief Accounting Officer (Principal Accounting Officer) | November 9, 2017 |
| Michael S. Leonard | ||
| /s/ A. GEORGE BATTLE | Director | November 9, 2017 |
| A. George Battle | ||
| /s/ MARK W. BEGOR | Director | November 9, 2017 |
| Mark W. Begor | ||
| /s/ BRADEN R. KELLY | Director | November 9, 2017 |
| Braden R. Kelly | ||
| /s/ JAMES D. KIRSNER | Director | November 9, 2017 |
| James D. Kirsner | ||
| /s/ MARC F. MCMORRIS | Director | November 9, 2017 |
| Marc F. McMorris | ||
| /s/ JOANNA REES | Director | November 9, 2017 |
| Joanna Rees | ||
| /s/ DAVID A. REY | Director | November 9, 2017 |
| David A. Rey |