 filings.tools
Item 5. Market for Registrant’s Common Equity, Related Stockholder Matters and Issuer Purchases of Equity Securities
3K characters. Original on sec.gov · Markdown
Item 5. Market for Registrant’s Common Equity, Related Stockholder Matters and Issuer Purchases of Equity Securities
Market Information
Our common stock trades on the New York Stock Exchange under the symbol: FICO. According to records of our transfer agent, at October 27, 2023, we had 254 stockholders of record of our common stock.
Dividends
We have not declared or paid any cash dividends on our common stock since May 2017, and we do not presently plan to pay cash dividends on our common stock in the foreseeable future. Payment of future cash dividends, if any, will be at the discretion of our board of directors after taking into account various factors, including our financial condition, operating results, current and anticipated cash needs, outstanding indebtedness, plans for expansion and restrictions imposed by our debt arrangements, if any.
Unregistered Sales of Equity Securities and Use of Proceeds
Not applicable.
Issuer Purchases of Equity Securities
| Period | Total Number of Shares Purchased (1) | Average Price Paid per Share | Total Number of Shares Purchased as Part of Publicly Announced Plans or Programs (2) | Maximum Dollar Value of Shares that May Yet Be Purchased Under the Plans or Programs (2) | |||||||||||||||||||
| July 1, 2023 through July 31, 2023 | 48,412 | $ | 821.21 | 47,500 | $ | 197,895,136 | |||||||||||||||||
| August 1, 2023 through August 31, 2023 | 52,563 | $ | 864.13 | 52,000 | $ | 152,950,805 | |||||||||||||||||
| September 1, 2023 through September 30, 2023 | 36,000 | $ | 900.13 | 36,000 | $ | 120,546,951 | |||||||||||||||||
| 136,975 | $ | 858.42 | 135,500 | $ | 120,546,951 |
(1)Includes 1,475 shares delivered in satisfaction of the tax withholding obligations resulting from the vesting of restricted stock units held by employees during the quarter ended September 30, 2023.
(2)In October 2022, our Board of Directors approved a stock repurchase program replacing our previously authorized program. This program is open-ended and authorizes repurchases of shares of our common stock up to an aggregate cost of $500.0 million in the open market or in negotiated transactions.
Performance Graph
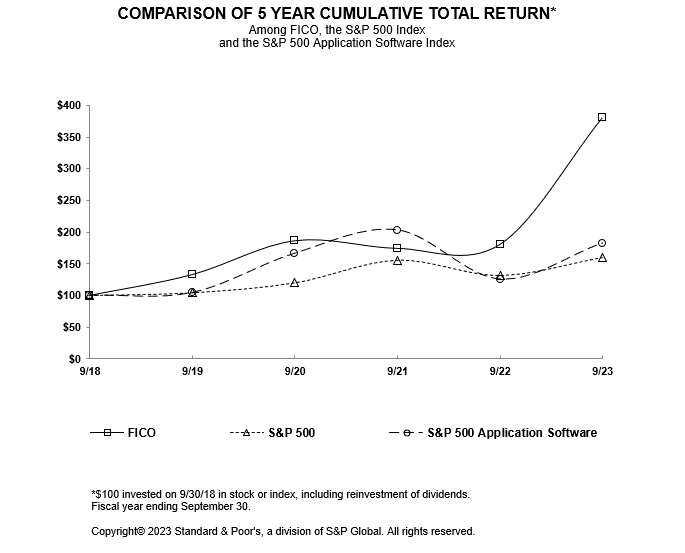
The following graph shows the total stockholder return of an investment of $100 in cash on September 30, 2018, in (a) the Company’s common stock, (b) the Standard & Poor’s 500 Stock Index and (c) the Standard & Poor’s 500 Application Software Index, in each case with reinvestment of dividends. Our past performance may not be indicative of future performance.
Previous: Item 4. Mine Safety Disclosures · Next: Item 6. [Reserved]