 filings.tools
Item 5. Market for Registrant’s Common Equity, Related Stockholder Matters and Issuer Purchases of Equity Securities
6K characters. Original on sec.gov · Markdown
Item 5. Market for Registrant’s Common Equity, Related Stockholder Matters and Issuer Purchases of Equity Securities
Market Price Information
Our common stock is traded on the New York Stock Exchange (“NYSE”) under the symbol “FI.” On June 7, 2023, we transferred the listing of our common stock to the NYSE from the NASDAQ Global Select Market, where it had previously traded under the symbol “FISV”. At December 31, 2023, our common stock was held by 1,538 shareholders of record and by a significantly greater number of shareholders who hold shares in nominee or street name accounts with brokers. We have never paid dividends on our common stock and we do not anticipate paying dividends in the foreseeable future. For additional information regarding our expected use of capital, refer to the discussion in this report under the heading “Management’s Discussion and Analysis of Financial Condition and Results of Operations – Liquidity and Capital Resources.”
Issuer Purchases of Equity Securities
The table below sets forth information with respect to purchases made by or on behalf of us or any “affiliated purchaser” (as defined in Rule 10b-18(a)(3) under the Securities Exchange Act of 1934) of shares of our common stock during the three months ended December 31, 2023:
| Period | Total Number of Shares Purchased | Average Price Paid per Share | Total Number of Shares Purchased as Part of Publicly Announced Plans or Programs (1) | Maximum Number of Shares that May Yet Be Purchased Under the Plans or Programs (1) | ||||||||||||||||||||||
| October 1-31, 2023 | 3,300,000 | $ | 113.22 | 3,300,000 | 57,243,104 | |||||||||||||||||||||
| November 1-30, 2023 | 2,330,468 | 122.71 | 2,330,468 | 54,912,636 | ||||||||||||||||||||||
| December 1-31, 2023 | 2,933,402 | 133.08 | 2,933,402 | 51,979,234 | ||||||||||||||||||||||
| Total | 8,563,870 | 8,563,870 | ||||||||||||||||||||||||
(1)On February 22, 2023, our board of directors authorized the purchase of up to 75.0 million shares of our common stock. This authorization does not expire.
Stock Performance Graph
The stock performance graph and related information presented below is not deemed to be “soliciting material” or to be “filed” with the Securities and Exchange Commission or subject to Regulation 14A or 14C under the Securities Exchange Act of 1934 or to the liabilities of Section 18 of the Securities Exchange Act of 1934 and will not be deemed to be incorporated by reference into any filing under the Securities Act of 1933 or the Securities Exchange Act of 1934, except to the extent we specifically incorporate it by reference into such a filing.
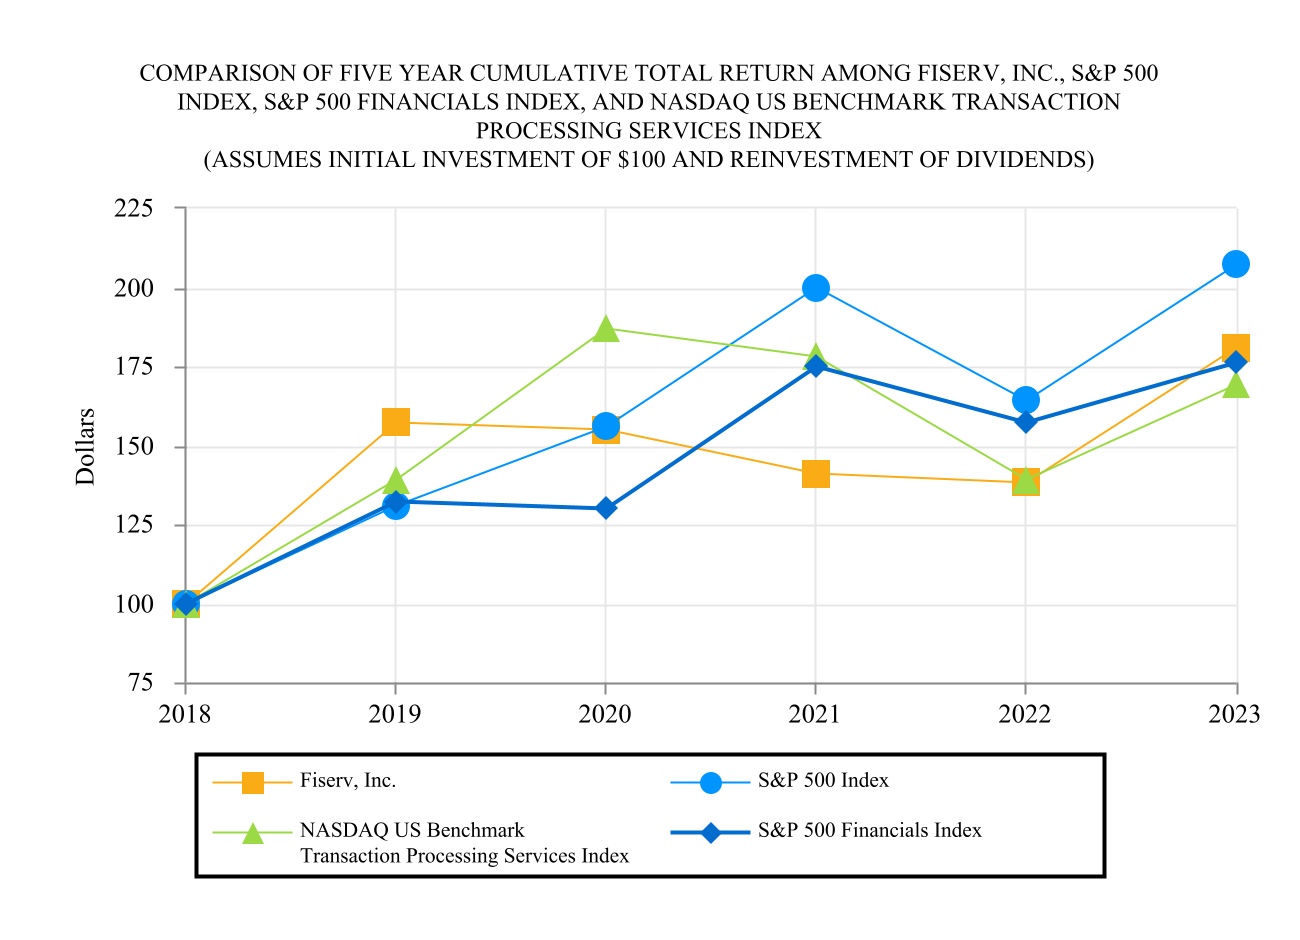
The following graph compares the cumulative total shareholder return on our common stock for the five years ended December 31, 2023 with the S&P 500 Index, the S&P 500 Financials Index and the NASDAQ US Benchmark Transaction Processing Services Index (the “Index”). Prior to September 21, 2020, the Index was known as the NASDAQ US Benchmark Financial Administration Index. The Index, as renamed, is identical to the NASDAQ US Benchmark Financial Administration Index prior to its name change on September 21, 2020. In connection with the transfer of the listing of our common stock to the New York Stock Exchange from the NASDAQ Global Select Market in 2023, we believe the S&P 500 Financials Index is a more appropriate published industry index for comparison purposes going forward as it contains a number of our peers. The graph assumes that $100 was invested on December 31, 2018 in our common stock and each index and that all dividends were reinvested. No cash dividends have been declared on our common stock. The comparisons in the graph are required by the Securities and Exchange Commission and are not intended to forecast or be indicative of possible future performance of our common stock.
| December 31, | |||||||||||||||||||||||||||||||||||
| 2018 | 2019 | 2020 | 2021 | 2022 | 2023 | ||||||||||||||||||||||||||||||
| Fiserv, Inc. | $ | 100 | $ | 157 | $ | 155 | $ | 141 | $ | 138 | $ | 181 | |||||||||||||||||||||||
| S&P 500 Index | 100 | 131 | 156 | 200 | 164 | 207 | |||||||||||||||||||||||||||||
| S&P 500 Financials Index | 100 | 132 | 130 | 175 | 157 | 176 | |||||||||||||||||||||||||||||
| NASDAQ US Benchmark Transaction Processing Services Index | 100 | 139 | 187 | 178 | 139 | 169 |
Previous: Item 4. Mine Safety Disclosures · Next: Item 6. [Reserved]