 filings.tools
Comfort Systems USA 10-K 2014-12-31
Filed 2015-02-26. 17 sections, 328K characters. Original on sec.gov · Markdown · JSON
Cover and table of contents
10-K 1 a2223211z10-k.htm 10-K
Use these links to rapidly review the document
ITEM 8. Financial Statements and Supplementary Data
**UNITED STATES SECURITIES AND EXCHANGE COMMISSION **Washington, D.C. 20549
Form 10-K
| ANNUAL REPORT PURSUANT TO SECTION 13 OR 15(d) OF THE SECURITIES EXCHANGE ACT OF 1934 | ||
| **For the Fiscal Year Ended December 31, 2014 ** |
Commission file number: 1-13011
**Comfort Systems USA, Inc. **(Exact name of registrant as specified in its charter)
| Delaware (State or Other Jurisdiction of Incorporation or Organization) | 76-0526487 (I.R.S. Employer Identification No.) |
675 Bering Drive Suite 400 Houston, Texas 77057 (713) 830-9600 (Address and telephone number of Principal Executive Offices)
Securities registered pursuant to Section 12(b) of the Act:
| Title of Each Class | Name of Each Exchange on which Registered | |
| Common Stock, $.01 par value | New York Stock Exchange |
Securities registered pursuant to Section 12(g) of the Act: None
Indicate by check mark if the registrant is a well-known seasoned issuer, as defined in Rule 405 of the Securities Act. Yes o No ý
Indicate by check mark if the registrant is not required to file reports pursuant to Section 13 or 15(d) of the Act. Yes o No ý
Indicate by check mark whether the registrant (1) has filed all reports required to be filed by Section 13 or 15(d) of the Securities Exchange Act of 1934 during the preceding 12 months (or for such shorter period that the registrant was required to file such reports), and (2) has been subject to such filing requirements for the past 90 days. Yes ý No o
Indicate by check mark whether the registrant has submitted electronically and posted on its corporate Website, if any, every Interactive Data File required to be submitted and posted pursuant to Rule 405 of Regulation S-T (§ 232.405 of this chapter) during the preceding 12 months (or for such shorter period that the registrant was required to submit and post such files). Yes ý No o
Indicate by check mark if disclosure of delinquent filers pursuant to Item 405 of Regulation SK is not contained herein, and will not be contained, to the best of the registrant's knowledge, in definitive proxy or information statements incorporated by reference in Part III of this Form 10-K or any amendment to this Form 10-K. o
Indicate by check mark whether the registrant is a large accelerated filer, an accelerated filer, a non-accelerated filer, or a smaller reporting company. See definitions of "large accelerated filer," "accelerated filer" and "smaller reporting company," in Rule 12b-2 of the Exchange Act. (Check one):
| Large accelerated filer o | Accelerated filer ý | Non-accelerated filer o (Do not check if a smaller reporting company) | Smaller reporting company o |
Indicate by check mark whether the registrant is a shell company (as defined in Exchange Act Rule 12b-2). Yes o No ý
The aggregate market value of the voting stock held by non-affiliates of the registrant at June 30, 2014 was approximately $596.4 million, based on the $15.80 last sale price of the registrant's common stock on the New York Stock Exchange on June 30, 2014.
As of February 20, 2015, 37,269,779 shares of the registrant's common stock were outstanding (excluding treasury shares of 3,853,586).
DOCUMENTS INCORPORATED BY REFERENCE
The information required by Part III (other than the required information regarding executive officers) is incorporated by reference from the registrant's definitive proxy statement, which will be filed with the Commission not later than 120 days following December 31, 2014.
**TABLE OF CONTENTS **
FORWARD-LOOKING STATEMENTS
Certain statements and information in this Annual Report on Form 10-K may constitute forward-looking statements within the meaning of the Private Securities Litigation Reform Act of 1995. The words "believe," "expect," "anticipate," "plan," "intend," "foresee," "should," "would," "could," or other similar expressions are intended to identify forward-looking statements, which are generally not historic in nature. These forward-looking statements are based on the current expectations and beliefs of Comfort Systems USA, Inc. and its subsidiaries (collectively, the "Company") concerning future developments and their effect on the Company. While the Company's management believes that these forward-looking statements are reasonable as and when made, there can be no assurance that future developments affecting the Company will be those that it anticipates. All comments concerning the Company's expectations for future revenue and operating results are based on the Company's forecasts for its existing operations and do not include the potential impact of any future acquisitions. The Company's forward-looking statements involve significant risks and uncertainties (some of which are beyond the Company's control) and assumptions that could cause actual future results to differ materially from the Company's historical experience and its present expectations or projections. Known material factors that could cause the Company's actual results to differ from those in the forward-looking statements are those described in Part I, "Item 1A. Risk Factors."
Readers are cautioned not to place undue reliance on forward-looking statements, which speak only as of the date hereof. The Company undertakes no obligation to publicly update or revise any forward-looking statements after the date they are made, whether as a result of new information, future events, or otherwise.
**PART I **
The terms "Comfort Systems," "we," "us," or "the Company" refer to Comfort Systems USA, Inc. or Comfort Systems USA, Inc. and its consolidated subsidiaries, as appropriate in the context.
Item 1. Business
Comfort Systems USA, Inc., a Delaware corporation, was established in 1997. We provide comprehensive heating, ventilation and air conditioning ("HVAC") installation, maintenance, repair and replacement services within the mechanical services industry. We have 37 operating units in 83 cities and 92 locations throughout the United States.
We operate primarily in the commercial, industrial and institutional HVAC markets and perform most of our services in industrial, healthcare, education, office, technology, retail and government facilities. In addition to standard HVAC services, we provide specialized applications such as building automation control systems, fire protection, process cooling, electronic monitoring and process piping. Certain locations also perform related activities such as electrical service and plumbing. Approximately 99% of our consolidated 2014 revenue was derived from commercial, industrial and institutional customers and large multi-family residential projects. Approximately 44% of our revenue was attributable to installation services in newly constructed facilities and 56% was attributable to maintenance, repair and replacement services. Our consolidated 2014 revenue was derived from the
following service activities, all of which are in the mechanical services industry, the single industry segment we serve:
| Service Activity | Percentage of Revenue | |||
| HVAC | 74 | % | ||
| Plumbing | 16 | % | ||
| Building Automation Control Systems | 6 | % | ||
| Other | 4 | % | ||
| | | | | |
| Total | 100 | % | ||
| | | | | |
| | | | | |
| | | | | |
Our Internet address is http://www.comfortsystemsusa.com. We make available free of charge on or through our website our annual report on Form 10-K, quarterly reports on Form 10-Q, current reports on Form 8-K, and amendments to those reports filed or furnished pursuant to Section 13(a) or 15(d) of the Exchange Act as soon as reasonably practicable after we electronically file such material with, or furnish it to, the Securities and Exchange Commission. Our website also includes our code of ethics, titled "Corporate Compliance Policy: Standards and Procedures Regarding Business Practices," together with other governance materials including our corporate governance standards and our Board committee charters. Printed versions of our code of ethics and our corporate governance standards may be obtained upon written request to our Corporate Compliance Officer at our headquarters address.
Industry Overview
We believe that the commercial, industrial, and institutional HVAC industry has historically generated annual revenue in excess of $40 billion. HVAC systems are necessary to virtually all commercial, industrial and institutional buildings as well as homes. Because most buildings are sealed, HVAC systems provide the primary method of circulating fresh air in such buildings. In many instances, replacing an aging system with a modern, energy-efficient HVAC system significantly reduces a building's operating costs and improves air quality and HVAC system effectiveness. Older commercial, industrial and institutional facilities often have poor air quality as well as inadequate air conditioning, and older HVAC systems result in significantly higher energy costs than do modern systems. These factors cause many facility owners to consider replacing older systems before the end of their functioning lives.
Many factors positively affect HVAC industry growth, particularly (i) population growth, which has increased the need for commercial, industrial and institutional space, (ii) an aging installed base of buildings and HVAC environmental and energy efficiency equipment, (iii) increasing sophistication, complexity and efficiency of HVAC systems, (iv) growing emphasis on environmental and energy efficiency, and (v) reduction or elimination of the refrigerants commonly used in older HVAC systems. We believe these factors should increase demand for the reconfiguration or replacement of existing HVAC systems and may also mitigate, to some extent, the effect on the HVAC industry of the cyclicality inherent in the traditional construction industry.
The HVAC industry can be broadly divided into two functions:
installation in newly constructed facilities, which provided approximately 44% of our revenue in 2014, and
maintenance, repair and replacement in existing facilities, which provided the remaining 56% of our 2014 revenue.
Installation Services—Installation services consist of "design and build" and "plan and spec" projects. In "design and build" projects, the commercial HVAC company is responsible for designing, engineering and installing a cost-effective, energy-efficient system customized to the specific needs of
the building owner. Costs and other project terms are normally negotiated between the building owner or its representative and the HVAC company. Companies that specialize in "design and build" projects generally have specially trained HVAC engineers, CAD/CAM design systems and in-house sheet metal and prefabrication capabilities. These companies use a consultative approach with customers and tend to develop long-term relationships with building owners and developers, general contractors, architects, consulting engineers and property managers. "Plan and spec" installation refers to projects in which a third-party architect or consulting engineer designs the HVAC systems and the installation project is "put out for bid." We believe that "plan and spec" projects usually take longer to complete than "design and build" projects because the system design and installation process generally are not integrated, thus resulting in more frequent adjustments to the technical specifications of the project and corresponding changes in work requirements and schedules. Furthermore, in "plan and spec" projects, the HVAC company is not responsible for project design and other parties must also approve any changes, thereby increasing overall project time and cost.
Maintenance, Repair and Replacement Services—These services include maintaining, repairing, replacing, reconfiguring and monitoring previously installed HVAC systems and building automation controls. The growth and aging of the installed base of HVAC systems and the demand for more efficient and sophisticated systems and building automation controls have fueled growth in this service line. The increasing complexity of these HVAC systems is leading many commercial, industrial and institutional building owners and property managers to increase attention to maintenance and to outsource maintenance and repair, often through service agreements with HVAC service providers. State-of-the-art control and monitoring systems feature electronic sensors and microprocessors. These systems require specialized training to install, maintain and repair, and the typical building engineer employed directly by a building owner or manager has not received this training. Increasingly, HVAC systems in commercial, industrial and institutional buildings are being remotely monitored through computer-based communications systems to improve energy efficiency and expedite problem diagnosis and correction, thereby allowing us to provide maintenance and repair services at a lower cost.
Strategy
We focus on strengthening operating competencies and on increasing profit margins. The key objectives of our strategy are to generate growth in our construction and service operations, improve productivity through innovation and to acquire complementing businesses. In order to accomplish our objectives we are currently focused on the following elements:
Achieve Excellence in Core Competencies—We have identified six core competencies that we believe are critical to attracting and retaining customers, increasing operating income and cash flow and creating additional employment opportunities. The six core competencies are: (i) customer cultivation and rapport, (ii) design and build expertise, (iii) estimating, (iv) job and cost tracking, (v) safety, and (vi) service capability.
Achieve Operating Efficiencies—We think we can achieve operating efficiencies and cost savings through purchasing economies, adopting "best practices" operating programs, and focusing on job management to deliver services in a cost-effective and efficient manner. We have placed great emphasis on improving the "job loop" at our locations—qualifying, estimating, pricing and executing projects effectively and efficiently, then promptly assessing project experience for applicability to current and future projects. We also use our combined purchasing to gain volume discounts on products and services such as HVAC components, raw materials, services, vehicles, bonding, insurance and employee benefits.
Attract, Retain and Invest in our Employees—We seek to attract and retain quality employees by providing them an enhanced career path from working for a larger company, the opportunity to realize a more stable income and attractive benefits packages. Over the past few years we have increased our
already substantial investments in training, including programs for project managers, field superintendents, service managers, sales managers, estimators, and more recently, leadership and development of key managers and leaders. We believe these programs can lead to significantly increased efficiency and growth.
Focus on Commercial, Industrial and Institutional Markets—We primarily focus on the commercial, industrial and institutional markets, with particular emphasis on "design and build" installation services, and on maintenance, repair and replacement services. We believe that the commercial, industrial and institutional HVAC markets are attractive because of their growth opportunities, large and diverse customer base, attractive margins and potential for long-term relationships with building owners, property managers, general contractors and architects. Approximately 99% of our consolidated 2014 revenue was derived from commercial, industrial and institutional customers and large multi-family residential projects.
Leveraging Resources and Capabilities—We believe significant operating efficiencies can be achieved by leveraging resources among our operating locations. For example, we have shifted certain fabrication activities into centralized locations in order to increase asset utilization. We opportunistically allocate our engineering, field and supervisory labor from one operation to another to more fully use our employee base, meet our customers' needs and share expertise. We believe we have realized scale benefits from combining purchasing, insurance, benefits, bonding and financing activities across our operations. We also believe larger regional and national commercial, industrial and institutional entities can benefit from consolidating their HVAC needs through our national service business and we operate a national call center to dispatch technicians to regional and national sites requiring service and small projects.
Maintain a Diverse Customer, Geographic and Project Base—We have a well-diversified distribution of revenue across end-use sectors that we believe reduces our exposure to negative developments in any given sector. We also have significant geographical diversification across all regions of the United States, again reducing our exposure to negative developments in any given region. Our distribution of revenue in 2014 by end-use sector was as follows:
| Manufacturing | 24 | % | ||
| Education | 17 | % | ||
| Healthcare | 12 | % | ||
| Office Buildings | 12 | % | ||
| Government | 11 | % | ||
| Retail/Restaurants | 7 | % | ||
| Multi-Family | 7 | % | ||
| Lodging and Entertainment | 5 | % | ||
| Distribution | 1 | % | ||
| Religious/Not for profit | 1 | % | ||
| Residential | 1 | % | ||
| Other | 2 | % | ||
| | | | | |
| Total | 100 | % | ||
| | | | | |
| | | | | |
| | | | | |
Approximately 82% of our revenue is earned on a project basis for installation of HVAC systems in newly constructed facilities or for replacement of HVAC systems in existing facilities. As of December 31, 2014, we had 4,074 projects in process with an aggregate contract value of approximately $1,988.3 million. Our average project takes six to nine months to complete, with an average contract price of approximately $488,000. This average project size, when taken together with the approximately 18% of our revenue derived from maintenance and service, provides us with a broad base of work in
the construction services sector. A stratification of projects in progress as of December 31, 2014, by contract price, is as follows:
| Contract Price of Project | No. of Projects | Aggregate Contract Price Value (millions) | |||||
| Under $1 million | 3,683 | $ | 380.8 | ||||
| $1 million - $5 million | 297 | 683.4 | |||||
| $5 million - $10 million | 64 | 442.5 | |||||
| $10 million - $15 million | 14 | 172.3 | |||||
| Greater than $15 million | 16 | 309.3 | |||||
| | | | | | | | |
| Total | 4,074 | $ | 1,988.3 | ||||
| | | | | | | | |
| | | | | | | | |
| | | | | | | | |
Strategic Service Initiative. Over the last two years we have made substantial incremental investments to expand our service revenue. We are actively concentrating existing and new managerial and sales resources on training and hiring experienced employees to sell and profitably perform service work. In many locations we have added or upgraded our service capability, and we believe our investments and efforts are providing a compelling customer value offering that will ultimately stimulate growth in all aspects of our construction, service and repair businesses.
Seek Growth through Expansion and Acquisitions—We believe that we can increase our cash flow and operating income by opportunistically entering new markets or service lines through expansion and acquisition. We continually seek opportunities to acquire businesses that have attractive valuations and meet other criteria involving financial, operational, management and geographic considerations.
Operations and Services Provided
We provide a wide range of installation, maintenance, repair and replacement services for HVAC and related systems in commercial, industrial and institutional properties. We manage our locations on a decentralized basis, with local management maintaining responsibility for day-to-day operating decisions. Our local management is augmented by regional leadership that focuses on core business competencies, regional financial performance, cooperation and coordination between locations, implementing best practices and corporate initiatives. In addition to senior management, local personnel generally include design engineers, sales personnel, customer service personnel, installation and service technicians, sheet metal and prefabrication technicians, estimators and administrative personnel. We have centralized certain administrative functions such as insurance, employee benefits, training, safety programs, marketing and cash management to enable our local operating management to focus on pursuing new business opportunities and improving operating efficiencies. We also combine certain back office and administrative functions at various locations.
Installation Services—Our installation business related to newly constructed facilities, which comprised approximately 44% of our consolidated 2014 revenue, involves the design, engineering, integration, installation and start-up of HVAC, building automation controls and related systems. We provide "design and build" and "plan and spec" installation services for office buildings, retail centers, apartment complexes, manufacturing plants, healthcare, education and government facilities and other commercial, industrial and institutional facilities. In a "design and build" installation, working with the customer, we determine the needed capacity and energy efficiency of the HVAC system that best suits the proposed facility. We then estimate the amount of time, labor, materials and equipment needed to build the specified system. The final design, terms, price and timing of the project are then negotiated with the customer or its representatives, after which any necessary modifications are made to the system plan. In "plan and spec" installation, we participate in a bid process to provide labor,
equipment, materials and installation based on plans and engineering specifications provided by a customer, general contractor or consulting engineer.
Once an agreement has been reached, we order the necessary materials and equipment for delivery to meet the project schedule. In many instances, we fabricate the ductwork and piping and assemble certain components for the system based on the mechanical drawing specifications, eliminating the need to subcontract ductwork or piping fabrication. Then we install the system at the project site, working closely with the general contractor. Our average project takes six to nine months to complete, with an average contract price of approximately $488,000. We also perform larger project work, with 391 contracts in progress at December 31, 2014 with contract prices in excess of $1 million. Our largest project currently in progress has a contract price of $30.9 million. Project contracts typically provide for periodic billings to the customer as we meet progress milestones or incur cost on the project. Project contracts in our industry also frequently allow for a small portion of progress billings or contract price to be withheld by the customer until after we have completed the work, typically for six months. Amounts withheld under this practice are known as retention or retainage.
We also install process cooling systems and building automation controls and monitoring systems. Process cooling systems are used primarily in industrial facilities to provide heating and/or cooling to precise temperature and climate standards for products being manufactured and for the manufacturing equipment. Building automation control systems are used in HVAC and process cooling systems to maintain pre-established temperature or climate standards for commercial or industrial facilities. Building automation control systems are capable not only of controlling a facility's entire HVAC system, often on a room-by-room basis, but can also be programmed to integrate energy management, and monitoring for purposes of security, fire, card key access, lighting and other building systems. This monitoring can be performed on-site or remotely through a computer-based communications system. The monitoring system communicates an exception when a system is operating outside pre-established parameters. Diagnosis of potential problems and remedial adjustments can often be performed remotely from system monitoring terminals.
Maintenance, Repair and Replacement Services—Our maintenance, repair and replacement services comprised approximately 56% of our consolidated 2014 revenue and include the maintenance, repair, replacement, reconfiguration and monitoring of HVAC systems and industrial process piping. Approximately 68% of our maintenance, repair and replacement revenue were derived from replacing and reconfiguring existing HVAC systems for commercial, industrial and institutional customers. Replacement and reconfiguration are usually performed on a project basis and often use consultative expertise similar to that provided in the "design and build" installation market.
Maintenance and repair services are provided either in response to service calls or under a service agreement. Service calls are coordinated by customer service representatives or dispatchers that use computer and communication technology to process orders, arrange service calls, communicate with customers, dispatch technicians and invoice customers. Service technicians work from service vehicles equipped with commonly used parts, supplies and tools to complete a variety of jobs. Commercial, industrial and institutional service agreements usually have terms of one to three years, with automatic annual renewals, and typically with thirty- to sixty-day cancellation notice periods. We also provide remote monitoring of temperature, pressure, humidity and air flow for HVAC systems. If the system is not operating within the specifications set forth by the customer and cannot be remotely adjusted, a service crew is dispatched to analyze and repair the system.
Sources of Supply
The raw materials and components we use include HVAC system components, ductwork, steel, sheet metal and copper tubing and piping. These raw materials and components are generally available from a variety of domestic or foreign suppliers at competitive prices. Delivery times are typically short
for most raw materials and standard components, but during periods of peak demand, may extend to one month or more. We estimate that direct purchase of commodities and finished products comprises between 10% and 15% of our average project cost. We have procedures to reduce commodity cost exposure; early buying of commodities for particular projects, or for general inventory, as well as including escalation and escape provisions in project bids and contracts wherever possible. The negative effects of unrecovered commodity cost inflation in our project results have been modest, and are reviewed further in Item 7 "Management's Discussion and Analysis of Financial Condition and Results of Operations" later in this report.
Chillers for large units typically have the longest delivery time and generally have lead times of up to six months. The major components of commercial HVAC systems are compressors and chillers that are manufactured primarily by Carrier, Lennox, McQuay, Trane and York. The major suppliers of building automation control systems are Honeywell, Johnson Controls, Siemens, York, Automated Logic, Novar and Andover Control Corporation. We do not have any significant contracts guaranteeing us a supply of raw materials or components.
Cyclicality and Seasonality
Historically, the construction industry has been highly cyclical. As a result, our volume of business may generally be adversely affected by declines in new installation and replacement projects in various geographic regions of the United States during periods of economic weakness.
The HVAC industry is subject to seasonal variations. Specifically, the demand for new installation and replacement is generally lower during the winter months (the first quarter of the year) due to reduced construction activity during inclement weather and less use of air conditioning during the colder months. Demand for HVAC services is generally higher in the second and third calendar quarters due to increased construction activity and increased use of air conditioning during the warmer months. Accordingly, we expect our revenue and operating results generally will be lower in the first and fourth calendar quarters.
Sales and Marketing
We have a diverse customer base, with no single customer accounting for more than 3% of consolidated 2014 revenue. Management and a dedicated sales force are responsible for developing and maintaining successful long-term relationships with key customers. Customers generally include building owners and developers and property managers, as well as general contractors, architects and consulting engineers. We intend to continue our emphasis on developing and maintaining long-term relationships with our customers by providing superior, high-quality service in a professional manner. We believe we can continue to leverage the diverse technical and marketing strengths at individual locations to expand the services offered in other local markets. With respect to multi-location service opportunities, we maintain a national sales force in our national accounts group.
Employees
As of December 31, 2014, we had 7,077 employees. We have collective bargaining agreements covering six employees. We have not experienced and do not expect any significant strikes or work stoppages and believe our relations with employees covered by collective bargaining agreements are good.
Recruiting, Training and Safety
Our continued success depends, in part, on our ability to continue to attract, retain and motivate qualified engineers, service technicians, field supervisors and project managers. We believe our success in retaining qualified employees will be based on the quality of our recruiting, training, compensation, employee benefits programs and opportunities for advancement. We provide numerous training programs for management, sales and leadership, as well as on-the-job training, technical training, apprenticeship programs, attractive benefit packages and career advancement opportunities within our company.
We have established comprehensive safety programs throughout our operations to ensure that all technicians comply with safety standards we have established and that are established under federal, state and local laws and regulations. Additionally, we have implemented a "best practices" safety program throughout our operations, which provides employees with incentives to improve safety performance and decrease workplace accidents. Safety leadership establishes safety programs and benchmarking to improve safety across the company. Finally, our employment screening process seeks to determine that prospective employees have requisite skills, sufficient background references and acceptable driving records, if applicable. Our rate of incidents recordable under the standards of the Occupational Safety and Health Administration ("OSHA") per one hundred employees per year, also known as the OSHA recordable rate, was 2.05 during 2014. This level was 29% better than the most recently published OSHA rate for our industry.
Insurance and Litigation
The primary insured risks in our operations are bodily injury, property damage and workers' compensation injuries. We retain the risk for workers' compensation, employer's liability, auto liability, general liability and employee group health claims resulting from uninsured deductibles per incident or occurrence. Because we have very large deductibles, the vast majority of our claims are paid by us, so as a practical matter we self-insure the great majority of these risks. Losses up to such per-incident deductible amounts are estimated and accrued based upon known facts, historical trends and industry averages using the assistance of an actuary to project the extent of these obligations.
We are subject to certain claims and lawsuits arising in the normal course of business. We maintain various insurance coverages to minimize financial risk associated with these claims. We have estimated and provided accruals for probable losses and related legal fees associated with certain litigation in our consolidated financial statements. While we cannot predict the outcome of these proceedings, in our opinion and based on reports of counsel, any liability arising from these matters individually and in the aggregate will not have a material effect on our operating results, cash flows or financial condition, after giving effect to provisions already recorded.
We typically warrant labor for the first year after installation on new HVAC systems and pass through to the customer manufacturers' warranties on equipment. We generally warrant labor for thirty days after servicing existing HVAC systems. We do not expect warranty claims to have a material adverse effect on our financial position or results of operations.
Competition
The HVAC industry is highly competitive and consists of thousands of local and regional companies. We believe that purchasing decisions in the commercial, industrial and institutional markets are based on (i) competitive price, (ii) long-term customer relationships, (iii) quality, timeliness and reliability of services provided, (iv) an organization's perceived stability based on years in business, financial strength and access to bonding, (v) range of services provided, and (vi) scale of operation. To improve our competitive position we focus on both the consultative "design and build" installation market and the maintenance, repair and replacement market to promote first the development and then the strengthening of long-term customer relationships. In addition, we believe our ability to provide multi-location coverage, access to project financing and specialized technical skills for facilities owners gives us a strategic advantage over smaller competitors who may be unable to provide these services to customers at a competitive price.
We believe that we are larger than most of our competitors, which are generally small, owner-operated companies that typically operate in a limited geographic area. However, there are divisions of larger contracting companies, utilities and HVAC equipment manufacturers that provide HVAC services in some of the same service lines and geographic areas we serve. Some of these competitors and
potential competitors have greater financial resources than we do to finance development opportunities and support their operations. We believe our smaller competitors generally compete with us based on price and their long-term relationships with local customers. Our larger competitors compete with us on those factors but may also provide attractive financing and comprehensive service and product packages.
Vehicles
We operate a fleet of various owned or leased service trucks, vans and support vehicles. We believe these vehicles generally are well maintained and sufficient for our current operations.
Governmental Regulation and Environmental Matters
Our operations are subject to various federal, state and local laws and regulations, including: (i) licensing requirements applicable to engineering, construction and service technicians, (ii) building and HVAC codes and zoning ordinances, (iii) regulations relating to consumer protection, including those governing residential service agreements, and (iv) regulations relating to worker safety and protection of the environment. We believe we have all required licenses to conduct our operations and are in substantial compliance with applicable regulatory requirements. If we fail to comply with applicable regulations we could be subject to substantial fines or revocation of our operating licenses.
Many state and local regulations governing the HVAC services trades require individuals to hold permits and licenses. In some cases, a required permit or license held by a single individual may be sufficient to authorize specified activities for all of our service technicians who work in the state or county that issued the permit or license. We seek to ensure that, where possible, we have two employees who hold any such permits or licenses that may be material to our operations in a particular geographic region.
Our operations are subject to the federal Clean Air Act, as amended, which governs air emissions and imposes specific requirements on the use and handling of chlorofluorocarbons, or CFCs, and certain other refrigerants. Clean Air Act regulations require the certification of service technicians involved in the service or repair of equipment containing these refrigerants and also regulate the containment and recycling of these refrigerants. These requirements have increased our training expenses and expenditures for containment and recycling equipment. The Clean Air Act is intended ultimately to eliminate the use of CFCs in the United States and to require alternative refrigerants to be used in replacement HVAC systems. We do not believe these regulations involving CFCs will materially affect our business on the whole because, although they require us to incur modest ongoing training costs, our competitors also incur such costs, and the regulations may encourage our customers to update their HVAC systems.
Executive Officers
We have five executive officers.
Brian Lane, age 57, has served as our Chief Executive Officer and President since December 2011 and as a director since 2010. Mr. Lane served as our President and Chief Operating Officer from March 2010 until December 2011. Mr. Lane joined the Company in October 2003 and served as Vice President and then Senior Vice President for Region One of the Company until he was named Executive Vice President and Chief Operating Officer in January 2009. Prior to joining the Company, Mr. Lane spent fifteen years at Halliburton, a global provider of products and services to energy, industrial, and government customers, including employment by Brown and Root, an engineering and construction company. During his tenure, he held various positions in business development, strategy, and project activities, including the position of Regional Director of Europe and Africa. Additionally,
he held the position of Vice President at Kvaerner, an international engineering and construction company.
William George, age 50, has served as our Executive Vice President and Chief Financial Officer since May 2005, was our Senior Vice President, General Counsel and Secretary from May 1998 to May 2005, and was our Vice President, General Counsel and Secretary from March 1997 to April 1998. From October 1995 to February 1997, Mr. George was Vice President and General Counsel of American Medical Response, Inc., a publicly-traded healthcare transportation company. From September 1992 to September 1995, Mr. George practiced corporate and antitrust law at Ropes & Gray, a Boston, Massachusetts law firm.
Julie S. Shaeff, age 49, has served as our Senior Vice President and Chief Accounting Officer since May 2005, was our Vice President and Corporate Controller from March 2002 to May 2005, and was our Assistant Corporate Controller from September 1999 to February 2002. From 1996 to August 1999, Ms. Shaeff was Financial Accounting Manager—Corporate Controllers Group for Browning-Ferris Industries, Inc., a publicly-traded waste services company. From 1987 to 1995, she held various positions with Arthur Andersen LLP. Ms. Shaeff is a Certified Public Accountant.
Trent T. McKenna, age 42, has served as our Senior Vice President, General Counsel and Secretary since August 2013, was our Vice President, General Counsel and Secretary from May 2005 to August 2013, and was our Associate General Counsel from August 2004 to May 2005. From February 1999 to August 2004, Mr. McKenna was a practicing attorney in the area of complex commercial litigation in the Houston, Texas office of Akin Gump Strauss Hauer & Feld LLP, an international law firm.
James Mylett, age 51, has served as our Senior Vice President of Service since October 2013. Prior to joining the Company, Mr. Mylett spent fourteen years at Johnson Controls, which manufactures, installs, and services automatic temperature regulation systems for buildings. During his time at Johnson Controls, Mr. Mylett held various positions, including that of Vice President and General Manager—North America Service Operations from August 2011 to October 2013. From October 2010 to August 2011, he served as Vice President and General Manager—West Region, and from December 2005 to September 2010, he served as Vice President of Service and Solutions—South Region. Previously, Mr. Mylett worked for Carrier Corporation, where he established and developed the company's national accounts service business.
Item 1A. Risk Factors
_**
Our business is subject to a variety of risks. You should carefully consider the risks described below, together with all the information included in this report. Our business, financial condition and results of operations could be adversely affected by the occurrence of any of these events, which could cause actual results to differ materially from expected and historical results, and the trading price of our common stock could decline.
Many of the markets we do work in are currently experiencing or have recently experienced an economic downturn that may materially and adversely affect our business because our business is dependent on levels of construction activity.
The demand for our services is dependent upon the existence of construction projects and service requirements within the markets in which we operate. Any period of economic recession affecting a market or industry in which we transact business is likely to adversely impact our business. Many of the projects we work on have long lifecycles from conception to completion, and the bulk of our performance generally occurs late in a construction project's lifecycle. We experience the results of economic trends well after an economic cycle begins, and therefore will continue to experience the results of an economic recession well after conditions in the general economy have improved. Further, some of the local or regional markets we do work in have yet to enter a period of sustained recovery.
We cannot predict the severity or lasting effects of the recent recession, particularly in some local or regional markets that have not yet entered a period of sustained recovery. We believe that the current uncertainty about economic conditions caused by the recent recession means that many of our customers are likely to continue to postpone spending while credit markets remain disinclined to fund commercial and industrial developments. The industries and markets we operate in have always been and will continue to be vulnerable to these general macroeconomic downturns because they are cyclical in nature. The recent recession caused a drop off in the demand for projects within our markets and industries in some regions and continues to cause a similar drop off in other regions. The drop off in demand has led to and will likely continue to lead to greater price competition as well as decreased revenue and profit. The lasting effects of the recent recession have increased economic instability with our vendors, subcontractors, developers, and general contractors, which has caused us greater liability exposure and has resulted in us not being paid on some projects, as well as decreasing our revenue and profit. Further, to the extent more of our vendors, subcontractors, developers, or general contractors seek bankruptcy protection, the bankruptcy will likely force us to incur additional costs in attorneys' fees, as well as other professional consultants, and will result in decreased revenue and profit.
The percentage of our profits and revenue attributable to projects performed directly or indirectly for federal, state, and local government entities increased during and as a result of the economic downturn, in part because the private-sector decreased its investment in construction and building projects, but has decreased during 2014. A continuing reduction in federal, state, or local government spending in our industries and markets could result in decreased revenue and profit.
Because we bear the risk of cost overruns in most of our contracts, we may experience reduced profits or, in some cases, losses under these contracts if costs increase above our estimates.
Our contract prices are established largely upon estimates and assumptions of our projected costs, including assumptions about: future economic conditions; prices, including commodities prices; availability of labor, including the costs of providing labor, equipment, and materials; and other factors outside our control. If our estimates or assumptions prove to be inaccurate, if circumstances change in a way that renders our assumptions and estimates inaccurate or we fail to successfully execute the work, cost overruns may occur and we could experience reduced profits or a loss for affected projects. For instance, unanticipated technical problems may arise, we could have difficulty obtaining permits or approvals, local laws, labor costs or labor conditions could change, bad weather could delay construction, raw materials prices could increase, our suppliers' or subcontractors' may fail to perform as expected or site conditions may be different than we expected. We are also exposed to increases in energy prices, particularly as they relate to gasoline prices. Additionally, in certain circumstances, we guarantee project completion or the achievement of certain acceptance and performance testing levels by a scheduled date. Failure to meet schedule or performance requirements typically results in additional costs to us, and in some cases we may also create liability for consequential and liquidated damages. Performance problems for existing and future projects could cause our actual results of operations to differ materially from those we anticipate and could damage our reputation within our industry and our customer base.
Our backlog is subject to unexpected adjustments and cancellations, which means that amounts included in our backlog may not result in actual revenue or translate into profits.
The revenue projected from our backlog may not be realized, or, if realized, may not result in profits. Projects may remain in our backlog for an extended period of time, or project cancellations or scope adjustments may occur with respect to contracts reflected in our backlog.
Intense competition in our industry could reduce our market share and our profit.
The markets we serve are highly competitive. Our industry is characterized by many small companies whose activities are geographically concentrated. We compete on the basis of our technical expertise and experience, financial and operational resources, nationwide presence, industry reputation and dependability. While we believe our customers consider a number of these factors in awarding available contracts, a large portion of our work is awarded through a bid process. Consequently, price is often the principal factor in determining which contractor is selected, especially on smaller, less complex projects. Smaller competitors are sometimes able to win bids for these projects based on price alone due to their lower cost and financial return requirements. We expect competition to intensify in our industry, presenting us with significant challenges in our ability to maintain strong growth rates and acceptable profit margins. We also expect increased competition from in-house service providers, because some of our customers have employees who perform service work similar to the services we provide. Vertical consolidation is also expected to intensify competition in our industry. If we are unable to meet these competitive challenges, we will lose market share to our competitors and experience an overall reduction in our profits. In addition, our profitability would be impaired if we have to reduce our prices to remain competitive.
Our recent and future acquisitions may not be successful.
We expect to continue pursuing selective acquisitions of businesses. We cannot assure that we will be able to locate acquisitions or that we will be able to consummate transactions on terms and conditions acceptable to us, or that acquired businesses will be profitable. Acquisitions may expose us to additional business risks different than those we have traditionally experienced. We also may encounter difficulties integrating acquired businesses and successfully managing the growth we expect to experience from these acquisitions.
We may choose to finance future acquisitions with debt, equity, cash or a combination of the three. We can give no assurances that any future acquisitions will not dilute earnings or disrupt the payment of a stockholder dividend. To the extent we succeed in making acquisitions, a number of risks will result, including:
the assumption of material liabilities (including for environmental-related costs);
failure of due diligence to uncover situations that could result in legal exposure or to quantify the true liability exposure from known risks;
the diversion of management's attention from the management of daily operations to the integration of operations;
difficulties in the assimilation and retention of employees, in the assimilation of different cultures and practices, in the assimilation of broad and geographically dispersed personnel and operations, and the retention of employees generally;
the risk of additional financial and accounting challenges and complexities in areas such as tax planning, treasury management, financial reporting and internal controls; and
we may not be able to realize the cost savings or other financial benefits we anticipated prior to the acquisition.
The failure to successfully integrate acquisitions could have an adverse effect on our business, financial condition and results of operations.
Information technology system failures, network disruptions or cyber security breaches could adversely affect our business.
We use sophisticated information technology systems, networks, and infrastructure in conducting some of our day-to-day operations and providing services to certain customers. Information technology system failures, including suppliers' or vendors' system failures, could disrupt our operations by causing transaction errors, processing inefficiencies, the loss of customers, other business disruptions or the loss of employee personal information. In addition, these systems, networks, and infrastructure may be vulnerable to deliberate cyber-attacks that interfere with their functionality or the confidentiality of our information or our customers' data. These events could impact our customers, employees and reputation and lead to financial losses from remediation actions, loss of business or potential liability or an increase in expense, all of which may have a material adverse effect on our business.
Third parties contribute significantly to our completion of many projects.
We hire third-party subcontractors to perform work and depend on third-party suppliers to provide equipment and materials necessary to complete our projects. If we are unable to retain qualified subcontractors or suppliers, or if our subcontractors or suppliers do not perform as anticipated for any reason, our execution and profitability could be harmed.
Goodwill impairment charges negatively impacted our earnings in 2011 and in previous years. Earnings for future periods may be impacted by additional charges for goodwill and intangible assets.
We carry a significant amount of goodwill and identifiable intangible assets on our consolidated balance sheets. Goodwill is the excess of purchase price over the fair value of the net assets of acquired businesses. We assess goodwill for impairment each year, and more frequently if circumstances suggest an impairment may have occurred. The recent recession, along with other factors, caused the fair value of some of our assets to be lower than their carrying value, resulting in an impairment to goodwill. We may determine at a future date that an additional significant impairment has occurred in the value of our unamortized intangible assets or fixed assets, which could require us to write off an additional portion of our assets and could adversely affect our financial condition or our reported results of operations.
Actual and potential claims, lawsuits and proceedings could ultimately reduce our profitability and liquidity and weaken our financial condition.
We are likely to continue to be named as a defendant in legal proceedings claiming damages from us in connection with the operation of our business. These actions and proceedings may involve claims for, among other things, compensation for alleged personal injury, workers' compensation, employment discrimination, breach of contract or property damage. In addition, we may be subject to class action lawsuits involving allegations of violations of the Fair Labor Standards Act and state wage and hour laws. Due to the inherent uncertainties of litigation, we cannot accurately predict the ultimate outcome of any such actions or proceedings. We also are, and are likely to continue to be, from time to time a plaintiff in legal proceedings against customers, in which we seek to recover payment of contractual amounts we are owed as well as claims for increased costs we incur. When appropriate, we establish provisions against possible exposures, and we adjust these provisions from time to time according to ongoing exposure. If our assumptions and estimates related to these exposures prove to be inadequate or inaccurate, we could experience a reduction in our profitability and liquidity and a weakening of our financial condition. In addition, claims, lawsuits and proceedings may harm our reputation or divert management resources away from operating our business.
A significant portion of our business depends on our ability to provide surety bonds. Any difficulties in the financial and surety markets may adversely affect our bonding capacity and availability.
In the past we have expanded, and it is possible we will continue to expand, the number and percentage of total contract dollars that require an underlying bond. Historically surety market conditions have experienced times of difficulty as a result of significant losses incurred by many surety companies and the results of macroeconomic trends outside of our control. Consequently, during times when less overall bonding capacity is available in the market, surety terms have become more expensive and more restrictive. As such, we cannot guarantee our ability to maintain a sufficient level of bonding capacity in the future, which could preclude our ability to bid for certain contracts or successfully contract with some customers. Additionally, even if we continue to be able to access bonding capacity to sufficiently bond future work, we may be required to post collateral to secure bonds, which would decrease the liquidity we would have available for other purposes. Our surety providers are under no commitment to guarantee our access to new bonds in the future; thus, our ability to access or increase bonding capacity is at the sole discretion of our surety providers. If our surety companies were to limit or eliminate our access to bonds, our alternatives would include seeking bonding capacity from other surety companies, increasing business with clients that do not require bonds and posting other forms of collateral for project performance, such as letters of credit or cash. We may be unable to secure these alternatives in a timely manner, on acceptable terms, or at all. As such, if we were to experience an interruption or reduction in the availability of bonding capacity, it is likely we would be unable to compete for or work on certain projects.
Our use of the percentage-of-completion method of accounting could result in a reduction or reversal of previously recorded revenue or profits.
A material portion of our revenue is recognized using the percentage-of-completion method of accounting, which results in our recognizing contract revenue and earnings ratably over the contract term in the proportion that our actual costs bear to our estimated contract costs. The earnings or losses recognized on individual contracts are based on estimates of contract revenue, costs and profitability. We review our estimates of contract revenue, costs and profitability on an ongoing basis. Prior to contract completion, we may adjust our estimates on one or more occasions as a result of change orders to the original contract, collection disputes with the customer on amounts invoiced or claims against the customer for increased costs incurred by us due to customer-induced delays and other factors. Contract losses are recognized in the fiscal period when the loss is determined. Contract profit estimates are also adjusted in the fiscal period in which it is determined that an adjustment is required. As a result of the requirements of the percentage-of-completion method of accounting, the possibility exists, for example, that we could have estimated and reported a profit on a contract over several periods and later determined, usually near contract completion, that all or a portion of such previously estimated and reported profits were overstated. If this occurs, the full aggregate amount of the overstatement will be reported for the period in which such determination is made, thereby eliminating all or a portion of any profits from other contracts that would have otherwise been reported in such period or even resulting in a loss being reported for such period. On a historical basis, we believe that we have made reasonably reliable estimates of the progress towards completion on our long-term contracts. However, given the uncertainties associated with these types of contracts, it is possible for actual costs to vary from estimates previously made, which may result in reductions or reversals of previously recorded revenue and profits.
We are a decentralized company and place significant decision making powers with our subsidiaries' management, which presents certain risks.
We believe that our practice of placing significant decision making powers with local management is important to our successful growth and allows us to be responsive to opportunities and to our
customers' needs. However, this practice presents certain risks, including the risk that we may be slower or less effective in our attempts to identify or react to problems affecting an important business than we would under a more centralized structure or that we would be slower to identify a misalignment between a subsidiary's and the Company's overall business strategy. Further, if a subsidiary location fails to follow the Company's compliance policies, we could be made party to a contract, arrangement or situation that requires the assumption of large liabilities or has less advantageous terms than is typically found in the market.
Our insurance policies against many potential liabilities require high deductibles, and our risk management policies and procedures may leave us exposed to unidentified or unanticipated risks. Additionally, difficulties in the insurance markets may adversely affect our ability to obtain necessary insurance.
Although we maintain insurance policies with respect to our related exposures, these policies are subject to high deductibles; as such, we are, in effect, self-insured for substantially all of our typical claims. We hire an actuary to determine any liabilities for unpaid claims and associated expenses for the three major lines of coverage (workers' compensation, general liability and auto liability). The determination of these claims and expenses and the appropriateness of the estimated liability are reviewed and updated quarterly. However, insurance liabilities are difficult to assess and estimate due to the many relevant factors, the effects of which are often unknown, including the severity of an injury, the determination of our liability in proportion to other parties, the number of incidents that have occurred but are not reported and the effectiveness of our safety program. Our accruals are based on known facts, historical trends (both internal trends and industry averages) and our reasonable estimate of our future expenses. We believe our accruals are adequate. However, our risk management strategies and techniques may not be fully effective in mitigating our risk exposure in all market environments or against all types of risk. If any of the variety of instruments, processes or strategies we use to manage our exposure to various types of risk are not effective, we may incur losses that are not covered by our insurance policies or that exceed our accruals or coverage limits.
Additionally, we typically are contractually required to provide proof of insurance on projects we work on. Historically insurance market conditions become more difficult for insurance consumers during periods when insurance companies suffer significant investment losses as well as casualty losses. Consequently, it is possible that insurance markets will become more expensive and restrictive. Also, our prior casualty loss history might adversely affect our ability to procure insurance within commercially reasonable ranges. As such, we may not be able to maintain commercially reasonable levels of insurance coverage in the future, which could preclude our ability to work on many projects. Our insurance providers are under no commitment to renew our existing insurance policies in the future; therefore, our ability to obtain necessary levels or kinds of insurance coverage is subject to market forces outside our control. If we were unable to obtain necessary levels of insurance, it is likely we would be unable to compete for or work on most projects.
Failure to remain in compliance with covenants under our credit agreement, service our indebtedness, or fund our other liquidity needs could adversely impact our business.
Our credit agreement and related restrictive and financial covenants are more fully described in Note 9 of "Notes to the Consolidated Financial Statements." Our failure to comply with any of these covenants, or to pay principal, interest or other amounts when due thereunder, would constitute an event of default under the credit agreement. Default under our credit agreement could result in (1) us no longer being entitled to borrow under the agreement; (2) termination of the agreement; (3) acceleration of the maturity of outstanding indebtedness under the agreement; and/or (4) foreclosure on any collateral securing the obligations under the agreement. On July 22, 2014, we executed an amendment to the credit agreement, which terms include, among other things a revised maximum Total Leverage Ratio. If we are unable to service our debt obligations or fund our other liquidity needs, we could be forced to curtail our operations, reorganize our capital structure (including through bankruptcy proceedings) or liquidate some or all of our assets in a manner that could cause holders of our securities to experience a partial or total loss of their investment in us.
If we experience delays and/or defaults in customer payments, we could be unable to recover all expenditures.
Because of the nature of our contracts, at times we commit resources to projects prior to receiving payments from the customer in amounts sufficient to cover expenditures on projects as they are incurred. Delays in customer payments may require us to make a working capital investment. If a customer defaults in making their payments on a project to which we have devoted resources, it could have a material negative effect on our results of operations.
If we are unable to attract and retain qualified managers and employees, we will be unable to operate efficiently, which could reduce our profitability.
Our business is labor intensive, and many of our operations experience a high rate of employment turnover. At times of low unemployment rates in the United States, it will be more difficult for us to find qualified personnel at low cost in some geographic areas where we operate. Additionally, our business is managed by a small number of key executive and operational officers. We may be unable to hire and retain the sufficient skilled labor force necessary to operate efficiently and to support our growth strategy. Our labor expenses may increase as a result of a shortage in the supply of skilled personnel. Labor shortages, increased labor costs or the loss of key personnel could reduce our profitability and negatively impact our business. Further, our relationship with some customers could suffer if we are unable to retain the employees with whom those customers primarily work and have established relationships.
Our inability to properly utilize our workforce could have a negative impact on our profitability
The extent to which we utilize our workforce affects our profitability. Underutilizing our workforce could result in lower gross margins and, consequently, a decrease in short-term profitability. On the other hand, overutilization of our workforce could negatively impact safety, employee satisfactions and project execution, leading to a potential decline in future project awards. The utilization of our workforce is impacted by numerous factors, including:
our estimate of headcount requirements and our ability to manage attrition;
efficiency in scheduling projects and our ability to minimize downtime between project assignments; and
productivity.
Misconduct by our employees, subcontractors or partners or our overall failure to comply with laws or regulations could harm our reputation, damage our relationships with customers, reduce our revenues and profits, and subject us to criminal and civil enforcement actions.
Misconduct, fraud, non-compliance with applicable laws and regulations, or other improper activities by one or more of our employees, subcontractors or partners could have a significant negative impact on our business and reputation. Examples of such misconduct include employee or subcontractor theft, the failure to comply with safety standards, laws and regulations, customer requirements, environmental laws and any other applicable laws or regulations. While we take precautions to prevent and detect these activities, such precautions may not be effective and are subject to inherent limitations, including human error and fraud. Our failure to comply with applicable laws or regulations or acts of misconduct could subject us to fines and penalties, harm our reputation, damage our relationships with customers, reduce our revenues and profits and subject us to criminal and civil enforcement actions.
Failure or circumvention of our disclosure controls and procedures or internal controls over financial reporting could seriously harm our financial condition, results of operations, and our business.
We plan to continue to maintain and strengthen internal controls and procedures to enhance the effectiveness of our disclosure controls and internal controls over financial reporting. Any system of controls, however well designed and operated, is based in part on certain assumptions and can provide only reasonable, and not absolute, assurances that the objectives of the system are met. Any failure of our disclosure controls and procedures or internal controls over financial reporting could harm our financial condition and results of operations.
We have subsidiary operations through the United States and are exposed to multiple state and local regulations, as well as federal laws and requirements applicable to government contractors. Changes in law, regulations or requirements, or a material failure of any of our subsidiaries or us to comply with any of them, could increase our costs and have other negative impacts on our business.
Our 92 locations are located in 29 states, which exposes us to a variety of different state and local laws and regulations, particularly those pertaining to contractor licensing requirements. These laws and regulations govern many aspects of our business, and there are often different standards and requirements in different locations. In addition, our subsidiaries that perform work for federal government entities are subject to additional federal laws and regulatory and contractual requirements. Changes in any of these laws, or our or any of our subsidiaries' material failure to comply with them, can adversely impact our operations by, among other things, increasing costs, distracting management's time and attention from other items, and harming our reputation.
As government contractors, our subsidiaries are subject to a number of rules and regulations, and their contracts with government entities are subject to audit. Violations of the applicable rules and regulations could result in a subsidiary being barred from future government contracts.
Government contractors must comply with many regulations and other requirements that relate to the award, administration and performance of government contracts. A violation of these laws and regulations could result in imposition of fines and penalties, the termination of a government contract or debarment from bidding on government contracts in the future. Further, despite our decentralized nature, a violation at one of our locations could impact other locations' ability to bid on and perform government contracts; additionally, because of our decentralized nature, we face risks in maintaining compliance with all local, state and federal government contracting requirements. Prohibition against bidding on future government contracts could have an adverse effect on our financial condition and results of operations.
Past and future environmental, safety and health regulations could impose significant additional costs on us that reduce our profits.
HVAC systems are subject to various environmental statutes and regulations, including the Clean Air Act and those regulating the production, servicing and disposal of certain ozone-depleting refrigerants used in HVAC systems. There can be no assurance that the regulatory environment in which we operate will not change significantly in the future. Various local, state and federal laws and regulations impose licensing standards on technicians who install and service HVAC systems. And additional laws, regulations and standards apply to contractors who perform work that is being funded by public money, particularly federal public funding. Our failure to comply with these laws and regulations could subject us to substantial fines, the loss of our licenses or potentially debarment from future publicly funded work. It is impossible to predict the full nature and effect of judicial, legislative or regulatory developments relating to health and safety regulations and environmental protection regulations applicable to our operations.
Unsatisfactory safety performance may subject us to penalties, affect customer relationships, result in higher operating costs, negatively impact employee morale and result in higher employee turnover.
Our projects are conducted at a variety of sites including construction sites and industrial facilities. Each location is subject to numerous safety risks, including electrocutions, fires, explosions, mechanical failures, weather-related incidents, transportation accidents and damage to equipment. These hazards can cause personal injury and loss of life, severe damage to or destruction of property and equipment and other consequential damages and could lead to suspension of operations, large damage claims and, in extreme cases, criminal liability. While we have taken what we believe are appropriate precautions to minimize safety risks, we have experienced serious accidents, including fatalities, in the past and may experience additional accidents in the future. Serious accidents may subject us to penalties, civil litigation or criminal prosecution. Claims for damages to persons, including claims for bodily injury or loss of life, could result in significant costs and liabilities, which could adversely affect our financial condition and results of operations. Poor safety performance could also jeopardize our relationships with our customers and harm our reputation.
If we do not effectively manage the size and cost of our operations, our existing infrastructure may become either strained or over-burdensome, and we may be unable to increase revenue growth.
The growth that we have experienced in the past, and that we may experience in the future, may provide challenges to our organization, requiring us to expand our personnel and our operations. Future growth may strain our infrastructure, operations and other managerial and operating resources. We have also experienced in the past severe constriction in the markets in which we operate and, as a result, in our operating requirements. Failing to maintain the appropriate cost structure for a particular economic cycle may result in our incurring costs that affect our profitability. If our business resources become strained or over-burdensome, our earnings may be adversely affected and we may be unable to increase revenue growth. Further, we may undertake contractual commitments that exceed our labor resources, which could also adversely affect our earnings and our ability to increase revenue growth.
Future climate change could adversely affect us.
Climate change may create physical and financial risk. Physical risks from climate change could, among other things, include an increase in extreme weather events (such as floods or hurricanes), rising sea levels and limitations on water availability and quality. Such extreme weather conditions may limit the availability of resources, increasing the costs of our projects, or may cause projects to be delayed or cancelled.
Legislation, nationwide protocols, regulation or other restrictions related to climate change could negatively impact our operations or our customers' operations. Such legislation or restrictions could increase the costs of projects for our customers or, in some cases, prevent a project from going forward, which could in turn have an adverse effect on our financial condition and results of operations.
Deliberate, malicious acts, including terrorism and sabotage, could damage our facilities, disrupt our operations or injure employees, contractors, customers or the public and result in liability to us.
Intentional acts of destruction could damage or destroy our facilities, reducing our operational production capacity and requiring us to repair or replace our facilities at substantial cost. Additionally, employees, contractors and the public could suffer substantial physical injury from acts of terrorism for which we could be liable. Governmental authorities may also impose security or other requirements that could make our operations more difficult or costly. The consequences of any such actions could adversely affect our financial condition and results of operations.
Our common stock, which is listed on the New York Stock Exchange, has from time to time experienced significant price and volume fluctuations. These fluctuations are likely to continue in the future, and our stockholders may suffer losses.
The market price of our common stock may change significantly in response to various factors and events beyond our control. A variety of events may cause the market price of our common stock to fluctuate significantly, including the following: (i) the risk factors described in this Report on Form 10-K; (ii) a shortfall in operating revenue or net income from that expected by securities analysts and investors; (iii) quarterly fluctuations in our operating results; (iv) changes in securities analysts' estimates of our financial performance or that of our competitors or companies in our industry generally; (v) general conditions in our customers' industries; (vi) general conditions in the securities markets; (vii) our announcements of significant contracts, milestones, acquisitions; (viii) our relationship with other companies; (ix) our investors' view of the sectors and markets in which we operate; and (x) additions or departures of key personnel. Some companies that have volatile market prices for their securities have been subject to security class action suits filed against them. If a suit were to be filed against us, regardless of the outcome, it could result in substantial costs and a diversion of our management's attention and resources. This could have a material adverse effect on our business, results of operations and financial condition.
Future sales of our common stock may depress our stock price.
Sales of a substantial number of shares of our common stock in the public market or otherwise, either by us, a member of management or a major stockholder, or the perception that these sales could occur, could depress the market price of our common stock and impair our ability to raise capital through the sale of additional equity securities.
Increases in our health insurance costs could adversely impact our results of operations and cash flows.
The costs of employee health care insurance have been increasing in recent years due to rising health care costs, legislative changes, and general economic conditions. Additionally, we may incur additional costs as a result of the Patient Protection and Affordable Care Act (the "Affordable Care Act") that was signed into law in March 2010. A continued increase in health care costs or additional costs incurred as a result of the Affordable Care Act could have a negative impact on our financial position and results of operations.
Rising inflation and/or interest rates could have an adverse effect on our business, financial condition and results of operations.
Economic factors, including inflation and fluctuations in interest rates, could have a negative impact on our business. If our costs were to become subject to significant inflationary pressures or interest rate increases, we may not be able to fully offset such higher costs through price increases. Our inability or failure to do so could harm our financial position and results of operations.
Our effective tax rate may increase.
We conduct business across the United States and file income taxes in various tax jurisdictions. Our effective tax rates could be affected by many factors, some of which are outside of our control, including changes in tax laws and regulations in the various tax jurisdictions in which we file income taxes, issues relating to tax audits or examinations and any related interest or penalties, and uncertainty in obtaining deductions or credits claimed in various jurisdictions. Our results of operations is reported based on our determination of the amount of taxes we owe in various tax jurisdictions. Significant judgment is required in determining our provision for income taxes and our determination of tax liability is always subject to review or examination by tax authorities in applicable tax jurisdictions. An
adverse outcome of such a review of examination could adversely affect our operating results and financial condition. Further, the results of tax examinations and audits could have a negative impact on our financial results and cash flows where the results differ from the liabilities recorded in our financial statements.
Our charter contains certain anti-takeover provisions that may inhibit or delay a change in control.
Our certificate of incorporation authorizes our board of directors to issue, without stockholder approval, one or more series of preferred stock having such preferences, powers and relative, participating, optional and other rights (including preferences over the common stock respecting dividends and distributions and voting rights) as the board of directors may determine. The issuance of this "blank-check" preferred stock could render more difficult or discourage an attempt to obtain control by means of a tender offer, merger, proxy contest or otherwise. Additionally, certain provisions of the Delaware General Corporation Law may also discourage takeover attempts that have not been approved by the Board of Directors.
Item 1B. Unresolved Staff Comments
_**
None.
Item 2. Properties
_**
We own five properties, three of which we acquired through acquisition and two that we formerly leased. Other than these five properties, we lease the real property and buildings from which we operate. Our facilities are located in 29 states and Puerto Rico and consist of offices, shops and fabrication, maintenance and warehouse facilities. Generally, leases range from three to ten years and are on terms we believe to be commercially reasonable. A majority of these premises are leased from individuals or entities with whom we have no other business relationship. In certain instances these leases are with current or former employees. To the extent we renew, enter into leases or otherwise change leases with current or former employees, we enter into such agreements on terms that reflect a fair market valuation for the properties. Leased premises range in size from approximately 1,000 square feet to 110,000 square feet. To maximize available capital, we generally intend to continue to lease our properties, but may consider further purchases of property where we believe ownership would be more economical. We believe that our facilities are sufficient for our current needs.
We lease our executive and administrative offices in Houston, Texas.
Item 3. Legal Proceedings
_**
We are subject to certain claims and lawsuits arising in the normal course of business. We maintain various insurance coverages to minimize financial risk associated with these claims. We have estimated and provided accruals for probable losses and related legal fees associated with certain litigation in our consolidated financial statements. While we cannot predict the outcome of these proceedings, in our opinion and based on reports of counsel, any liability arising from these matters individually and in the aggregate will not have a material effect on our operating results, cash flows or financial condition, after giving effect to provisions already recorded.
Item 4. Mine Safety Disclosures
_**
Not applicable.
**PART II **
Item 5. Market for Registrant's Common Equity, Related Stockholder Matters and Issuer Purchases of Equity Securities
_**
The following table sets forth the reported high and low sales prices of our Common Stock for the quarters indicated as traded at the New York Stock Exchange. Our Common Stock is traded under the symbol FIX:
| High | Low | Cash Dividends Declared | ||||||||
| Fourth Quarter, 2014 | $ | 17.42 | $ | 12.81 | $ | 0.060 | ||||
| Third Quarter, 2014 | $ | 16.38 | $ | 13.55 | $ | 0.055 | ||||
| Second Quarter, 2014 | $ | 17.14 | $ | 14.61 | $ | 0.055 | ||||
| First Quarter, 2014 | $ | 19.62 | $ | 15.24 | $ | 0.055 | ||||
| Fourth Quarter, 2013 | $ | 20.58 | $ | 16.16 | $ | 0.055 | ||||
| Third Quarter, 2013 | $ | 16.98 | $ | 15.10 | $ | 0.055 | ||||
| Second Quarter, 2013 | $ | 15.33 | $ | 11.70 | $ | 0.050 | ||||
| First Quarter, 2013 | $ | 14.19 | $ | 11.90 | $ | 0.050 |
As of February 20, 2015 there were approximately 294 stockholders of record of our Common Stock, and the last reported sale price on that date was $16.66 per share.
We expect to continue paying cash dividends quarterly, although there is no assurance as to future dividends because they depend on future earnings, capital requirements, and financial condition. In addition, our revolving credit agreement limits the amount of dividends we can pay at any time that our Net Leverage Ratio exceeds 1.0.
The following Corporate Performance Graph and related information shall not be deemed "soliciting material" or to be "filed" with the SEC, nor shall such information be incorporated by reference into any future filing under the Securities Act or the Exchange Act, except to the extent that we specifically incorporate it by reference into such filing.
*COMPARISON OF 5 YEAR CUMULATIVE TOTAL RETURN **Among Comfort Systems USA, Inc., the S&P 500 Index, and the Russell 2000 Index
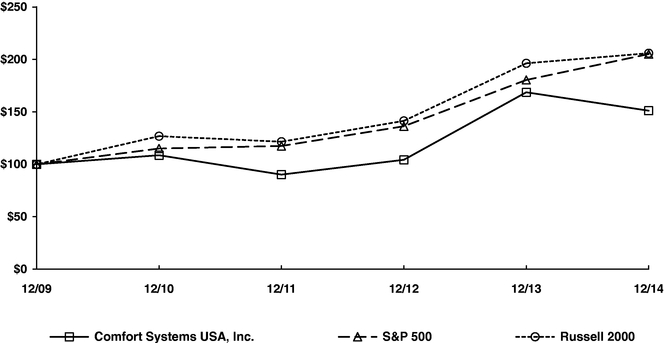
$100 invested on 12/31/09 in stock or index, including reinvestment of dividends.
Fiscal year ending December 31.
Copyright© 2015 S&P, a division of The McGraw-Hill Companies Inc. All rights reserved.
Copyright© 2015 Russell Investment Group. All rights reserved.
Recent Sales of Unregistered Securities
None.
Issuer Purchases of Equity Securities
On March 29, 2007, our Board of Directors (the "Board") approved a stock repurchase program to acquire up to 1.0 million shares of our outstanding common stock. Subsequently, the Board has from time to time approved extensions of the program to acquire additional shares. On October 24, 2014, the Board approved an extension to the program by increasing the shares authorized for repurchase by 1.0 million shares. Since the inception of the repurchase program, the Board has approved 7.6 million shares to be repurchased.
The share repurchases will be made from time to time at our discretion in the open market or privately negotiated transactions as permitted by securities laws and other legal requirements, and subject to market conditions and other factors. The Board may modify, suspend, extend or terminate the program at any time. Since the inception of the program in 2007 and as of December 31, 2014, we have repurchased a cumulative total of 6.6 million shares at an average price of $11.30 per share.
During the year ended December 31, 2014, we purchased our common shares in the following amounts at the following weighted-average prices:
| Period | Total Number of Shares Purchased | Weighted- Average Price Paid Per Share | Total Number of Shares Purchased as Part of Publicly Announced Plans or Programs | Maximum Number of Shares that May Yet Be Purchased Under the Plans or Programs | |||||||||
| January 1 - January 31 | — | $ | — | 6,017,214 | 583,323 | ||||||||
| February 1 - February 28 | — | $ | — | 6,017,214 | 583,323 | ||||||||
| March 1 - March 31 | 25,000 | $ | 16.64 | 6,042,214 | 558,323 | ||||||||
| April 1 - April 30 | 6,037 | $ | 14.86 | 6,048,251 | 552,286 | ||||||||
| May 1 - May 31 | — | $ | — | 6,048,251 | 552,286 | ||||||||
| June 1 - June 30 | — | $ | — | 6,048,251 | 552,286 | ||||||||
| July 1 - July 31 | — | $ | — | 6,048,251 | 552,286 | ||||||||
| August 1 - August 31 | 191,222 | $ | 14.69 | 6,239,473 | 361,064 | ||||||||
| September 1 - September 30 | 204,428 | $ | 14.52 | 6,443,901 | 156,636 | ||||||||
| October 1 - October 31 | 117,282 | $ | 13.79 | 6,561,183 | 1,000,000 | ||||||||
| November 1 - November 30 | 5,185 | $ | 14.26 | 6,566,368 | 994,815 | ||||||||
| December 1 - December 31 | — | $ | — | 6,566,368 | 994,815 | ||||||||
| | | | | | | | | | | | | | |
| 549,154 | $ | 14.52 | 6,566,368 | 994,815 | |||||||||
| | | | | | | | | | | | | | |
| | | | | | | | | | | | | | |
| | | | | | | | | | | | | | |
Item 6. Selected Financial Data
The following selected historical financial data has been derived from our audited financial statements and should be read in conjunction with the historical Consolidated Financial Statements and related notes:
| Year Ended December 31, | ||||||||||||||||
| 2014 | 2013 | 2012 | 2011 | 2010 | ||||||||||||
| (in thousands, except per share amounts) | ||||||||||||||||
| STATEMENT OF OPERATIONS DATA: | ||||||||||||||||
| Revenue | $ | 1,410,795 | $ | 1,357,272 | $ | 1,331,185 | $ | 1,216,654 | $ | 1,063,520 | ||||||
| Operating income (loss)(a) | $ | 42,222 | $ | 46,258 | $ | 22,303 | $ | (42,641 | ) | $ | 31,442 | |||||
| Income (loss) from continuing operations | $ | 28,614 | $ | 28,632 | $ | 11,494 | $ | (32,474 | ) | $ | 20,564 | |||||
| Discontinued operations— | ||||||||||||||||
| Operating income (loss), net of tax | $ | (15 | ) | $ | (76 | ) | $ | 355 | $ | (4,018 | ) | $ | (6,547 | ) | ||
| Gain (loss) on disposition, net of tax | — | — | — | — | $ | 723 | ||||||||||
| Net income (loss) including noncontrolling interests | $ | 28,599 | $ | 28,556 | $ | 11,849 | $ | (36,492 | ) | $ | 14,740 | |||||
| Net income (loss) attributable to Comfort Systems USA, Inc. | $ | 23,063 | $ | 27,269 | $ | 13,463 | $ | (36,830 | ) | $ | 14,740 | |||||
| Income (loss) per share attributable to Comfort Systems USA, Inc.: | ||||||||||||||||
| Basic— | ||||||||||||||||
| Income (loss) from continuing operations | $ | 0.61 | $ | 0.73 | $ | 0.35 | $ | (0.88 | ) | $ | 0.54 | |||||
| Discontinued operations— | ||||||||||||||||
| Income (loss) from operations | — | — | 0.01 | (0.11 | ) | (0.17 | ) | |||||||||
| Gain (loss) on disposition | — | — | — | — | 0.02 | |||||||||||
| | | | | | | | | | | | | | | | | |
| Net income (loss) | $ | 0.61 | $ | 0.73 | $ | 0.36 | $ | (0.99 | ) | $ | 0.39 | |||||
| | | | | | | | | | | | | | | | | |
| | | | | | | | | | | | | | | | | |
| | | | | | | | | | | | | | | | | |
| Diluted— | ||||||||||||||||
| Income (loss) from continuing operations | $ | 0.61 | $ | 0.73 | $ | 0.35 | $ | (0.88 | ) | $ | 0.54 | |||||
| Discontinued operations— | ||||||||||||||||
| Income (loss) from operations | — | — | 0.01 | (0.11 | ) | (0.17 | ) | |||||||||
| Gain (loss) on disposition | — | — | — | — | 0.02 | |||||||||||
| | | | | | | | | | | | | | | | | |
| Net income (loss) | $ | 0.61 | $ | 0.73 | $ | 0.36 | $ | (0.99 | ) | $ | 0.39 | |||||
| | | | | | | | | | | | | | | | | |
| | | | | | | | | | | | | | | | | |
| | | | | | | | | | | | | | | | | |
| Cash dividends per share | $ | 0.225 | $ | 0.210 | $ | 0.200 | $ | 0.200 | $ | 0.200 | ||||||
| | | | | | | | | | | | | | | | | |
| | | | | | | | | | | | | | | | | |
| | | | | | | | | | | | | | | | | |
| BALANCE SHEET DATA: | ||||||||||||||||
| Working capital | $ | 130,555 | $ | 127,559 | $ | 103,966 | $ | 109,766 | $ | 134,738 | ||||||
| Total assets | $ | 665,750 | $ | 601,822 | $ | 580,754 | $ | 593,980 | $ | 640,020 | ||||||
| Total debt | $ | 40,346 | $ | 2,000 | $ | 7,400 | $ | 15,381 | $ | 29,936 | ||||||
| Total stockholders' equity | $ | 321,393 | $ | 314,022 | $ | 287,306 | $ | 283,106 | $ | 312,784 | ||||||
| Total Comfort Systems USA, Inc. stockholders' equity | $ | 306,281 | $ | 295,834 | $ | 270,405 | $ | 264,591 | $ | 312,784 |
(a)
Included in operating income are goodwill impairment charges of $0.7 million and $57.3 million for 2014 and 2011, respectively. There were no goodwill impairment charges for 2013, 2012 or 2010.
Item 7. Management's Discussion and Analysis of Financial Condition and Results of Operations
The following discussion and analysis should be read in conjunction with the Consolidated Financial Statements and related notes included elsewhere in this annual report on Form 10-K. Also see "Forward-Looking Statements" discussion.
Introduction and Overview
We are a national provider of comprehensive HVAC installation, maintenance, repair and replacement services within the mechanical services industry. We operate primarily in the commercial, industrial and institutional HVAC markets and perform most of our services within office buildings, retail centers, apartment complexes, manufacturing plants, and healthcare, education and government facilities. In addition to standard HVAC services, we provide specialized applications such as building automation control systems, fire protection, process cooling, electronic monitoring and process piping. Certain locations also perform related activities such as electrical service and plumbing.
Nature and Economics of Our Business
Approximately 82% of our revenue is earned on a project basis for installation of HVAC systems in newly constructed facilities or for replacement of HVAC systems in existing facilities. Customers hire us to ensure such systems deliver specified or generally expected heating, cooling, conditioning and circulation of air in a facility. This entails installing core system equipment such as packaged heating and air conditioning units, or in the case of larger facilities, separate core components such as chillers, boilers, air handlers, and cooling towers. We also typically install connecting and distribution elements such as piping and ducting. Our responsibilities usually require conforming the systems to pre-established engineering drawings and equipment and performance specifications, which we frequently participate in establishing. Our project management responsibilities include staging equipment and materials to project sites, deploying labor to perform the work, and coordinating with other service providers on the project, including any subcontractors we might use to deliver our portion of the work.
When competing for project business, we usually estimate the costs we will incur on a project, and then propose a bid to the customer that includes a contract price and other performance and payment terms. Our bid price and terms are intended to cover our estimated costs on the project and provide a profit margin to us commensurate with the value of the installed system to the customer, the risk that project costs or duration will vary from estimate, the schedule on which we will be paid, the opportunities for other work that we might forego by committing capacity to this project, and other costs that we incur more broadly to support our operations but which are not specific to the project. Typically customers will seek bids from competitors for a given project. While the criteria on which customers select the winning bid vary widely and include factors such as quality, technical expertise, on-time performance, post-project support and service, and company history and financial strength, we believe that price is the most influential factor for most customers in choosing an HVAC installation and service provider.
After a customer accepts our bid, we generally enter into a contract with the customer that specifies what we will deliver on the project, what our related responsibilities are, and how much and when we will be paid. Our overall price for the project is typically set at a fixed amount in the contract, although changes in project specifications or work conditions that result in unexpected additional work are usually subject to additional payment from the customer via what are commonly known as change orders. Project contracts typically provide for periodic billings to the customer as we meet progress milestones or incur cost on the project. Project contracts in our industry also frequently allow for a small portion of progress billings or contract price to be withheld by the customer until after we have
completed the work, typically for six months. Amounts withheld under this practice are known as retention or retainage.
Labor and overhead costs account for the majority of our cost of service. Accordingly, labor management and utilization have the most impact on our project performance. Given the fixed price nature of much of our project work, if our initial estimate of project costs is wrong or we incur cost overruns that cannot be recovered in change orders, we can experience reduced profits or even significant losses on fixed price project work. We also perform some project work on a cost-plus or a time and materials basis, under which we are paid our costs incurred plus an agreed upon profit margin, although such projects are sometimes subject to a guaranteed maximum cost. These margins are frequently less than fixed-price contract margins because there is less risk of unrecoverable cost overruns in cost-plus or time and materials work.
As of December 31, 2014, we had 4,074 projects in process. Our average project takes six to nine months to complete, with an average contract price of approximately $488,000. Our projects generally require working capital funding of equipment and labor costs. Customer payments on periodic billings generally do not recover these costs until late in the job. Our average project duration together with typical retention terms as discussed above generally allow us to complete the realization of revenue and earnings in cash within one year. We have what we believe is a well-diversified distribution of revenue across end-use sectors that we believe reduces our exposure to negative developments in any given sector. Because of the integral nature of HVAC and related controls systems to most buildings, we have the legal right in almost all cases to attach liens to buildings or related funding sources when we have not been fully paid for installing systems, except with respect to some government buildings. The service work that we do, which is discussed further below, usually does not give rise to lien rights.
We also perform larger HVAC projects. As of December 31, 2014, we had 16 projects in process with a contract price greater than $15 million, 14 projects between $10 million and $15 million, 64 projects between $5 million and $10 million, and 297 projects between $1 million and $5 million. Taken together, projects with contract prices of $1 million or more totaled $1,607.5 million of aggregate contract value as of December 31, 2014, or approximately 81%, out of a total contract value for all projects in progress of $1,988.3 million. Generally, projects closer in size to $1 million will be completed in one year or less. It is unusual for us to work on a project that exceeds two years in length.
In addition to project work, approximately 18% of our revenue represent maintenance and repair service on already installed HVAC and controls systems. This kind of work usually takes from a few hours to a few days to perform. Prices to the customer are usually based on the equipment and materials used in the service as well as technician labor time. We usually bill the customer for service work when it is complete, typically with payment terms of up to thirty days. We also provide maintenance and repair service under ongoing contracts. Under these contracts, we are paid regular monthly or quarterly amounts and provide specified service based on customer requirements. These agreements typically cover periods ranging from one to three years with thirty- to sixty-day cancellation notice periods.
A relatively small portion of our revenue comes from national and regional account customers. These customers typically have multiple sites, and contract with us to perform maintenance and repair service. These contracts may also provide for us to perform new or replacement systems installation. We operate a national call center to dispatch technici
Showing the first 8K of 79K characters. Open the full section
Item 7A. Quantitative and Qualitative Disclosures about Market Risk
_**
We are exposed to market risk primarily related to potential adverse changes in interest rates as discussed below. We are actively involved in monitoring exposure to market risk and continue to develop and utilize appropriate risk management techniques. We are not exposed to any other significant financial market risks including commodity price risk, foreign currency exchange risk or interest rate risks from the use of derivative financial instruments. We do not use derivative financial instruments.
We have exposure to changes in interest rates under our revolving credit facility and the EAS credit line. We have a modest level of indebtedness under our debt facility and our indebtedness could increase in the future. Our debt with fixed interest rates consists of notes to former owners of acquired companies.
The following table presents principal amounts (stated in thousands) and related average interest rates by year of maturity for our debt obligations and their indicated fair market value at December 31, 2014:
| Twelve Months Ended December 31, | ||||||||||||||||||||||
| 2015 | 2016 | 2017 | 2018 | 2019 | Thereafter | Total | ||||||||||||||||
| Fixed Rate Debt | $ | — | $ | 500 | $ | 500 | $ | — | $ | — | $ | — | $ | 1,000 | ||||||||
| Average Interest Rate | — | 2.5 | % | 2.5 | % | — | — | — | 2.5 | % | ||||||||||||
| Variable Rate Debt | $ | — | $ | — | $ | — | $ | — | $ | 38,500 | $ | — | $ | 38,500 |
The weighted average interest rate applicable to borrowings under the Facility was approximately 1.4% as of December 31, 2014.
We measure certain assets at fair value on a nonrecurring basis. These assets are recognized at fair value when they are deemed to be other-than-temporarily impaired. During the quarter ended June 30, 2014, we recorded a goodwill impairment charge of $0.7 million based on Level 3 measurements. We did not recognize any other impairments, in the current quarter, on those assets required to be measured at fair value on a nonrecurring basis.
The valuation of the Company's contingent earn-out payments is determined using a probability weighted discounted cash flow method. This analysis reflects the contractual terms of the purchase agreements (e.g., minimum and maximum payment, length of earn-out periods, manner of calculating any amounts due, etc.) and utilizes assumptions with regard to future cash flows, probabilities of achieving such future cash flows and a discount rate.
Item 8. Financial Statements and Supplementary Data
_**
**INDEX TO FINANCIAL STATEMENTS **
**Management's Report on Internal Control over Financial Reporting **
Our management is responsible for establishing and maintaining adequate internal control over financial reporting, as such term is defined in Exchange Act Rules 13a-15(f) and 15d-15(f). Under the supervision and with the participation of our management, including our Chief Executive Officer and Chief Financial Officer, we conducted an evaluation of the effectiveness of our internal control over financial reporting as of December 31, 2014 based on the framework in Internal Control—Integrated Framework issued by the Committee of Sponsoring Organizations of the Treadway Commission (COSO 2013 framework). Based on that evaluation, our management concluded that our internal control over financial reporting was effective as of December 31, 2014.
Because of its inherent limitations, internal control over financial reporting may not prevent or detect misstatements. Also, projections of any evaluation of effectiveness to future periods are subject to the risk that controls may become inadequate because of changes in conditions, or that the degree of compliance with the policies or procedures may deteriorate.
Ernst & Young LLP, an independent registered public accounting firm, as stated in their report which is included elsewhere herein, has issued an attestation report auditing the effectiveness of our internal control over financial reporting as of December 31, 2014.
**REPORT OF INDEPENDENT REGISTERED PUBLIC ACCOUNTING FIRM **
Board of Directors and Stockholders of Comfort Systems USA, Inc.
We have audited the accompanying consolidated balance sheets of Comfort Systems USA, Inc. as of December 31, 2014 and 2013, and the related consolidated statements of operations, stockholders' equity and cash flows for each of the three years in the period ended December 31, 2014. These financial statements are the responsibility of the Company's management. Our responsibility is to express an opinion on these financial statements based on our audits.
We conducted our audits in accordance with the standards of the Public Company Accounting Oversight Board (United States). Those standards require that we plan and perform the audit to obtain reasonable assurance about whether the financial statements are free of material misstatement. An audit includes examining, on a test basis, evidence supporting the amounts and disclosures in the financial statements. An audit also includes assessing the accounting principles used and significant estimates made by management, as well as evaluating the overall financial statement presentation. We believe that our audits provide a reasonable basis for our opinion.
In our opinion, the financial statements referred to above present fairly, in all material respects, the consolidated financial position of Comfort Systems USA, Inc. at December 31, 2014 and 2013, and the consolidated results of its operations and its cash flows for each of the three years in the period ended December 31, 2014, in conformity with U.S. generally accepted accounting principles.
We also have audited, in accordance with the standards of the Public Company Accounting Oversight Board (United States), Comfort Systems USA, Inc.'s internal control over financial reporting as of December 31, 2014, based on criteria established in Internal Control—Integrated Framework issued by the Committee of Sponsoring Organizations of the Treadway Commission (2013 framework) and our report dated February 26, 2015 expressed an unqualified opinion thereon.
| /s/ ERNST & YOUNG LLP | ||
| Houston, Texas February 26, 2015 |
**REPORT OF INDEPENDENT REGISTERED PUBLIC ACCOUNTING FIRM **
Board of Directors and Stockholders Comfort Systems USA, Inc.
We have audited Comfort Systems USA, Inc.'s internal control over financial reporting as of December 31, 2014, based on criteria established in Internal Control—Integrated Framework issued by the Committee of Sponsoring Organizations of the Treadway Commission (2013 framework) (the COSO criteria). Comfort Systems USA, Inc.'s management is responsible for maintaining effective internal control over financial reporting, and for its assessment of the effectiveness of internal control over financial reporting included in the accompanying Management's Report on Internal Control over Financial Reporting. Our responsibility is to express an opinion on the company's internal control over financial reporting based on our audit.
We conducted our audit in accordance with the standards of the Public Company Accounting Oversight Board (United States). Those standards require that we plan and perform the audit to obtain reasonable assurance about whether effective internal control over financial reporting was maintained in all material respects. Our audit included obtaining an understanding of internal control over financial reporting, assessing the risk that a material weakness exists, testing and evaluating the design and operating effectiveness of internal control based on the assessed risk, and performing such other procedures as we considered necessary in the circumstances. We believe that our audit provides a reasonable basis for our opinion.
A company's internal control over financial reporting is a process designed to provide reasonable assurance regarding the reliability of financial reporting and the preparation of financial statements for external purposes in accordance with generally accepted accounting principles. A company's internal control over financial reporting includes those policies and procedures that (1) pertain to the maintenance of records that, in reasonable detail, accurately and fairly reflect the transactions and dispositions of the assets of the company; (2) provide reasonable assurance that transactions are recorded as necessary to permit preparation of financial statements in accordance with generally accepted accounting principles, and that receipts and expenditures of the company are being made only in accordance with authorizations of management and directors of the company; and (3) provide reasonable assurance regarding prevention or timely detection of unauthorized acquisition, use, or disposition of the company's assets that
Showing the first 8K of 133K characters. Open the full section
Item 9. Changes in and Disagreements with Accountants on Accounting and Financial Disclosure
_**
None.
Item 9A. Controls and Procedures
_**
Evaluation of Disclosure Controls and Procedures
Our executive management is responsible for ensuring the effectiveness of the design and operation of our disclosure controls and procedures. We carried out an evaluation under the supervision and with the participation of our management, including our Chief Executive Officer and Chief Financial Officer, of the effectiveness of the design and operation of our disclosure controls and procedures (as defined in Rules 13a-15(e) and 15d-15(e) under the Securities Exchange Act of 1934) as of the end of the period covered by this report. Based upon that evaluation, our Chief Executive Officer and Chief Financial Officer have concluded that our disclosure controls and procedures (as defined in Rules 13a-15(e) and 15d-15(e) of the Securities Exchange Act of 1934) are effective as of the end of the period covered by this report.
Internal Controls over Financial Reporting
Management's report on our internal controls over financial reporting can be found in Item 8 of this report. The Independent Registered Public Accounting Firm's Attestation Report on the effectiveness of our internal controls over financial reporting can also be found in Item 8 of this report.
Changes in Internal Control over Financial Reporting
There have not been any changes in our internal control over financial reporting (as such term is defined in Rules 13a-15(f) and 15d-15(f) under the Securities Exchange Act of 1934) during the three months ended December 31, 2014 that has materially affected, or is reasonably likely to materially affect, internal control over financial reporting.
Item 9B. Other Information
_**
None.
**PART III **
Item 10. Directors, Executive Officers and Corporate Governance
_**
We have adopted a code of ethics that applies to our principal executive officer, our principal financial officer, and our principal accounting officer, as well as to our other employees. This code of ethics consists of our Corporate Compliance Policy. The Company has made this code of ethics available on our website, as described in Item 1 of this annual report on Form 10-K. If we make substantive amendments to this code of ethics or grant any waiver, including any implicit waiver, we will disclose the nature of such amendment or waiver on our website or in a report on Form 8-K within four business days of such amendment or waiver.
The other information called for by this item has been omitted in accordance with the instructions to Form 10-K. The Company will file with the Commission a definitive proxy statement including the other information to be disclosed under this item in the 120 days following December 31, 2014 and such information is hereby incorporated by reference.
ITEMS 11, 12, 13 AND 14.
These items have been omitted in accordance with the instructions to Form 10-K. The Company will file with the Commission a definitive proxy statement including the information to be disclosed under the items in the 120 days following December 31, 2014 and such information is hereby incorporated by reference.
**PART IV **
Item 15. Exhibits and Financial Statement Schedules
_**
(a)
The following documents are filed as part of this annual report on Form 10-K:
(1)
Consolidated Financial Statements (Included Under Item 8): The Index to the Consolidated Financial Statements is included on page 37 of this annual report on Form 10-K and is incorporated herein by reference.
(2)
Financial Statement Schedules:
None.
(b)
Exhibits
Reference is made to the Index of Exhibits immediately following the signature page thereof, which is incorporated herein by reference.
(c)
Excluded financial statements:
None.
**SIGNATURES **
Pursuant to the requirements of Section 13 or 15(d) of the Securities Exchange Act of 1934, the registrant has duly caused this report to be signed on its behalf by the undersigned, thereunto duly authorized.
| COMFORT SYSTEMS USA, INC. | ||||
| By: | /s/ BRIAN E. LANE Brian E. Lane President and Chief Executive Officer |
Date: February 26, 2015
Pursuant to the requirements of the Securities Exchange Act of 1934, this report has been signed by the following persons on behalf of the registrant and in the capacities and on the dates indicated.
| Signature | Title | Date | ||||
| /s/ BRIAN E. LANE Brian E. Lane | President, Chief Executive Officer, and Director (Principal Executive Officer) | February 26, 2015 | ||||
| /s/ WILLIAM GEORGE William George | Executive Vice President and Chief Financial Officer (Principal Financial Officer) | February 26, 2015 | ||||
| /s/ JULIE S. SHAEFF Julie S. Shaeff | Senior Vice President and Chief Accounting Officer (Principal Accounting Officer) | February 26, 2015 | ||||
| /s/ FRANKLIN MYERS Franklin Myers | Chairman of the Board | February 26, 2015 | ||||
| /s/ DARCY G. ANDERSON Darcy G. Anderson | Director | February 26, 2015 | ||||
| /s/ HERMAN E. BULLS Herman E. Bulls | Director | February 26, 2015 | ||||
| /s/ ALFRED J. GIARDINELLI, JR. Alfred J. Giardinelli, Jr. | Director | February 26, 2015 |
| Signature | Title | Date | ||||
| /s/ ALAN P. KRUSI Alan P. Krusi | Director | February 26, 2015 | ||||
| /s/ JAMES H. SCHULTZ James H. Schultz | Director | February 26, 2015 | ||||
| /s/ CONSTANCE E. SKIDMORE Constance E. Skidmore | Director | February 26, 2015 | ||||
| /s/ VANCE W. TANG Vance W. Tang | Director | February 26, 2015 |
**INDEX OF EXHIBITS **
| Incorporated by Reference to the Exhibit Indicated Below and to the Filing with the Commission Indicated Below | ||||||||
| Exhibit Number | Description of Exhibits | Exhibit Number | Filing or File Number | |||||
| 3.1 | Second Amended and Restated Certificate of Incorporation of the Registrant | 3.1 | 333-24021 | |||||
| 3.2 | Certificate of Amendment dated May 21, 1998 | 3.2 | 1998 Form 10-K | |||||
| 3.3 | Certificate of Amendment dated July 9, 2003 | 3.3 | 2003 Form 10-K | |||||
| 3.4 | Amended and Restated Bylaws of Comfort Systems USA, Inc. | 3.1 | March 26, 2012 Form 8-K | |||||
| 4.1 | Form of certificate evidencing ownership of Common Stock of the Registrant | 4.1 | 333-24021 | |||||
| *10.1 | Comfort Systems USA, Inc. 1997 Long-Term Incentive Plan | 10.1 | 333-24021 | |||||
| *10.2 | Comfort Systems USA, Inc. 1997 Non-Employee Directors' Stock Plan | 10.2 | 333-24021 | |||||
| *10.3 | Amendment to the 1997 Non-Employee Directors' Stock Plan dated May 23, 2002 | 10.3 | Second Quarter 2002 Form 10-Q/A | |||||
| *10.4 | Comfort Systems USA, Inc. 2006 Equity Incentive Plan | 4.5 | 333-138377 | |||||
| *10.5 | Form of Option Award under the Comfort Systems USA, Inc. 2006 Equity Incentive Plan | 10.6 | 2006 Form 10-K | |||||
| *10.6 | Form of Option Award under the Comfort Systems USA, Inc. 2006 Stock Options/SAR Plan for Non-Employee Directors | 10.7 | 2006 Form 10-K | |||||
| *10.7 | Employment Agreement between the Company, Eastern Heating & Cooling, Inc. and Alfred J. Giardinelli, Jr. | 10.1 | Second Quarter 2003 Form 10-Q | |||||
| *10.8 | Amended and Restated 2006 Equity Compensation Plan for Non-Employee Directors | A | Proxy Statement April 10, 2008 | |||||
| *10.9 | 2008 Senior Management Annual Performance Plan | B | Proxy Statement April 10, 2008 | |||||
| *10.10 | Form of Change in Control Agreement | 10.2 | First Quarter 2008 Form 10-Q | |||||
| *10.11 | Form of Comfort Systems USA, Inc. Executive Severance Policy | 10.3 | First Quarter 2008 Form 10-Q | |||||
| *10.12 | Form of Directors and Officers Indemnification Agreement | 10.1 | May 19, 2009 Form 8-K |
| Incorporated by Reference to the Exhibit Indicated Below and to the Filing with the Commission Indicated Below | ||||||||
| Exhibit Number | Description of Exhibits | Exhibit Number | Filing or File Number | |||||
| 10.13 | Second Amended and Restated Credit Agreement by and among Comfort Systems USA, Inc., as Borrower and Wells Fargo Bank, National Association, as Administrative Agent/Wells Fargo Securities LLC, as Sole Lead Arranger and Sole Lead Book Runner/Bank of Texas, N.A., Capital One, N.A., and Regions Bank as Co-Syndication Agent/and Certain Financial Institutions as Lenders | 10.1 | July 22, 2010 Form 8-K/A | |||||
| 10.14 | Stock Purchase Agreement, dated July 28, 2010 | 10.1 | July 30, 2010 Form 8-K | |||||
| *10.15 | Summary of 2011 Incentive Compensation Plan | 10.1 | First Quarter 2011 Form 10-Q | |||||
| *10.16 | Form of Performance Restricted Stock Award Agreement dated March 24, 2011 | 10.1 | March 28, 2011 Form 8-K | |||||
| *10.17 | First Amendment to Comfort Systems USA, Inc. Amended and Restated 2006 Equity Compensation Plan for Non-Employee Directors | 10.1 | Second Quarter 2011 Form 10-Q | |||||
| 10.18 | Amendment No. 1 to Second Amended and Restated Credit Agreement, Second Amended and Restated Security Agreement, and Second Amended and Restated Pledge Agreement | 10.1 | Third Quarter 2011 Form 10-Q | |||||
| *10.19 | Summary of 2012 Incentive Compensation Plan | 10.1 | First Quarter 2012 Form 10-Q | |||||
| *10.20 | Form of 2012 Restricted Stock Unit Agreement | 10.1 | March 30, 2012 Form 8-K | |||||
| *10.21 | Form of 2012 Dollar-denominated Performance Vesting Restricted Stock Unit Agreement | 10.2 | March 30, 2012 Form 8-K | |||||
| *10.22 | 2012 Equity Incentive Plan | A | Proxy Statement April 9, 2012 | |||||
| *10.23 | 2012 Senior Management Annual Performance Plan | B | Proxy Statement April 9, 2012 | |||||
| *10.24 | Summary of 2013 Incentive Compensation Plan | 10.1 | First Quarter 2013 Form 10-Q | |||||
| *10.25 | Form of 2013 Restricted Stock Unit Agreement | 10.2 | March 22, 2013 Form 8-K | |||||
| *10.26 | Form of 2013 Dollar-denominated Performance Vesting Restricted Stock Unit Agreement | 10.3 | March 22, 2013 Form 8-K | |||||
| 10.27 | Amendment No. 2 to Second Amended and Restated Credit Agreement and Amendment to Other Loan Documents | 10.1 | Second Quarter 2013 Form 10-Q |
| Incorporated by Reference to the Exhibit Indicated Below and to the Filing with the Commission Indicated Below | ||||||||
| Exhibit Number | Description of Exhibits | Exhibit Number | Filing or File Number | |||||
| *10.28 | Letter Agreement between the Company and James Mylett | 10.28 | 2013 Form 10-K | |||||
| *10.29 | Form of Change in Control Agreement (2013) | 10.29 | 2013 Form 10-K | |||||
| *10.30 | Summary of 2014 Incentive Compensation Plan | 10.1 | First Quarter 2014 Form 10-Q | |||||
| *10.31 | Form of 2014 Restricted Stock Unit Agreement | 10.1 | March 21, 2014 Form 8-K | |||||
| *10.32 | Form of 2014 Dollar-denominated Performance Vesting Restricted Stock Unit Agreement | 10.2 | March 21, 2014 Form 8-K | |||||
| *10.33 | Form of Option Award under the Comfort Systems USA, Inc. 2012 Equity Incentive Plan | Filed Herewith | ||||||
| 10.34 | Amendment No. 3 to Second Amended and Restated Credit Agreement and Amendment to Other Loan Documents | 10.1 | Third Quarter 2014 Form 10-Q | |||||
| 10.35 | Agreement and Plan of Merger between the Company and Dyna Ten Corporation, dated April 7, 2014 | 10.1 | April 7, 2014 Form 8-K | |||||
| 21.1 | List of subsidiaries of Comfort Systems USA, Inc. | Filed Herewith | ||||||
| 23.1 | Consent of Ernst & Young LLP | Filed Herewith | ||||||
| 31.1 | Certification of Chief Executive Officer pursuant to Section 302 of the Sarbanes-Oxley Act of 2002 | Filed Herewith | ||||||
| 31.2 | Certification of Chief Financial Officer pursuant to Section 302 of the Sarbanes-Oxley Act of 2002 | Filed Herewith | ||||||
| 32.1 | Certification of Chief Executive Officer pursuant to Section 906 of the Sarbanes-Oxley Act of 2002 | Furnished Herewith | ||||||
| 32.2 | Certification of Chief Financial Officer pursuant to Section 906 of the Sarbanes-Oxley Act of 2002 | Furnished Herewith | ||||||
| 101.INS | XBRL Instance Document | |||||||
| 101.SCH | XBRL Taxonomy Extension Schema Document | |||||||
| 101.CAL | XBRL Taxonomy Extension Calculation Linkbase Document | |||||||
| 101.LAB | XBRL Taxonomy Extension Label Linkbase Document | |||||||
| 101.PRE | XBRL Taxonomy Extension Presentation Linkbase Document | |||||||
| 101.DEF | XBRL Taxonomy Extension Definition Linkbase Document |
Management contract or compensatory plan.