 filings.tools
Comfort Systems USA (FIX) 10-K risk factor changes: FY2020 vs FY2019
The 2020-12-31 10-K against the 2019-12-31 one, compared heading by heading and sentence by sentence.
Item 1A31 rewritten44 added7 removed303 unchanged
All filing items768 rewritten448 added276 removed1,828 unchanged
Summary
counted, not written
- Item 1A lists 40 risk factor headings: 1 new, 1 reworded and 38 unchanged since FY2019. 0 headings from FY2019 no longer appear.
- Sentence by sentence, 448 added, 276 removed, 768 rewritten and 1,828 unchanged across 14 items that differ.
New Item 1A headings (1)
- The effects of the COVID-19 pandemic and related economic repercussions have materially affected how we and our customers, vendors, subcontractors, developers, and general contractors are operating our businesses, and the duration and extent to which this will negatively impact our future results of operations and overall financial performance remains uncertain.
Removed Item 1A headings (0)
Every FY2019 risk factor heading is still here, word for word or reworded.
Reworded Item 1A headings (1)
- Force majeure events, including natural
[removed: disasters][added: disasters, outbreaks of infectious disease, such as COVID-19,] and terrorists’ actions, could negatively impact our business, which may affect our financial condition, results of operations or cash flows.
A heading is new when no FY2019 heading matches it after ignoring case and punctuation, and reworded when it shares at least 60 percent of its words with one that went away. All current risk factor headings.
Sentences by item
19 items, with every count and a link to each item that changed
Underlined words on a shaded ground are new in FY2020; struck-through words were in FY2019. Sentences that are wholly new or wholly gone are labelled rather than marked.
Item 1A. Risk Factors
31 rewritten, 44 added, 7 removed, 303 unchanged
Any period of economic [added: recession, including the ongoing] recession [added: caused by the Coronavirus Disease 2019 (“COVID-19”) pandemic,] affecting a market or industry in which we transact business is likely to adversely impact our business.
The industries and markets [added: in which] we operate [removed: in] have always been and will continue to be vulnerable to macroeconomic downturns because they are cyclical in nature.
Additionally, because [removed: 6.2%] [added: 5.7%] of our revenue for the year ended December 31, [removed: 2019] [added: 2020] was attributable to projects in the government sector, a reduction in federal, state, or local government spending in our industries and markets could result in decreased revenue and profit for us.
Our backlog as of December 31, [removed: 2019] [added: 2020] was [removed: $1.60] [added: $1.51] billion.
We expect competition to [removed: intensify] [added: continue] in our industry, presenting us with significant challenges in our ability to maintain strong growth rates and acceptable profit margins.
Vertical consolidation [removed: is] [added: could] also [removed: expected] [added: contribute] to [removed: intensify] competition in our industry.
Any of these events could damage our reputation and, while [removed: we do not believe that] the April 2019 incident [removed: had] [added: did not have] such effects, have a material adverse effect on our business, results of operations, financial condition and cash flows.
When appropriate, we establish provisions against possible [added: exposures, and we adjust these provisions from time to time according to ongoing exposure.]
[removed: Further, if a] subsidiary location fails to follow the Company’s compliance policies, we could be made party to a contract, arrangement or situation that requires the assumption of large liabilities or has less advantageous terms than is typically found in the market.
Additionally, we typically are contractually required to provide proof of insurance [removed: on] [added: for] projects [added: on which] we [removed: work on.][added: work.]
Our credit agreement and related restrictive and financial covenants are more fully described in Note [removed: 8] [added: 9] of “Notes to the Consolidated Financial Statements.” Our failure to comply with any of these covenants under the credit agreement, or to pay principal, interest or other amounts when due thereunder, would constitute an event of default under the credit agreement.
Under the Eurodollar Rate Loan Option under the Facility (defined below), the interest rate is determined based on the [removed: one‑] [added: one-] to [removed: six‑month] [added: six-month] Eurodollar Rate, which rate corresponds very closely to rates described in various general business media sources as LIBOR.
[removed: On the other hand, overutilization of our] workforce could negatively impact safety, employee satisfaction and project execution, leading to a potential decline in future project awards.
We may need to perform our work under a variety of conditions, including but not limited to, difficult terrain, difficult site conditions and busy urban centers where delivery of materials and availability of labor may be impacted, clean-room environments where strict procedures must be [removed: followed,] [added: followed] and sites [removed: which] [added: that] may have been exposed to harsh and hazardous [removed: conditions.][added: conditions and outbreaks of infectious disease, such as the ongoing COVID-19 pandemic.]
If we are unable to manage the conditions required for certain of our jobs, including the availability of sufficient labor, adherence to [removed: environmental] [added: environmental, health and safety] or other standards, and adequately addressing harsh or hazardous conditions, our business and financial condition could be adversely affected.
Examples of such misconduct include employee or subcontractor theft, personal [removed: misconduct,] [added: misconduct and] failure to comply with safety standards, [added: including regulatory, company or site-specific COVID-19 safety protocols,] laws and regulations, customer requirements, environmental laws and any other applicable laws or regulations.
Any system of controls, however well designed and operated, is based in part on certain assumptions and can provide only reasonable, and not absolute, assurances that the [added: objectives of the system are met.]
Our [removed: 134] [added: 139] locations are located in [removed: 28] [added: 27] states, which exposes us to a variety of different state and local laws and regulations, particularly those pertaining to contractor licensing requirements.
Because [removed: 6.2%] [added: 5.7%] of our revenue for the year ended December 31, [removed: 2019] [added: 2020] was attributable to projects in the government sector, prohibitions against bidding on future government contracts could have an adverse effect on our financial condition and results of operations.
[removed: Our failure to comply with these laws and regulations could] subject us to substantial fines, the loss of our licenses or potentially debarment from future publicly funded work.
Each location is subject to numerous safety risks, including electrocutions, fires, explosions, mechanical failures, weather-related incidents, transportation [removed: accidents and] [added: accidents,] damage to [removed: equipment.][added: equipment and, with respect to indoor sites, an increased risk of COVID-19 outbreaks.]
Claims for damages to property or persons, including claims for bodily injury or loss of life, could result in significant costs and liabilities, which could adversely affect our financial condition and [added: results of operations.]
Force majeure events, including natural [removed: disasters] [added: disasters, outbreaks of infectious disease, such as COVID-19,] and terrorists’ actions, could negatively impact our business, which may affect our financial condition, results of operations or cash flows.
Force majeure or extraordinary events beyond the control of the contracting parties, such as natural and man-made disasters, as well as [added: outbreaks of infectious disease (_e.g._, COVID-19) and] terrorist actions, could negatively impact us.
[added: We typically negotiate contract language] where we are granted certain relief from force majeure events in private client contracts and review and attempt to mitigate force majeure events in both public and private client contracts.
The last several years have been periodically marked by political and economic concerns, including [added: the ongoing COVID-19 pandemic,] decreased consumer confidence, the lingering effects of international conflicts, tariffs, energy costs and inflation.
Further, ongoing economic instability in the global [removed: markets] [added: markets, including from the ongoing COVID-19 pandemic,] could limit our ability to access the capital markets at a time when we would like, or need, to raise capital, which could have an impact on our ability to react to changing business conditions or new opportunities.
As a result of policy changes [removed: of] [added: or shifting proposals by] the U.S. [removed: presidential administration and current U.S. government proposals,] [added: government,] there may be greater restrictions and economic disincentives on international trade.
For example, the U.S. government [removed: is pursuing] [added: has pursued] a new approach to trade policy, including renegotiating or terminating certain existing bilateral or multi-lateral trade agreements.
A variety of events may cause the market price of our common stock to fluctuate significantly, including the following: (i) the risk factors described in this Annual Report on Form 10-K; (ii) a shortfall in operating revenue or net income from that expected by securities analysts and investors; (iii) quarterly fluctuations in our operating results; (iv) changes in securities analysts’ estimates of our financial performance or that of our competitors or companies in our industry generally; (v) general conditions in our customers’ [removed: industries;] [added: industries, including as a result of the ongoing COVID-19 pandemic;] (vi) general conditions in the securities markets; (vii) our announcements of significant contracts, [removed: milestones,] [added: milestones and] acquisitions; (viii) our relationship with [added: other companies; (ix) our investors’ view of the sectors and markets in which we operate; and (x) additions or departures of key personnel.]
[removed: Significant judgment] is required in determining our provision for income taxes and our determination of tax liability is always subject to review or examination by tax authorities in applicable tax jurisdictions.
Risks Related to Our Business
The effects of the COVID-19 pandemic and related economic repercussions have materially affected how we and our customers, vendors, subcontractors, developers, and general contractors are operating our businesses, and the duration and extent to which this will negatively impact our future results of operations and overall financial performance remains uncertain.
The COVID-19 pandemic has negatively impacted the global economy, disrupted consumer spending and global supply chains, and created significant volatility and disruption of financial markets.
We have experienced some resulting disruptions to our business operations, and we expect the COVID-19 pandemic could have a material adverse impact on our business and financial performance.
The extent of the impact of the COVID-19 pandemic on our business and financial performance, including our ability to execute our near-term and long-term business strategies and initiatives in the expected time frame, will depend on future developments, including the duration and severity of the pandemic, the resulting governmental and other measures implemented to address the pandemic and the development and availability of effective treatments and vaccines, which are uncertain and cannot be predicted at this time.
We have been negatively impacted by the COVID-19 pandemic as a result of the shelter-in-place restrictions and work disruptions in some of our service areas creating disruptions to portions of our operations, particularly in major metropolitan markets that have been meaningfully impacted by the pandemic.
We have also experienced permitting and regulatory delays attributable to the COVID-19 pandemic.
In addition to these current dynamics, the COVID-19 pandemic may create or exacerbate risks related to our operations and regulatory and compliance matters, including as a result of:
| | ● | evolving governmental guidance or requirements, including travel and movement restrictions, that continue to impact our ability to perform services or complete projects in accordance with required delivery schedules, which could result in additional costs or penalties (_e.g._, liquidated damages); |
| | ● | additional delays with respect to permitting and regulatory matters; |
| | ● | additional project deferrals, delays, and cancellations and changes in customer spending patterns and strategic plans as a result of, among other things, lack of available financing for our customers’ businesses or termination of, or force majeure events arising under, existing customer agreements; |
| | ● | governmental guidance or requirements, including work-from-home policies, or potential illness that negatively impact the availability or productivity of our key personnel or a significant number of employees or cause other disruptions to our business, corporate governance or financial reporting processes; |
| | ● | increased payment risk associated with customers experiencing financial difficulties (including bankruptcy) and an increase in disputes with customers relating to billing and payment under contracts and change orders; |
| | ● | potential liabilities and reputational harm related to occupational health and safety matters associated with COVID-19; |
| | ● | our inability to execute our business strategy, including with respect to certain capital investments such as acquisitions, investments and service offering expansions; |
| | ● | limitations on the ability of our suppliers, vendors and subcontractors to perform; |
| | ● | asset impairment charges related to property and equipment, goodwill, other intangible assets, other long-lived assets and investments; |
| | ● | additional costs associated with restructuring, severance and related matters, potential mandated increases in pay for critical infrastructure workers or other increased employment-related costs (_e.g._, workers’ compensation insurance claims); and |
| | ● | an increase in cyber-attacks and attempted intrusions into our information technology systems as a result of, among other things, increased reliance on such systems. |
As a result of these factors, the extent of the impact of the COVID-19 pandemic on our business is highly uncertain.
At this point, we cannot reasonably estimate the duration and severity of the COVID-19 pandemic, or its ultimate impact on our business, financial condition, results of operations or cash flows.
| --- | --- | --- |
| --- | --- | --- |
| --- | --- | --- |
| --- | --- | --- |
| --- | --- | --- |
| --- | --- | --- |
| --- | --- | --- |
| --- | --- | --- |
Risks Related to Our Operations
Further, if a
At this time, it is not clear that LIBOR will cease to exist, and if so, what alternative benchmark rate will replace LIBOR, though it is likely that the lenders under our credit agreement would select as an alternative benchmark rate the forward-looking term rate based on the secured overnight financing rate published by the Federal Reserve Bank of New York.
On the other hand, overutilization of our
| --- | --- | --- |
| --- | --- | --- |
| --- | --- | --- |
On March 2, 2020, the United States Supreme Court granted certiorari to review this case, which is expected to be decided by mid-2021.
Regulatory and Legal Risks
Our failure to comply with these laws and regulations could
exposures, and we adjust these provisions from time to time according to ongoing exposure.
At this time, it is not clear if LIBOR will continue to exist, and if
not, what alternative benchmark rate will replace LIBOR.
objectives of the system are met.
results of operations.
We typically negotiate contract language
other companies; (ix) our investors’ view of the sectors and markets in which we operate; and (x) additions or departures of key personnel.
An excerpt. Shown here: all 31 rewritten, 40 of 44 added and all 7 removed. The counts are complete. For every sentence, read Item 1A. Risk Factors in the FY2020 filing and the FY2019 filing.
Item 7. Management’s Discussion and Analysis of Financial Condition and Results of Operations
134 rewritten, 83 added, 63 removed, 289 unchanged
We operate primarily in the commercial, industrial and institutional markets and perform most of our [removed: services within office buildings, retail centers, apartment complexes, manufacturing plants, and] [added: work in industrial,] healthcare, [removed: education] [added: education, office, technology, retail] and government facilities.
In both our mechanical and electrical business segments, our responsibilities usually require conforming the systems to pre-established engineering drawings and equipment and performance specifications, which we frequently [added: participate in establishing.]
Approximately [removed: 85.1%] [added: 87.0%] of our revenue is earned on a project basis for installation services in newly constructed facilities or for replacement of systems in existing facilities.
While the criteria on which customers select a [removed: service] provider vary widely and include factors such as quality, technical expertise, on-time performance, post-project support and service, and company history and financial strength, we believe that price for value is the most influential factor for most customers in choosing a mechanical or electrical installation and service provider.
[removed: Labor] [added: Labor, materials] and overhead costs account for the majority of our cost of service.
[removed: Accordingly, labor] [added: Labor] management and utilization have the most impact on our project performance.
Given the fixed price nature of much of our project work, if our initial estimate of project costs is wrong or we incur cost overruns that cannot be recovered in change orders, we can [removed: experience reduced profits or even significant losses on fixed price project work.]
As of December 31, [removed: 2019,] [added: 2020,] we had [removed: 5,495] [added: 5,687] projects in process.
Our average project takes six to nine months to complete, with an average contract price of approximately [removed: $822,000.][added: $871,000.]
Taken together, projects with contract prices of $1 million or more totaled [removed: $3.84] [added: $4.3] billion of aggregate contract value as of December 31, [removed: 2019,] [added: 2020,] or approximately 85%, out of a total contract value for all projects in progress of [removed: $4.52] [added: $5.0] billion.
A stratification of projects in progress as of December 31, [removed: 2019,] [added: 2020,] by contract price, is as follows:
| $5 million - $10 million | | [removed: 95] [added: 94] | | | [removed: 691.0] [added: 692.3] | |
| $10 million - $15 million | | [removed: 38] [added: 56] | | | [removed: 472.5] [added: 684.9] | |
| Greater than $15 million | | [removed: 48] [added: 57] | | | [removed: 1,413.0] [added: 1,648.3] | |
In addition to project work, approximately [removed: 14.9%] [added: 13.0%] of our revenue represents maintenance and repair service on already installed HVAC, electrical, and controls systems.
We manage our [removed: 35] [added: 37] operating units based on a variety of factors.
[removed: Operational factors we emphasize include project selection, estimating, pricing, management and execution practices, labor utilization, safety,] training, and the make-up of both existing backlog as well as new business being pursued, in terms of project size, technical application, facility type, end-use customers and industries and location of the work.
With larger amounts of capital, time, and discretion involved, spending decisions are affected to a significant degree by uncertainty, particularly [added: concerns about economic and financial conditions and trends.]
We have a credit facility in [removed: place] [added: place,] with terms we believe are [removed: favorable] [added: favorable,] that does not expire until January 2025.
We have generated positive free cash flow in each of the last [removed: twenty-one] [added: twenty-two] calendar years and will continue our emphasis in this area.
As discussed at greater length in “Results of Operations” below, we expect price competition to continue as our customers and local and regional [removed: competitors respond cautiously to improved market conditions.][added: industry participants compete for customers.]
The selection of the method to measure progress towards completion requires judgment and is [removed: based on the nature of the products or services to be provided.]
In addition, we identified other critical accounting policies related to our allowance for [removed: doubtful accounts receivable,] [added: credit losses,] accounting for leases, the recording of our self-insurance liabilities, valuation of deferred tax assets, accounting for acquisitions and the recoverability of goodwill and identifiable intangible assets.
[added: These accounting] policies, as well as others, are described in Note 2 to the Consolidated Financial Statements included elsewhere in this annual report on Form 10-K.
Approximately [removed: 85.1%] [added: 87.0%] of our revenue was earned on a project basis and recognized through the percentage of completion method of accounting during [removed: 2019.][added: 2020.]
The amount of revenue associated with unapproved change orders and claims was immaterial for the year ended December 31, [removed: 2019.][added: 2020.]
_Accounting for Allowance for [removed: Doubtful Accounts_][added: Credit Losses_]
[added: Effective January 1, 2020, we adopted the requirements of Accounting Standards Update (ASU) No. 2016-13, “Financial Instruments – Credit Losses (Topic 326).”] For additional information on the new standard and the impact on our results of operations, refer to our Summary of Significant Accounting Policies in Note 2 to the Consolidated Financial Statements.
Some leases include one or more options to renew, [removed: with renewal terms that can] [added: which may be exercised to] extend the lease term.
We perform our annual impairment testing as of October [removed: 1] [added: 1,] and any impairment charges resulting from this process are reported in the fourth quarter.
If we conclude otherwise, [added: or if we elect to perform a quantitative assessment,] then we calculate the fair value of the reporting unit and compare the fair value with the carrying value of the reporting unit.
| | | [removed: 2019] [added: 2020] | | | | | [removed: 2018] [added: 2019] | | | | | [removed: 2017] [added: 2018] | | | | |
| Revenue | | $ | [removed: 2,615,277] [added: 2,856,659] | | 100.0 | % | $ | [removed: 2,182,879] [added: 2,615,277] | | 100.0 | % | $ | [removed: 1,787,922] [added: 2,182,879] | | 100.0 | % |
| Cost of services | | | [removed: 2,113,334] [added: 2,309,676] | | [removed: 80.8] [added: 80.9] | % | | [removed: 1,736,600] [added: 2,113,334] | | [removed: 79.6] [added: 80.8] | % | | [removed: 1,421,641] [added: 1,736,600] | | [removed: 79.5] [added: 79.6] | % |
| Gross profit | | | [removed: 501,943] [added: 546,983] | | [removed: 19.2] [added: 19.1] | % | | [removed: 446,279] [added: 501,943] | | [removed: 20.4] [added: 19.2] | % | | [removed: 366,281] [added: 446,279] | | [removed: 20.5] [added: 20.4] | % |
| Selling, general and administrative expenses | | | [removed: 340,005] [added: 357,777] | | [removed: 13.0] [added: 12.5] | % | | [removed: 296,986] [added: 340,005] | | [removed: 13.6] [added: 13.0] | % | | [removed: 266,586] [added: 296,986] | | [removed: 14.9] [added: 13.6] | % |
| Gain on sale of assets | | | [removed: (1,701)] [added: (1,445)] | | (0.1) | % | | [removed: (945)] [added: (1,701)] | | [removed: —] [added: (0.1)] | [removed: ] [added: %] | | [removed: (670)] [added: (945)] | | — | |
| Operating income | | | [removed: 163,639] [added: 190,651] | | [removed: 6.3] [added: 6.7] | % | | [removed: 150,238] [added: 163,639] | | [removed: 6.9] [added: 6.3] | % | | [removed: 99,260] [added: 150,238] | | [removed: 5.6] [added: 6.9] | % |
| Interest income | | | [removed: 224] [added: 103] | | — | | | [removed: 73] [added: 224] | | — | | | [removed: 70] [added: 73] | | — | |
| Interest expense | | | [removed: (9,317)] [added: (8,385)] | | [removed: (0.4)] [added: (0.3)] | % | | [removed: (3,710)] [added: (9,317)] | | [removed: (0.2)] [added: (0.4)] | % | | [removed: (3,156)] [added: (3,710)] | | (0.2) | % |
experience reduced profits or even significant losses on fixed price project work.
| Under $1 million | | 4,905 | | $ | 644.0 | |
| $1 million - $5 million | | 575 | | | 1,283.4 | |
| Total | | 5,687 | | $ | 4,952.9 | |
Operational factors we emphasize include project selection, estimating, pricing, management and execution practices, labor utilization, safety,
During the five-year period from 2015 to 2019, there was an increase in overall activity levels, and then in early 2020 the advent of a global pandemic led to some delays in service and construction, including the potential for delayed project starts and air pockets as the year ended.
As of December 31, 2020, we had $330.5 million of credit available to borrow under our credit facility.
based on the nature of the products or services to be provided.
We are required to estimate and record the expected credit losses over the contractual life of our financial assets measured at amortized cost, including billed and unbilled accounts receivable, other receivables and costs and estimated earnings in excess of billings.
Accounts receivable include amounts from work completed in which we have billed or have an unconditional right to bill our customers.
Our trade receivables are contractually due in less than a year.
We estimate our credit losses using a loss-rate method for each of our identified portfolio segments.
Our portfolio segments are construction, service and other.
While our construction and service financial assets are often with the same subset of customers and industries, our construction financial assets will generally have a lower loss-rate than service financial assets due to lien rights, which we are more likely to have on construction jobs.
These lien rights result in lower credit loss expenses on average compared to receivables that do not have lien rights.
Financial assets classified as Other include receivables that are not related to our core revenue producing activities, such as receivables related to our acquisition activity from former owners, our vendor rebate program or receivables for estimated losses in excess of our insurance deductible, which are accrued with a corresponding accrued insurance liability.
Loss rates for our portfolios are based on numerous factors, including our history of credit loss expense by portfolio, the financial strength of our customers and counterparties in each portfolio, the aging of our receivables, our expectation of likelihood of payment, macroeconomic trends in the U.S. and the current and forecasted non-residential construction market trends in the U.S.
In addition to the loss-rate calculations discussed above, we also record allowance for credit losses for specific receivables that are deemed to have a higher risk profile than the rest of the respective pool of receivables, such as concerns about a specific customer going bankrupt and no longer being able to pay the receivables due to us.
2020 Compared to 2019
In the second quarter of 2020, we completed the acquisition of TAS Energy Inc. (“TAS”), which reports as a separate operating location.
In the fourth quarter of 2020, we completed the acquisition of TEC Industrial Construction and Maintenance (“T E C”), which reports as a separate operating location.
_Revenue_—Revenue increased $241.4 million, or 9.2%, to $2.86 billion in 2020 compared to 2019.
| | | 2020 | | | | | | 2019 | | | | |
contractor in North Carolina in February 2020.
These increases were partially offset by a $118.0 million decrease in same-store revenue, primarily resulting from expected decreases driven by a higher volume of large jobs in the prior period at our Walker operation and the impact of Coronavirus Disease 2019 (“COVID-19”).
| | | | | | | | | | | | | |
| --- | --- | --- | --- | --- | --- | --- | --- | --- | --- | --- | --- | --- |
| | | December 31, | | | | | | December 31, | | | | |
| | | 2020 | | | | | | 2019 | | | | |
| Backlog: | | | | | | | | | | | | |
| Mechanical Services | | $ | 1,253,762 | | 83.0 | % | | $ | 1,348,651 | | 84.2 | % |
| Electrical Services | | | 257,652 | | 17.0 | % | | | 253,135 | | 15.8 | % |
| Total | | $ | 1,511,414 | | 100.0 | % | | $ | 1,601,786 | | 100.0 | % |
The year-over-year backlog decrease included a same-store backlog decrease of 23.4%, which was broad-based and was primarily as a result of completion of project work at our Walker operation ($116.3 million), our Colorado operation ($33.7 million) and one of our Florida operations ($29.7 million).
This decrease was partially offset by the acquisition of the North Carolina electrical contractor ($47.4 million), the TAS acquisition ($164.3 million) and the T E C acquisition ($72.8 million).
_Gross Profit_—Gross profit increased $45.0 million, or 9.0%, to $547.0 million in 2020 as compared to 2019.
As a percentage of revenue, gross profit decreased slightly from 19.2% in 2019 to 19.1% in 2020.
Improvements in project execution discussed above were offset by lower margins on the Walker acquisition, which was acquired in April 2019, and by preventative and protective actions taken on projects, such as social distancing and other procedure adjustments caused by COVID-19, which negatively impacted margins starting in March 2020.
These decreases were partially offset by an increase in bad debt expense of $1.3 million, mainly driven by concerns about collectability of certain receivables due to the business interruptions caused by COVID-19, specifically with respect to receivables with retail, restaurants and entertainment companies.
Additionally, tax consulting fees increased from $1.3 million in 2019 to $2.8 million in 2020.
participate in establishing.
| Under $1 million | | 4,734 | | $ | 674.3 | |
| $1 million - $5 million | | 580 | | | 1,266.5 | |
| Total | | 5,495 | | $ | 4,517.3 | |
concerns about economic and financial conditions and trends.
During the five-year period from 2015 to 2019, there was an increase in overall activity levels, and we currently expect that activity will continue at strong levels in 2020.
Our primary emphasis for 2020 will be on execution and cost control, but we are seeking growth based on our belief that industry conditions will continue to be strong in the near term.
We believe that activity levels will permit us to continue to earn solid profits while preserving and developing our workforce.
We continue to focus on project qualification, estimating, pricing and management, and we are investing in growth and improved performance.
These accounting
We are required to estimate the collectability of accounts receivable and provide an allowance for doubtful accounts for receivable amounts we believe we will not ultimately collect.
This requires us to make certain judgments and estimates involving, among others, the creditworthiness of our customers, prior collection history with our
customers, ongoing relationships with our customers, the aging of past due balances, our lien rights, if any, in the property where we performed the work, and the availability, if any, of payment bonds applicable to the contract.
Effective January 1, 2019, we adopted the requirements of Accounting Standards Update (ASU) 2016-02, Lease (Topic 842).
If we decide to cancel or terminate a lease before the end of its term, we would typically owe the lessor the remaining lease payments under the term of the lease.
We perform this evaluation quarterly.
If other reporting units have had increases in fair value, such increases may not be recorded.
Accordingly, such increases may not be netted against impairments at other reporting units.
| Goodwill impairment | | | — | | — | | | — | | — | | | 1,105 | | 0.1 | % |
In the first quarter of 2019, we combined two operating locations into one.
In the second quarter of 2019, we completed the acquisition of Walker TX Holding Company, LLC and each of its wholly owned subsidiaries (collectively “Walker”), which reports as a separate operating location.
_Revenue_—Revenue increased $432.4 million, or 19.8% to $2.62 billion in 2019 compared to 2018.
Same-store backlog increased 16.8% primarily due to increased project bookings at two of our Florida operations ($78.2 million), one of our Tennessee operations ($34.4 million), our North Carolina operation ($32.2 million) and our Colorado operation ($30.0 million).
_Gross Profit_—Gross profit increased $55.7 million, or 12.5%, to $501.9 million in 2019 as compared to 2018.
Gross profit in 2019 also benefited from a $3.2 million reduction of Cost of Services expense recorded in the fourth quarter of 2019 as a result of insurance proceeds received related to recoverable costs that were primarily incurred prior to the fourth quarter of 2019.
The increase in gross profit was partially offset by decreased volumes at our Wisconsin operation ($6.7 million).
This increase is primarily due to the increase in revenue compared to the prior year period, investments made in personnel due to the growth we have experienced in recent years ($6.2 million), and an increase in professional fees in 2019 ($2.5 million, of which approximately $1.3 million relates to tax planning costs).
SG&A in 2019 also benefited from a $1.6 million reduction of expense recorded in the fourth quarter of 2019 as a result of insurance proceeds received related to recoverable costs that were primarily incurred prior to the fourth quarter of 2019.
As a percentage of revenue, SG&A decreased from 13.6% in 2018 to 13.0% in 2019 due to the factors discussed above as well as a lower SG&A percentage of revenue at Walker, which was acquired in April 2019.
| SG&A | | $ | 340,005 | | $ | 296,986 | |
| Same-store SG&A, excluding amortization expense | | $ | 290,134 | | $ | 279,679 | |
_Interest Expense_—Interest expense increased $5.6 million, or 151.1%, in 2019.
The increase reflects the increased borrowings on the revolving credit facility and notes to former owners as a result of our recent acquisitions, including Walker.
This increase in expense was primarily driven by higher than previously projected earnings from BCH, which increased the value of the earn-out.
_Other Income_—Other income decreased $4.0 million, or 95.5% in 2019 as compared to 2018.
In April 2018, we entered into settlement agreements with British Petroleum (“BP”) related to two claims from one of our subsidiaries regarding the April 2010 BP Deepwater Horizon oil spill.
We recorded a gain of $4.0 million in the second quarter of 2018 as a result of these settlements.
We do not have any remaining subsidiaries with outstanding claims against BP related to this matter.
Our effective tax rate for 2019 was 24.7%, as compared to 24.1% in 2018.
The effective rate for 2018 was higher than the 21% federal statutory rate primarily due to net state income taxes (5.0%) and nondeductible expenses (1.3%), partially offset by a decrease in unrecognized tax benefits from the filing of a federal income tax automatic accounting method change application (1.9%) and deductions for stock-based compensation (0.9%).
An excerpt. Shown here: 40 of 134 rewritten, 40 of 83 added and 40 of 63 removed. The counts are complete. For every sentence, read Item 7. Management’s Discussion and Analysis of Financial Condition and Results of Operations in the FY2020 filing and the FY2019 filing.
Item 7A. Quantitative and Qualitative Disclosures about Market Risk
6 rewritten, 3 added, 3 removed, 12 unchanged
We are not exposed to any other significant financial market [removed: risks] [added: risks,] including commodity price [removed: risk,] [added: risk or] foreign currency exchange [removed: risk or interest rate risks] [added: risk,] from the use of derivative financial instruments.
The following table presents principal amounts (stated in thousands) and related average interest rates by year of maturity for our debt obligations and their indicated fair market value at December 31, [removed: 2019:][added: 2020:]
| | | [removed: 2020 | | |] 2021 | | | 2022 | | | 2023 | | | 2024 | | | [added: 2025 | | |] Thereafter | | | Total | | |
| Variable Rate Debt | | $ | [removed: 7,500] [added: —] | | $ | [removed: 7,500] [added: 15,000] | | $ | 15,000 | | $ | [removed: 15,000] [added: 22,500] | | $ | [removed: 22,500] [added: 152,500] | | $ | [removed: 110,500] [added: —] | | $ | [removed: 178,000] [added: 205,000] | |
The weighted average interest rate applicable to the borrowings under the revolving credit facility was approximately [removed: 3.2%] [added: 1.4%] as of December 31, [removed: 2019.][added: 2020.]
The weighted average interest rate applicable to the term loan was approximately [removed: 3.3%] [added: 1.4%] as of December 31, [removed: 2019.][added: 2020.]
At times, we use derivative financial instruments to manage our interest rate risk.
| Fixed Rate Debt | | $ | — | | $ | 8,000 | | $ | 19,000 | | $ | 4,000 | | $ | — | | $ | — | | $ | 31,000 | |
| Average Interest Rate | | | 3.3% | | | 3.3% | | | 3.0% | | | 3.0% | | | — | | | — | | | 3.1% | |
We do not use derivative financial instruments.
| Fixed Rate Debt | | $ | 13,317 | | $ | 10,166 | | $ | 12,500 | | $ | 12,500 | | $ | — | | $ | — | | $ | 48,483 | |
| Average Interest Rate | | | 3.6% | | | 3.7% | | | 4.0% | | | 4.0% | | | — | | | — | | | 3.8% | |
Item 1. Business
45 rewritten, 33 added, 20 removed, 162 unchanged
We build, install, maintain, repair and replace mechanical, electrical and plumbing (“MEP”) systems throughout our [removed: 35] [added: 37] operating units with [removed: 134] [added: 139] locations in [removed: 115] [added: 114] cities throughout the United States.
Substantially all of our consolidated [removed: 2019] [added: 2020] revenue was derived from commercial, industrial and institutional customers and multi-family residential projects.
Approximately [removed: 45.9%] [added: 46.7%] of our revenue was attributable to installation services in newly constructed facilities and [removed: 54.1%] [added: 53.3%] was attributable to renovation, expansion, maintenance, repair and replacement services in existing buildings.
Our consolidated [removed: 2019] [added: 2020] revenue was derived from the following service industries:
| Mechanical Services | | [removed: 86.1] [added: 84.5] | % |
| Electrical Services | | [removed: 13.9] [added: 15.5] | % |
We believe that commercial, industrial, and institutional mechanical and electrical contracting generate annual revenue in the United States of approximately [removed: $100] [added: $200] billion.
Many factors affect mechanical and electrical services industry growth, including [removed: but,] [added: but] not limited to, (i) population growth, which increases the need for commercial, industrial and institutional space, (ii) an aging installed base of buildings and equipment, (iii) increasing sophistication, complexity and efficiency of mechanical and electrical systems, and (iv) growing emphasis on [added: internal air quality,] environmental [added: sustainability] and energy efficiency.
| | ● | construction of and installation in new buildings, which provided approximately [removed: 45.9%] [added: 46.7%] of our revenue in [removed: 2019,] [added: 2020,] and |
| | ● | renovation, expansion, maintenance, repair and replacement in existing buildings, which provided the remaining [removed: 54.1%] [added: 53.3%] of our [removed: 2019] [added: 2020] revenue. |
_Focus on [removed: Commercial, Industrial] [added: Industrial, Commercial] and Institutional Markets_—We focus on the [removed: commercial, industrial] [added: industrial, commercial] and institutional building markets, including construction, maintenance, repair and replacement services.
[removed: For example, we] [added: We] have shifted certain fabrication activities to centralized [removed: locations in order to increase asset utilization.]
[added: We opportunistically allocate our engineering, field and] supervisory labor from one operation to another to [removed: more fully] use our employee [removed: base,] [added: base more fully,] meet our customers’ needs and share expertise.
Our distribution of revenue in [removed: 2019] [added: 2020] by end-use sector was as follows:
| Office Buildings | | [removed: 13.3] [added: 11.2] | % |
| Retail, Restaurants and Entertainment | | [removed: 9.5] [added: 8.4] | % |
| Multi-Family and Residential | | [removed: 4.0] [added: 3.0] | % |
Approximately [removed: 85.1%] [added: 87.0%] of our revenue is earned on a project basis for installation of systems in newly constructed or existing facilities.
As of December 31, [removed: 2019,] [added: 2020,] we had [removed: 5,495] [added: 5,687] projects in process with an aggregate contract value of approximately [removed: $4.52] [added: $5.0] billion.
Our average project takes six to nine months to complete, with an average contract price of approximately [removed: $822,000.][added: $871,000.]
This average project size, when taken together with the approximately [removed: 14.9%] [added: 13.0%] of our revenue derived from maintenance and service, provides us with a broad base of work in the construction services sector.
A stratification of projects in progress as of December 31, [removed: 2019,] [added: 2020,] by contract price, is as follows:
| $5 million - $10 million | | [removed: 95] [added: 94] | | | [removed: 691.0] [added: 692.3] | |
| $10 million - $15 million | | [removed: 38] [added: 56] | | | [removed: 472.5] [added: 684.9] | |
| Greater than $15 million | | [removed: 48] [added: 57] | | | [removed: 1,413.0] [added: 1,648.3] | |
Starr Electric Company, Incorporated in North [removed: Carolina,] [added: Carolina and TAS Energy Inc. in Texas,] we significantly improved our [removed: electrical] off-site construction capabilities and offerings and will continue to invest in the improvement of these offerings.
_Construction and Installation Services for New Buildings_—Our installation business related to newly constructed facilities, which comprised approximately [removed: 45.9%] [added: 46.7%] of our consolidated [removed: 2019] [added: 2020] revenue, involves the design, engineering, integration, installation and start-up of MEP and related systems.
We also perform larger project work, with [removed: 761] [added: 782] contracts in progress at December 31, [removed: 2019] [added: 2020] with contract prices in excess of $1 million.
Our largest project in progress at December 31, [removed: 2019] [added: 2020] had a contract price of [removed: $97.2] [added: $78.3] million.
_Renovation, Expansion, Maintenance, Monitoring, Repair and Replacement Services for Existing Buildings_—Our renovation, expansion, maintenance, monitoring, repair and replacement services in existing buildings comprised approximately [removed: 54.1%] [added: 53.3%] of our consolidated [removed: 2019] [added: 2020] revenue.
We estimate that direct purchase of commodities and finished products comprises between [removed: 10%] [added: 25%] and [removed: 15%] [added: 30%] of our average project cost.
The major components of commercial MEP systems are compressors and chillers that are manufactured primarily by Carrier, Lennox, [removed: McQuay,] [added: Daikin,] Trane and York.
The major suppliers of building automation control systems are Automated Logic, [added: Cisco,] Delta, [removed: Distech,] [added: Distech Controls,] Honeywell, Johnson Controls, [removed: Novar, Rockwell, Schneider,] [added: Rockwell Automation, Schneider Electric,] Siemens, Trane and York.
The mechanical and electrical contracting industries are [added: also] subject to seasonal variations.
We have a diverse customer base, with our top customer representing 5% of consolidated [removed: 2019] [added: 2020] revenue, and our largest customer often changes from year to year.
[removed: Our] [added: _Recruiting and Training_—Our] continued success depends, in part, on our ability to continue to attract, retain and motivate qualified engineers, service technicians, field supervisors and project managers.
[added: We believe our success in retaining qualified] employees will be based on the quality of our recruiting, training, compensation, employee benefits programs and opportunities for advancement.
[removed: We] [added: _Safety_—We] have established comprehensive safety programs throughout our operations to ensure that all employees comply with safety standards we have established and that are established under federal, state and local laws and regulations.
[removed: Finally,] [added: Additionally,] our employment screening process seeks to determine that prospective employees have requisite skills, sufficient background references and acceptable driving records, if applicable.
Our rate of incidents recordable under the standards of the Occupational Safety and Health Administration (“OSHA”) per one hundred employees per year, also known as the OSHA recordable rate, was [removed: 1.61] [added: 1.36] during [removed: 2019.][added: 2020.]
We believe that skilled labor forces in the building and services trades have become increasingly scarce and valuable, and we are increasing our national and local focus on growing and improving our skilled labor force, including through recruitment, development and skills training for our hourly workers.
locations in order to increase asset utilization.
| Industrial | | 38.9 | % |
| Education | | 17.1 | % |
| Healthcare | | 13.0 | % |
| Government | | 5.7 | % |
| Other | | 2.7 | % |
| Under $1 million | | 4,905 | | $ | 644.0 | |
| $1 million - $5 million | | 575 | | | 1,283.4 | |
| Total | | 5,687 | | $ | 4,952.9 | |
Our average project takes six to nine months to complete, with an average contract price of approximately $871,000.
The construction industry is subject to business cycle fluctuation.
Human Capital Resources
_Employees_—As of December 31, 2020, we had approximately 11,100 employees as compared to approximately 12,000 employees as of December 31, 2019.
_Culture and Core Values_—Our values define, inform, and guide the way we operate on a daily basis, both within our Company and in the communities where we do business.
Our core values are: be safe; be honest; be
respectful; be innovative; and be collaborative.
These values set the foundation for our Code of Conduct, which applies to all employees, officers, and directors of the Comfort Systems USA family of companies.
The Code of Conduct is regularly reinforced to the Company’s employees and management through periodic ethics, equal opportunity employment, and anti-corruption trainings.
In addition, certain business partners, such as consultants, agents, suppliers, contractors, and other third parties, serve as an extension of the Company.
They are expected to follow the spirit of our Code of Conduct, all applicable laws, and any applicable contractual provisions when working on our behalf.
We believe that the way we conduct business is just as important as the business we do.
Operating with integrity helps us deliver on the promises we have made to each other, our customers, and the communities where we live and work.
It is also the basis for ensuring continued growth and success.
Everyone at our Company shares a responsibility for doing business ethically and in a sustainable manner, preserving our good name.
We ensure that this responsibility applies at every level in our organization, and everyone from corporate officers, to members of our Board of Directors, to our field personnel is responsible for overseeing these efforts.
_Diversity and Inclusion_—We are an equal opportunity employer, and we welcome and celebrate our teams’ differences, experiences, and beliefs.
We expect all employees to be treated with dignity and respect in an environment free from discrimination and harassment regardless of race, color, religion, sex, sexual orientation, gender identity or expression, national origin, age, disability, veteran status, genetic information or any other protected class.
We know that diversity is truly a competitive advantage that helps drive growth and innovation, and we have increasingly focused on diversity and inclusion programs within our Company.
Diversity and inclusion is among our leadership team’s top priorities, with clearly outlined near-term actions to accelerate progress in outreach, representation, development and advancement of underrepresented groups within our Company.
Our Board of Directors and Board committees provide oversight on certain human capital matters, including our diversity and inclusion strategy.
These materials are also available at _www.sec.gov_.
The content of our websites is not incorporated by reference into this annual report on Form 10-K or in any other report or document we file with the SEC, and any references to our websites are intended to be inactive textual references only.
We are also increasing our national and local focus on skills training for our hourly workers.
Substantially all of our consolidated 2019 revenue was derived from commercial, industrial and institutional customers and large multi-family residential projects.
We opportunistically allocate our engineering, field and
| Industrial | | 33.9 | % |
| Education | | 15.8 | % |
| Healthcare | | 13.7 | % |
| Government | | 6.2 | % |
| Other | | 3.6 | % |
| Under $1 million | | 4,734 | | $ | 674.3 | |
| $1 million - $5 million | | 580 | | | 1,266.5 | |
| Total | | 5,495 | | $ | 4,517.3 | |
Historically, the construction industry has been highly cyclical.
Employees
As of December 31, 2019, we had approximately 12,000 employees.
Recruiting, Training and Safety
We believe our success in retaining qualified
You may read and copy any materials filed with the Securities and Exchange Commission at the Securities and Exchange Commission’s Public Reference Room at 100 F Street, NE, Washington, DC 20549.
You may obtain information on the operation of the Public Reference Room by calling the Securities and Exchange Commission at 1-800-SEC-0330.
This information is also available at _www.sec.gov_.
The reference to these website addresses does not constitute incorporation by reference of the information contained on the websites and should not be considered part of this document.
An excerpt. Shown here: 40 of 45 rewritten, all 33 added and all 20 removed. The counts are complete. For every sentence, read Item 1. Business in the FY2020 filing and the FY2019 filing.
Cover and table of contents
24 rewritten, 1 added, 0 removed, 70 unchanged
| For the fiscal year ended December 31, [removed: 2019] [added: 2020] | |
The aggregate market value of the voting stock held by non-affiliates of the registrant at June [removed: 28, 2019] [added: 30, 2020] was approximately [removed: $1.83] [added: $1.45] billion, based on the [removed: $50.99] [added: $40.75] last sale price of the registrant’s common stock on the New York Stock Exchange on June [removed: 28, 2019.][added: 30, 2020.]
As of February [removed: 21, 2020, 36,613,587] [added: 19, 2021, 36,185,179] shares of the registrant’s common stock were outstanding (excluding treasury shares of [removed: 4,509,778).][added: 4,938,186).]
The information required by Part III (other than the required information regarding executive officers) is incorporated by reference from the registrant’s definitive proxy statement, which will be filed with the Commission not later than 120 days following December 31, [removed: 2019.][added: 2020.]
| [Item 1B.](#ITEM1BUnresolvedStaffComments_139610) | [Unresolved Staff Comments](#ITEM1BUnresolvedStaffComments_139610) | [removed: 21] [added: 23] |
| [Item 2.](#ITEM2Properties_592424) | [Properties](#ITEM2Properties_592424) | [removed: 22] [added: 23] |
| [Item 3.](#ITEM3LegalProceedings_395131) | [Legal Proceedings](#ITEM3LegalProceedings_395131) | [removed: 22] [added: 23] |
| [Item 4.](#ITEM4MineSafetyDisclosures_231930) | [Mine Safety Disclosures](#ITEM4MineSafetyDisclosures_231930) | [removed: 22] [added: 23] |
| [Item 4A.](#ITEM4AExecutiveOfficersoftheRegistrant_3) | [Executive Officers of the Registrant](#ITEM4AExecutiveOfficersoftheRegistrant_3) | [removed: 22] [added: 23] |
| [Item 5.](#ITEM5MarketforRegistrantsCommonEquityRel) | [Market for Registrant’s Common Equity, Related Stockholder Matters and Issuer Purchases of Equity Securities](#ITEM5MarketforRegistrantsCommonEquityRel) | [removed: 23] [added: 24] |
| [Item 7.](#ITEM7ManagementsDiscussionandAnalysisofF) | [Management’s Discussion and Analysis of Financial Condition and Results of Operations](#ITEM7ManagementsDiscussionandAnalysisofF) | [removed: 26] [added: 27] |
| [Item 7A.](#ITEM7AQuantitativeandQualitativeDisclosu) | [Quantitative and Qualitative Disclosures about Market Risk](#ITEM7AQuantitativeandQualitativeDisclosu) | [removed: 41] [added: 42] |
| [Item 8.](#ITEM8FinancialStatementsandSupplementary) | [Financial Statements and Supplementary Data](#ITEM8FinancialStatementsandSupplementary) | [removed: 42] [added: 44] |
| [Item 9.](#ITEM9ChangesinandDisagreementswithAccoun) | [Changes in and Disagreements with Accountants on Accounting and Financial Disclosure](#ITEM9ChangesinandDisagreementswithAccoun) | [removed: 82] [added: 85] |
| [Item 9A.](#ITEM9AControlsandProcedures_403685) | [Controls and Procedures](#ITEM9AControlsandProcedures_403685) | [removed: 82] [added: 85] |
| [Item 9B.](#ITEM9BOtherInformation_701400) | [Other Information](#ITEM9BOtherInformation_701400) | [removed: 82] [added: 85] |
| [Item 10.](#ITEM10DirectorsExecutiveOfficersandCorpo) | [Directors, Executive Officers and Corporate Governance](#ITEM10DirectorsExecutiveOfficersandCorpo) | [removed: 83] [added: 86] |
| [Item 11.](#ITEMS111213AND14_316091) | [Executive Compensation](#ITEMS111213AND14_316091) | [removed: 83] [added: 86] |
| [Item 12.](#ITEMS111213AND14_316091) | [Security Ownership of Certain Beneficial Owners and Management and Related Stockholder Matters](#ITEMS111213AND14_316091) | [removed: 83] [added: 86] |
| [Item 13.](#ITEMS111213AND14_316091) | [Certain Relationships and Related Transactions, and Director Independence](#ITEMS111213AND14_316091) | [removed: 83] [added: 86] |
| [Item 14.](#ITEMS111213AND14_316091) | [Principal Accounting Fees and Services](#ITEMS111213AND14_316091) | [removed: 83] [added: 86] |
| [Item 15.](#ITEM15ExhibitsandFinancialStatementSched) | [Exhibits and Financial Statement Schedules](#ITEM15ExhibitsandFinancialStatementSched) | [removed: 83] [added: 86] |
| [Item 16.](#ITEM16Form10KSummary) | [Form 10-K Summary](#ITEM16Form10KSummary) | [removed: 83] [added: 86] |
_Certain statements and information in this Annual Report on Form 10-K may constitute forward-looking statements within the meaning of [removed: the Private Securities Litigation Reform Act of 1995.][added: applicable securities laws and regulations.]
Indicate by check mark whether the registrant has filed a report on and attestation to its management’s assessment of the effectiveness of its internal control over financial reporting under Section 404(b) of the Sarbanes-Oxley Act (15 U.S.C. 7262(b)) by the registered public accounting firm that prepared or issued its audit report.
Item 2. Properties
2 rewritten, 0 added, 0 removed, 9 unchanged
As of December 31, [removed: 2019,] [added: 2020,] we owned [removed: 15] [added: 16] properties.
Our facilities are located in [removed: 28] [added: 27] states and consist of offices, shops and fabrication, maintenance and warehouse facilities.
Item 4A. Executive Officers of the Registrant
7 rewritten, 6 added, 1 removed, 28 unchanged
[removed: _Brian] Lane,_ age [removed: 62,] [added: 63,] has served as our Chief Executive Officer and President since December 2011 and as a director since November 2010.
Mr. Lane’s additional experience [removed: included] [added: includes] serving as a Regional Director of Capstone Turbine Corporation, a distributed power manufacturer.
_William George,_ age [removed: 55,] [added: 56,] has served as our Executive Vice President and Chief Financial Officer since May 2005, was our Senior Vice President, General Counsel and Secretary from May 1998 to May 2005, and was our Vice President, General Counsel and Secretary from March 1997 to April 1998.
From September 1992 to September 1995, Mr. George practiced corporate and antitrust law at Ropes & Gray, a Boston, [removed: Massachusetts] [added: Massachusetts,] law firm.
Shaeff,_ age [removed: 54,] [added: 55,] has served as our Senior Vice President and Chief Accounting Officer since May 2005, was our Vice President and Corporate Controller from March 2002 to May 2005, and was our Assistant Corporate [added: Controller from September 1999 to February 2002.]
Howell,_ age [removed: 32,] [added: 33,] has served as Vice President and General Counsel for the Company since January 2019.
Young,_ age [removed: 57,] [added: 58,] has served as Senior Vice President of Service for the Company since January 2019.
_Brian E.
_Trent T.
McKenna,_ age 48, has served as Chief Operating Officer and Senior Vice President since January 2021.
Mr. McKenna previously served as our Senior Vice President and Vice President – Region 4 from January 2019 to December 2020; Senior Vice President, General Counsel and Secretary from August 2013 to December 2018; Vice President, General Counsel and Secretary from May 2005 to August 2013; and Associate General Counsel from August 2004 to May 2005.
From February 1999 to August 2004, Mr. McKenna was a practicing attorney in the area of complex commercial litigation in the Houston, Texas, office of Akin Gump Strauss Hauer & Feld LLP, an international law firm.
Mr. McKenna earned a Bachelor of Arts degree in English from Brigham Young University and his Juris Doctorate from Duke University School of Law.
Controller from September 1999 to February 2002.
Item 5. Market for Registrant’s Common Equity, Related Stockholder Matters and Issuer Purchases of Equity Securities
9 rewritten, 13 added, 27 removed, 19 unchanged
Our Common Stock is traded under the symbol [removed: FIX:][added: FIX on the New York Stock Exchange.]
As of February [removed: 21, 2020,] [added: 19, 2021,] there were approximately [removed: 329] [added: 319] stockholders of record of our Common Stock, and the last reported sale price on that date was [removed: $48.85] [added: $60.56] per share.
[removed: 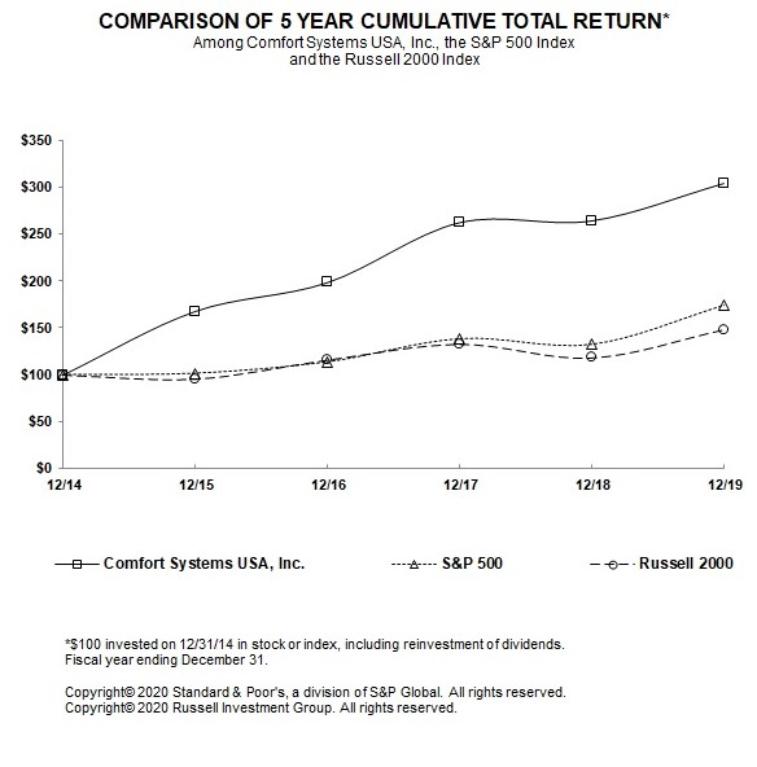][added: 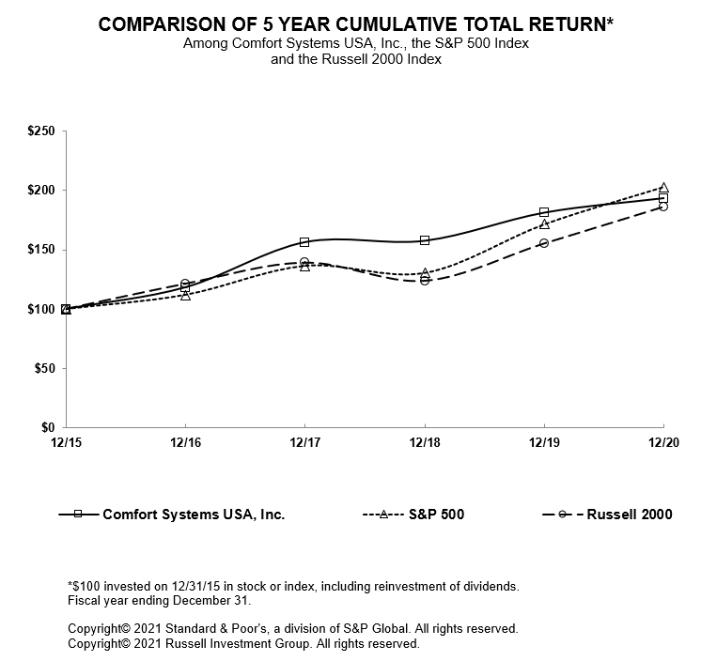]
On [removed: November 19, 2019,] [added: December 8, 2020,] the Board approved an extension to the program by increasing the shares authorized for repurchase by [removed: 0.8] [added: 0.7] million shares.
Since the inception of the repurchase program, the Board has approved [removed: 9.5] [added: 10.3] million shares to be repurchased.
As of December 31, [removed: 2019,] [added: 2020,] we have repurchased a cumulative total of [removed: 8.6] [added: 9.3] million shares at an average price of [removed: $17.70] [added: $19.63] per share under the repurchase program.
During the twelve months ended December 31, [removed: 2019,] [added: 2020,] we repurchased [removed: 0.4] [added: 0.7] million shares for approximately [removed: $19.6] [added: $30.1] million at an average price of [removed: $45.58] [added: $43.99] per share.
During the year ended December 31, [removed: 2019,] [added: 2020,] we purchased our common shares in the following amounts at the following average prices:
| | (1) | Purchased as part of a program announced on March 29, 2007 under which, since the inception of this program, [removed: 9.5] [added: 10.3] million shares have been approved for repurchase. |
| January 1 - January 31 | | 26,606 | | $ | 49.04 | | 8,653,973 | | 894,196 | |
| February 1 - February 29 | | 17,724 | | $ | 47.58 | | 8,671,697 | | 876,472 | |
| March 1 - March 31 | | 193,029 | | $ | 35.42 | | 8,864,726 | | 683,443 | |
| April 1 - April 30 | | — | | $ | — | | 8,864,726 | | 683,443 | |
| May 1 - May 31 | | 3,000 | | $ | 36.72 | | 8,867,726 | | 680,443 | |
| June 1 - June 30 | | 49,991 | | $ | 38.22 | | 8,917,717 | | 630,452 | |
| July 1 - July 31 | | 24,455 | | $ | 39.22 | | 8,942,172 | | 605,997 | |
| August 1 - August 31 | | 23,966 | | $ | 51.00 | | 8,966,138 | | 582,031 | |
| September 1 - September 30 | | 109,387 | | $ | 51.10 | | 9,075,525 | | 472,644 | |
| October 1 - October 31 | | 37,442 | | $ | 46.62 | | 9,112,967 | | 435,202 | |
| November 1 - November 30 | | 166,325 | | $ | 47.63 | | 9,279,292 | | 268,877 | |
| December 1 - December 31 | | 32,709 | | $ | 51.21 | | 9,312,001 | | 981,750 | |
| | | 684,634 | | $ | 43.99 | | 9,312,001 | | 981,750 | |
The following table sets forth the reported high and low sales prices of our Common Stock for the quarters indicated as traded at the New York Stock Exchange.
| | | | | | | | | | | |
| --- | --- | --- | --- | --- | --- | --- | --- | --- | --- | --- |
| | | | | | | | | | Cash | |
| | | | | | | | | | Dividends | |
| | | | High | | | Low | | | Declared | |
| Fourth Quarter, 2019 | | $ | 53.29 | | $ | 41.32 | | $ | 0.100 | |
| Third Quarter, 2019 | | $ | 53.66 | | $ | 36.27 | | $ | 0.100 | |
| Second Quarter, 2019 | | $ | 58.21 | | $ | 46.85 | | $ | 0.100 | |
| First Quarter, 2019 | | $ | 55.41 | | $ | 42.82 | | $ | 0.095 | |
| Fourth Quarter, 2018 | | $ | 59.20 | | $ | 41.30 | | $ | 0.090 | |
| Third Quarter, 2018 | | $ | 58.35 | | $ | 46.25 | | $ | 0.085 | |
| Second Quarter, 2018 | | $ | 48.60 | | $ | 40.15 | | $ | 0.080 | |
| First Quarter, 2018 | | $ | 44.45 | | $ | 39.85 | | $ | 0.075 | |
| January 1 - January 31 | | 24,000 | | $ | 43.28 | | 8,222,427 | | 560,982 | |
| February 1 - February 28 | | — | | $ | — | | 8,222,427 | | 560,982 | |
| March 1 - March 31 | | 43,394 | | $ | 52.58 | | 8,265,821 | | 517,588 | |
| April 1 - April 30 | | — | | $ | — | | 8,265,821 | | 517,588 | |
| May 1 - May 31 | | 59,267 | | $ | 49.21 | | 8,325,088 | | 458,321 | |
| June 1 - June 30 | | 34,201 | | $ | 48.54 | | 8,359,289 | | 424,120 | |
| July 1 - July 31 | | 29,000 | | $ | 43.16 | | 8,388,289 | | 395,120 | |
| August 1 - August 31 | | 141,957 | | $ | 39.97 | | 8,530,246 | | 253,163 | |
| September 1 - September 30 | | 12,923 | | $ | 38.19 | | 8,543,169 | | 240,240 | |
| October 1 - October 31 | | — | | $ | — | | 8,543,169 | | 240,240 | |
| November 1 - November 30 | | 23,250 | | $ | 50.98 | | 8,566,419 | | 981,750 | |
| December 1 - December 31 | | 60,948 | | $ | 50.01 | | 8,627,367 | | 920,802 | |
| | | 428,940 | | $ | 45.58 | | 8,627,367 | | 920,802 | |
Item 6. Selected Financial Data
12 rewritten, 1 added, 6 removed, 10 unchanged
| | | [added: 2020 | | |] 2019 | | | 2018 | | | 2017 | | | 2016 | | [removed: | 2015 | |] |
| Revenue | | $ | [removed: 2,615,277] [added: 2,856,659] | | $ | [removed: 2,182,879] [added: 2,615,277] | | $ | [removed: 1,787,922] [added: 2,182,879] | | $ | [removed: 1,634,340] [added: 1,787,922] | | $ | [removed: 1,580,519] [added: 1,634,340] | |
| Operating income (1) | | $ | [removed: 163,639] [added: 190,651] | | $ | [removed: 150,238] [added: 163,639] | | $ | [removed: 99,260] [added: 150,238] | | $ | [removed: 101,569] [added: 99,260] | | $ | [removed: 90,044] [added: 101,569] | |
| [removed: Income from continuing operations] [added: Net income] | | $ | [removed: 114,324] [added: 150,139] | | $ | [removed: 112,903] [added: 114,324] | | $ | [removed: 55,272] [added: 112,903] | | $ | [removed: 64,896] [added: 55,272] | | $ | [removed: 57,440] [added: 64,896] | |
| [removed: Income] [added: Basic income per share] from continuing operations | | $ | [removed: 3.10] [added: 4.11] | | $ | [removed: 3.03] [added: 3.10] | | $ | [removed: 1.48] [added: 3.03] | | $ | [removed: 1.74] [added: 1.48] | | $ | [removed: 1.32] [added: 1.74] | |
| [removed: Income] [added: Diluted income per share] from continuing operations | | $ | [removed: 3.08] [added: 4.09] | | $ | [removed: 3.00] [added: 3.08] | | $ | [removed: 1.47] [added: 3.00] | | $ | [removed: 1.72] [added: 1.47] | | $ | [removed: 1.30] [added: 1.72] | |
| Cash dividends per share | | $ | [removed: 0.395] [added: 0.425] | | $ | [removed: 0.330] [added: 0.395] | | $ | [removed: 0.295] [added: 0.330] | | $ | [removed: 0.275] [added: 0.295] | | $ | [removed: 0.250] [added: 0.275] | |
| Working capital | | $ | [removed: 182,187] [added: 118,948] | | $ | [removed: 142,642] [added: 182,187] | | $ | [removed: 115,629] [added: 142,642] | | $ | [removed: 98,276] [added: 115,629] | | $ | [removed: 118,882] [added: 98,276] | |
| Total assets (2) | | $ | [removed: 1,505,012] [added: 1,757,355] | | $ | [removed: 1,062,564] [added: 1,505,012] | | $ | [removed: 881,120] [added: 1,062,564] | | $ | [removed: 708,903] [added: 881,120] | | $ | [removed: 691,594] [added: 708,903] | |
| Total debt, net | | $ | [removed: 226,135] [added: 235,733] | | $ | [removed: 76,918] [added: 226,135] | | $ | [removed: 60,539] [added: 76,918] | | $ | [removed: 2,811] [added: 60,539] | | $ | [removed: 11,507] [added: 2,811] | |
| Total stockholders’ equity | | $ | [removed: 585,304] [added: 696,429] | | $ | [removed: 498,047] [added: 585,304] | | $ | [removed: 417,945] [added: 498,047] | | $ | [removed: 376,633] [added: 417,945] | | $ | [removed: 365,005] [added: 376,633] | |
| | (1) | Included in operating income is a goodwill impairment charge of $1.1 million for 2017. There were no goodwill impairment charges for [added: 2020,] 2019, [removed: 2018, 2016] [added: 2018] or [removed: 2015.] [added: 2016.] |
| | | | | | | | | | | | | | | | | |
| Net income including noncontrolling interests | | $ | 114,324 | | $ | 112,903 | | $ | 55,272 | | $ | 64,896 | | $ | 57,440 | |
| Net income attributable to Comfort Systems USA, Inc. | | $ | 114,324 | | $ | 112,903 | | $ | 55,272 | | $ | 64,896 | | $ | 49,364 | |
| Income per share attributable to Comfort Systems USA, Inc.: | | | | | | | | | | | | | | | | |
| Basic— | | | | | | | | | | | | | | | | |
| Diluted— | | | | | | | | | | | | | | | | |
| Total Comfort Systems USA, Inc. stockholders’ equity | | $ | 585,304 | | $ | 498,047 | | $ | 417,945 | | $ | 376,633 | | $ | 346,721 | |
Item 8. Financial Statements and Supplementary Data
471 rewritten, 257 added, 149 removed, 768 unchanged
| [Management’s Report on Internal Control over Financial Reporting](#ManagementsReportonInternalControloverFi) | | [removed: 43] [added: 45] |
| [Report of Independent Registered Public Accounting Firm](#ReportofIndependentRegisteredPublicAccou) | | [removed: 44] [added: 46] |
| [Report of Independent Registered Public Accounting Firm](#RegisteredPublicAccountingFirm_299282) | | [removed: 47] [added: 48] |
| [Consolidated Balance Sheets](#CONSOLIDATEDBALANCESHEETS_522126) | | [removed: 48] [added: 49] |
| [Consolidated Statements of Operations](#CONSOLIDATEDSTATEMENTSOFOPERATIONS_39514) | | [removed: 49] [added: 50] |
| [Consolidated Statements of Stockholders’ Equity](#STATEMENTSOFSTOCKHOLDERSEQUITY_511143) | | [removed: 50] [added: 51] |
| [Consolidated Statements of Cash Flows](#STATEMENTSOFCASHFLOWS_915327) | | [removed: 51] [added: 52] |
| [Notes to Consolidated Financial Statements](#NOTESTOCONSOLIDATEDFINANCIALSTATEMENTS_6) | | [removed: 52] [added: 53] |
Under the supervision and with the participation of our management, including our Chief Executive Officer and Chief Financial Officer, we conducted an evaluation of the effectiveness of our internal control over financial reporting as of December 31, [removed: 2019] [added: 2020] based on the framework in Internal Control—Integrated Framework issued by the Committee of Sponsoring Organizations of the Treadway Commission (COSO 2013 framework).
Based on that evaluation, our management concluded that our internal control over financial reporting was effective as of December 31, [removed: 2019.][added: 2020.]
Ernst & Young LLP, an independent registered public accounting firm, as stated in their report which is included elsewhere herein, has issued an attestation report auditing the effectiveness of our internal control over financial reporting as of December 31, [removed: 2019.][added: 2020.]
We have audited the accompanying consolidated balance sheets of Comfort Systems USA, Inc. (the Company) as of December 31, [removed: 2019] [added: 2020] and [removed: 2018,] [added: 2019,] the related consolidated statements of operations, stockholders’ equity and cash flows for each of the three years in the period ended December 31, [removed: 2019,] [added: 2020,] and the related notes (collectively referred to as the “consolidated financial statements”).
In our opinion, the consolidated financial statements present fairly, in all material respects, the financial position of the Company at December 31, [removed: 2019] [added: 2020] and [removed: 2018,] [added: 2019,] and the results of its operations and its cash flows for each of the three years in the period ended December 31, [removed: 2019,] [added: 2020,] in conformity with U.S. generally accepted accounting principles.
We also have audited, in accordance with the standards of the Public Company Accounting Oversight Board (United States) (PCAOB), the Company's internal control over financial reporting as of December 31, [removed: 2019,] [added: 2020,] based on criteria established in _Internal Control-Integrated Framework_ issued by the Committee of Sponsoring Organizations of the Treadway Commission (2013 framework), and our report dated February [removed: 26, 2020] [added: 25, 2021] expressed an unqualified opinion thereon.
Critical Audit [removed: Matters][added: Matter]
The critical audit [removed: matters] [added: matter] communicated below [removed: are matters] [added: was a matter] arising from the current period audit of the consolidated financial statements that [removed: were] [added: was] communicated or required to be communicated to the audit committee and that: (1) [removed: relate] [added: relates] to accounts or disclosures that are material to the consolidated financial statements and (2) involved our especially challenging, subjective or complex judgments.
The communication of [added: the] critical audit [removed: matters] [added: matter] does not alter in any way our opinion on the consolidated financial statements, taken as a whole, and we are not, by communicating the critical audit [removed: matters] [added: matter] below, providing separate opinions on the critical audit [removed: matters] [added: matter] or on the accounts or disclosures to which [removed: they relate.][added: it relates.]
| _Description of the Matter_ | As disclosed in Note [removed: 2] [added: 3] to the consolidated financial [removed: statements] [added: statements,] for fixed price agreements, the Company uses the percentage of completion (POC) method of accounting under which contract revenue recognizable at any time during the life of a contract is determined by multiplying expected total contract revenue by the percentage of contract costs incurred at any time to total estimated contract costs. [removed: These estimates are subject to] [added: Estimating contract costs is subjective and certain projects require] considerable judgment and could be impacted by changes in [removed: labor, materials/equipment,] [added: labor] and [removed: subcontractor costs.] [added: materials/equipment.] [removed: Auditing management’s estimates of total contract costs was challenging due to significant judgments made by management with respect to labor, materials/equipment and subcontractor costs as future results may vary significantly from past estimates due to changes in facts and circumstances as the project progresses to completion. ] |
| _How We Addressed the Matter in Our Audit_ | We obtained an understanding, evaluated the design, and tested the operating effectiveness of controls over the contract estimated cost at completion process. For example, we tested controls over management’s review of cost estimates for significant inputs such as [removed: labor, materials/equipment] [added: labor] and [removed: subcontractor] [added: materials/equipment] costs. To [removed: test] [added: evaluate] the Company’s contract cost estimates, our audit procedures [removed: included, among others, for] [added: included selecting] a sample of [removed: contracts,] [added: contracts and, among others procedures,] reviewing the [removed: contracts,] [added: contracts and any associated amendments,] conducting interviews with and reviewing questionnaires completed by project [removed: personnel;] [added: personnel,] assessing blended labor rates [removed: included in actual costs to date as compared to blended labor rates] used in the estimate to complete the [removed: project,] [added: project against blended labor rates actually incurred to date,] agreeing estimated [removed: labor, materials/equipment] [added: labor] and [removed: subcontractor] [added: materials/equipment] costs to supporting documentation, [removed: sending independent confirmations to customers;] and performing lookback analyses comparing gross margin over the life of the project to assess management’s ability to estimate. |
[removed: February 26, 2020][added: | | 2020 | | | | | | | | | | |]
We have audited Comfort Systems USA, Inc.’s internal control over financial reporting as of December 31, [removed: 2019,] [added: 2020,] based on criteria established in _Internal Control—Integrated Framework_ issued by the Committee of Sponsoring Organizations of the Treadway Commission (2013 framework) (the COSO criteria).
In our opinion, Comfort Systems USA, Inc. (the Company) maintained, in all material respects, effective internal control over financial reporting as of December 31, [removed: 2019,] [added: 2020,] based on the COSO criteria.
We also have audited, in accordance with the standards of the Public Company Accounting Oversight Board (United States) (PCAOB), the consolidated balance sheets of the Company as of December 31, [removed: 2019] [added: 2020] and [removed: 2018,] [added: 2019,] the related consolidated statements of operations, stockholders’ equity and cash flows for each of the three years in the period ended December 31, [removed: 2019,] [added: 2020,] and the related notes and our report dated February [removed: 26, 2020] [added: 25, 2021] expressed an unqualified opinion thereon.
| | | [added: | 2020 | | |] 2019 | | | 2018 | | [removed: ] |
| Cash and cash equivalents | | $ | [removed: 50,788] [added: 54,896] | | $ | [removed: 45,620] [added: 50,788] | |
| Billed accounts receivable, less allowance for [removed: doubtful accounts] [added: credit losses] of [removed: $6,907] [added: $9,087] and [removed: $5,898,] [added: $6,907,] respectively | | | [removed: 619,037] [added: 619,544] | | | [removed: 481,366] [added: 619,037] | |
| [removed: Unbilled] [added: Less—Unbilled] accounts receivable | | [added: ] | [removed: 55,542] [added: (45,596)] | | [added: ] | [removed: 37,180] [added: (55,542)] | |
| Inventories | | | [removed: 10,053] [added: 13,472] | | | [removed: 12,416] [added: 10,053] | |
| Prepaid expenses and other | | | [removed: 14,396] [added: 15,510] | | | [removed: 6,544] [added: 14,396] | |
| Costs and estimated earnings in excess of billings | | [added: $] | [removed: 2,736] [added: 18,622] | | [added: $] | [removed: 10,213] [added: 2,736] | |
| Total current assets | | | [removed: 790,184] [added: 811,852] | | | [removed: 609,700] [added: 790,184] | |
| PROPERTY AND EQUIPMENT, NET | | | [removed: 109,796] [added: 117,206] | | | [removed: 99,618] [added: 109,796] | |
| LEASE RIGHT-OF-USE ASSET | | | [removed: 84,073] [added: 94,727] | | | [removed: —] [added: 84,073] | |
| GOODWILL | | | [removed: 332,447] [added: 464,392] | | | [removed: 235,182] [added: 332,447] | |
| IDENTIFIABLE INTANGIBLE ASSETS, NET | | | [removed: 159,974] [added: 231,807] | | | [removed: 95,275] [added: 159,974] | |
| DEFERRED TAX ASSETS | | | [removed: 21,923] [added: 29,401] | | | [removed: 17,634] [added: 21,923] | |
| OTHER NONCURRENT ASSETS | | | [removed: 6,615] [added: 7,970] | | | [removed: 5,155] [added: 6,615] | |
| Total assets | | $ | [removed: 1,505,012] [added: 1,757,355] | | $ | [removed: 1,062,564] [added: 1,505,012] | |
| Current maturities of long-term debt | | $ | [removed: 20,817] [added: —] | | $ | [removed: 3,279] [added: 20,817] | |
| Accounts payable | | | [removed: 196,195] [added: 204,145] | | | [removed: 176,167] [added: 196,195] | |
| | Auditing management’s estimates of total contract costs for certain longer-duration projects was challenging due to significant judgments made by management with respect to labor and materials/equipment costs as future results may vary significantly from past estimates due to changes in facts and circumstances as the project progresses to completion. |
February 25, 2021
February 25, 2021
| Unbilled accounts receivable, less allowance for credit losses of $784 and $0, respectively | | | 45,596 | | | 55,542 | |
| Other receivables, less allowance for credit losses of $759 and $0, respectively | | | 44,212 | | | 37,632 | |
| Costs and estimated earnings in excess of billings, less allowance for credit losses of $79 and $0, respectively | | | 18,622 | | | 2,736 | |
| Net income | | — | | | — | | — | | | — | | | — | | | 150,139 | | | 150,139 | |
| Cumulative-effect adjustment (1) | | — | | | — | | — | | | — | | | — | | | (515) | | | (515) | |
| Issuance of shares for options exercised | | — | | | — | | 113,731 | | | 2,811 | | | (667) | | | — | | | 2,144 | |
| Issuance of restricted stock & performance stock | | — | | | — | | 128,889 | | | 3,102 | | | (1,247) | | | — | | | 1,855 | |
| Dividends | | — | | | — | | — | | | — | | | — | | | (15,499) | | | (15,499) | |
| Share repurchase | | — | | | — | | (684,634) | | | (30,120) | | | — | | | — | | | (30,120) | |
| BALANCE AT DECEMBER 31, 2020 | | 41,123,365 | | $ | 411 | | (4,935,186) | | $ | (129,243) | | $ | 322,451 | | $ | 502,810 | | $ | 696,429 | |
______________________________________
| | (1) | Represents the adjustment to Retained Earnings as a result of adopting Accounting Standards Update (ASU) No. 2016-13, “Financial Instruments – Credit Losses (Topic 326),” on January 1, 2020. See Note 2 for more information. |
| Payments on term loan | | | (15,000) | | | — | | | — | |
We adopted ASU No. 2016-13, “Financial Instruments – Credit Losses (Topic 326),” on January 1, 2020,
and the impact was not material to our overall financial statements.
The adoption of ASU No. 2016-13 resulted in an increase in Allowance for Credit Losses of $0.7 million, an increase to Deferred Tax Assets of $0.2 million and an impact of $0.5 million to Retained Earnings.
We have modified our fair value disclosures to conform with the requirements of ASU No. 2018-13, “Fair Value Measurement (Topic 820): Disclosure Framework — Changes to the Disclosure Requirements for Fair Value Measurement,” which we adopted on January 1, 2020.
We do not expect our adoption of this standard on January 1, 2021 to have a material impact on our consolidated financial statements.
The customer typically controls the work in process as evidenced either by contractual termination clauses or by our rights to payment for work performed to date plus a reasonable profit to deliver products or services that do not have an alternative use to the Company.
For a small portion of our business in which our services are delivered in the form of service maintenance agreements for existing systems to be repaired and maintained, as opposed to constructed, our performance obligation is to maintain the customer’s mechanical system for a specific period of time.
Our revenue recognition policy is further discussed in Note 3 “Revenue from Contracts with Customers.”
Accounts Receivable and Allowance for Credit Losses
We are required to estimate and record the expected credit losses over the contractual life of our financial assets measured at amortized cost, including billed and unbilled accounts receivable, other receivables and costs and estimated
earnings in excess of billings.
Our trade receivables are contractually due in less than a year.
We estimate our credit losses using a loss-rate method for each of our identified portfolio segments.
Our portfolio segments are construction, service and other.
While our construction and service financial assets are often with the same subset of customers and industries, our construction financial assets will generally have a lower loss-rate than service financial assets due to lien rights, which we are more likely to have on construction jobs.
These lien rights result in lower credit loss expenses on average compared to receivables that do not have lien rights.
Financial assets classified as “other” include receivables that are not related to our core revenue producing activities, such as receivables related to our acquisition activity from former owners, our vendor rebate program or receivables for estimated losses in excess of our insurance deductible, which are accrued with a corresponding accrued insurance liability.
Loss rates for our portfolios are based on numerous factors, including our history of credit loss expense by portfolio, the financial strength of our customers and counterparties in each portfolio, the aging of our receivables, our expectation of likelihood of payment, macroeconomic trends in the U.S. and the current and forecasted non-residential construction market trends in the U.S.
In addition to the loss-rate calculations discussed above, we also record allowance for credit losses for specific receivables that are deemed to have a higher risk profile than the rest of the respective pool of receivables, such as concerns about a specific customer going bankrupt and no longer being able to pay the receivables due to us.
Starting in March 2020, we experienced negative impacts to our business due to the disruption caused by Coronavirus Disease 2019 (“COVID-19”).
In March 2020, the World Health Organization categorized COVID-19 as a pandemic, and the President of the United States declared the COVID-19 outbreak a national emergency.
The Company considered the impact of COVID-19 on the assumptions and estimates used to determine the results reported and asset valuations as of December 31, 2020.
During the year ended December 31, 2020, we increased our loss rates and increased our specific reserves primarily due to the economic disruption caused by COVID-19, which is reflected in our bad debt expense in the current year.
This increase was primarily, but not exclusively, due to concern over collectability of receivables from customers more directly impacted by COVID-19.
Adoption of ASU No. 2016-02 Leases
As discussed in Note 2 to the consolidated financial statements, the Company changed its method of accounting for leases in 2019 due to the adoption of ASU No. 2016-02, _Leases_.
| | Accounting for acquisition of Walker TX Holding Company, LLC |
| _Description of the Matter_ | As disclosed in Note 4 to the consolidated financial statements, on April 1, 2019, the Company completed its acquisition of Walker TX Holding Company, LLC and each of its wholly-owned subsidiaries (Walker) for consideration of $235.4 million. The transaction was accounted for as a business combination. Auditing the Company's accounting for its acquisition of Walker was complex due to the significant estimation uncertainty in determining the fair value of intangible assets and liabilities which principally consisted of contingent consideration, customer relationships and trademarks of $19.5 million, $53.0 million and $32.6 million, respectively. The significant estimation uncertainty was primarily due to the sensitivity of the respective fair values to the underlying assumptions about the future performance of Walker. The significant assumptions used to estimate the fair value of the acquired intangible assets included discount rates and certain assumptions that form the basis of the forecasted results (e.g. revenue growth rates and operating margins). The significant assumptions used to estimate the fair value of contingent consideration included the discount rate, volatility and forecasted results (e.g. revenue growth rates and EBITDA margins). These significant assumptions are forward-looking and could be affected by future economic conditions. |
| _How We Addressed the Matter in Our Audit_ | We obtained an understanding, evaluated the design, and tested the operating effectiveness of controls over the purchase accounting process. For example, we tested the Company's controls over the recognition and measurement of consideration transferred (including contingent consideration) and intangible assets, including the valuation models and significant assumptions used to develop such estimates. To test the fair value of contingent consideration and intangible assets, our audit procedures included, among others, evaluating the Company’s valuation methodologies, involving our valuation specialists to assist in testing the significant assumptions described above used to develop the prospective financial information and assessing the application of the valuation methodologies, and testing the completeness and accuracy of the underlying data. For example, we compared the significant |
| | assumptions to current economic trends, historical results of the Company’s business and other relevant factors. We also performed a sensitivity analysis of the significant assumptions to evaluate the change in the fair value of the contingent consideration and intangible assets resulting from changes in the assumptions. |
| Other receivables | | | 37,632 | | | 16,361 | |
| GOODWILL IMPAIRMENT | | | | — | | | — | | | 1,105 | |
| BALANCE AT DECEMBER 31, 2016 | | 41,123,365 | | $ | 411 | | (3,914,251) | | $ | (57,387) | | $ | 309,625 | | $ | 123,984 | | $ | 376,633 | |
| Issuance of shares for options exercised | | — | | | — | | 145,746 | | | 2,257 | | | (205) | | | — | | | 2,052 | |
| Issuance of restricted stock & performance stock | | — | | | — | | 134,646 | | | 2,037 | | | (421) | | | — | | | 1,616 | |
| Dividends | | — | | | — | | — | | | — | | | — | | | (10,987) | | | (10,987) | |
| Share repurchase | | — | | | — | | (263,097) | | | (9,007) | | | — | | | — | | | (9,007) | |
| | | | | | | | | | | |
| --- | --- | --- | --- | --- | --- | --- | --- | --- | --- | --- |
| Net income | | $ | 114,324 | | $ | 112,903 | | $ | 55,272 | |
| Goodwill impairment | | | — | | | — | | | 1,105 | |
| Payments on capital lease obligations | | | — | | | — | | | (256) | |
In February 2016, the Financial Accounting Standards Board (“FASB”) issued ASU No. 2016-02, “Leases (Topic 842).” The standard requires substantially all leases (with the exception of leases with a term of one year or less) to be recorded on the Balance Sheet using a method referred to as the right-of-use (“ROU”) asset approach.
Full retrospective application is prohibited.
We adopted ASU No. 2016-02, “Leases (Topic 842)”, on January 1, 2019, using
the transition method allowed by ASU No. 2018-11, “Leases (Topic 842) Targeted Improvements” in which lessees apply the new lease standard on the adoption date and recognize a cumulative-effect adjustment to the opening balance of retained earnings in the period of adoption.
We adopted the practical expedient allowing us to not include leases with an initial term of 12 months or less on the Balance Sheet.
Furthermore, we elected to apply the practical expedient allowing an entity to forgo reassessing (1) whether expired or existing contracts contain a lease, (2) classification of expired or existing leases, and (3) whether capitalized costs associated with expired or existing leases should be classified as “initial direct costs” under Topic 842.
The adoption of ASU 2016-02 did not have a significant impact to our Statement of Operations or Cash Flows.
The adoption of ASU 2016-02 resulted in the recording of right-of-use asset and lease liabilities of $75.9 million on our Balance Sheet as of January 1, 2019 but did not result in a cumulative-effect adjustment to retained earnings.
We are still completing our evaluation of the impact of this authoritative guidance on our consolidated financial statements, but expect that it will increase our allowances for credit losses upon adoption.
Early adoption is permitted.
We are currently evaluating the potential impact of this authoritative guidance on our consolidated financial statements.
ASU 2019-12 is effective for fiscal years beginning after December 15, 2020 and interim periods within that year.
revenue by the percentage of contract costs incurred at any time to total estimated contract costs.
| | | $ | (164,182) | | $ | (120,773) | |
operating income.
Prior to implementing ASC 606 on January 1, 2018, our methods for recognizing revenue were very similar to our current method under ASC 606.
We used the actual cost as a percent of total expected cost at completion to estimate our percentage complete on fixed price jobs, a mark-up of costs for jobs in which revenue was based on time and materials incurred and elapsed time for those service maintenance contracts in which the full cost to provide the services cannot be reasonably estimated.
Furthermore, our process for allocating transaction price to performance obligations is also substantially similar to prior years when, in most cases, a contract is one performance obligation.
In those cases in which a contract is determined to have more than one performance obligation, the contract price is allocated to each performance obligation based on its standalone sales price.
| --- | --- | --- | --- | --- | --- | --- | --- | --- | --- | --- | --- | --- | --- | --- | --- | --- | --- | --- | --- |
Accounts Receivable
The amounts due are stated at their net estimated realizable value.
An excerpt. Shown here: 40 of 471 rewritten, 40 of 257 added and 40 of 149 removed. The counts are complete. For every sentence, read Item 8. Financial Statements and Supplementary Data in the FY2020 filing and the FY2019 filing.
Item 9A. Controls and Procedures
1 rewritten, 0 added, 0 removed, 8 unchanged
There have not been any changes in our internal control over financial reporting (as such term is defined in Rules 13a-15(f) and 15d-15(f) under the Securities Exchange Act of 1934) during the three months ended December 31, [removed: 2019] [added: 2020] that has materially affected, or are reasonably likely to materially affect, internal control over financial reporting.
Item 10. Directors, Executive Officers and Corporate Governance
2 rewritten, 0 added, 0 removed, 8 unchanged
The Company will file with the Commission a definitive proxy statement including the other information to be disclosed under this item in the 120 days following December 31, [removed: 2019] [added: 2020] and such information is hereby incorporated by reference.
The Company will file with the Commission a definitive proxy statement including the information to be disclosed under the items in the 120 days following December 31, [removed: 2019] [added: 2020] and such information is hereby incorporated by reference.
Item 15. Exhibits and Financial Statement Schedules
2 rewritten, 2 added, 0 removed, 9 unchanged
[removed: (1)Consolidated] [added: | | (1) | Consolidated] Financial Statements: The Index to the Consolidated Financial Statements is included under Part II, Item 8 of this annual report on Form 10-K and is incorporated herein by reference. [added: |]
[removed: (2)Financial] [added: | | (2) | Financial] Statement Schedules: [added: |]
| --- | --- | --- |
| --- | --- | --- |
Item 16. Form 10-K Summary
22 rewritten, 5 added, 0 removed, 124 unchanged
| [removed: 2.1] [added: 10.56] | | [Purchase Agreement, dated February 21, 2019, by and among the Company, Walker, the Shareholder Sellers and Scott Walker, in his capacity as representative of the Shareholder [removed: Sellers](http://www.sec.gov/Archives/edgar/data/1035983/000110465919010746/a19-5185_2ex2d1.htm)] [added: Sellers](https://www.sec.gov/Archives/edgar/data/1035983/000110465919010746/a19-5185_2ex2d1.htm)] | | 2.1 | | February 26, 2019 Form 8-K |
| 4.2 | | [Description of Registrant’s Securities](https://www.sec.gov/Archives/edgar/data/1035983/000155837020001491/ex-4d2.htm) | | [removed: ] [added: 4.2] | | [removed: Filed Herewith] [added: 2019 Form 10-K] |
| [removed: 10.56] [added: 10.57] | | [Amendment No. 6 to Second Amended and Restated Credit Agreement and Amendment to Other Loan Documents](https://www.sec.gov/Archives/edgar/data/1035983/000155837020001491/ex-10d56.htm) | | [removed: ] [added: 10.56] | | [removed: Filed Herewith] [added: 2019 Form 10-K] |
| 21.1 | | [List of subsidiaries of Comfort Systems USA, [removed: Inc.](https://www.sec.gov/Archives/edgar/data/1035983/000155837020001491/ex-21d1.htm)] [added: Inc.](https://www.sec.gov/Archives/edgar/data/1035983/000155837021001828/fix-20201231xex21d1.htm)] | | | | Filed Herewith |
| 23.1 | | [Consent of Ernst & Young [removed: LLP](https://www.sec.gov/Archives/edgar/data/1035983/000155837020001491/ex-23d1.htm)] [added: LLP](https://www.sec.gov/Archives/edgar/data/1035983/000155837021001828/fix-20201231xex23d1.htm)] | | | | Filed Herewith |
| 31.1 | | [Certification of Chief Executive Officer pursuant to Section 302 of the Sarbanes-Oxley Act of [removed: 2002](https://www.sec.gov/Archives/edgar/data/1035983/000155837020001491/ex-31d1.htm)] [added: 2002](https://www.sec.gov/Archives/edgar/data/1035983/000155837021001828/fix-20201231xex31d1.htm)] | | | | Filed Herewith |
| 31.2 | | [Certification of Chief Financial Officer pursuant to Section 302 of the Sarbanes-Oxley Act of [removed: 2002](https://www.sec.gov/Archives/edgar/data/1035983/000155837020001491/ex-31d2.htm)] [added: 2002](https://www.sec.gov/Archives/edgar/data/1035983/000155837021001828/fix-20201231xex31d2.htm)] | | | | Filed Herewith |
| 32.1 | | [Certification of Chief Executive Officer pursuant to Section 906 of the Sarbanes-Oxley Act of [removed: 2002](https://www.sec.gov/Archives/edgar/data/1035983/000155837020001491/ex-32d1.htm)] [added: 2002](https://www.sec.gov/Archives/edgar/data/1035983/000155837021001828/fix-20201231xex32d1.htm)] | | | | Furnished Herewith |
| 32.2 | | [Certification of Chief Financial Officer pursuant to Section 906 of the Sarbanes-Oxley Act of [removed: 2002](https://www.sec.gov/Archives/edgar/data/1035983/000155837020001491/ex-32d2.htm)] [added: 2002](https://www.sec.gov/Archives/edgar/data/1035983/000155837021001828/fix-20201231xex32d2.htm)] | | | | Furnished Herewith |
| Date: February [removed: 26, 2020] [added: 25, 2021] | | |
| /s/ Brian E. Lane | | President, Chief Executive Officer, and | | February [removed: 26, 2020] [added: 25, 2021] | |
| /s/ William George | | Executive Vice President and Chief Financial | | February [removed: 26, 2020] [added: 25, 2021] | |
| /s/ Julie S. Shaeff | | Senior Vice President and Chief Accounting | | February [removed: 26, 2020] [added: 25, 2021] | |
| /s/ Franklin Myers | | Chairman of the Board | | February [removed: 26, 2020] [added: 25, 2021] | |
| /s/ Darcy G. Anderson | | Director | | February [removed: 26, 2020] [added: 25, 2021] | |
| /s/ Herman E. Bulls | | Director | | February [removed: 26, 2020] [added: 25, 2021] | |
| /s/ Alan P. Krusi | | Director | | February [removed: 26, 2020] [added: 25, 2021] | |
| /s/ James H. Schultz | | Director | | February [removed: 26, 2020] [added: 25, 2021] | |
| /s/ Pablo G. Mercado | | Director | | February [removed: 26, 2020] [added: 25, 2021] | |
| /s/ William J. Sandbrook | | Director | | February [removed: 26, 2020] [added: 25, 2021] | |
| /s/ Constance E. Skidmore | | Director | | February [removed: 26, 2020] [added: 25, 2021] | |
| /s/ Vance W. Tang | | Director | | February [removed: 26, 2020] [added: 25, 2021] | |
| 10.58 | | [Agreement and Plan of Merger dated as of March 9, 2020 among Comfort Systems USA, Inc., OSC Acquisition Corp., TAS Energy Inc., and Element Partners II, L.P., as Stockholder Representative](https://www.sec.gov/Archives/edgar/data/1035983/000110465920033252/tm2012107d1_ex2-1.htm) | | 2.1 | | March 13, 2020 Form 8-K |
| | | | | | | |
| | | | | Incorporated by Reference to the Exhibit Indicated Below and to the Filing with the Commission Indicated Below | | |
| --- | --- | --- | --- | --- | --- | --- |
| Exhibit Number | | Description of Exhibits | | Exhibit Number | | Filing or File Number |