 filings.tools
Item 7. MANAGEMENT’S DISCUSSION AND ANALYSIS OF FINANCIAL CONDITION AND RESULTS OF OPERATIONS
77K characters. Original on sec.gov · Markdown
Item 7. MANAGEMENT’S DISCUSSION AND ANALYSIS OF FINANCIAL CONDITION AND RESULTS OF OPERATIONS
(Dollars in millions, except per-share amounts or unless otherwise noted)
For an overview of our operating segments, including a discussion of our major products and services and the reorganization of our Information Technology and Mission Systems operating segments into a single Technologies segment, see the Business discussion contained in Item 1. Prior-period segment information has been restated for the reorganization.
A discussion of our financial condition and results of operations for 2020 compared with 2019 is presented below and should be read in conjunction with our Consolidated Financial Statements included in Item 8, while a discussion of 2019 compared with 2018 can be found in Item 7 of our Annual Report on Form 10-K for the year ended December 31, 2019. The Technologies segment’s results of operations for 2019 compared with 2018 can be obtained from the discussions of the former Information Technology and Mission Systems operating segments.
BUSINESS ENVIRONMENT
GLOBAL PANDEMIC
The Coronavirus (COVID-19) pandemic has caused significant disruptions to national and global economies and government activities. Our businesses have been designated as critical infrastructure by the U.S. government and many non-U.S. governments and, as such, are required to stay open. During this time, we have continued to conduct our operations to the fullest extent possible, while responding to the pandemic with actions that include:
-
implementing measures to protect the health and safety of our employees.
-
modifying employee work locations and schedules where possible and permitted under our contracts.
-
coordinating closely with our suppliers and customers.
-
managing our cost structure in the context of current business activity.
-
instituting various aspects of our business continuity programs.
-
planning for and working aggressively to mitigate disruptions that may occur.
-
supporting our communities and the U.S. government in addressing the challenges of the pandemic, such as the production of medical supplies and donation of personal protective equipment.
While we expect this situation to be temporary, any longer-term impact to our business is currently unknown due to the uncertainty around the pandemic’s duration and its broader impact. See the Risk Factors in Item 1A, regarding the COVID-19 pandemic, as well as additional risks facing our business, which may be affected by the COVID-19 pandemic.
The United States and some other governments have taken steps to respond to the pandemic and to support economic activity and liquidity in the capital markets. In the United States, the adoption of the Coronavirus Aid, Relief, and Economic Security Act (the CARES Act) provides various forms of relief. The CARES Act includes provisions that allow agencies to reimburse contractors for payments to covered workers who are prevented from working due to COVID-19 facility closures or other restrictions; however, such reimbursement is subject to the availability of funds. These provisions of the CARES Act have been extended through March 31, 2021. The CARES Act also allows for loans to companies. To date, we have not sought or accepted CARES Act loans. In addition, the U.S. Department of Defense (DoD) increased progress payment rates and reduced retention rates on certain contracts to
provide liquidity to federal contractors and their suppliers. We in turn advanced payments across our supplier base to help maintain the health and liquidity of our supply chain. Outside of the United States, other governments have established various government workforce programs, which can support business continuity for our foreign operations. We continue to assess the benefits and limitations of the actions taken by the United States and other governments. See Note A to the Consolidated Financial Statements in Item 8 for additional information about our use of estimates and other uncertainties.
Our U.S. government business experienced some disruption from the COVID-19 pandemic, including reduced activities due to select customer site closures and limited access to some customer sites, travel restrictions, slowdowns in the provision of materials from suppliers, and lower man-hours at some manufacturing sites. Internationally, while government actions shut down some of our facilities in the second quarter, our defense business has largely returned to normal operations. Within our Aerospace segment, pandemic-related travel limitations resulted in lower demand for aircraft services due to reduced flight activity, and disrupted the aircraft sales process by limiting our ability to arrange demonstration flights and coordinate in-person access to customers. To de-risk elements of the supply chain and better align production with demand, we have reduced our aircraft production rate until such time that the marketplace supports future increases. Accordingly, we have adjusted staffing levels and taken other cost control measures. The Review of Operating Segments includes additional information on the full-year results for each of our segments.
We expect COVID-19 to continue to negatively impact our businesses, particularly Aerospace, until the large economies of the world recover from the effects of the pandemic. As air travel resumes, we expect aircraft services volume to increase, but we could see some future aircraft deliveries delayed to the extent customers have difficulty traveling to take possession of their aircraft. In addition, should the global economy experience a significant extended downturn from the pandemic, demand for our aerospace products and services would likely be impacted. We believe the support by the DoD, and the U.S. government generally, of the defense industrial base has helped and will continue to help mitigate the effects of disruptions on our U.S. defense business. Our non-U.S. defense business will be impacted to varying degrees based on the response of the countries in which they operate. We will continue to assess further potential consequences to our employees, business, supply chain and customers, and take actions to mitigate adverse outcomes.
We took actions in 2020 to strengthen our liquidity and financial condition. In March 2020, we issued $4 billion of fixed-rate notes to repay $2.5 billion of fixed- and floating-rate notes that matured in May 2020 and for general corporate purposes, including the repayment of a portion of our borrowings under our commercial paper program. In addition to this long-term borrowing, we renewed our access to $5 billion of credit facilities. While part of our pre-COVID-19 planning, this liquidity preserves our financial flexibility during the pandemic. We believe that our cash flows from operations and borrowing capacity are sufficient to support our short- and long-term liquidity needs.
OUR MARKETS
With approximately 70% of our revenue from the U.S. government, government spending levels — particularly defense spending — influence our financial performance. On December 27, 2020, the fiscal year (FY) 2021 defense appropriations bill was signed into law. It totaled $696 billion, a modest increase over FY 2020, and included $627 billion in the base budget in compliance with the previously established spending caps and $69 billion for overseas contingency operations.
The long-term outlook for our U.S. defense business is influenced by the U.S. military’s funding priorities, the diversity of our programs and customers, our insight into customer requirements stemming from our incumbency on core programs, our ability to evolve our products to address a fast-changing threat environment and our proven track record of successful contract execution.
International demand for military equipment and technologies presents opportunities for our non-U.S. operations and exports from our North American businesses. While the revenue potential can be significant, there are risks to doing business in foreign countries, including changing budget priorities and overall spending pressures unique to each country.
In our Aerospace segment, we expect our investment in the development of new aircraft products and technologies to support the segment’s long-term growth. Similarly, we believe the aircraft services business will be a source of steady revenue growth as the global business jet fleet continues to grow and the impact of the pandemic subsides.
RESULTS OF OPERATIONS
INTRODUCTION
An understanding of our accounting practices is necessary in the evaluation of our financial statements and operating results. The following paragraphs explain how we recognize revenue and operating costs in our operating segments and the terminology we use to describe our operating results.
In the Aerospace segment, we record revenue on contracts for new aircraft when the customer obtains control of the asset, which is generally upon delivery and acceptance by the customer of the fully outfitted aircraft. Revenue associated with the segment’s custom completions of narrow-body and wide-body aircraft and the segment’s services businesses is recognized as work progresses or upon delivery of services. Fluctuations in revenue from period to period result from the number and mix of new aircraft deliveries, progress on aircraft completions, and the level and type of aircraft services performed during the period.
The majority of the Aerospace segment’s operating costs relates to new aircraft production on firm orders and consists of labor, material, subcontractor and overhead costs. The costs are accumulated in production lots, recorded in inventory and recognized as operating costs at aircraft delivery based on the estimated average unit cost in a production lot. While changes in the estimated average unit cost for a production lot impact the level of operating costs, the amount of operating costs reported in a given period is based largely on the number and type of aircraft delivered. Operating costs in the Aerospace segment’s completions and services businesses are recognized generally as incurred.
For new aircraft, operating earnings and margin are a function of the prices of our aircraft, our operational efficiency in manufacturing and outfitting the aircraft, and the mix of ultra-large-cabin, large-cabin and mid-cabin aircraft deliveries. Aircraft mix can also refer to the stage of program maturity for our aircraft models. A new aircraft model typically has lower margins in its initial production lots, and then margins generally increase as we realize efficiencies in the production process. Additional factors affecting the segment’s earnings and margin include the volume, mix and profitability of completions and services work performed, the volume of and market for pre-owned aircraft, and the level of general and administrative (G&A) and net research and development (R&D) costs incurred by the segment.
In the defense segments, revenue on long-term government contracts is recognized generally over time as the work progresses, either as products are produced or as services are rendered. Typically, revenue is recognized over time using costs incurred to date relative to total estimated costs at completion to measure progress toward satisfying our performance obligations. Incurred cost represents work performed, which corresponds with, and thereby best depicts, the transfer of control to the customer. Contract costs include labor, material, overhead and, when appropriate, G&A expenses. Variances in costs recognized from period to period reflect primarily increases and decreases in production or activity levels on individual contracts. Because costs are used as a measure of progress, year-over-year variances in cost result in corresponding variances in revenue, which we generally refer to as volume.
Operating earnings and margin in the defense segments are driven by changes in volume, performance or contract mix. Performance refers to changes in profitability based on adjustments to estimates at completion on individual contracts. These adjustments result from increases or decreases to the estimated value of the contract, the estimated costs to complete the contract or both. Therefore, changes in costs incurred in the period compared with prior periods do not necessarily impact profitability. It is only when total estimated costs at completion on a given contract change without a corresponding change in the contract value (or vice versa) that the profitability of that contract may be impacted. Contract mix refers to changes in the volume of higher- versus lower-margin work. Higher or lower margins can result from a number of factors, including contract type (e.g., fixed-price/cost-reimbursable) and type of work (e.g., development/production). Contract mix can also refer to the stage of program maturity for our long-term production contracts. New long-term production contracts typically have lower margins initially, and then margins generally increase as we achieve learning curve improvements or realize other cost reductions.
In the discussion that follows, prior-period information has been restated for the retrospective application of a change in accounting principle related to the amortization of actuarial gains and losses for our qualified U.S. government pension plans, which we adopted in the fourth quarter of 2020 as discussed in Note T to the Consolidated Financial Statements in Item 8.
CONSOLIDATED OVERVIEW
2020 IN REVIEW
- Outstanding operating performance in the face of a challenging business environment:
◦Revenue of $37.9 billion with sequential growth throughout the year.
◦Cash from operating activities of $3.9 billion, or 122% percent of net earnings.
- Record-high backlog of $89.5 billion increased $2.5 billion, or 2.9%, from 2019, supporting our long-term growth expectations:
◦Several significant contract awards received in 2020 in our defense segments, including $9.5 billion from the U.S. Navy for the construction of the first two Columbia-class submarines.
| Year Ended December 31 | 2020 | 2019 | Variance | ||||||||||||||||||||
| Revenue | $ | 37,925 | $ | 39,350 | $ | (1,425) | (3.6) | % | |||||||||||||||
| Operating costs and expenses | (33,792) | (34,780) | 988 | (2.8) | % | ||||||||||||||||||
| Operating earnings | 4,133 | 4,570 | (437) | (9.6) | % | ||||||||||||||||||
| Operating margin | 10.9 | % | 11.6 | % |
Our consolidated revenue decreased in 2020 due to fewer aircraft deliveries and lower aircraft service activity in our Aerospace segment. Also in 2020, revenue was impacted by lower information technology (IT) services volume in our Technologies segment. These decreases were driven by the impact of the COVID-19 pandemic. Higher volume on the Virginia-class and Columbia-class submarine programs in our Marine Systems segment helped offset some of these decreases. The combined revenue in our defense businesses was up approximately $300 compared with 2019.
Operating margin decreased in 2020 due primarily to reduced aircraft deliveries and related restructuring charges in our Aerospace segment. Operating margin was also negatively impacted by COVID-related disruptions in our Technologies segment, including a loss on a contract with a non-U.S. customer and non-fee bearing cost reimbursements by the U.S. government authorized under Section 3610 of the CARES Act.
REVIEW OF OPERATING SEGMENTS
Following is a discussion of operating results and outlook for each of our operating segments. For the Aerospace segment, results are analyzed by specific types of products and services, consistent with how the segment is managed. For the defense segments, the discussion is based on markets and the lines of products and services offered with a supplemental discussion of specific contracts and programs when significant to the results. Additional information regarding our segments can be found in Note S to the Consolidated Financial Statements in Item 8.
AEROSPACE
| Year Ended December 31 | 2020 | 2019 | Variance | ||||||||||||||||||||
| Revenue | $ | 8,075 | $ | 9,801 | $ | (1,726) | (17.6) | % | |||||||||||||||
| Operating earnings | 1,083 | 1,532 | (449) | (29.3) | % | ||||||||||||||||||
| Operating margin | 13.4 | % | 15.6 | % | |||||||||||||||||||
| Gulfstream aircraft deliveries (in units) | 127 | 147 | (20) | (13.6) | % |
Operating Results
The change in the Aerospace segment’s revenue in 2020 consisted of the following:
| Aircraft manufacturing | $ | (1,426) | |||
| Aircraft services and completions | (300) | ||||
| Total decrease | $ | (1,726) |
In 2020, quarantine and travel restrictions resulting from the COVID-19 pandemic had a significant impact on the segment’s results. In an effort to de-risk elements of the supply chain and better align production with demand, in April we reduced our aircraft production and delivery rates for the year. As a result, aircraft manufacturing revenue decreased in 2020 due primarily to fewer deliveries of the ultra-large-cabin G650 aircraft, offset partially by additional deliveries of the large-cabin G600 and G500 aircraft. In addition, decreased flight activity due to the pandemic resulted in lower demand for maintenance work and reduced volume at our fixed-base operator (FBO) facilities in 2020.
The change in the segment’s operating earnings in 2020 consisted of the following:
| Aircraft manufacturing | $ | (590) | |||
| Aircraft services and completions | (39) | ||||
| Restructuring charges | (59) | ||||
| G&A/other expenses | 239 | ||||
| Total decrease | $ | (449) |
Aircraft manufacturing operating earnings were down in 2020 due to reduced aircraft production and delivery rates and a somewhat less favorable mix in aircraft deliveries. In 2020, operating earnings were also down in aircraft services and completions due to lower volume. Full-year results were negatively impacted by restructuring actions taken to adjust the workforce size to the revised 2020 production levels. These decreases were offset partially by lower net G&A/other expenses, including reduced R&D expenses. Overall, R&D expenses have been trending downward with the completion of the G500 and G600 test programs. In total, the Aerospace segment’s operating margin decreased 220 basis points to 13.4%.
The Aerospace segment’s operating results progressively improved during 2020 following the initial disruption from the pandemic in the second quarter. Fourth quarter revenue grew 23% over third quarter and operating earnings grew 42% on increased deliveries of all large-cabin models, as well as increased aircraft services activity. As a result, the segment’s operating margin increased 220 basis points in the fourth quarter compared with the third quarter and exceeded the fourth quarter of 2019.
2021 Outlook
We expect the Aerospace segment’s 2021 revenue to be around $8 billion. Operating margin is expected to be approximately 12.5%, down from 2020 as a result of fewer anticipated aircraft deliveries as the segment completed production of the G550 aircraft, offset by higher anticipated aircraft services volume that carries lower margins.
MARINE SYSTEMS
| Year Ended December 31 | 2020 | 2019 | Variance | ||||||||||||||||||||
| Revenue | $ | 9,979 | $ | 9,183 | $ | 796 | 8.7 | % | |||||||||||||||
| Operating earnings | 854 | 785 | 69 | 8.8 | % | ||||||||||||||||||
| Operating margin | 8.6 | % | 8.5 | % |
Operating Results
The increase in the Marine Systems segment’s revenue in 2020 consisted of the following:
| U.S. Navy ship construction | $ | 668 | |||
| U.S. Navy ship engineering, repair and other services | 176 | ||||
| Commercial ship construction | (48) | ||||
| Total increase | $ | 796 |
Revenue from U.S. Navy ship construction and engineering work was up in 2020 due to increased volume on the Columbia-class submarine program. Revenue from U.S. Navy ship construction also increased due to higher volume on the Virginia-class submarine and Expeditionary Sea Base (ESB) auxiliary support ship programs. This revenue growth was achieved as management worked to protect
employees and support the supply chain to keep these critical programs on track during the pandemic. The Marine Systems segment’s operating margin increased 10 basis points in 2020 despite the impact of the pandemic and a workforce strike at our Bath Iron Works shipyard.
2021 Outlook
We expect the Marine Systems segment’s 2021 revenue to be approximately $10.3 billion. Operating margin is expected to be approximately 8.3%, down from 2020 due to increased work on the first two Columbia-class submarines, which carry a lower margin consistent with lead boats in a new class.
COMBAT SYSTEMS
| Year Ended December 31 | 2020 | 2019 | Variance | ||||||||||||||||||||
| Revenue | $ | 7,223 | $ | 7,007 | $ | 216 | 3.1 | % | |||||||||||||||
| Operating earnings | 1,041 | 996 | 45 | 4.5 | % | ||||||||||||||||||
| Operating margin | 14.4 | % | 14.2 | % |
Operating Results
The increase in the Combat Systems segment’s revenue in 2020 consisted of the following:
| Weapons systems and munitions | $ | 125 | |||
| International military vehicles | 54 | ||||
| U.S. military vehicles | 37 | ||||
| Total increase | $ | 216 |
Revenue was up across the Combat Systems segment in 2020 as the business overcame disruptions caused by the pandemic in the first half of the year. Weapons systems and munitions revenue was up driven by increased production of artillery and missile subcomponents. Revenue from international military vehicles increased due to higher volume on a contract to produce armored combat support vehicles (ACSVs) for the Canadian government and the British Army’s AJAX armored fighting vehicle program, offset partially by lower volume on Piranha wheeled armored vehicle programs. Revenue from U.S. military vehicles increased due primarily to higher volume on the U.S. Army’s Abrams main battle tank program. The Combat Systems segment’s operating margin increased 20 basis points compared with 2019 driven by favorable contract mix and strong operating performance.
2021 Outlook
We expect the Combat Systems segment’s 2021 revenue to be about $7.3 billion with operating margin of approximately 14.5%.
TECHNOLOGIES
| Year Ended December 31 | 2020 | 2019 | Variance | ||||||||||||||||||||
| Revenue | $ | 12,648 | $ | 13,359 | $ | (711) | (5.3) | % | |||||||||||||||
| Operating earnings | 1,211 | 1,311 | (100) | (7.6) | % | ||||||||||||||||||
| Operating margin | 9.6 | % | 9.8 | % |
Operating Results
The change in the Technologies segment’s revenue in 2020 consisted of the following:
| IT services | $ | (530) | |||
| C4ISR* solutions | (181) | ||||
| Total decrease | $ | (711) |
*Command, control, communications, computers, intelligence, surveillance and reconnaissance
IT services revenue decreased due to the partial closure of some customer sites to all but mission critical personnel and a lower level of customer and program activity as a result of the COVID-19 pandemic. IT services revenue was also lower due to the exit of non-core lines of business in 2019. C4ISR revenue decreased due to the sale of a satellite communications business in the second quarter and volume timing on several programs, including a mobile communications network program. These decreases were offset partially by increased volume on programs supporting Navy platforms.
The Technologies segment’s operating margin decreased 20 basis points compared with 2019 due to COVID-related disruptions in our IT services business, including customer reimbursement of idle workforce cost at zero fee and a loss recognized on a contract with a non-U.S. customer from schedule delays caused by COVID travel restrictions. The Technologies segment’s operating performance steadily improved in the second half of 2020 with a reduced impact from the pandemic. Operating margin increased 120 basis points in the fourth quarter compared with the third quarter, returning to the same level of performance as fourth quarter of 2019.
2021 Outlook
We expect the Technologies segment’s 2021 revenue to be approximately $13.2 billion with operating margin of around 9.5%.
CORPORATE
Corporate operating results consisted primarily of equity-based compensation expense and totaled $56 in 2020 and $54 in 2019. Corporate operating costs are expected to be approximately $85 in 2021.
OTHER INFORMATION
PRODUCT AND SERVICE REVENUE AND OPERATING COSTS
| Year Ended December 31 | 2020 | 2019 | Variance | ||||||||||||||||||||
| Revenue: | |||||||||||||||||||||||
| Products | $ | 22,188 | $ | 23,130 | $ | (942) | (4.1) | % | |||||||||||||||
| Services | 15,737 | 16,220 | (483) | (3.0) | % | ||||||||||||||||||
| Operating Costs: | |||||||||||||||||||||||
| Products | $ | (18,192) | $ | (18,611) | $ | 419 | (2.3) | % | |||||||||||||||
| Services | (13,408) | (13,752) | 344 | (2.5) | % |
The change in product revenue in 2020 consisted of the following:
| Aircraft manufacturing | $ | (1,426) | |||||||||
| Ship construction | 620 | ||||||||||
| Other, net | (136) | ||||||||||
| Total decrease | $ | (942) |
In 2020, aircraft manufacturing revenue decreased due to the reduced production and delivery rates caused by the COVID-19 pandemic. This decrease was offset partially by increased volume on the Virginia-class and Columbia-class submarine programs. In 2020, product operating costs decreased at a lower rate than revenue due primarily to the mix of Gulfstream aircraft deliveries.
The change in service revenue in 2020 consisted of the following:
| IT services | $ | (530) | |||
| Other, net | 47 | ||||
| Total decrease | $ | (483) |
In 2020, IT services revenue decreased due to the partial closure of some customer sites to all but mission critical personnel and a lower level of customer and program activity as a result of the COVID-19 pandemic. In 2020, the primary driver of the decrease in service operating costs was the change in volume of IT services described above.
G&A EXPENSES
As a percentage of revenue, G&A expenses were 5.8% in 2020 and 6.1% in 2019. We expect G&A expenses as a percentage of revenue in 2021 to be generally consistent with 2020.
INTEREST, NET
Net interest expense was $477 in 2020 and $460 in 2019. See Note K to the Consolidated Financial Statements in Item 8 for additional information regarding our debt obligations, including interest rates. We expect 2021 net interest expense to be approximately $420, reflecting repayment of our scheduled debt maturities of $3 billion in 2021.
OTHER, NET
Net other income was $82 in 2020 and $92 in 2019. Other represents primarily the non-service components of pension and other post-retirement benefits, which were income in both periods. In 2021, we expect net other income to be approximately $90.
PROVISION FOR INCOME TAX, NET
Our effective tax rate was 15.3% in 2020 and 17.1% in 2019. The decrease is due to a variety of factors, including higher research tax credits. For further discussion, including a reconciliation of our effective tax rate from the statutory federal rate, see Note F to the Consolidated Financial Statements in Item 8. For 2021, we anticipate a full-year effective tax rate of approximately 16%.
BACKLOG AND ESTIMATED POTENTIAL CONTRACT VALUE
Our total backlog, including funded and unfunded portions, was $89.5 billion on December 31, 2020, up 2.9% from $86.9 billion at the end of 2019. Our total backlog is equal to our remaining performance obligations under contracts with customers as discussed in Note B to the Consolidated Financial Statements in Item 8. Our total estimated contract value, which combines total backlog with estimated potential contract value, was $134.7 billion on December 31, 2020, up 6.7% from $126.2 billion at the end of 2019.
The following table details the backlog and estimated potential contract value of each segment at the end of 2020 and 2019:
| Funded | Unfunded | Total Backlog | Estimated Potential Contract Value | Total Estimated Contract Value | |||||||||||||||||||||||||
| December 31, 2020 | |||||||||||||||||||||||||||||
| Aerospace | $ | 11,308 | $ | 318 | $ | 11,626 | $ | 2,800 | $ | 14,426 | |||||||||||||||||||
| Marine Systems | 23,646 | 26,336 | 49,982 | 4,876 | 54,858 | ||||||||||||||||||||||||
| Combat Systems | 14,341 | 226 | 14,567 | 9,774 | 24,341 | ||||||||||||||||||||||||
| Technologies | 9,488 | 3,826 | 13,314 | 27,727 | 41,041 | ||||||||||||||||||||||||
| Total | $ | 58,783 | $ | 30,706 | $ | 89,489 | $ | 45,177 | $ | 134,666 | |||||||||||||||||||
| December 31, 2019 | |||||||||||||||||||||||||||||
| Aerospace | $ | 13,168 | $ | 181 | $ | 13,349 | $ | 2,989 | $ | 16,338 | |||||||||||||||||||
| Marine Systems | 20,012 | 24,175 | 44,187 | 5,453 | 49,640 | ||||||||||||||||||||||||
| Combat Systems | 14,474 | 439 | 14,913 | 4,322 | 19,235 | ||||||||||||||||||||||||
| Technologies | 9,876 | 4,620 | 14,496 | 26,485 | 40,981 | ||||||||||||||||||||||||
| Total | $ | 57,530 | $ | 29,415 | $ | 86,945 | $ | 39,249 | $ | 126,194 |
For additional information about our major products and services in backlog see the Business discussion contained in Item 1.
AEROSPACE
Aerospace funded backlog represents new aircraft and custom completion orders for which we have definitive purchase contracts and deposits from customers. Unfunded backlog consists of agreements to provide future aircraft maintenance and support services. Beyond total backlog, estimated potential contract value represents primarily options and other agreements with existing customers to purchase new aircraft and long-term aircraft services agreements.
Following reduced order activity in the first half of 2020 due to the COVID-19 pandemic, orders in the second half of 2020 reflected improved demand for Gulfstream aircraft. We received orders for all models of Gulfstream aircraft, including strong order activity for the new G700 aircraft, which is scheduled to enter service in the fourth quarter of 2022. Despite the impact of the COVID-19 pandemic, the segment achieved a book-to-bill ratio (orders divided by revenue) of 0.9-to-1 in 2020.
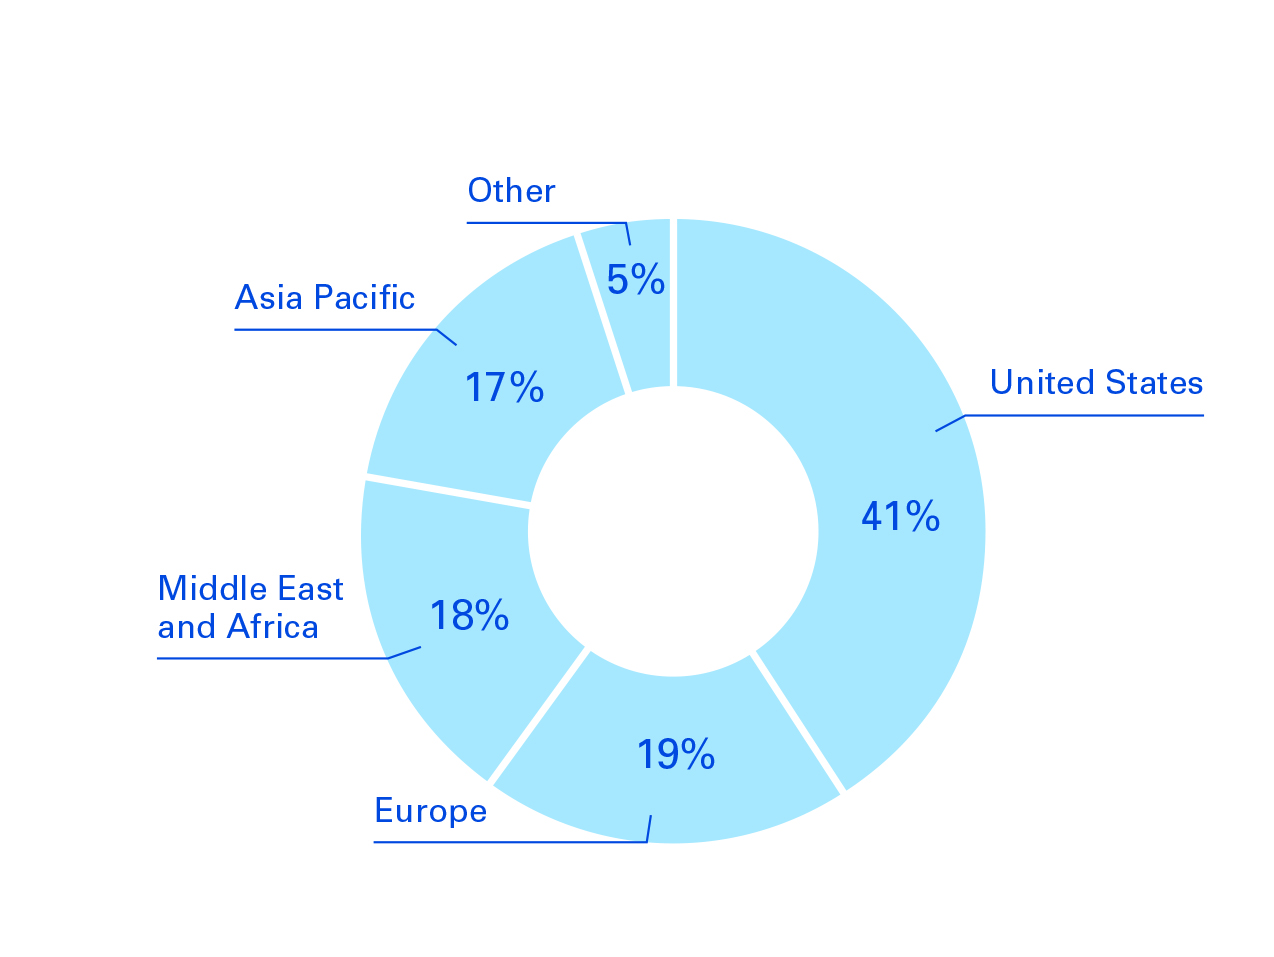
Demand for Gulfstream aircraft remains strong across customer types and geographic regions, generating orders from public and privately held companies, individuals, and governments around the world. Geographically, U.S. customers represented more than 55% of the segment’s orders in 2020 and
41% of the segment’s backlog on December 31, 2020, demonstrating continued strong domestic demand.
The following represents Gulfstream aircraft (in units) in backlog by region on December 31, 2020:
DEFENSE SEGMENTS
The total backlog in our defense segments represents the estimated remaining sales value of work to be performed under firm contracts. The funded portion of total backlog includes items that have been authorized and appropriated by the U.S. Congress and funded by customers, as well as commitments by international customers that are approved and funded similarly by their governments. The unfunded portion of total backlog includes the amounts we believe are likely to be funded, but there is no guarantee that future budgets and appropriations will provide the same funding level currently anticipated for a given program.
Estimated potential contract value in our defense segments includes unexercised options associated with existing firm contracts and unfunded work on indefinite delivery, indefinite quantity (IDIQ) contracts. Contract options represent agreements to perform additional work under existing contracts at the election of the customer. We recognize options in backlog when the customer exercises the option and establishes a firm order. For IDIQ contracts, we evaluate the amount of funding we expect to receive and include this amount in our estimated potential contract value. This amount is often less than the total IDIQ contract value, particularly when the contract has multiple awardees. The actual amount of funding received in the future may be higher or lower than our estimate of potential contract value.
Total backlog in our defense segments was $77.9 billion on December 31, 2020, up 5.8% from $73.6 billion at the end of 2019 driven by the award of a contract from the U.S. Navy for the construction of the first two Columbia-class submarines. Estimated potential contract value in our defense segments was $42.4 billion on December 31, 2020, up 16.9% from $36.3 billion at year-end 2019 due to strong demand from customers in our Combat Systems and Technologies segments.
MARINE SYSTEMS
The Marine Systems segment’s backlog consists of very long-term submarine and surface ship construction programs, as well as numerous engineering and repair contracts. The segment’s book-to-bill ratio was 1.6-to-1 in 2020, resulting in backlog growth of 13.1% from year-end 2019. The increase in backlog is due primarily to the award of a $9.5 billion contract for the construction of the first two Columbia-class ballistic-missile submarines, as well as associated design and engineering support. Other significant contract awards received in the Marine Systems segment during 2020 include:
-
$990 from the U.S. Navy for the John Lewis-class (T-AO-205) fleet replenishment oiler program, including the construction of two additional ships.
-
$575 from the Navy to provide maintenance and repair services for the Arleigh Burke-class (DDG-51) guided-missile destroyer, Independence-class Littoral Combat Ship (LCS), San Antonio-class amphibious transport dock, Ticonderoga-class guided-missile cruiser, Wasp-class amphibious assault ship and Whidbey Island-class dock landing ship programs.
-
$310 from the Navy for Virginia-class submarine construction. The Virginia-class submarine program was the company’s largest defense program in 2020 and the largest program in the company’s backlog.
The following represents the Marine Systems segment’s total estimated contract value by major program on December 31, 2020:

COMBAT SYSTEMS
The Combat Systems segment’s backlog consists of a mix of U.S. and international combat vehicles, weapons systems and munitions programs. The vehicle programs are generally long-term, franchise programs, while the weapons systems and munitions programs tend to be shorter-term in nature. The segment’s total estimated contract value at the end of 2020 was up 26.5% from year-end 2019, driven by awards from the U.S. Army related to Abrams main battle tanks and Stryker wheeled combat vehicles described below.
We received the following significant contract awards in the Combat Systems segment during 2020:
-
$405 from the U.S. Army to upgrade Abrams tanks to the M1A2 System Enhancement Package Version 3 (SEPv3) configuration. The contract has a maximum potential value of $4.3 billion.
-
$320 from the Army to upgrade Stryker vehicles to the double-V-hull A1 configuration. The contract has a maximum potential value of $2.5 billion.
-
$230 from the Army to produce Stryker Initial Maneuver Short-Range Air Defense (IM-SHORAD) vehicles. The contract has a maximum potential value of $1.2 billion.
-
$215 from the Army for the production of Hydra-70 rockets. The contract has a maximum potential value of $3.4 billion.
-
$870 to deliver 8x8 wheeled combat vehicles, maintenance and lifecycle support to the Spanish Ministry of Defense.
The following represents the Combat Systems segment’s total estimated contract value by market on December 31, 2020:

TECHNOLOGIES
The Technologies segment’s backlog consists of thousands of contracts and task orders across a mix of U.S. and non-U.S. government and commercial customers. These contracts can be shorter-cycle or span multiple years, but commonly include a small, initially funded order. Therefore, our estimated potential contract value of $27.7 billion is an important indicator of future orders and revenue. In 2020, approximately 60% of the segment’s orders were from additional work on IDIQ contracts or the exercise of options. Our total estimated contract value remained stable in 2020 despite the impact of reduced new business opportunities caused by COVID-19.
We received the following significant contract awards in the Technologies segment during 2020:
-
The Defense Enterprise Office Solutions (DEOS) contract from the General Services Administration in partnership with the DoD and Defense Information Systems Agency (DISA) to stand up cloud environments and support the migration of over 3.2 million existing DoD Office 365 users to the cloud. The contract has a maximum potential value of $4.4 billion.
-
An IDIQ award from the U.S. Department of State to provide overseas consular services to support visa processing and other functions for U.S. embassies and consultants under the Global Support Strategy (GSS) program. The program has a maximum potential contract value of $3.3 billion among three awardees.
-
An IDIQ contract to modernize the Army’s training programs. The contract has a maximum potential value of $885.
-
A contract to provide enterprise IT and cybersecurity services and solutions for the DoD. The contract has a maximum potential value of $760.
-
A contract to provide enterprise IT, communications and mission command support services to U.S. Army Europe. The contract has a maximum potential value of $695.
-
A contract from the U.S. Air Force for the Battlefield Information Collection and Exploitation System (BICES) program to provide intelligence information sharing capabilities for the DoD. The contract has a maximum potential value of $620.
The following represents the Technologies segment’s total estimated contract value by customer on December 31, 2020:

FINANCIAL CONDITION, LIQUIDITY AND CAPITAL RESOURCES
We place a strong emphasis on cash flow generation. This focus gives us the flexibility for capital deployment while preserving a strong balance sheet to position us for future opportunities. Cash
generated by operating activities in 2020 and 2019 was deployed to pay dividends, fund capital expenditures and business acquisitions, and repurchase our common stock.
| Year Ended December 31 | 2020 | 2019 | |||||||||
| Net cash provided by operating activities | $ | 3,858 | $ | 2,981 | |||||||
| Net cash used by investing activities | (974) | (994) | |||||||||
| Net cash used by financing activities | (903) | (1,997) | |||||||||
| Net cash used by discontinued operations | (59) | (51) | |||||||||
| Net increase (decrease) in cash and equivalents | 1,922 | (61) | |||||||||
| Cash and equivalents at beginning of year | 902 | 963 | |||||||||
| Cash and equivalents at end of year | 2,824 | 902 | |||||||||
| Short- and long-term debt | (12,998) | (11,930) | |||||||||
| Net debt | $ | (10,174) | $ | (11,028) | |||||||
| Debt-to-equity (a) | 83.0 | % | 85.3 | % | |||||||
| Debt-to-capital (b) | 45.4 | % | 46.0 | % |
(a)Debt-to-equity ratio is calculated as total debt divided by total equity as of year end.
(b)Debt-to-capital ratio is calculated as total debt divided by the sum of total debt plus total equity as of year end.
We expect to continue to generate funds in excess of our short- and long-term liquidity needs. We believe we have adequate funds on hand and sufficient borrowing capacity to execute our financial and operating strategy. The following is a discussion of our major operating, investing and financing activities in 2020 and 2019, as classified on the Consolidated Statement of Cash Flows in Item 8.
OPERATING ACTIVITIES
Cash provided by operating activities was $3.9 billion in 2020 compared with $3 billion in 2019. The primary driver of cash inflows in both periods was net earnings. However, cash flows in both years were affected negatively by growth in operating working capital (OWC) in our Aerospace segment due to our position in the development and production cycles of our Gulfstream aircraft models. We had anticipated this OWC growth to begin reversing in 2020, but the impact of COVID-19 on our production and delivery rates has delayed this recovery. Cash flows in 2019 were also affected negatively by growth in OWC in our Combat Systems segment due to the timing of payments on a large international wheeled armored vehicle contract. These payment timing issues have been resolved as a result of finalizing a contract amendment with the customer, which contributed to the increase in cash flows in 2020. For additional information about the unbilled receivables balance and activity associated with this contract, see Note H to the Consolidated Financial Statements in Item 8.
INVESTING ACTIVITIES
Cash used by investing activities was $974 in 2020 and $994 in 2019. Our investing activities include cash paid for capital expenditures and business acquisitions; purchases, sales and maturities of marketable securities; and proceeds from asset sales.
Capital Expenditures. The primary use of cash for investing activities in both years was capital expenditures. Capital expenditures were $967 in 2020 and $987 in 2019. Capital expenditures have been at an elevated level the past two years as we continue to invest in our shipyards, particularly for the planned growth in submarine construction. We expect capital expenditures to be approximately 2.5% of revenue in 2021.
Business Acquisitions. In 2020, we acquired five businesses for an aggregate of approximately $205. In 2019, we acquired three businesses for an aggregate of approximately $20.
FINANCING ACTIVITIES
Cash used by financing activities was $903 in 2020 and $2 billion in 2019. Net cash from financing activities includes proceeds received from debt and commercial paper issuances and employee stock options exercises. Our financing activities also include repurchases of common stock, payment of dividends and debt repayments.
Dividends. On March 4, 2020, our board of directors declared an increased quarterly dividend of $1.10 per share, the 23rd consecutive annual increase. Previously, the board had increased the quarterly dividend to $1.02 per share in March 2019. Cash dividends paid were $1.2 billion in 2020 and 2019.
Share Repurchases. Our board of directors from time to time authorizes management to repurchase outstanding shares of our common stock on the open market. We paid $587 and $231 in 2020 and 2019, respectively, to repurchase our outstanding shares. On December 31, 2020, 12.3 million shares remained authorized by our board of directors for repurchase, representing 4.3% of our total shares outstanding.
Debt and Commercial Paper Issuances and Repayments. In March 2020, we issued $4 billion of fixed-rate notes. The proceeds were used to repay $2.5 billion of fixed- and floating-rate notes that matured in May 2020 and for general corporate purposes, including the repayment of a portion of the borrowings under our commercial paper program.
Fixed- and floating-rate notes totaling $2.5 billion mature in May 2021, and an additional $500 of fixed-rate notes mature in July 2021. We currently plan to repay these notes using a combination of cash on hand and the issuance of commercial paper. For additional information regarding our debt obligations, including scheduled debt maturities and interest rates, see Note K to the Consolidated Financial Statements in Item 8.
On December 31, 2020, we had no commercial paper outstanding, but we maintain the ability to access the commercial paper market in the future. Separately, we have $5 billion in committed bank credit facilities for general corporate purposes and working capital needs and to support our commercial paper issuances. We also have an effective shelf registration on file with the Securities and Exchange Commission that allows us to access the debt markets.
NON-GAAP FINANCIAL MEASURES
We emphasize the efficient conversion of net earnings into cash and the deployment of that cash to maximize shareholder returns. As described below, we use free cash flow from operations and return on invested capital (ROIC) to measure our performance in these areas. While we believe these metrics provide useful information, they are not defined operating measures under U.S. generally accepted accounting principles (GAAP), and there are limitations associated with their use. Our calculation of these metrics may not be completely comparable to similarly titled measures of other companies due to potential differences in the method of calculation. As a result, the use of these metrics should not be considered in isolation from, or as a substitute for, other GAAP measures.
Free Cash Flow. We define free cash flow from operations as net cash provided by operating activities less capital expenditures. We believe free cash flow from operations is a useful measure for investors because it portrays our ability to generate cash from our businesses for purposes such as
repaying maturing debt, funding business acquisitions, repurchasing our common stock and paying dividends. We use free cash flow from operations to assess the quality of our earnings and as a key performance measure in evaluating management. The following table reconciles the free cash flow from operations with net cash provided by operating activities, as classified on the Consolidated Statement of Cash Flows in Item 8:
| Year Ended December 31 | 2020 | 2019 | 2018 | 2017 | 2016 | ||||||||||||||||||||||||
| Net cash provided by operating activities | $ | 3,858 | $ | 2,981 | $ | 3,148 | $ | 3,876 | $ | 2,163 | |||||||||||||||||||
| Capital expenditures | (967) | (987) | (690) | (428) | (392) | ||||||||||||||||||||||||
| Free cash flow from operations | $ | 2,891 | $ | 1,994 | $ | 2,458 | $ | 3,448 | $ | 1,771 | |||||||||||||||||||
| Cash flows as a percentage of earnings from continuing operations: | |||||||||||||||||||||||||||||
| Net cash provided by operating activities | 122 | % | 86 | % | 94 | % | 133 | % | 81 | % | |||||||||||||||||||
| Free cash flow from operations | 91 | % | 57 | % | 73 | % | 118 | % | 66 | % |
Return on Invested Capital. We believe ROIC is a useful measure for investors because it reflects our ability to generate returns from the capital we have deployed in our operations. We use ROIC to evaluate investment decisions and as a performance measure in evaluating management. We define ROIC as net operating profit after taxes divided by average invested capital. Net operating profit after taxes is defined as earnings from continuing operations plus after-tax interest and amortization expense, calculated using the statutory federal income tax rate. Average invested capital is defined as the sum of the average debt and shareholders’ equity excluding accumulated other comprehensive loss. ROIC excludes goodwill impairments and non-economic accounting changes as they are not reflective of company performance.
ROIC is calculated as follows:
| Year Ended December 31 | 2020 | 2019 | 2018 | 2017 | 2016 | ||||||||||||||||||||||||
| Earnings from continuing operations | $ | 3,167 | $ | 3,484 | $ | 3,358 | $ | 2,912 | $ | 2,679 | |||||||||||||||||||
| After-tax interest expense | 386 | 373 | 295 | 76 | 64 | ||||||||||||||||||||||||
| After-tax amortization expense | 280 | 287 | 258 | 51 | 57 | ||||||||||||||||||||||||
| Net operating profit after taxes | $ | 3,833 | $ | 4,144 | $ | 3,911 | $ | 3,039 | $ | 2,800 | |||||||||||||||||||
| Average invested capital | $ | 32,431 | $ | 29,620 | $ | 25,367 | $ | 18,099 | $ | 17,168 | |||||||||||||||||||
| Return on invested capital | 11.8 | % | 14.0 | % | 15.4 | % | 16.8 | % | 16.3 | % |
*2017 earnings from continuing operations and 2017 and 2018 average invested capital have not been restated for the retrospective application of a change in accounting principle related to the amortization of actuarial gains and losses for our qualified U.S. government pension plans, which we adopted in the fourth quarter of 2020 as discussed in Note T to the Consolidated Financial Statements in Item 8.
ADDITIONAL FINANCIAL INFORMATION
OFF-BALANCE SHEET ARRANGEMENTS
On December 31, 2020, we had no material off-balance sheet arrangements.
CONTRACTUAL OBLIGATIONS AND COMMERCIAL COMMITMENTS
The following tables present information about our contractual obligations and commercial commitments on December 31, 2020:
| Payments Due by Period | |||||||||||||||||||||||||||||
| Contractual Obligations | Total Amount Committed | Less Than 1 Year | 1-3 Years | 4-5 Years | More Than 5 Years | ||||||||||||||||||||||||
| Debt (a) | $ | 16,501 | $ | 3,389 | $ | 2,884 | $ | 2,508 | $ | 7,720 | |||||||||||||||||||
| Operating leases | 1,710 | 298 | 444 | 263 | 705 | ||||||||||||||||||||||||
| Finance leases | 396 | 87 | 124 | 40 | 145 | ||||||||||||||||||||||||
| Purchase obligations (b) | 38,090 | 17,019 | 15,111 | 4,655 | 1,305 | ||||||||||||||||||||||||
| Other long-term liabilities (c) | 26,892 | 4,188 | 3,479 | 2,596 | 16,629 | ||||||||||||||||||||||||
| $ | 83,589 | $ | 24,981 | $ | 22,042 | $ | 10,062 | $ | 26,504 |
(a)Includes scheduled interest payments. See Note K to the Consolidated Financial Statements in Item 8 for a discussion of long-term debt.
(b)Includes amounts committed under legally enforceable agreements for goods and services with defined terms as to quantity, price and timing of delivery. This amount includes $36.2 billion of purchase obligations for products and services to be delivered under firm government contracts under which we would expect full recourse under normal contract termination clauses.
(c)Represents other long-term liabilities on our Consolidated Balance Sheet, including the current portion of these liabilities. The projected timing of cash flows associated with these obligations is based on management’s estimates, which are based largely on historical experience. This amount also includes all liabilities under our defined benefit retirement plans. See Note R to the Consolidated Financial Statements in Item 8 for information regarding these liabilities and the plan assets available to satisfy them.
| Amount of Commitment Expiration by Period | |||||||||||||||||||||||||||||
| Commercial Commitments | Total Amount Committed | Less Than 1 Year | 1-3 Years | 4-5 Years | More Than 5 Years | ||||||||||||||||||||||||
| Letters of credit and guarantees* | $ | 1,402 | $ | 771 | $ | 336 | $ | 199 | $ | 96 | |||||||||||||||||||
| Aircraft trade-in options* | 339 | 16 | 236 | 87 | — | ||||||||||||||||||||||||
| $ | 1,741 | $ | 787 | $ | 572 | $ | 286 | $ | 96 |
*See Note O to the Consolidated Financial Statements in Item 8 for a discussion of letters of credit and aircraft trade-in options.
APPLICATION OF CRITICAL ACCOUNTING POLICIES
Management’s Discussion and Analysis of Financial Condition and Results of Operations is based on the Consolidated Financial Statements, which have been prepared in accordance with GAAP. The preparation of financial statements in accordance with GAAP requires that we make estimates and assumptions that affect the reported amounts of assets and liabilities and the disclosure of contingent assets and liabilities at the date of the financial statements, as well as the reported amounts of revenue and expenses during the reporting period. On an ongoing basis, we evaluate our estimates including most pervasively those related to various assumptions and projections for our long-term contracts and programs. Other significant estimates include those related to goodwill and intangible assets, income taxes, pension and other post-retirement benefits, workers’ compensation, warranty obligations and litigation contingencies. We employ judgment in making our estimates, but they are based on historical experience, currently available information and various other assumptions that we believe to be reasonable under the circumstances. These estimates form the basis for making judgments about the carrying values of assets and liabilities that are not readily available from other sources. Actual results may differ from these estimates. We believe our judgment is applied consistently and produces financial information that fairly depicts the results of operations for all periods presented.
In our opinion, the following policies are critical and require the use of significant judgment in their application:
Revenue. A performance obligation is a promise in a contract to transfer a distinct good or service to the customer, and is the unit of account for revenue. A contract’s transaction price is allocated to each distinct performance obligation within that contract and recognized as revenue when, or as, the performance obligation is satisfied. Our performance obligations are satisfied over time as work progresses or at a point in time.
Substantially all of our revenue in the defense segments is recognized over time, because control is transferred continuously to our customers. Typically, revenue is recognized over time using costs incurred to date relative to total estimated costs at completion to measure progress toward satisfying our performance obligations. Incurred cost represents work performed, which corresponds with, and thereby best depicts, the transfer of control to the customer. Contract costs include labor, material, overhead and, when appropriate, G&A expenses.
Most of our revenue recognized at a point in time is for the manufacture of business jet aircraft in our Aerospace segment. Revenue on these contracts is recognized when the customer obtains control of the asset, which is generally upon delivery and acceptance by the customer of the fully outfitted aircraft.
The majority of our revenue is derived from long-term contracts and programs that can span several years. Accounting for long-term contracts and programs involves the use of various techniques to estimate total contract revenue and costs. For long-term contracts, we estimate the profit on a contract as the difference between the total estimated revenue and expected costs to complete a contract and recognize that profit over the life of the contract.
Contract estimates are based on various assumptions to project the outcome of future events that often span several years. These assumptions include labor productivity and availability; the complexity of the work to be performed; the cost and availability of materials; the performance of subcontractors; and the availability and timing of funding from the customer.
The nature of our contracts gives rise to several types of variable consideration, including claims and award and incentive fees. We include in our contract estimates additional revenue for submitted contract modifications or claims against the customer when we believe we have an enforceable right to the modification or claim, the amount can be estimated reliably and its realization is probable. In evaluating these criteria, we consider the contractual/legal basis for the claim, the cause of any additional costs incurred, the reasonableness of those costs and the objective evidence available to support the claim. We include award or incentive fees in the estimated transaction price when there is a basis to reasonably estimate the amount of the fee. These estimates are based on historical award experience, anticipated performance and our best judgment at the time. Because of our certainty in estimating these amounts, they are included in the transaction price of our contracts and the associated remaining performance obligations.
As a significant change in one or more of these estimates could affect the profitability of our contracts, we review and update our contract-related estimates regularly. Our estimates at the end of the year included impacts from the disruptions caused by COVID-19. Given the uncertainties around the pandemic, including its duration and potential future disruptions to our supply chain or workforce, it is reasonably possible that the actual impact of the pandemic on contract costs could be materially different than our current estimates. The United States and some other governments have taken steps to provide relief. Where our customer has agreed to reimburse certain costs, such as provided for by the
Coronavirus Aid, Relief, and Economic Security Act (the CARES Act), we have included those recoveries in our estimates of revenue. To the extent the U.S. government provides for reimbursement of additional costs through legislation and the DoD has available funds, we will seek reimbursement as appropriate.
We recognize adjustments in estimated profit on contracts under the cumulative catch-up method. Under this method, the impact of the adjustment on profit recorded to date on a contract is recognized in the period the adjustment is identified. Revenue and profit in future periods of contract performance are recognized using the adjusted estimate. The aggregate impact of adjustments in contract estimates increased our operating earnings (and diluted earnings per share) by $283 ($0.78) in 2020 and $271 ($0.74) in 2019. No adjustment on any one contract was material to the Consolidated Financial Statements in 2020 or 2019.
Consistent with industry practice, we classify assets and liabilities related to long-term contracts as current, even though some of these amounts may not be realized within one year. The timing of revenue recognition, billings and cash collections results in billed accounts receivable, unbilled receivables (contract assets), and customer advances and deposits (contract liabilities) on the Consolidated Balance Sheet. These assets and liabilities are reported on the Consolidated Balance Sheet on a contract-by-contract basis at the end of each reporting period.
Reorganization of Operating Segments and Composition of Reporting Units. Effective December 31, 2020, for segment reporting purposes, we reorganized our Information Technology and Mission Systems operating segments into a single segment: Technologies. This reorganization reflects our evolving strategic focus on the combined capabilities of the businesses to meet the customer demand for large-scale, end-to-end highly engineered solutions. Our company now has four operating segments: Aerospace, Marine Systems, Combat Systems and Technologies. We refer to the latter three collectively as our defense segments.
This reorganization similarly changed the composition of our reporting units. Accordingly, goodwill of the Information Technology and Mission Systems reporting units was combined and assigned to the Technologies reporting unit. We performed goodwill impairment assessments immediately prior to and following the change. The results indicated that no impairment existed at the former Information Technology and Mission Systems reporting units prior to the change and the Technologies reporting unit following the change.
Long-lived Assets and Goodwill. We review long-lived assets, including intangible assets subject to amortization, for impairment whenever events or changes in circumstances indicate that the carrying value of the assets may not be recoverable. We assess the recoverability of the carrying value of assets held for use based on a review of undiscounted projected cash flows. Impairment losses, where identified, are measured as the excess of the carrying value of the long-lived assets over the estimated fair value as determined by discounted cash flows.
The COVID-19 pandemic has caused significant disruptions to national and global economies and government activities, which has impacted our businesses. As of the end of the year, we have not identified a triggering event requiring an impairment test for our goodwill, intangibles or other long-lived assets. In our Aerospace segment, which has experienced a more significant impact from the pandemic, we do not believe the impact represents a longer-term change that would indicate that the carrying value of the segment’s intangibles and long-lived assets may not be recoverable or that the Aerospace reporting unit’s estimated fair value has been significantly affected.
Goodwill represents the purchase price paid in excess of the fair value of net tangible and intangible assets acquired in a business combination. We review goodwill for impairment annually at each of our reporting units or when circumstances indicate that the likelihood of an impairment is greater than 50%. Such circumstances include a significant adverse change in the business climate for one of our reporting units or a decision to dispose of a reporting unit or a significant portion of a reporting unit. Our reporting units are consistent with our operating segments in Note S to the Consolidated Financial Statements in Item 8. We use both qualitative and quantitative approaches when testing goodwill for impairment. When determining the approach to be used, we consider the current facts and circumstances of each reporting unit as well as the excess of each reporting unit’s estimated fair value over its carrying value based on our most recent quantitative assessments. Our qualitative approach evaluates the business environment and various events impacting the reporting unit including, but not limited to, macroeconomic conditions, changes in the business environment and reporting unit-specific events. If, based on the qualitative assessment, we determine that it is more likely than not that the fair value of a reporting unit is greater than its carrying value, then a quantitative assessment is not necessary. However, if a quantitative assessment is determined to be necessary, we compare the fair value of a reporting unit to its carrying value and, if necessary, recognize an impairment loss for the amount by which the carrying value exceeds the reporting unit’s fair value.
Our estimate of fair value is based primarily on the discounted cash flows of the underlying operations and requires the use of judgment by management. The process requires numerous assumptions, including the timing of work embedded in our backlog, our performance and profitability under our contracts, our success in securing future business, the appropriate risk-adjusted interest rate used to discount the projected cash flows, and terminal value growth rates applied to the final year of projected cash flows. Due to the variables inherent in our estimates of fair value, differences in assumptions may have a material effect on the result of our impairment analysis. To assess the reasonableness of our discounted cash flows, we compare the sum of our reporting units’ fair value to our market capitalization. Additionally, we evaluate the reasonableness of each reporting unit’s fair value by comparing the fair value to comparable peer companies and recent comparable market transactions.
As of December 31, 2020, we completed qualitative assessments for our Aerospace, Marine Systems and Combat Systems reporting units as the estimated fair values of each of these reporting units significantly exceeded the respective carrying values based on our most recent quantitative assessments, which were performed as of December 31, 2018. Our qualitative assessments, including consideration of the impact of the COVID-19 pandemic, did not present indicators of impairment for these reporting units. As of December 31, 2020, we completed a quantitative assessment for our Technologies reporting unit, and the fair value was well in excess of its carrying value.
Commitments and Contingencies. We are subject to litigation and other legal proceedings arising either from the normal course of business or under provisions relating to the protection of the environment. Estimating liabilities and costs associated with these matters requires the use of judgment. We record a charge against earnings when a liability associated with claims or pending or threatened litigation is probable and when our exposure is reasonably estimable. The ultimate resolution of our exposure related to these matters may change as further facts and circumstances become known.
Retirement Plans. Our pension and other post-retirement benefit costs and obligations depend on several assumptions and estimates. The key assumption is the interest rates used to discount estimated future liabilities. We base the discount rates on a current yield curve developed from a portfolio of high-quality, fixed-income investments with maturities consistent with the projected benefit payout period.
Retirement plan assumptions, including the discount rates, are based on our best judgment, including consideration of current and future market conditions. In the event any of the assumptions change, pension and other post-retirement benefit cost could increase or decrease. For further discussion about our retirement plan assumptions, see Note R to the Consolidated Financial Statements in Item 8.
As described under Other Contract Costs in Note A to the Consolidated Financial Statements in Item 8, our contractual arrangements with the U.S. government provide for the recovery of benefit costs for our government retirement plans. We have elected to defer recognition of the benefit costs until such costs can be allocated to contracts. Therefore, the impact of annual changes in financial reporting assumptions on the retirement benefit cost for these plans does not immediately affect our operating results.
Accounting Standards Updates. See Note A to the Consolidated Financial Statements in Item 8 for information regarding the accounting standard we adopted in 2020 and other new accounting standards that have been issued by the Financial Accounting Standards Board (FASB) but are not effective until after December 31, 2020.
GUARANTOR FINANCIAL INFORMATION
The fixed- and floating-rate notes described in Note K to the Consolidated Financial Statements in Item 8, issued by General Dynamics Corporation (the parent), are fully and unconditionally guaranteed on an unsecured, joint and several basis by several of the parent’s 100%-owned subsidiaries (the guarantors). The guarantee of each guarantor ranks equally in right of payment with all other existing and future senior unsecured indebtedness of such guarantor. A listing of the guarantors is included in an exhibit to this Form 10-K.
Because the parent is a holding company, its cash flow and ability to service its debt, including the fixed- and floating-rate notes, depends on the performance of its subsidiaries and the ability of those subsidiaries to distribute cash to the parent, whether by dividends, loans or otherwise. Holders of the fixed- and floating-rate notes have a direct claim only against the parent and the guarantors.
Under the relevant indenture, the guarantee of each guarantor is limited to the maximum amount that can be guaranteed without rendering the guarantee voidable under applicable laws relating to fraudulent conveyance or fraudulent transfer or similar laws affecting the rights of creditors generally. Each indenture also provides that, in the event (1) of a merger, consolidation or sale or disposition of all or substantially all of the assets of a guarantor (other than a transaction with the parent or any of its subsidiaries) or (2) there occurs a transfer, sale or other disposition of the voting stock of a guarantor so that the guarantor is no longer a subsidiary of the parent, then the guarantor or the entity acquiring the assets (in the event of the sale or other disposition of all or substantially all of the assets of a guarantor) will be released and relieved of any obligations under the guarantee.
The following summarized financial information presents the parent and guarantors (collectively, the combined obligor group) on a combined basis. The summarized financial information of the combined obligor group excludes net investment in and earnings of subsidiaries related to interests held by the combined obligor group in subsidiaries that are not guarantors of the notes.
STATEMENT OF EARNINGS INFORMATION
| Year Ended December 31 | 2020 | ||||
| Revenue | $ | 13,065 | |||
| Operating costs and expenses, excluding G&A | (11,190) | ||||
| Net Earnings | 738 |
BALANCE SHEET INFORMATION
| December 31, 2020 | December 31, 2019 | ||||||||||
| Cash and equivalents | $ | 1,952 | $ | 606 | |||||||
| Other current assets | 2,894 | 2,875 | |||||||||
| Noncurrent assets | 3,082 | 2,549 | |||||||||
| Total assets | $ | 7,928 | $ | 6,030 | |||||||
| Short-term debt and current portion of long-term debt | $ | 2,998 | $ | 2,497 | |||||||
| Other current liabilities | 2,944 | 2,642 | |||||||||
| Long-term debt | 9,922 | 8,965 | |||||||||
| Other noncurrent liabilities | 5,645 | 5,772 | |||||||||
| Total liabilities | $ | 21,509 | $ | 19,876 |
The summarized balance sheet information presented above includes the funded status of the company’s primary qualified U.S. government pension plans as the parent has the ultimate obligation for the plans.
Previous: Item 6. SELECTED FINANCIAL DATA · Next: Item 7A. QUANTITATIVE AND QUALITATIVE DISCLOSURES ABOUT MARKET RISK