 filings.tools
GoDaddy 10-K 2019-12-31
Filed 2020-02-21. 22 sections, 632K characters. Original on sec.gov · Markdown · JSON
Cover and table of contents
UNITED STATES
SECURITIES AND EXCHANGE COMMISSION
Washington, D.C. 20549
FORM 10-K
(Mark One)
| ☒ | ANNUAL REPORT PURSUANT TO SECTION 13 OR 15(d) OF THE SECURITIES EXCHANGE ACT OF 1934 |
For the fiscal year ended December 31, 2019
or
| ☐ | TRANSITION REPORT PURSUANT TO SECTION 13 OR 15(d) OF THE SECURITIES EXCHANGE ACT OF 1934 |
For the transition period from __________ to __________
Commission File Number: 001-36904
GoDaddy Inc.
(Exact name of registrant as specified in its charter)
| Delaware | 46-5769934 | |||||||||||||
| (State or other jurisdiction of incorporation or organization) | (I.R.S. Employer Identification Number) | |||||||||||||
14455 N. Hayden Road
Scottsdale, Arizona 85260
(Address of principal executive offices, including zip code)
(480) 505-8800
(Registrant's telephone number, including area code)
Securities registered pursuant to Section 12(b) of the Act:
| Title of each class | Trading Symbol(s) | Name of each exchange on which registered | ||||||||||||
| Class A Common Stock, par value $0.001 per share | GDDY | New York Stock Exchange |
Securities registered pursuant to Section 12(g) of the Act: None
Indicate by check mark if the registrant is a well-known seasoned issuer, as defined in Rule 405 of the Securities Act. Yes x No ☐
Indicate by check mark if the registrant is not required to file reports pursuant to Section 13 or 15(d) of the Act. Yes ☐ No x
Indicate by check mark whether the registrant (1) has filed all reports required to be filed by Section 13 or 15(d) of the Securities Exchange Act of 1934 during the preceding 12 months (or for such shorter period that the registrant was required to file such reports) and (2) has been subject to such filing requirements for the past 90 days. Yes x No ☐
Indicate by check mark whether the registrant has submitted electronically every Interactive Data File required to be submitted pursuant to Rule 405 of Regulation S-T (§232.405 of this chapter) during the preceding 12 months (or for such shorter period that the registrant was required to submit and post such files). Yes x No ☐
Indicate by check mark whether the registrant is a large accelerated filer, an accelerated filer, a non-accelerated filer, a smaller reporting company or an emerging growth company. See the definitions of "large accelerated filer," "accelerated filer," "smaller reporting company" and "emerging growth company" in Rule 12b-2 of the Exchange Act.
| Large accelerated filer | x | Accelerated filer | ☐ | |||||||||||
| Non-accelerated filer | ☐ | Smaller reporting company | ☐ | |||||||||||
| Emerging growth company | ☐ |
If an emerging growth company, indicate by check mark if the registrant has elected not to use the extended transition period for complying with any new or revised financial accounting standards provided pursuant to Section 13(a) of the Exchange Act. ☐
Indicate by check mark whether the registrant is a shell company (as defined in Rule 12b-2 of the Exchange Act). Yes ☐ No x
As of June 30, 2019, the aggregate market value of the registrant's Class A common stock held by non-affiliates, based upon the closing sales price for the registrant's Class A common stock as reported by the New York Stock Exchange, was $12,377,121,842. For the purpose of calculating the aggregate market value of shares held by non-affiliates, we have assumed that all outstanding shares are held by non-affiliates, except for shares beneficially owned by each of our executive officers, directors and 5% or greater stockholders. In the case of 5% or greater stockholders, we have not deemed such stockholders to be affiliates unless there are facts and circumstances indicating that such stockholders exercise any control over our company. This determination of affiliate status is not necessarily a conclusive determination for any other purpose.
As of February 14, 2020, there were 173,549,763 shares of GoDaddy Inc.'s Class A common stock, $0.001 par value per share, outstanding and 1,347,434 shares of GoDaddy Inc.'s Class B common stock, $0.001 par value per share, outstanding.
DOCUMENTS INCORPORATED BY REFERENCE
Portions of the registrant's Definitive Proxy Statement relating to the Annual Meeting of Stockholders are incorporated by reference into Part III of this Annual Report on Form 10-K where indicated. Such Definitive Proxy Statement will be filed with the Securities and Exchange Commission within 120 days after the end of the registrant's fiscal year ended December 31, 2019.
GoDaddy Inc.
Annual Report on Form 10-K
Year Ended December 31, 2019
TABLE OF CONTENTS
NOTE ABOUT FORWARD-LOOKING STATEMENTS
This Annual Report on Form 10-K, including the sections titled "Business," "Risk Factors," "Use of Proceeds" and "Management's Discussion and Analysis of Financial Condition and Results of Operations," contains certain forward-looking statements within the meaning of Section 27A of the Securities Act of 1933, as amended, and Section 21E of the Securities Exchange Act of 1934, as amended, involving substantial risks and uncertainties. The words "believe," "may," "will," "potentially," "plan," "could," "should," "predict," "ongoing," "estimate," "continue," "anticipate," "intend," "project," "expect" and similar expressions conveying uncertainty of future events or outcomes are intended to identify forward-looking statements. These statements include, among other things, those regarding:
-
our ability to continue to add new customers and increase sales to our existing customers;
-
our ability to develop new solutions and bring them to market in a timely manner;
-
our ability to timely and effectively scale and adapt our existing solutions;
-
our dependence on establishing and maintaining a strong brand;
-
the occurrence of service interruptions and security or privacy breaches;
-
system failures or capacity constraints;
-
the rate of growth of, and anticipated trends and challenges in, our business and in the market for our products;
-
our future financial performance, including our expectations regarding our revenue, cost of revenue, operating expenses, including changes in technology and development, marketing and advertising, general and administrative and customer care expenses, and our ability to achieve and maintain future profitability;
-
our ability to continue to efficiently acquire customers, maintain our high customer retention rates and maintain the level of our customers' lifetime spend;
-
our ability to provide high quality Customer Care;
-
the effects of increased competition in our markets and our ability to compete effectively;
-
our ability to grow internationally;
-
the impact of fluctuations in foreign currency exchange rates on our business and our ability to effectively manage the exposure to such fluctuations;
-
our ability to effectively manage our growth and associated investments, including our migration of the vast majority of our infrastructure to the public cloud;
-
our ability to integrate acquisitions;
-
our ability to maintain our relationships with our partners;
-
adverse consequences of our substantial level of indebtedness and our ability to repay our debt;
-
our ability to maintain, protect and enhance our intellectual property;
-
our ability to maintain or improve our market share;
-
sufficiency of cash and cash equivalents to meet our needs for at least the next 12 months;
-
beliefs and objectives for future operations;
-
our ability to stay in compliance with laws and regulations currently applicable to, or which may become applicable to, our business both in the United States (U.S.) and internationally;
-
economic and industry trends or trend analysis;
-
our ability to attract and retain qualified employees and key personnel;
-
anticipated income tax rates, tax estimates and tax standards;
-
interest rate changes;
-
the amount and timing of any payments we make under tax receivable agreements (TRAs) or for tax distributions;
-
the future trading prices of our Class A common stock;
NOTE ABOUT FORWARD-LOOKING STATEMENTS (continued)
-
our expectations regarding the outcome of any litigation;
-
the amount and timing of any repurchases of our Class A common stock under our share repurchase programs;
as well as other statements regarding our future operations, financial condition, growth prospects and business strategies.
We operate in very competitive and rapidly-changing environments, and new risks emerge from time-to-time. It is not possible for us to predict all risks, nor can we assess the impact of all factors on our business or the extent to which any factor, or combination of factors, may cause actual results to differ materially from those contained in any forward-looking statements we may make. In light of these risks, uncertainties and assumptions, the forward-looking events discussed in this report may not occur, and actual results could differ materially and adversely from those implied in our forward-looking statements.
You should not rely upon forward-looking statements as predictions of future events. Although we believe the expectations reflected in our forward-looking statements are reasonable, we cannot guarantee the future results, levels of activity, performance or events and circumstances described in the forward-looking statements will be achieved or occur. Neither we, nor any other person, assume responsibility for the accuracy and completeness of the forward-looking statements. We undertake no obligation to publicly update any forward-looking statements for any reason after the date of this report to conform such statements to actual results or to changes in our expectations, except as required by law. Given these risks and uncertainties, readers are cautioned not to place undue reliance on such forward-looking statements.
Unless expressly indicated or the context suggests otherwise, references to GoDaddy, we, us and our refer to GoDaddy Inc. and its consolidated subsidiaries, including Desert Newco, LLC and its subsidiaries (Desert Newco).
Part I.
Item 1. Business
Overview
Our vision is to radically shift the global economy toward independent entrepreneurial ventures. Our mission is to empower entrepreneurs everywhere, making opportunity more inclusive for all. We champion everyday entrepreneurs by empowering them with sage guidance set in seamlessly intuitive experiences to name, create, grow and manage their ventures. We do this all while activating the exponential power of our community at global scale to deliver profitable revenue growth. Our 19.3 million customers are passionate everyday entrepreneurs with vibrant ideas, who are determined to make their way in the world and to transform their ideas into something meaningful.
We are a leading provider of cloud-based solutions, delivering simple, easy-to-use products, services and outcome-driven, personalized guidance to small businesses, individuals, organizations, developers, designers and domain investors. This enables our customers to name their venture, build their website, establish and manage their online marketing, and get branded email. This often starts with the most intimate of brand considerations—their domain name—and expands through our website building, hosting, social media, security, productivity and other services offerings. As our customers grow through their entrepreneurial journey, we provide applications and access to relevant third-party products and platforms helping them connect to their customers and manage and grow their businesses.
What it means to be online has evolved from having a static website to a mobile-ready, responsive website integrated with social channels, search engines, reputation platforms and e-commerce marketplaces. Our customers need to integrate dynamic information across all of the places they engage with their audiences, including things like appointment availability, retail inventory, digital subscriptions and social media presence.
At GoDaddy, we believe our customers should have both great technology and great customer support. Engaging with our customers in a proactive, consultative way helps them knock down the technology hurdles they face, through personalized guidance via phone and digital experiences. Through the thousands of conversations we have with our customers every day, we receive valuable feedback enabling us to continually evolve our products and solutions and respond to their changing needs.
Our people and unique culture have been integral to our success. We live by the same principles that enable our customers' ideas to survive and thrive: hard work, perseverance, conviction, an obsession with customer satisfaction and a belief that no one can do it better. We take responsibility for driving successful outcomes which we believe has been a key factor in enabling our customer and revenue growth. We believe we have one of the most recognized Internet brands in the U.S. and our international awareness continues to rapidly increase as we've entered into new markets.
Our stable and predictable business model is driven by efficient customer acquisition, high customer retention rates and increasing lifetime spend. In each of the five years ended December 31, 2019, our customer retention rate exceeded 85%, and in 2019, our retention rate for customers who had been with us for over three years was approximately 92%. Additionally, as of December 31, 2019, we had 1.3 million customers who each spent more than $500 a year. We believe the breadth and depth of our product offerings and the high quality guidance and responsiveness of our GoDaddy Guides builds strong customer relationships and are key to our high customer retention rate. In 2019, we generated $3,401 million in total bookings, up 12.9% from $3,011 million in 2018, and we generated $2,988 million of revenue, up 12.3% from $2,660 million in 2018.
Our Opportunity and Advantages
Our Opportunity—Empowering the Everyday Entrepreneur
Our customers represent a large and diverse market which we believe is largely underserved by other Internet companies. According to the U.S. Small Business Administration, there were approximately 30.8 million small businesses in 2016. Based on data from the 2016 U.S. Census Bureau and the U.S. Small Business Administration, over 90% of small businesses have fewer than five employees and approximately 25 million, or over 76%, of small businesses were non-employer firms. Furthermore, the Kauffman Index of Entrepreneurial Activity Report estimated that in 2017 there were approximately 540,000 new business owners created each month in the U.S. Around the world, there are more than 500 million micro, small and medium enterprises, according to a study performed by the International Finance Corporation and McKinsey Company (defined as one to 250
employees) worldwide. We believe our addressable market extends beyond small businesses and includes individuals and organizations, such as universities, community organizations, charities and hobbyists.
Our customers are consumers themselves, which makes them keenly aware of the need to have an impactful online presence. While our customers' needs change depending on where they are in their journey, the most common customer needs we serve include:
-
Showing up, looking great**. Our customers want to develop an online presence by finding a name that distinctly identifies their business, hobby or passion. We believe their digital identity includes not just an elegant, mobile-enabled website, but the ability to get found across various search engines, social media platforms and vertical marketplaces. And while our customers' online identities start with creating and managing these points of presence, their identities are amplified through content generation and the ability to engage and transact online with their customers and audience.
-
Getting found in all the right places**. What it means for our customers to be online continues to evolve. Today, having an effective online presence often means having a combination of: (i) a secure and content-rich website viewable from any device; (ii) presence on social media channels (e.g. Instagram, Facebook, WhatsApp and WeChat); (iii) search engines (e.g. Google) and an increasing number of horizontal marketplaces (e.g. Yelp and Eventbrite); (iv) vertical marketplaces (e.g. Zillow, OpenTable and HomeAdvisor); and (v) e-commerce platforms (e.g. Amazon, eBay, Etsy).
-
Interacting with customers as they grow their business.** Our customers need to communicate with their existing customers and find new ones across a landscape that is fragmented in both form and function. They have distinct needs in (i) branded email communication, originating with domain registration and email creation through an email client; (ii) online marketing in a variety of content types and channels; (iii) online commerce with reservation and scheduling, product catalogs and e-commerce and payment processing capabilities; (iv) messaging capabilities across SMS, Facebook Messenger, WhatsApp and others; (v) email marketing for audience engagement; and (vi) telephony, for inbound and outbound voice communication. Surrounding these channels and tactics, our customers also need easy-to-use tools to run their businesses.
-
Technology that is reliable, secure, performant and evolves with their needs.** Our various customer types need a simple platform and set of tools enabling their domain, website, marketing and other solutions to easily work together as their ideas grow and become more complex. The right platform can meet the needs of entrepreneurs, who may not be technologically savvy, and our Partners, who have more complex requirements, as well as all the customers in between that have a range of needs and sophistication. All the while, our customers expect reliable products and want to be confident their digital presence is secure, even as they insert customization that can create vulnerabilities. Our customers work on their ideas whenever and
Showing the first 8K of 65K characters. Open the full section
Item 1A. Risk Factors
Our operations and financial results are subject to various risks and uncertainties, including those described below. The risks and uncertainties described below are not the only ones we face. Additional risks and uncertainties we are unaware of, or which we currently believe are not material, may also become important factors affecting us. If any of the following risks occur, our business, financial condition, operating results and growth prospects could be materially and adversely affected. In that event, the price of our Class A common stock could decline.
Risks Related to Our Business
If we are unable to attract and retain customers and increase sales to new and existing customers, our business and operating results would be harmed.
Our success depends on our ability to attract and retain customers and increase sales to new and existing customers. We derive a substantial portion of our revenue from domains and our hosting and presence products. The rate at which new and existing customers purchase and renew subscriptions to our products depends on a number of factors, including those outside of our control. Although our total customers and revenue have grown rapidly in the past, in recent periods our slower growth rates have reflected the size and scale of our business. We cannot be assured that we will achieve similar growth rates in future periods as our total customers and revenue could decline or grow more slowly than we expect. Our sales could fluctuate or decline as a result of lower demand for domain names, websites and related products, declines in our customers' level of satisfaction with our products and our Customer Care, the timeliness and success of product enhancements and introductions by us and those of our competitors, the pricing offered by us and our competitors, the frequency and severity of any system outages, breaches and technological change. Our revenue has grown historically due in large part to sustained customer growth rates and strong renewal sales of subscriptions to our domain name registration and hosting and presence products. Our future success depends in part on maintaining strong renewal sales. Our costs associated with renewal sales are substantially lower than costs associated with generating revenue from new customers and costs associated with generating sales of additional products to existing customers. Therefore, a reduction in renewals, even if offset by an increase in other revenue, would reduce our operating margins in the near term. Any failure by us to continue to attract new customers or maintain strong renewal sales could have a material adverse effect on our business, growth prospects and operating results. If we are unable to increase sales of additional products, such as personalized email accounts and other business applications products, to new and existing customers, our growth prospects may be harmed.
If we do not successfully develop and market products that anticipate or respond promptly to the needs of our customers, our business and operating results may suffer.
The markets in which we compete are characterized by constant change and innovation, frequent new product and service introductions and evolving industry standards, and we expect them to continue to evolve rapidly. Our historical success has been based on our ability to identify and anticipate customer needs and design products providing entrepreneurs, small businesses and ventures with the tools they need to create, manage and augment their digital identity. To the extent we are not able to continue to identify challenges faced by entrepreneurs, small businesses and ventures and provide products responding in a timely and effective manner to their evolving needs, our business, operating results and financial condition may be adversely affected.
The process of developing new products and technology is complex and uncertain. If we fail to accurately predict customers' changing needs or emerging technological trends, such as artificial intelligence, or if we fail to achieve the benefits expected from our investments in technology, our business could be harmed. These product and technology investments include those we develop internally, such as our "do-it-yourself" website builder Websites + Marketing, our hosting platforms and our security products, those we acquire and develop as a result of acquisitions, such as SmartLine and Website Security, and those related to our partner programs, such as Microsoft. We must continue to commit significant resources to develop our technology in order to maintain our competitive position, and these commitments will be made without knowing whether such investments will result in products our customers will accept. Our new products or product enhancements could fail to attain meaningful customer acceptance for many reasons, including:
-
delays in releasing new products or product enhancements to the market;
-
our failure to accurately predict market demand or customer preferences;
-
defects, errors or failures in product design or performance;
-
negative publicity about product performance or effectiveness, including negative comments on social media;
-
introduction of competing products (or the anticipation thereof) by other market participants;
-
poor business conditions for our customers or poor general macroeconomic conditions;
-
the perceived value of our products or product enhancements relative to their cost; and
-
changing regulatory requirements adversely affecting the products we offer.
There is no assurance we will successfully identify new opportunities, develop and bring new products to market on a timely basis, or that products and technologies developed by others will not render our products or technologies obsolete or noncompetitive, any of which could adversely affect our business and operating results. If our new products or enhancements do not achieve adequate acceptance by our customers, or if our new products do not result in increased sales or subsequent renewals, our competitive position will be impaired, our anticipated revenue growth may not be achieved and the negative impact on our operating results may be particularly acute because of the upfront technology and development, marketing and advertising and other expenses we may incur in connection with new products or enhancements. In addition, we may migrate our customers from a product that we intend to retire to another, substantially similar product. We may experience technical complications during such migration, which could result in a poor customer experience and which could have an adverse impact on our operating results.
Our brand is integral to our success. If we fail to protect or promote our brand, our business and competitive position may be harmed.
Protecting and maintaining awareness of our brand is important to our success, particularly as we seek to attract new customers globally. We have invested, and expect to continue to invest, substantial resources to increase our brand awareness, both generally and in specific geographies and to specific customer groups, such as Partners. We recently launched our new logo, the "Go." There can be no assurance that our brand development strategies, including the "Go," will enhance the recognition of our brand or lead to increased sales. Furthermore, our international branding efforts may prove unsuccessful due to language barriers and cultural differences. If our efforts to protect and promote our brand are not successful, our operating results may be adversely affected. In addition, even if our brand recognition and loyalty increases, our revenue may not increase at a level commensurate with our marketing spend.
A network attack, a security breach or other data security incident could delay or interrupt service to our customers, harm our reputation or subject us to significant liability.
Our operations depend on our ability
Showing the first 8K of 200K characters. Open the full section
Item 1B. Unresolved Staff Comments
None.
Item 2. Properties.
Our corporate headquarters are located in Scottsdale, Arizona and consist of approximately 153,000 square feet of owned office space. We also own our offices in Hiawatha, Iowa, which consist of approximately 75,000 square feet used primarily for Customer Care and product development. We lease additional Customer Care centers and offices located throughout the U.S. as well as internationally in Australia, Bulgaria, China, Germany, India, Norway, Romania, Serbia, Spain and the U.K.
We provide our cloud-based products via a network of data centers including (i) an approximately 320,000 square foot data center we own and operate in Phoenix, Arizona; (ii) co-located data centers located throughout the U.S. in Arizona, California, Missouri, Virginia and New York; and (iii) co-located data centers located internationally in France, Germany, the Netherlands, Singapore and the U.K. Our data center leases expire on various dates through 2033.
We believe our existing facilities are sufficient for our current needs. In the future, we may need to add new facilities and expand our existing facilities as we increase our employee base, grow our infrastructure, further expand our international operations and evolve our business. We believe suitable additional or substitute space will be available on commercially reasonable terms to meet our future needs.
Item 3. Legal Proceedings
The information required by this item is provided in Note 13 to our financial statements included in Part 2, Item 8 of this Form 10-K, and is incorporated herein by reference.
We are currently subject to litigation incidental to our business, including patent infringement litigation and trademark infringement claims, as well as putative class actions, employment, commercial and consumer protection claims and other litigation of a non-material nature. Although the results of any such current or future litigation, regardless of the underlying nature of the claims, cannot be predicted with certainty, the final outcome of any current or future claims or lawsuits we face could adversely affect our business, financial condition and results of operations.
Regardless of the final outcome, defending lawsuits, claims and proceedings in which we are involved is costly and can impose a significant burden on management and employees. We may receive unfavorable preliminary or interim rulings in the course of litigation, and there can be no assurances that favorable final outcomes will be obtained.
Item 4. Mine Safety Disclosures
Not applicable.
Part II.
Item 5. Market for Registrant's Common Equity, Related Stockholder Matters and Issuer Purchases of Equity Securities
Our Class A common stock trades on the NYSE under the symbol "GDDY".
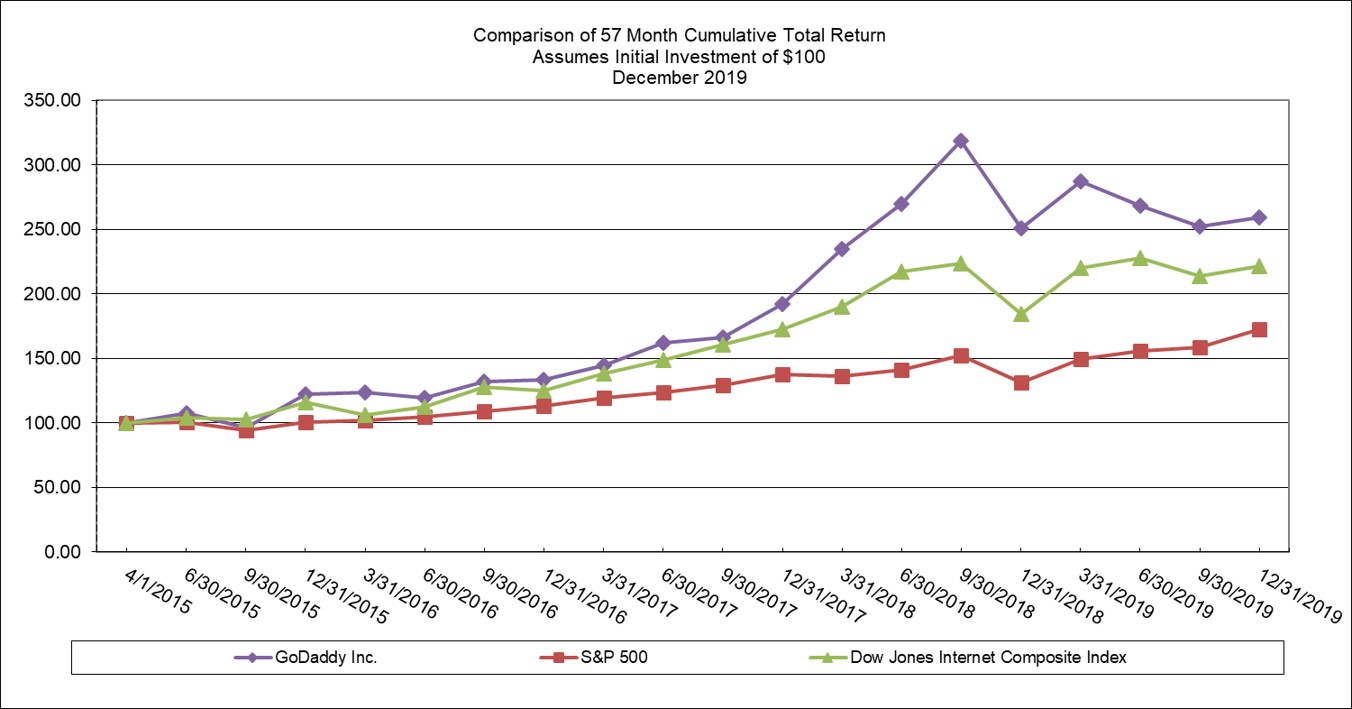
Stock Performance Graph
The following performance graph and related information shall not be deemed to be "soliciting material" or "filed" for purposes of Section 18 of the Exchange Act nor shall such information be incorporated by reference into any filing of GoDaddy Inc. under the Exchange Act or the Securities Act, except to the extent we specifically incorporate it by reference in such filing.
The graph set forth below compares the cumulative total return to stockholders on our Class A common stock relative to the cumulative total returns of the Standard & Poor's 500 Index (the S&P 500) and the Dow Jones Internet Composite Index. An investment of $100 (with reinvestment of all dividends) is assumed to have been made in our Class A common stock and in each index on April 1, 2015, the date our Class A common stock began trading on the NYSE, with relative performance tracked through December 31, 2019. The returns shown are based on historical results and are not intended to suggest future performance.
Holders of Record
As of December 31, 2019, there were 6 holders of record of our Class A common stock, although we believe there are a significantly larger number of beneficial owners of our Class A common stock because many shares are held by brokers and other institutions on behalf of stockholders.
Dividend Policy
We have not paid any dividends on our Class A common stock and do not intend to pay dividends in the foreseeable future. If, however, we decide to pay a dividend in the future, we would need to cause Desert Newco to make distributions to us in an amount sufficient to cover such dividend. If Desert Newco makes such distributions to us, the other holders of LLC Units will be entitled to receive pro rata distributions.
Our ability to pay dividends is limited by the covenants of our debt agreements. See "Management's Discussion and Analysis of Financial Condition and Results of Operations—Liquidity and Capital Resources." In addition, Desert Newco is generally prohibited under Delaware law from making a distribution to unit holders (including us) to the extent that, at the time of the distribution, after giving effect to the distribution, liabilities of Desert Newco (with certain exceptions) exceed the fair value of its assets. Desert Newco's subsidiaries are generally subject to similar legal limitations on their ability to make distributions to Desert Newco.
Share Repurchases
Our board of directors has authorized two share repurchase programs as described in Note 6 to our audited financial statements appearing in "Financial Statements and Supplementary Data." Share repurchase activity during the three months ended December 31, 2019 pursuant to our share repurchase programs was as follows:
| Period | Total Number of Shares Purchased (in thousands) | Average Price Paid Per Share | Total Number of Shares Purchased as Part of Publicly Announced Programs (in thousands) | Approximate Dollar Value of Shares that May Yet be Purchased under the Programs (in millions) | ||||||||||||||||||||||
| October 1 - October 31 | 959 | $ | 61.60 | 959 | ||||||||||||||||||||||
| November 1 - November 30 | — | N/A | — | |||||||||||||||||||||||
| December 1 - December 31 | — | N/A | — | |||||||||||||||||||||||
| Total | 959 | 959 | $ | 541.4 |
Item 6. Selected Financial Data
You should read the following selected financial data in conjunction with "Management's Discussion and Analysis of Financial Condition and Results of Operations" and our financial statements and the related notes appearing in "Financial Statements and Supplementary Data."
We were incorporated in May 2014 and, pursuant to a series of pre-IPO organizational transactions, became a holding company whose principal asset is a controlling equity interest in Desert Newco. We are the sole managing member of Desert Newco, and as a result, we consolidate its financial results and report non-controlling interests representing the economic interests held by its other members. Because our pre-IPO organizational transactions were considered transactions between entities under common control, the financial statements for 2015 have been adjusted to combine the previously separate entities for presentation purposes.
The statements of operations data for the years ended December 31, 2019, 2018 and 2017, and the balance sheets data as of December 31, 2019 and 2018, are derived from our audited financial statements and the related notes appearing in "Financial Statements and Supplementary Data." The statements of operations data for the years ended December 31, 2016 and 2015, and the balance sheets data as of December 31, 2017, 2016 and 2015, are derived from our audited financial statements not included in this Form 10-K. Our historical results are not necessarily indicative of the results to be expected in any future period.
| Year Ended December 31, | |||||||||||||||||||||||||||||||||||||||||||||||||||||||||||||||||
| 2019 | 2018 | 2017 | 2016 | 2015 | |||||||||||||||||||||||||||||||||||||||||||||||||||||||||||||
| Consolidated Statements of Operations Data: | (in millions, except shares in thousands and per share amounts) | ||||||||||||||||||||||||||||||||||||||||||||||||||||||||||||||||
| Total revenue | $ | 2,988.1 | $ | 2,660.1 | $ | 2,231.9 | $ | 1,847.9 | $ | 1,607.3 | |||||||||||||||||||||||||||||||||||||||||||||||||||||||
| Costs and operating expenses(1): | |||||||||||||||||||||||||||||||||||||||||||||||||||||||||||||||||
| Cost of revenue (excluding depreciation and amortization) | 1,026.8 | 893.9 | 775.5 | 657.8 | 565.9 | ||||||||||||||||||||||||||||||||||||||||||||||||||||||||||||
| Technology and development | 492.6 | 434.0 | 355.8 | 287.8 | 270.2 | ||||||||||||||||||||||||||||||||||||||||||||||||||||||||||||
| Marketing and advertising | 345.6 | 291.4 | 253.2 | 228.8 | 202.2 | ||||||||||||||||||||||||||||||||||||||||||||||||||||||||||||
| Customer care | 348.7 | 323.1 | 292.3 | 242.1 | 221.5 | ||||||||||||||||||||||||||||||||||||||||||||||||||||||||||||
| General and administrative | 362.1 | 334.0 | 282.4 | 221.2 | 219.7 | ||||||||||||||||||||||||||||||||||||||||||||||||||||||||||||
| Depreciation and amortization | 209.7 | 234.1 | 205.8 | 160.1 | 158.8 | ||||||||||||||||||||||||||||||||||||||||||||||||||||||||||||
| Total costs and operating expenses | 2,785.5 | 2,510.5 | 2,165.0 | 1,797.8 | 1,638.3 | ||||||||||||||||||||||||||||||||||||||||||||||||||||||||||||
| Operating income (loss) | 202.6 | 149.6 | 66.9 | 50.1 | (31.0) | ||||||||||||||||||||||||||||||||||||||||||||||||||||||||||||
| Interest expense | (92.1) | (98.4) | (83.0) | (57.2) | (69.2) | ||||||||||||||||||||||||||||||||||||||||||||||||||||||||||||
| Loss on debt extinguishment | (14.8) | — | (7.3) | — | (21.4) | ||||||||||||||||||||||||||||||||||||||||||||||||||||||||||||
| Tax receivable agreements liability adjustment | 8.7 | 14.9 | 123.2 | (12.5) | — | ||||||||||||||||||||||||||||||||||||||||||||||||||||||||||||
| Other income (expense), net | 22.0 | 6.9 | 7.0 | (1.9) | 1.0 | ||||||||||||||||||||||||||||||||||||||||||||||||||||||||||||
| Income (loss) from continuing operations before income taxes | 126.4 | 73.0 | 106.8 | (21.5) | (120.6) | ||||||||||||||||||||||||||||||||||||||||||||||||||||||||||||
| Benefit (provision) for income taxes | 12.0 | 9.0 | 18.9 | (0.4) | 0.2 | ||||||||||||||||||||||||||||||||||||||||||||||||||||||||||||
| Income (loss) from continuing operations | 138.4 | 82.0 | 125.7 | (21.9) | (120.4) | ||||||||||||||||||||||||||||||||||||||||||||||||||||||||||||
| Income from discontinued operations, net of income taxes | — | — | 14.1 | — | — | ||||||||||||||||||||||||||||||||||||||||||||||||||||||||||||
| Net income (loss) | 138.4 | 82.0 | 139.8 | (21.9) | (120.4) | ||||||||||||||||||||||||||||||||||||||||||||||||||||||||||||
| Less: net income (loss) attributable to non-controlling interests | 1.4 | 4.9 | 3.4 | (5.4) | (44.8) | ||||||||||||||||||||||||||||||||||||||||||||||||||||||||||||
| Net income (loss) attributable to GoDaddy Inc. | $ | 137.0 | $ | 77.1 | $ | 136.4 | $ | (16.5) | $ | (75.6) | |||||||||||||||||||||||||||||||||||||||||||||||||||||||
| Net income (loss) attributable to GoDaddy Inc. per share of Class A common stock—basic(2): | |||||||||||||||||||||||||||||||||||||||||||||||||||||||||||||||||
| Continuing operations | $ | 0.79 | $ | 0.50 | $ | 1.17 | $ | (0.21) | $ | (0.81) | |||||||||||||||||||||||||||||||||||||||||||||||||||||||
| Discontinued operations | — | — | 0.08 | — | — | ||||||||||||||||||||||||||||||||||||||||||||||||||||||||||||
| Net income (loss) attributable to GoDaddy Inc. | $ | 0.79 | $ | 0.50 | $ | 1.25 | $ | (0.21) | $ | (0.81) | |||||||||||||||||||||||||||||||||||||||||||||||||||||||
| Net income (loss) attributable to GoDaddy Inc. per share of Class A common stock—diluted(2): | |||||||||||||||||||||||||||||||||||||||||||||||||||||||||||||||||
| Continuing operations | $ | 0.76 | $ | 0.45 | $ | 0.71 | $ | (0.21) | $ | (0.81) | |||||||||||||||||||||||||||||||||||||||||||||||||||||||
| Discontinued operations | — | — | 0.08 | — | — | ||||||||||||||||||||||||||||||||||||||||||||||||||||||||||||
| Net income (loss) attributable to GoDaddy Inc. | $ | 0.76 | $ | 0.45 | $ | 0.79 | $ | (0.21) | $ | (0.81) | |||||||||||||||||||||||||||||||||||||||||||||||||||||||
| Weighted-average shares of Class A common stock outstanding(2): | |||||||||||||||||||||||||||||||||||||||||||||||||||||||||||||||||
| Basic | 173,431 | 155,234 | 108,779 | 79,835 | 58,676 | ||||||||||||||||||||||||||||||||||||||||||||||||||||||||||||
| Diluted | 181,721 | 181,353 | 177,054 | 79,835 | 58,676 | ||||||||||||||||||||||||||||||||||||||||||||||||||||||||||||
| ___________________________ | |||||||||||||||||||||||||||||||||||||||||||||||||||||||||||||||||
| (1) Costs and operating expenses include equity-based compensation expense as follows: | |||||||||||||||||||||||||||||||||||||||||||||||||||||||||||||||||
| Cost of revenue | $ | 0.4 | $ | — | $ | — | $ | — | $ | — | |||||||||||||||||||||||||||||||||||||||||||||||||||||||
| Technology and development | 70.3 | 57.8 | 37.1 | 23.2 | 18.2 | ||||||||||||||||||||||||||||||||||||||||||||||||||||||||||||
| Marketing and advertising | 15.4 | 10.3 | 7.3 | 8.1 | 6.1 | ||||||||||||||||||||||||||||||||||||||||||||||||||||||||||||
| Customer care | 9.3 | 6.2 | 3.6 | 3.9 | 2.9 | ||||||||||||||||||||||||||||||||||||||||||||||||||||||||||||
| General and administrative | 51.6 | 51.2 | 28.4 | 21.6 | 13.2 | ||||||||||||||||||||||||||||||||||||||||||||||||||||||||||||
| Total equity-based compensation expense | $ | 147.0 | $ | 125.5 | $ | 76.4 | $ | 56.8 | $ | 40.4 |
(2) Amounts for 2015 have been retrospectively adjusted to give effect to our pre-IPO organizational transactions.
| December 31, | |||||||||||||||||||||||||||||||||||||||||||||||||||||||||||||||||
| 2019 | 2018 | 2017 | 2016 | 2015 | |||||||||||||||||||||||||||||||||||||||||||||||||||||||||||||
| Consolidated Balance Sheets Data: | (in millions) | ||||||||||||||||||||||||||||||||||||||||||||||||||||||||||||||||
| Cash and cash equivalents | $ | 1,062.8 | $ | 932.4 | $ | 582.7 | $ | 566.1 | $ | 348.0 | |||||||||||||||||||||||||||||||||||||||||||||||||||||||
| Prepaid domain name registry fees | 561.9 | 546.8 | 532.3 | 479.1 | 456.3 | ||||||||||||||||||||||||||||||||||||||||||||||||||||||||||||
| Property and equipment, net | 258.6 | 299.0 | 297.9 | 231.0 | 225.0 | ||||||||||||||||||||||||||||||||||||||||||||||||||||||||||||
| Total assets | 6,301.2 | 6,083.4 | 5,738.3 | 3,786.9 | 3,498.8 | ||||||||||||||||||||||||||||||||||||||||||||||||||||||||||||
| Deferred revenue | 2,198.8 | 2,017.5 | 1,861.6 | 1,576.2 | 1,416.2 | ||||||||||||||||||||||||||||||||||||||||||||||||||||||||||||
| Total debt(1) | 2,432.3 | 2,457.3 | 2,482.3 | 1,072.5 | 1,083.5 | ||||||||||||||||||||||||||||||||||||||||||||||||||||||||||||
| Total liabilities | 5,519.1 | 5,258.9 | 5,191.8 | 3,072.7 | 2,817.8 | ||||||||||||||||||||||||||||||||||||||||||||||||||||||||||||
_________________________________
(1) Total debt includes long-term debt, unamortized original issue discount and unamortized debt issuance costs.
Key Metrics
In addition to our results determined in accordance with GAAP, we believe the following operating metrics are useful as supplements in evaluating our ongoing operational performance and help provide an enhanced understanding of our business:
| Year Ended December 31, | |||||||||||||||||||||||||||||||||||||||||||||||||||||||||||||||||
| 2019 | 2018 | 2017 | 2016 | 2015 | |||||||||||||||||||||||||||||||||||||||||||||||||||||||||||||
| (unaudited) | |||||||||||||||||||||||||||||||||||||||||||||||||||||||||||||||||
| Total bookings (in millions) | $ | 3,401.2 | $ | 3,011.5 | $ | 2,618.2 | $ | 2,155.5 | $ | 1,914.2 | |||||||||||||||||||||||||||||||||||||||||||||||||||||||
| Total customers at period end (in thousands) | 19,274 | 18,518 | 17,339 | 14,740 | 13,774 | ||||||||||||||||||||||||||||||||||||||||||||||||||||||||||||
| Average revenue per user | $ | 158 | $ | 148 | $ | 139 | $ | 130 | $ | 121 |
Total bookings. Total bookings represents cash receipts from the sale of products to customers in a given period adjusted for products where we recognize revenue on a net basis and without giving effect to certain adjustments, primarily net refunds granted in the period. Total bookings provides valuable insight into the sales of our products and the performance of our business since we typically collect payment at the time of sale and recognize revenue ratably over the term of our customer contracts. We report total bookings without giving effect to refunds granted in the period because refunds often occur in periods different from the period of sale for reasons unrelated to the marketing efforts leading to the initial sale. Accordingly, by excluding net refunds, we believe total bookings reflects the effectiveness of our sales efforts in a given period.
Total customers. We define a customer as an individual or entity, as of the end of a period, having an account with one or more paid product subscriptions. A single user may be counted as a customer more than once if the user maintains paid subscriptions in multiple accounts. Total customers is one way we measure the scale of our business and is an important part of our ability to increase our revenue base.
Average revenue per user (ARPU). We calculate ARPU as total revenue during the preceding 12 month period divided by the average of the number of total customers at the beginning and end of the period. ARPU provides insight into our ability to sell additional products to customers, though the impact to date has been muted due to our continued growth in total customers.
Reconciliation of Bookings
The following table reconciles total bookings to total revenue, its most directly comparable GAAP financial measure:
| Year Ended December 31, | |||||||||||||||||||||||||||||||||||||||||||||||||||||||||||
| 2019 | 2018 | 2017 | 2016 | 2015 | |||||||||||||||||||||||||||||||||||||||||||||||||||||||
| Total Bookings: | (unaudited; in millions) | ||||||||||||||||||||||||||||||||||||||||||||||||||||||||||
| Total revenue | $ | 2,988.1 | $ | 2,660.1 | $ | 2,231.9 | $ | 1,847.9 | $ | 1,607.3 | |||||||||||||||||||||||||||||||||||||||||||||||||
| Change in deferred revenue(1) | 180.5 | 163.2 | 214.4 | 163.5 | 165.9 | ||||||||||||||||||||||||||||||||||||||||||||||||||||||
| Net refunds | 233.4 | 192.6 | 170.0 | 141.9 | 137.8 | ||||||||||||||||||||||||||||||||||||||||||||||||||||||
| Other | (0.8) | (4.4) | 1.9 | 2.2 | 3.2 | ||||||||||||||||||||||||||||||||||||||||||||||||||||||
| Total bookings | $ | 3,401.2 | $ | 3,011.5 | $ | 2,618.2 | $ | 2,155.5 | $ | 1,914.2 |
_________________________________
(1) Change in deferred revenue also includes the impact of realized gains or losses from the hedging of bookings in foreign currencies.
Item 7. Management's Discussion and Analysis of Financial Condition and Results of Operations
The following discussion and analysis of our financial condition and results of operations should be read together with our audited financial statements and related notes included in "Financial Statements and Supplementary Data." Some of the information contained in this discussion and analysis, including information with respect to our plans and strategies for our business, includes forward-looking statements involving significant risks and uncertainties. As a result of many factors, such as those set forth in "Risk Factors," our actual results may differ materially from the results described in, or implied by, these forward-looking statements.
This section of the Form 10-K generally discusses 2019 and 2018 items and year-to-year comparisons between 2019 and 2018. Discussions of 2017 items and year-to-year comparisons between 2018 and 2017 that are not included in this Form 10-K can be found in "Management's Discussion and Analysis of Financial Condition and Results of Operations" in Part II, Item 7 of our Annual Report on Form 10-K for the year ended December 31, 2018, and are incorporated by reference herein and considered part of this Form 10-K only to the extent referenced.
(Throughout this discussion and analysis, dollars are in millions, excluding ARPU, and shares are in thousands.)
Overview
We are the global market leader in domain registration. Securing a domain is usually the first step to creating a digital identity and our domain products can often serve as the starting point in our customer relationships. As of December 31, 2019, approximately 90% of our customers had purchased a domain from us and we had 79.6 million domains under management. Based on information reported in VeriSign's Domain Name Industry Brief, we had over 22% of the world's domains registered as of September 30, 2019.
We also offer hosting, presence and business applications products and services (products) enhancing our value proposition to our customers by enabling them to create, manage and syndicate their digital identities. While these products are often purchased in conjunction with, or subsequent to, an initial domain registration, they may also be the starting points in our customer relationships. As we have grown, our hosting, presence and business applications products have become increasingly important parts of our business, constituting approximately 55% of total revenue in 2019.
Financial Highlights
Below are our key financial highlights for 2019, with comparisons to 2018.
-
Total revenue of $2,988.1 million, an increase of 12.3%, or approximately 13.7% on a constant currency basis(1).
-
International revenue of $1,008.5 million, an increase of 7.7%, or approximately 11.4% on a constant currency basis(1).
-
Total bookings(2) of $3,401.2 million, an increase of 12.9%, or approximately 14.3% on a constant currency basis(1).
-
Net income of $138.4 million.
-
Total customers increased 4.1% to 19.3 million.
-
ARPU increased 6.6% to $158.
-
Net cash provided by operating activities of $723.4 million, an increase of 29.2%.
(1) Discussion of constant currency is set forth in "Quantitative and Qualitative Disclosures about Market Risk."
(2) A reconciliation of total bookings to total revenue, its most directly comparable GAAP financial measure, is set forth in "Selected Financial Data—Reconciliation of Bookings."
Our Financial Model
We have developed a stable and predictable business model driven by efficient customer acquisition, high customer retention rates and increasing lifetime spend. We grew our total customers from 17.3 million as of December 31, 2017 to 19.3 million as of December 31, 2019, through a combination of our industry leading products built on a single cloud platform, brand advertising, direct marketing efforts, customer referrals and world-class customer care. In each of the five years ended December 31, 2019, our customer retention rate exceeded 85%, and in 2019, our retention rate for customers who had been with us for over three years was approximately 92%. We believe the breadth and depth of our product offerings and the high quality and responsiveness of our Customer Care team build strong relationships with our customers and are key to our high level of customer retention.
We generate bookings and revenue from sales of product subscriptions, including domain products, hosting and presence products and business applications, as described below. We offer our product subscriptions on a variety of terms, which average one year, but can range from monthly to multi-annual terms of up to ten years depending on the product. We monitor total bookings as we typically collect payment at the time of sale and recognize revenue ratably over the term of our customer contracts. Accordingly, we believe total bookings is an indicator of the expected growth in our revenue and the operating performance of our business. See "Selected Financial Data—Reconciliation of Bookings" for a reconciliation of total revenue to total bookings.
Domains. We generated 45% of our 2019 total revenue from the sale of domain products, primarily from domain registrations and renewals, domain add-ons such as privacy and aftermarket sales. Total revenue from domain products grew at a CAGR of 13.4% over the three years ended December 31, 2019.
Hosting and Presence. We generated 38% of our 2019 total revenue from the sale of hosting and presence products, primarily from a variety of website hosting products, website building products, security products and e-commerce products. These products generally have higher margins than conventional domain registrations. Total revenue from hosting and presence products grew at a CAGR of 18.4% over the three years ended December 31, 2019.
Business Applications. We generated 17% of our 2019 total revenue from the sale of business applications products, primarily from productivity tools such as domain-specific email accounts, which generally also have higher margins than conventional domain registrations. Total revenue from business applications products grew at a CAGR of 28.3% over the three years ended December 31, 2019.
Revenue derived from each of our product categories has increased in each of the last three years, with our hosting, presence and business applications products growing faster in recent periods. This mix shift has favorably impacted our margins.
In each of the five years ended December 31, 2019, greater than 85% of our total revenue, excluding the impact of purchase accounting, was generated by customers who were also customers in the prior year. To track our growth and the stability of our customer base, we monitor, among other things, revenue, retention rates and ARPU generated by our annual customer cohorts over time, as well as corresponding marketing and advertising spend. We define an annual customer cohort to include each customer who first became a customer during a calendar year. For example, in 2014, we acquired 2.9 million customers, who we collectively refer to as our 2014 cohort, and spent $165 million in marketing and advertising expenses. By the end of 2019, the 2014 cohort had generated an aggregate of $1,266 million of total bookings and we expect this cohort will continue to generate bookings and revenue in the future. For the five years ended December 31, 2019, the average annual bookings retention rate of the 2014 cohort was approximately 93%. To calculate a cohort's bookings retention rate, we compare the number of active customers within a specific cohort as of the end of the current year to the number of customers that were in the cohort in the year of acquisition. Over this period, ARPU, excluding the impact of purchase accounting, for the 2014 cohort grew from $79 in 2015 to $163 in 2019, representing a CAGR of 20%. We selected the 2014 cohort for this analysis because we believe it is representative of the spending patterns and revenue impact of ou
Showing the first 8K of 77K characters. Open the full section
Item 7A. Quantitative and Qualitative Disclosures About Market Risk
We are exposed to market risk in the ordinary course of business. Market risk represents the risk of loss that may impact our financial position due to adverse changes in financial market prices and rates. Our market risk exposure is primarily a result of fluctuations in foreign currency exchange rates and variable interest rates. Consequently, we may employ policies and procedures to mitigate such risks, including the use of derivative financial instruments, which are discussed in more detail in Note 11 to our financial statements. We do not enter into derivative transactions for speculative or trading purposes.
As a result of the use of derivative instruments, we are exposed to the risk that counterparties to our contracts may fail to meet their contractual obligations. To mitigate such counterparty credit risk, we enter into contracts only with carefully selected financial institutions based upon ongoing evaluations of their creditworthiness. As a result, we do not believe we are exposed to any undue concentration of counterparty risk with respect to our derivative contracts as of December 31, 2019.
Foreign Currency Risk
We manage our exposure to changes in foreign currency exchange rates through the use of foreign exchange forward contracts and cross-currency swap contracts. See Note 11 to our financial statements for a summary of the notional amounts and fair values of such arrangements.
Foreign Exchange Forward Contracts
A portion of our bookings, revenue and operating expenses is denominated in foreign currencies, which are subject to exchange rate fluctuations. Our most significant foreign currency exposures are the Euro, the British pound, the Canadian dollar, the Australian dollar and the Indian Rupee. Our reported bookings, revenues and operating results may be impacted by fluctuations in foreign currency exchange rates. Fluctuations in exchange rates may also cause us to recognize transaction gains and losses in our statements of operations; however, to date, such amounts have not been material. As our international operations continue to grow, our exposure to fluctuations in exchange rates will increase, which may increase the costs associated with this growth. During 2019, our total bookings growth in constant currency would have been approximately 140 basis points higher and our total revenue growth would have been approximately 140 basis points higher. Constant currency is calculated by translating bookings and revenue for each month in the current period using the foreign currency exchange rate for the corresponding month in the prior period, excluding any hedging gains or losses realized during the period.
From time-to-time, we may utilize foreign exchange forward contracts to manage the volatility of our bookings and revenue related to foreign currency transactions. These forward contracts reduce, but do not eliminate, the impact of adverse currency exchange rate fluctuations. We generally designate these forward contracts as cash flow hedges for accounting purposes. Changes in the intrinsic value of designated hedges are recorded as a component of accumulated other comprehensive income (loss) (AOCI). Gains and losses, once realized, are recorded as a component of AOCI and are amortized to revenue over the same period in which the underlying hedged amounts are recognized. At December 31, 2019, the realized and unrealized gain (loss) included in AOCI related to designated hedges was not material.
Cross-Currency Swap Contract
In order to manage variability due to movements in foreign currency rates related to a Euro-denominated intercompany loan, we entered into a five-year cross-currency swap arrangement (the Cross-Currency Swap) in April 2017. The Cross-Currency Swap, which matures on April 3, 2022, had a notional amount of €1,209.1 million at December 31, 2019 and converts the fixed rate Euro-denominated interest and principal receipts on the intercompany loan into fixed U.S. dollar interest and principal receipts, thereby reducing our exposure to fluctuations between the Euro and the U.S. dollar. The Cross-Currency Swap is designated as a cash flow hedge and recognized as an asset or liability at fair value. Changes to the fair value of our Cross-Currency Swap due to changes in the value of the U.S. dollar relative to the Euro would be largely offset by the net change in the fair values of the underlying hedged items.
Interest Rate Sensitivity
Interest rate risk reflects our exposure to movements in interest rates associated with our variable-rate debt. Total borrowings under our term loans were $1,832.3 million as of December 31, 2019. Borrowings under these loans bear interest at a rate equal to, at our option, either (a) LIBOR plus 1.75% per annum or (b) 0.75% per annum plus the highest of (i) the Federal Funds Rate plus 0.5%, (ii) the Prime Rate or (iii) one-month LIBOR plus 1.0%. See Note 10 to our financial statements for additional information regarding the term loans.
In April 2017, we entered into a five-year pay-fixed rate, receive-floating rate interest rate swap arrangement to effectively convert a portion of the variable-rate debt to fixed. The interest rate swap, the notional amount of which was $1,289.0 million at December 31, 2019, matures on April 3, 2022 and swaps the variable interest rate on our LIBOR-based borrowings for a fixed rate of 5.44%. The objective of the interest rate swap, which is designated as a cash flow hedge, is to manage the variability of cash flows in the interest payments related to the portion of the variable-rate debt designated as being hedged.
For the balance of our long-term debt not subject to the interest rate swap, the effect of a hypothetical 10% change in interest rates would not have had a material impact on our interest expense.
Item 8. Financial Statements and Supplementary Data
Report of Independent Registered Public Accounting Firm
To the Stockholders and the Board of Directors of GoDaddy Inc.
Opinion on the Financial Statements
We have audited the accompanying consolidated balance sheets of GoDaddy Inc. (the Company) as of December 31, 2019 and 2018, and the related consolidated statements of operations, comprehensive income, stockholders' equity, and cash flows for each of the three years in the period ended December 31, 2019, and the related notes (collectively referred to as the "financial statements"). In our opinion, the financial statements present fairly, in all material respects, the consolidated financial position of the Company at December 31, 2019 and 2018, and the consolidated results of its operations and its cash flows for each of the three years in the period ended December 31, 2019, in conformity with U.S. generally accepted accounting principles.
We also have audited, in accordance with the standards of the Public Company Accounting Oversight Board (United States) (PCAOB), the Company's internal control over financial reporting as of December 31, 2019, based on criteria established in Internal Control-Integrated Framework issued by the Committee of Sponsoring Organizations of the Treadway Commission (2013 framework) and our report dated February 20, 2020 expressed an unqualified opinion thereon.
Basis for Opinion
These financial statements are the responsibility of the Company's management. Our responsibility is to express an opinion on the Company's financial statements based on our audits. We are a public accounting firm registered with the PCAOB and are required to be independent with respect to the Company in accordance with the U.S. federal securities laws and the applicable rules and regulations of the Securities and Exchange Commission and the PCAOB.
We conducted our audits in accordance with the standards of the PCAOB. Those standards require that we plan and perform the audit to obtain reasonable assurance about whether the financial statements are free of material misstatement, whether due to error or fraud. Our audits included performing procedures to assess the risks of material misstatement of the financial statements, whether due to error or fraud, and performing procedures that respond to those risks. Such procedures included examining, on a test basis, evidence regarding the amounts and disclosures in the financial statements. Our audits also included evaluating the accounting principles used and significant estimates made by management, as well as evaluating the overall presentation of the financial statements. We believe that our audits provide a reasonable basis for our opinion.
Critical Audit Matters
The critical audit matters communicated below are matters arising from the current period audit of the financial statements that were communicated or required to be communicated to the audit committee and that: (1) relate to accounts or disclosures that are material to the financial statements and (2) involved especially challenging, subjective or complex judgments. The communication of critical audit matters does not alter in any way our opinion on the consolidated financial statements, taken as a whole, and we are not, by communicating the critical audit matters below, providing separate opinions on the critical audit matters or on the accounts or disclosures to which they relate.
| Payable to Related Parties Pursuant to Tax Receivable Agreements | ||||||||
| Description of the Matter | As discussed in Notes 2 and 16 of the December 31, 2019 consolidated financial statements, the Company has recorded a $175.3 million liability, payable to counterparties pursuant to Tax Receivable Agreements (TRA). The TRA liability represents the amount the Company estimates to pay to the counterparties to the TRA that are former owners of the Company (pre-IPO owners). The liability is computed as 85% of the estimated cash tax savings to be received by the Company from utilizing the positive tax attributes contributed by pre-IPO owners. Auditing the TRA liability computation each period is a complex process as a result of the assumptions and management judgement utilized in the determination of the expected cash tax savings to be realized. In particular, estimated future taxable income can be sensitive to changes in the assumed revenue growth rate and expected operating margin, which are affected by expectations about future market conditions and are inherently uncertain due to their forward-looking nature. |
| How We Addressed the Matter in Our Audit | We tested controls that address the risks of material misstatement relating to the measurement of the TRA liability. For example, we tested controls over management's review of the sensitivity of the projections of future taxable income to the recorded TRA liability. Our audit procedures included, among others, independent recalculations of the recorded liability. We also evaluated management's estimates used in developing a forecast of future taxable income. For example, we compared the projections of future taxable income with the actual results of prior periods, as well as management's consideration of current industry and economic trends. We also compared the projections of future taxable income with other forecasted financial information prepared by the Company. | |||||||
| Legal Contingencies | ||||||||
| Description of the Matter | As described in Note 13 to the consolidated financial statements, the Company accrues for losses and defense costs related to legal contingencies at the time a loss is probable, and the amount of loss can be reasonably estimated. At December 31, 2019, the Company's legal liability reserve balance included $18.1 million, relating primarily to a single legal matter. The Company believes there is a range of estimated losses with respect to this matter, with $35.0 million representing the high end of the range. Auditing management's accounting for and disclosure of loss contingencies related to the primary legal matter in which a loss was determined to be probable was challenging due to the significant judgment required to develop the key assumptions utilized to measure the liability and the nature of information available given the early stages of the settlement process and the limited historical information available. | |||||||
| How We Addressed the Matter in Our Audit | We tested controls that address the risks of material misstatement relating to legal contingencies. For example, we tested controls over management's review of the model used to estimate the probable loss and potential range of loss, as well as significant assumptions utilized. We also tested management's controls over the completeness and accuracy of the data consumed. Our aud |
Showing the first 8K of 205K characters. Open the full section
Item 9. Changes in and Disagreements with Accountants on Accounting and Financial Disclosure
None.
Item 9A. Controls and Procedures
Evaluation of Disclosure Controls and Procedures
Our management, with the participation of our Chief Executive Officer (CEO) and our Chief Financial Officer (CFO), evaluated the effectiveness of our disclosure controls and procedures pursuant to Rule 13a-15 under the Securities Exchange Act of 1934, as amended (the Exchange Act), as of the end of the period covered by this Annual Report on Form 10-K.
Based on this evaluation, our CEO and CFO concluded that, as of December 31, 2019, our disclosure controls and procedures are designed at a reasonable assurance level and are effective to provide reasonable assurance that information we are required to disclose in reports we file or submit under the Exchange Act is recorded, processed, summarized and reported within the time periods specified in the SEC's rules and forms, and that such information is accumulated and communicated to our management, including our CEO and CFO, as appropriate, to allow timely decisions regarding required disclosure.
Changes in Internal Control Over Financial Reporting
No changes in our internal control over financial reporting occurred during the quarter ended December 31, 2019 that materially affected, or which are reasonably likely to materially affect, our internal control over financial reporting.
Limitations on Effectiveness of Controls and Procedures
In designing and evaluating the disclosure controls and procedures, management recognizes that any controls and procedures, no matter how well designed and operated, can provide only reasonable assurance of achieving the desired control objectives. In addition, the design of disclosure controls and procedures must reflect the fact that there are resource constraints and management is required to apply its judgment in evaluating the benefits of possible controls and procedures relative to their costs.
Management's Report on Internal Control over Financial Reporting
Our management is responsible for establishing and maintaining adequate internal control over financial reporting (as defined in Rule 13a-15(f) of the Exchange Act). Our management assessed the effectiveness of our internal control over financial reporting as of December 31, 2019. In making this assessment, our management used the criteria set forth by the Committee of Sponsoring Organizations of the Treadway Commission in Internal Control—Integrated Framework (2013 framework). Based on our assessment under this framework, our management concluded that our internal control over financial reporting was effective as of December 31, 2019. The effectiveness of our internal control over financial reporting as of December 31, 2019 has been audited by Ernst & Young LLP, an independent registered public accounting firm, as stated in their report included herein.
Report of Independent Registered Public Accounting Firm
To the Stockholders and the Board of Directors of GoDaddy Inc.
Opinion on Internal Control over Financial Reporting
We have audited GoDaddy Inc.'s internal control over financial reporting as of December 31, 2019, based on criteria established in Internal Control-Integrated Framework issued by the Committee of Sponsoring Organizations of the Treadway Commission (2013 framework) (the COSO criteria). In our opinion, GoDaddy Inc. (the Company) maintained, in all material respects, effective internal control over financial reporting as of December 31, 2019, based on the COSO criteria.
We also have audited, in accordance with the standards of the Public Company Accounting Oversight Board (United States) (PCAOB), the 2019 consolidated financial statements of the Company and our report dated February 20, 2020 expressed an unqualified opinion thereon.
Basis for Opinion
The Company's management is responsible for maintaining effective internal control over financial reporting and for its assessment of the effectiveness of internal control over financial reporting included in the accompanying Management's Report on Internal Control Over Financial Reporting. Our responsibility is to express an opinion on the Company's internal control over financial reporting based on our audit. We are a public accounting firm registered with the PCAOB and are required to be independent with respect to the Company in accordance with the U.S. federal securities laws and the applicable rules and regulations of the Securities and Exchange Commission and the PCAOB.
We conducted our audit in accordance with the standards of the PCAOB. Those standards require that we plan and perform the audit to obtain reasonable assurance about whether effective internal control over financial reporting was maintained in all material respects.
Our audit included obtaining an understanding of internal control over financial reporting, assessing the risk that a material weakness exists, testing and evaluating the design and operating effectiveness of internal control based on the assessed risk, and performing such other procedures as we considered necessary in the circumstances. We believe that our audit provides a reasonable basis for our opinion.
Definition and Limitations of Internal Control Over Financial Reporting
A company's internal control over financial reporting is a process designed to provide reasonable assurance regarding the reliability of financial reporting and the preparation of financial statements for external purposes in accordance with generally accepted accounting principles. A company's internal control over financial reporting includes those policies and procedures that (1) pertain to the maintenance of records that, in reasonable detail, accurately and fairly reflect the transactions and dispositions of the assets of the company; (2) provide reasonable assurance that transactions are recorded as necessary to permit preparation of financial statements in accordance with generally accepted accounting principles, and that receipts and expenditures of the company are being made only in accordance with authorizations of management and directors of the company; and (3) provide reasonable assurance regarding prevention or timely detection of unauthorized acquisition, use, or disposition of the company's assets that could have a material effect on the financial statements.
Because of its inherent limitations, internal control over financial reporting may not prevent or detect misstatements. Also, projections of any evaluation of effectiveness to future periods are subject to the risk that controls may become inadequate because of changes in conditions, or that the degree of compliance with the policies or procedures may deteriorate.
/s/ Ernst & Young LLP
Phoenix, Arizona
February 20, 2020
Item 9B. Other Information
None.
Part III.
Item 10. Directors, Executive Officers and Corporate Governance
The information required by this item will be included in our Proxy Statement for the 2020 Annual Meeting of Stockholders to be filed with the SEC within 120 days of the year ended December 31, 2019 (the 2020 Proxy Statement) and is incorporated herein by reference. The information required by this item regarding delinquent filers pursuant to Item 405 of Regulation S-K will be included under the caption "Delinquent Section 16(a) Reports" in the 2020 Proxy Statement and is incorporated herein by reference.
Code of Ethics
We have adopted a Code of Business Conduct and Ethics applicable to all of our employees, executive officers and directors. Our Code of Business Conduct and Ethics is available on our website in the Investor Relations section under the menu entry: Governance/Governance Documents (https://aboutus.godaddy.net/investor-relations/governance/default.aspx). To the extent mandated by legal requirements, we intend to disclose on our website any amendments to our Code of Business Conduct and Ethics, or any waivers of its requirements.
Item 11. Executive Compensation
The information required by this item will be included in the 2020 Proxy Statement and is incorporated herein by reference.
Item 12. Security Ownership of Certain Beneficial Owners and Management and Related Stockholder Matters
The information required by this item will be included in the 2020 Proxy Statement and is incorporated herein by reference.
Item 13. Certain Relationships and Related Transactions, and Director Independence
The information required by this item will be included in the 2020 Proxy Statement and is incorporated herein by reference.
Item 14. Principal Accounting Fees and Services
The information required by this item will be included in the 2020 Proxy Statement and is incorporated herein by reference.
Part IV.
Item 15. Exhibits, Financial Statement Schedules
We have filed the following documents as part of this Annual Report on Form 10-K:
Financial Statements
Our financial statements are listed in the "Index to Consolidated Financial Statements" under Item 8 "Financial Statements and Supplementary Data."
Financial Statement Schedules
All other schedules have been omitted because they are either not required, not applicable or the required information is otherwise included.
Exhibit Index
| + | Indicates management contract or compensatory plan or arrangement. | |||||||
| # | Schedules and exhibits have been omitted pursuant to Item 601(b)(2) of Regulation S-K. GoDaddy Inc. agrees to furnish supplementally to the SEC a copy of any omitted schedule or exhibit upon request. | |||||||
| ***** | Filed herewith. | |||||||
| ****** | The certifications attached as Exhibit 32.1 accompanying this Annual Report on Form 10-K, are deemed furnished and not filed with the Securities and Exchange Commission and are not to be incorporated by reference into any filing of GoDaddy Inc. under the Securities Act of 1933, as amended, or the Securities Exchange Act of 1934, as amended, whether made before or after the date of this Annual Report on Form 10-K, irrespective of any general incorporation language contained in such filing. |
Item 16. Form 10-K Summary
None.
SIGNATURES
Pursuant to the requirements of Section 13 or 15(d) of the Securities Exchange Act of 1934, the registrant has duly caused this report to be signed on its behalf by the undersigned, thereunto duly authorized.
| GODADDY INC. | ||||||||
| Date: | February 20, 2020 | /s/ Aman Bhutani | ||||||
| Aman Bhutani Chief Executive Officer |
POWER OF ATTORNEY
Each person whose signature appears below constitutes and appoints Aman Bhutani and Ray E. Winborne, and each of them, as his or her true and lawful attorney-in-fact and agent, with full power of substitution and resubstitution, for him or her and in his or her name, place and stead, in any and all capacities, to sign any and all amendments to this Annual Report on Form 10-K, and to file the same, with all exhibits thereto, and other documents in connection therewith, with the Securities and Exchange Commission, granting unto said attorneys-in-fact and agents, and each of them, full power and authority to do and perform each and every act and thing requisite and necessary to be done in connection therewith, as fully to all intents and purposes as he or she might or could do in person, hereby ratifying and confirming all that said attorneys-in-fact and agents, or any of them, or their or his substitutes, may lawfully do or cause to be done by virtue thereof.
Pursuant to the requirements of the Securities Exchange Act of 1934, this report has been signed below by the following persons on behalf of the registrant and in the capacities and on the dates indicated:
| Signature | Title | Date | ||||||||||||||||||
| /s/ Aman Bhutani | Chief Executive Officer and Director (Principal Executive Officer) | February 20, 2020 | ||||||||||||||||||
| Aman Bhutani | ||||||||||||||||||||
| /s/ Ray E. Winborne | Chief Financial Officer (Principal Financial Officer) | February 20, 2020 | ||||||||||||||||||
| Ray E. Winborne | ||||||||||||||||||||
| /s/ Nick Daddario | Chief Accounting Officer (Principal Accounting Officer) | February 20, 2020 | ||||||||||||||||||
| Nick Daddario | ||||||||||||||||||||
| /s/ Charles J. Robel | Chairman of the Board of Directors | February 20, 2020 | ||||||||||||||||||
| Charles J. Robel | ||||||||||||||||||||
| /s/ Herald Y. Chen | Director | February 20, 2020 | ||||||||||||||||||
| Herald Y. Chen | ||||||||||||||||||||
| /s/ Caroline F. Donahue | Director | February 20, 2020 | ||||||||||||||||||
| Caroline F. Donahue | ||||||||||||||||||||
| /s/ Mark Garrett | Director | February 20, 2020 | ||||||||||||||||||
| Mark Garrett | ||||||||||||||||||||
| /s/ Ryan Roslansky | Director | February 20, 2020 | ||||||||||||||||||
| Ryan Roslansky | ||||||||||||||||||||
| /s/ Brian H. Sharples | Director | February 20, 2020 | ||||||||||||||||||
| Brian H. Sharples | ||||||||||||||||||||
| /s/ Leah Sweet | Director | February 20, 2020 | ||||||||||||||||||
| Leah Sweet | ||||||||||||||||||||
| /s/ Lee E. Wittlinger | Director | February 20, 2020 | ||||||||||||||||||
| Lee E. Wittlinger |