 filings.tools
Gen Digital 10-K 2016-04-01
Filed 2016-05-20. 21 sections, 340K characters. Original on sec.gov · Markdown · JSON
Cover and table of contents
10-K 1 symc4116-10k.htm 10-K
UNITED STATES SECURITIES AND EXCHANGE COMMISSION
Washington, D.C. 20549
Form 10-K
(Mark One)
| þ | ANNUAL REPORT PURSUANT TO SECTION 13 OR 15(d) OF THE SECURITIES EXCHANGE ACT OF 1934 |
For the Fiscal Year Ended April 1, 2016
or
| o | TRANSITION REPORT PURSUANT TO SECTION 13 OR 15(d) OF THE SECURITIES EXCHANGE ACT OF 1934 |
For the Transition Period from to
Commission File Number 000-17781
Symantec Corporation
(Exact name of the registrant as specified in its charter)
| Delaware | 77-0181864 | |
| (State or other jurisdiction of incorporation or organization) | (I.R.S. employer Identification no.) | |
| 350 Ellis Street, | ||
| Mountain View, California | 94043 | |
| (Address of principal executive offices) | (zip code) |
Registrant’s telephone number, including area code:
(650) 527-8000
Securities registered pursuant to Section 12(b) of the Act:
| Common Stock, par value $0.01 per share (Title of each class) | The NASDAQ Stock Market LLC (Name of each exchange on which registered) |
Securities registered pursuant to Section 12(g) of the Act:
None
(Title of class)
Indicate by check mark if the registrant is a well-known seasoned issuer, as defined in Rule 405 of the Securities Act. Yes þ No o
Indicate by check mark if the registrant is not required to file reports pursuant to Section 13 or 15(d) of the Exchange Act. Yes o No þ
Indicate by check mark whether the registrant (1) has filed all reports required to be filed by Section 13 or 15(d) of the Securities Exchange Act of 1934 during the preceding 12 months (or for such shorter period that the registrant was required to file such reports), and (2) has been subject to such filing requirements for the past 90 days. Yes þ No o
Indicate by check mark whether the registrant has submitted electronically and posted on its corporate Web site, if any, every Interactive Data File required to be submitted and posted pursuant to Rule 405 of Regulation S-T (§ 232.405 of this chapter) during the preceding 12 months (or for such shorter period that the registrant was required to submit and post such files). Yes þ No o
Indicate by check mark if disclosure of delinquent filers pursuant to Item 405 of Regulation S-K is not contained herein, and will not be contained, to the best of registrant’s knowledge, in definitive proxy or information statements incorporated by reference in Part III of this Form 10-K or any amendment to this Form 10-K. þ
Indicate by check mark whether the registrant is a large accelerated filer, an accelerated filer, a non-accelerated filer, or a smaller reporting company. See the definitions of “large accelerated filer,” “accelerated filer” and “smaller reporting company” in Rule 12b-2 of the Exchange Act. (Check one):
| Large accelerated filer þ | Accelerated filer o | Non-accelerated filer o | Smaller reporting company o | |||
| (Do not check if a smaller reporting company) |
Indicate by check mark whether the registrant is a shell company (as defined in Rule 12b-2 of the Exchange Act). Yes o No þ
Aggregate market value of the voting stock held by non-affiliates of the registrant, based upon the closing sale price of Symantec common stock on October 2, 2015 as reported on the NASDAQ Global Select Market: $13,338,113,735.
Number of shares outstanding of the registrant’s common stock as of April 29, 2016: 612,292,085
DOCUMENTS INCORPORATED BY REFERENCE
The information called for by Part III will be included in an amendment to this Form 10-K or incorporated by reference from the registrant’s definitive Proxy Statement to be filed pursuant to Regulation 14A.
SYMANTEC CORPORATION
FORM 10-K
For the Fiscal Year Ended April 1, 2016
TABLE OF CONTENTS
“Symantec,” “we,” “us,” “our,” and “the Company” refer to Symantec Corporation and all of its subsidiaries. Symantec, the Symantec Logo and Norton are trademarks or registered trademarks of Symantec in the United States (“U.S.”) and other countries. Other names may be trademarks of their respective owners.
FORWARD-LOOKING STATEMENTS AND FACTORS THAT MAY AFFECT FUTURE RESULTS
The discussion below contains forward-looking statements, which are subject to safe harbors under the Securities Act of 1933, as amended (the “Securities Act”) and the Exchange Act of 1934, as amended (the “Exchange Act”). Forward-looking statements include references to our ability to utilize our deferred tax assets, as well as statements including words such as “expects,” “plans,” “anticipates,” “believes,” “estimates,” “predicts,” “projects,” and similar expressions. In addition, projections of our future financial performance, anticipated growth and trends in our businesses and in our industries, the anticipated impacts of acquisitions, our intent to pay quarterly cash dividends in the future, the actions we intend to take as part of our new strategy, the expected impact of our new strategy and other characterizations of future events or circumstances are forward-looking statements. These statements are only predictions, based on our current expectations about future events and may not prove to be accurate. We do not undertake any obligation to update these forward-looking statements to reflect events occurring or circumstances arising after the date of this report. These forward-looking statements involve risks and uncertainties, and our actual results, performance, or achievements could differ materially from those expressed or implied by the forward-looking statements on the basis of several factors, including those that we discuss under Item 1A, Risk Factors. We encourage you to read that section carefully.
PART I
Item 1. Business
Overview
Symantec Corporation is a global leader in security. We operate our business on a global civilian cyber intelligence threat network and track a vast number of threats across the Internet from hundreds of millions of mobile devices, endpoints, and servers across the globe. We believe one of our competitive advantages is our database of threat indicators which allows us to reduce the number of false positives and provide faster and better protection for customers through our products. Through the delivery of new and enhanced solutions, we are integrating our security offerings across our portfolio. We are also developing novel solutions in growing markets like cloud, advanced threat protection, information protection and cyber security services. Founded in 1982, Symantec has operations in more than 35 countries and our principal executive offices are located at 350 Ellis Street, Mountain View, California, 94043. Our Internet home page is located at www.symantec.com.
Strategy
Our security strategy is to deliver a unified security analytics platform that provides big data analytics, utilizes our vast telemetry, provides visibility into real-time global threats, and powers Symantec and third-party security analytics applications; leverage this analytics platform to provide best-in-class consumer and enterprise security products; and offer cyber security services that provide a full-suite of services from monitoring to incident response to threat intelligence, all supported by over 500 cyber security experts and nine global security response centers.
During fiscal 2016, we executed on our five priorities: running our business with a portfolio approach by managing certain businesses for operating margin; prioritizing investments for growth; further reducing costs and improving efficiencies; attracting top talent to our executive team; and continuing to return significant cash to stockholders.
After closing the divestiture of our information management business ("Veritas"), as the world leader in cybersecurity, we are more focused than ever on the following priorities: delivering upon our Unified Security strategy, building our enterprise security pipeline and go-to-market capabilities, improving our cost structure, and fulfilling our commitment to allocate capital to our stockholders.
Divestiture of Veritas
In August 2015, we entered into a definitive agreement to sell the assets of Veritas to The Carlyle Group and certain co-investors ("Carlyle"). The transaction closed on January 29, 2016, at which time, we received net consideration of $6.6 billion in cash, excluding transaction costs, and 40 million B common shares of Veritas and Veritas assumed certain liabilities. We now have two reporting segments, Consumer Security and Enterprise Security.
Business highlights
During fiscal 2016, we took the following actions in support of our business:
| • | We completed the divestiture of Veritas and refocused Symantec as a pure cybersecurity company. |
| • | We launched our SecureOne channel partner program designed specifically to help security-focused partners grow their businesses. |
| • | In Enterprise Security, Symantec Endpoint Protection won AV-TEST’s “Best Protection 2015 Award” for corporate users. |
| • | In Consumer Security, Norton Security won AV-TEST’s coveted “Best Protection Award 2015” for “home user” security. |
| • | We released new products and services: |
| ◦ | We launched Advanced Threat Protection endpoint, email, and network solutions, which detect and remediate advanced threats across control points, from a single console with just a click, without deployment of new endpoint agents. |
| ◦ | We launched Encryption Everywhere, a website security package available through web hosting providers that integrates encryption into websites from the moment they are created. |
| • | We completed a $500 million strategic investment by Silver Lake Partners and in connection with this investment, Kenneth Hao joined our Board of Directors. |
| • | We increased our capital return program to $5.5 billion, including a $2.6 billion special dividend that was paid in March 2016 and a total of $1.5 billion in accelerated share repurchase ("ASR") transactions that were announced in November 2015 and March 2016. |
Operating segments and products
Our operating segments are significant strategic business units that offer different products and services distinguished by customer needs. The two reporting segments, which are the same as our operating segments, are: Consumer Security and Enterprise Security.
Consumer Security
Our Consumer Security segment focuses on making it simple for customers to be productive and protected at home and at work. Our Norton-branded services provide multi-layer security and identity protection on major desktop and mobile operating systems, to defend against increasingly complex online threats to individuals, families, and small businesses.
Our Norton Security products help customers protect against increasingly complex threats and address the need for identity protection, while also managing the rapid increase in mobile and digital data, such as personal financial records, photos, music, and videos.
Enterprise Security
Our Enterprise Security segment protects organizations so they can securely conduct business while leveraging new platforms and data. Our Enterprise Security segment includes our threat protection products, information protection products, cyber security services, and website security offerings, previously named trust services.
These products and services help our customers secure their information in transit and wherever it resides in the network path, from the user’s device to the data’s resting place. These products protect customer data from sophisticated threats such as advanced protection threats, malicious spam and phishing attacks, malware, drive-by website infections, hackers, and cyber criminals. In addition, these products help to prevent the loss of confidential data by insiders, and help customers achieve and maintain compliance with laws and regulations. Our enterprise endpoint security and management offerings support the evolving endpoint, providing advanced threat protection while helping reduce cost and complexity. These solutions are delivered through various methods, such as software, appliance, Software-as-a-Service ("SaaS"), and managed services.
Financial information by segment and geographic region
For information regarding our revenue by segment, revenue by geographical area, and property and equipment by geographical area, see Note 8 of the Notes to Consolidated Financial Statements in this annual report. For information regarding the amount and percentage of our revenue contributed by each of our segments and our financial information, including information about geographic areas in which we operate, see Item 7, Management’s Discussion and Analysis of Financial Condition and Results of Operations. For information regarding risks associated with our international operations, see Item 1A, Risk Factors.
Sales and go-to-market strategy
Our go-to-market network includes direct sales forces and broad e-commerce capabilities, as well as indirect sales resources that support our global partner ecosystem. We also maintain important relationships with a number of original equipment manufacturers (“OEMs”), Internet service providers (“ISPs”), and retail and online stores through which we market and sell our products.
Our dedicated renewals team remains focused on extending customer relationships and renewing customer contracts with us. We also continued to streamline our indirect sales strategy to have fewer, more focused partners with specialized partner programs to enhance sales. We believe these changes provide customers with a high-quality sales and post-sales support experience, while also enabling us to expand our business.
Consumer
We sell and market our consumer products and services to individuals, households and small businesses globally. We bring these products to market through our e-commerce platform, distributors, direct marketers, Internet-based resellers, system builders, ISPs, wireless carriers, and retailers worldwide. We also maintain a limited number of partnerships with OEMs globally to distribute our Internet security and online backup offerings.
Commercial
We sell and market our products and related services to small, medium and large customers through field sales and inside sales forces that leverage indirect sales partners around the world that are specifically trained and certified to sell our solutions. These partners include national solution providers, regional solution providers, national account resellers, global/federal system integrators and managed service providers. Our products and services are also available on our e-commerce platform, as well as through authorized distributors and OEMs who incorporate our technologies into their products, bundle our products with their offerings, or serve as authorized resellers of our products.
Enterprise
We sell and market our products and related services to large enterprises, including government and public sector customers, through our field sales force. This field sales team is responsible for leveraging our global partner ecosystem primarily targeting senior executives and IT department personnel responsible for managing a company’s highest-order IT initiatives.
Research and development
Symantec embraces a global research and development strategy to drive organic innovation. Our engineers and researchers are focused on delivering new versions of existing product lines as well as developing entirely new offerings to drive the company’s leadership in cybersecurity. We also have a technology research organization focused on short, medium, and longer-term applied research projects, with the goal of transferring completed innovations into our product groups for commercialization.
Symantec’s Security Technology and Response organization consists of a global team of security engineers, threat analysts, and researchers that provide the underlying functionality, content, and support for many of our consumer, commercial and enterprise security products. Our security experts analyze threat telemetry collected through Symantec’s massive global sensor network, one of the largest cyber intelligence networks in the world, to protect our customers against current and emerging threats. Our research and development teams also leverage this vast amount of data and related insights to develop new technologies and approaches, including our Unified Security analytics platform, in order to improve security outcomes for our customers.
Research and development expenses were $748 million, $812 million, and $722 million in fiscal 2016, 2015, and 2014, respectively, representing approximately 21%, 21% and 17% of revenue in fiscal 2016, 2015 and 2014, respectively. The percentage fluctuates between periods as a result of a variety of factors, including changes in sales level and foreign currency exchange rates. We believe that technical leadership is essential to our success, and we expect to continue to commit substantial resources to research and development.
Support
Symantec has support facilities throughout the world, staffed by technical product experts knowledgeable in the operating environments in which our products are deployed. Our technical support experts assist customers with issue resolution and threat detection.
We provide consumers with various levels of support offerings. Consumers receive automatic downloads of the latest virus definitions, application bug fixes, and patches for most of our consumer products. Our consumer support program provides self-help online services and phone, chat, and email support to consumers worldwide. In addition, our Norton Security products come with a “Virus Protection Promise,” which in some markets provides free virus removal services to customers whose protected computers become infected.
We provide customers various levels of enterprise support offerings. Our enterprise security support program offers annual maintenance support contracts, including content, upgrades, and technical support. Our standard technical support includes: self-service options delivered by telephone or electronically during the contracted-for hours, immediate patches for severe problems, periodic software updates, and access to our technical knowledge base and frequently asked questions.
Significant customers
In each of fiscal 2016, 2015 and 2014, no customer accounted for more than 10% of our total net revenues. One distributor accounted for 10% of our gross accounts receivable as of April 1, 2016.
Acquisitions
Our strategy will be complemented by business combinations that fit strategically and meet specific profitability hurdles. Our acquisitions are designed to enhance the features and functionality of our existing products and extend our product leadership in core markets. We consider time-to-market, synergies with existing products, and potential market share gains when evaluating the economics of acquisitions of technologies, product lines, or companies. We may acquire or dispose of other technologies, products, and companies in the future.
We did not make any material acquisitions during fiscal 2016.
Competition
Our markets are consolidating, highly competitive, and subject to rapid changes in technology. The competitive landscape has changed significantly over the past few years, with new competition arising. Much of the market growth has come from startups whose focus is on solving a specific customer issue or delivering a niche-oriented product and from larger integration providers that increasingly are looking to put various types of protection into their platforms. We are focused on delivering comprehensive customer solutions, integrating across our broad product portfolio and partnering with other technology providers to differentiate ourselves from the competition. We believe that the principal competitive factors necessary to be successful in our industry include product quality and effectiveness, time-to-market, price, reputation, financial stability, breadth of product offerings, customer support, brand recognition, and effective sales and marketing efforts.
In addition to the competition we face from direct competitors, we face indirect or potential competition from retailers, application providers, operating system providers, network equipment manufacturers, and other OEMs who may provide various solutions and functions in their current and future products. We also compete for access to retail distribution channels and for spending at the retail level and in corporate accounts. In addition, we compete with other software companies, operating system providers, network equipment manufacturers, and other OEMs to acquire technologies, products, or companies and to publish software developed by third parties. We also compete with other software companies in our effort to place our products on the computer equipment sold to consumers and enterprises by OEMs.
Most of the channels in which our products are offered are highly competitive. Some of our consumer competitors are intensely focused on customer acquisition, which has led competitors to offer their technology for free, engage in aggressive marketing, or enter into competitive partnerships. Our primary security competitors are Intel Corporation, Microsoft Corporation (“Microsoft”), and Trend Micro Inc. There are also several freeware providers and regional security companies that we compete against. For our consumer backup offerings, our primary competitors are Carbonite, Inc. and EMC Corporation. In the Secure Socket Layer Certificate market, our primary competitors are Comodo Group, Inc. and GoDaddy.com, Inc. In the SaaS security market, our primary competitors are Proofpoint and Microsoft. Our primary competitors in the managed security services business are SecureWorks Corporation and IBM Corporation.
Intellectual property
Protective measures
We regard some of the features of our internal operations, software, and documentation as proprietary and rely on copyright, patent, trademark and trade secret laws, confidentiality procedures, contractual arrangements, and other measures to protect our proprietary information. Our intellectual property is an important and valuable asset that enables us to gain recognition for our products, services, and technology and enhance our competitive position.
As part of our confidentiality procedures, we generally enter into non-disclosure agreements with our employees, distributors, and corporate partners and we enter into license agreements with respect to our software, documentation, and other proprietary information. These license agreements are generally non-transferable and have either a perpetual or subscription based time limited term. We also educate our employees on trade secret protection and employ measures to protect our facilities, equipment, and networks.
Trademarks, patents, copyrights, and licenses
Symantec and the Symantec logo are trademarks or registered trademarks in the U.S. and other countries. In addition to Symantec and the Symantec logo, we have used, registered, or applied to register other specific trademarks and service marks to help distinguish our products, technologies, and services from those of our competitors in the U.S. and foreign countries and jurisdictions. We enforce our trademark, service mark, and trade name rights in the U.S. and abroad. The duration of our trademark registrations varies from country to country, and in the U.S. we generally are able to maintain our trademark rights and renew any trademark registrations for as long as the trademarks are in use.
We have more than 1,700 patents, in addition to foreign patents and pending U.S. and foreign patent applications, which relate to various aspects of our products and technology. The duration of our patents is determined by the laws of the country of issuance and for the U.S. is typically 17 years from the date of issuance of the patent or 20 years from the date of filing of the patent application resulting in the patent, which we believe is adequate relative to the expected lives of our products.
Our products are protected under U.S. and international copyright laws and laws related to the protection of intellectual property and proprietary information. We take measures to label such products with the appropriate proprietary rights notices, and we actively enforce such rights in the U.S. and abroad. However, these measures may not provide sufficient protection, and our intellectual property rights may be challenged. In addition, we license some intellectual property from third parties for use in our products, and generally must rely on the third party to protect the licensed intellectual property rights. While we believe that our ability to maintain and protect our intellectual property rights is important to our success, we also believe that our business as a whole is not materially dependent on any particular patent, trademark, license, or other intellectual property right.
Seasonality
As is typical for many large technology companies, our business is seasonal. Orders are generally higher in our third and fourth fiscal quarters and lower in our first and second fiscal quarters. Revenue generally reflects similar seasonal patterns but to a lesser extent than orders because revenue is not recognized until an order is shipped or services are performed and other revenue recognition criteria are met, and because a significant portion of our in-period revenue comes from our deferred revenue balance.
Employees
As of April 1, 2016, we employed more than 11,000 people worldwide, approximately 46% of whom reside in the U.S. Approximately 3,000 employees work in sales and marketing, 4,000 in research and development, 2,000 in support and services, and 2,000 in management and administration.
Available information
Our Internet home page is located at www.symantec.com. We make available free of charge our annual reports on Form 10-K, quarterly reports on Form 10-Q, current reports on Form 8-K, and amendments to those reports as soon as reasonably practicable after we electronically file such material with the Securities and Exchange Commission (“SEC”) on our investor relations website located at www.symantec.com/invest. The information contained, or referred to, on our website is not part of this annual report unless expressly noted. The SEC maintains a website that contains reports, proxy and information statements, and other information regarding our filings at http://www.sec.gov. In addition, you may read and copy any filing that we make with the SEC at the public reference room maintained by the SEC, located at 100 F Street, N.E., Washington, D.C. 20549. Please call the SEC at 1-800-SEC-0330 for further information about the public reference room.
Item 1A. Risk Factors
A description of the risk factors associated with our business is set forth below. The list is not exhaustive and you should carefully consider these risks and uncertainties before investing in our common stock.
If we are unsuccessful at addressing our business challenges, our business and results of operations may be adversely affected and our ability to invest in and grow our business could be limited.
For the last few years, we have experienced a number of transitions as we have attempted to revitalize our business model, improve execution and innovate new products and services. These transitions have involved significant turnover in management and other key personnel, changes in our strategic direction and, more recently, the divestiture of Veritas. Transitions of the magnitude we have experienced and are experiencing can be disruptive, result in loss of institutional focus and employee morale and make the execution of business strategies more difficult. We are also focused on addressing dynamic and accelerating market trends, such as the continued decline in the PC market, the market shifts towards mobility, the transition towards cloud-based solutions and architectural shifts in the provision of security, all of which has made it more difficult for us to compete effectively and requires us to improve our product and service offerings. We may experience delays in the anticipated timing of activities related to our efforts to address these challenges and higher than expected or unanticipated execution costs. In addition, we are vulnerable to increased risks associated with these efforts and the broad range of geographic regions in which we and our customers and partners operate. If we do not succeed in these efforts, or if these efforts are more costly or time-consuming than expected, our business and results of operations may be adversely affected, which could limit our ability to invest in and grow our business.
We may not achieve the intended benefits of the divestiture of Veritas.
On January 29, 2016, we completed the divestiture of Veritas, however, we may not realize some or all of the anticipated benefits from the transaction. The resource constraints as a result of our prior focus on completing the transaction which included the loss of employees could have a continuing impact on the execution of our business strategy and our overall operating results. Additionally, in connection with the divestiture, our Board of Directors committed to returning the proceeds of the sale of Veritas to stockholders in the form of a capital return program, which included the payment of a special dividend in March 2016, entry into multiple share accelerated transactions, and continued repurchases under current and future share repurchase programs. The use of proceeds in this manner could impair the Company’s future financial growth.
Fluctuations in demand for our products and services are driven by many factors, and a decrease in demand for our products could adversely affect our financial results.
We are subject to fluctuations in demand for our products and services due to a variety of factors, including market transitions, general economic conditions, competition, product obsolescence, technological change, shifts in buying patterns, financial difficulties and budget constraints of our current and potential customers, awareness of security threats to IT systems and other factors. While such factors may, in some periods, increase product sales, fluctuations in demand can also negatively impact our product sales. If demand for our products and solutions declines, whether due to general economic conditions or a shift in buying patterns, our revenues and margins would likely be adversely affected.
Our business depends on customers renewing their arrangements for maintenance, subscriptions, managed security services and SaaS offerings.
A large portion of our revenue is derived from arrangements for maintenance, subscriptions, managed security services and SaaS offerings, yet existing customers have no contractual obligation to purchase additional solutions after the initial subscription or contract period. Our customers’ renewal rates may decline or fluctuate as a result of a number of factors, including their level of satisfaction with our solutions or our customer support, customer budgets and the pricing of our solutions compared with the solutions offered by our competitors, any of which may cause our revenue to grow more slowly than expected, if at all. Accordingly, we must invest significant time and resources in providing ongoing value to our customers. If these efforts fail, or if our customers do not renew for other reasons, or if they renew on terms less favorable to us, our revenue may decline and our business will suffer.
Any cost reduction initiatives that we undertake may not deliver the results we expect, and these actions may adversely affect our business.
In May 2016 we announced a fiscal 2017 restructuring plan to be achieved by the end of fiscal 2018. This initiative could result in disruptions to our operations. Any cost-cutting measures could also negatively impact our business by delaying the introduction of new products or technologies, interrupting service of additional products, or impacting employee retention. In addition, we cannot be sure that the cost reduction and streamlining initiatives will be as successful in reducing our overall expenses as we expect or that additional costs will not offset any such reductions or streamlining. If our operating costs are higher than we expect or if we do not maintain adequate control of our costs and expenses, our results of operations will suffer.
If we are unable to develop new and enhanced products and services that achieve widespread market acceptance, or if we are unable to continually improve the performance, features, and reliability of our existing products and services or adapt our business model to keep pace with industry trends, our business and operating results could be adversely affected.
Our future success depends on our ability to respond to the rapidly changing needs of our customers by developing or introducing new products, product upgrades and services on a timely basis. We have in the past incurred, and will continue to incur, significant research and development expenses as we strive to remain competitive. Additionally, we must continually address the challenges of dynamic and accelerating market trends, such as the emergence of advanced persistent threats in the security space, the continued decline in the PC market and the market shift towards mobility and the increasing transition towards cloud-based solutions, all of which have made it more difficult for us to compete effectively. Customers may require features and capabilities that our current solutions do not have. Our failure to develop solutions that satisfy customer preferences in a timely and cost-effective manner may harm our ability to renew our subscriptions with existing customers and to create or increase demand for our solutions and may adversely impact our operating results. New product development and introduction involves a significant commitment of time and resources and is subject to a number of risks and challenges including:
| • | Managing the length of the development cycle for new products and product enhancements, which has frequently been longer than we originally expected; |
| • | Adapting to emerging and evolving industry standards and to technological developments by our competitors and customers; |
| • | Extending the operation of our products and services to new and evolving platforms, operating systems and hardware products, such as mobile devices; |
| • | Entering into new or unproven markets with which we have limited experience; |
| • | Managing new product an |
Showing the first 8K of 68K characters. Open the full section
Item 1B. Unresolved Staff Comments
None.
Item 2. Properties
Our properties consist primarily of owned and leased office facilities for sales, research and development, administrative, customer service, and technical support personnel. Our corporate headquarters is located in Mountain View, California where we occupy facilities totaling approximately 793,000 square feet, of which 723,000 square feet is owned and 70,000 square feet is leased. We also lease an additional 67,000 square feet in the San Francisco Bay Area. Our leased facilities are occupied under agreements that expire on various dates through fiscal 2026. The following table presents the approximate square footage of our facilities as of April 1, 2016:
| Approximate Total Square Footage (1) | |||||
| Owned | Leased | ||||
| (In thousands) | |||||
| Americas (U.S., Canada and Latin America) | 1,512 | 539 | |||
| EMEA (Europe, Middle East and Africa) | 177 | 318 | |||
| APJ (Asia Pacific and Japan) | — | 1,044 | |||
| Total | 1,689 | 1,901 |
| (1) | Included in the total square footage above are vacant and available-for-lease properties totaling approximately 80,000 square feet. Total square footage excludes approximately 766,000 square feet relating to facilities subleased to third parties. |
We believe that our existing facilities are adequate for our current needs and that the productive capacity of our facilities is substantially utilized.
Item 3. Legal Proceedings
Information with respect to this Item may be found under the heading “Litigation Contingencies” in Note 7 of the Notes to Consolidated Financial Statements in this annual report which information is incorporated into this Item 3 by reference.
Item 4. Mine Safety Disclosures
Not applicable.
PART II
Item 5. Market for Registrant’s Common Equity, Related Stockholder Matters and Issuer Purchases of Equity Securities
Price Range of Common Stock
Our common stock is traded on the NASDAQ Global Select Market under the symbol “SYMC.” The high and low closing sales prices set forth below are as reported on the NASDAQ Global Select Market during each quarter of the two most recent fiscal years. During the fourth quarter of fiscal 2016, we paid a special dividend of $4.00 per share, resulting in a substantial decline in the sales price of our common stock on March 4, 2016.
| 2016 | 2015 | ||||||||||||||||||||||||||||||
| Fourth Quarter | Third Quarter | Second Quarter | First Quarter | Fourth Quarter | Third Quarter | Second Quarter | First Quarter | ||||||||||||||||||||||||
| High | $ | 20.88 | $ | 21.37 | $ | 23.47 | $ | 25.90 | $ | 26.69 | $ | 26.58 | $ | 24.77 | $ | 23.04 | |||||||||||||||
| Low | $ | 16.62 | $ | 19.50 | $ | 19.33 | $ | 23.03 | $ | 23.28 | $ | 21.94 | $ | 22.42 | $ | 19.97 |
Stockholders
As of April 1, 2016, there were 1,849 stockholders of record.
Dividends
During fiscal 2016, 2015 and 2014, we declared and paid aggregate cash dividends of $3.0 billion or $4.60 per common share, $413 million or $0.60 per common share, and $418 million or $0.60 per common share, respectively. Dividends declared and paid each quarter during fiscal 2016, 2015 and 2014 were $0.15 per share. Additionally, a special dividend of $4.00 per share was declared and paid in the fourth quarter of fiscal 2016. Our restricted stock and performance-based stock units have dividend equivalent rights entitling holders to dividend equivalents to be paid in the form of cash upon vesting, for each share of the underlying units. On May 12, 2016, we declared a cash dividend of $0.075 per share of common stock to be paid on June 22, 2016, to all stockholders of record as of the close of business on June 8, 2016. All future dividends and dividend equivalents are subject to the approval of our Board of Directors.
Repurchases of our equity securities
Through our stock repurchase programs we have repurchased shares on a quarterly basis since the fourth quarter of fiscal 2004. Under these programs, shares may be repurchased on the open market and through ASR transactions.
In November 2015, we entered into an ASR transaction with a financial institution to repurchase $500 million of our common stock. In January 2016, the purchase period for this ASR ended and we received an additional 5.0 million shares of our common stock. The total shares received and retired under the terms of this ASR transaction were 24.9 million, with an average price paid per share of $20.08.
In March 2016, we entered into multiple ASR transactions with financial institutions to repurchase an aggregate of $1 billion of our common stock. In exchange for an up-front payment of $1 billion, the financial institutions committed to deliver shares during the purchase period for these ASRs, which will end in or before the third quarter of fiscal 2017. During the fourth quarter of fiscal 2016, 42.4 million shares were delivered and retired under these ASRs, and the final number of shares to be delivered and the average price paid per share will be determined at the conclusion of the purchase period.
The maximum dollar value of shares that may yet be purchased under the plans or programs is $790 million. See Note 9 of our Notes to Consolidated Financial Statements for additional information regarding our stock repurchase programs.
Stock performance graph
This performance graph shall not be deemed “filed” for purposes of Section 18 of the Exchange Act or otherwise subject to the liabilities under that Section, and shall not be deemed to be incorporated by reference into any filing of Symantec under the Securities Act or the Exchange Act.
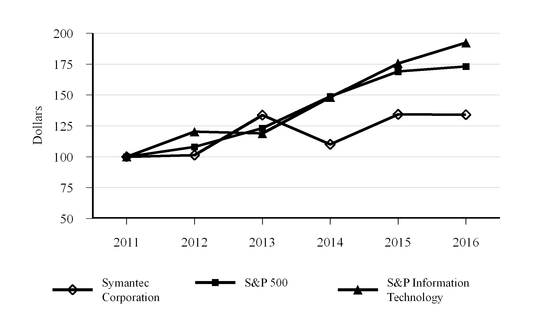
The graph below compares the cumulative total stockholder return on our common stock with the cumulative total return on the S&P 500 Composite Index and the S&P Information Technology Index for the five years ended April 1, 2016 (assuming the investment of $100 in our common stock and in each of the other indices on the last day of trading for fiscal 2011, and the reinvestment of all dividends). The comparisons in the graph below are based on historical data and are not intended to forecast the possible future performance of our common stock.
COMPARISON OF FIVE-YEAR CUMULATIVE TOTAL RETURN
Among Symantec Corporation, the S&P 500 Index
and the S&P Information Technology Index
| 2011 | 2012 | 2013 | 2014 | 2015 | 2016 | ||||||||||||||||||
| Symantec Corporation | $ | 100.00 | $ | 101.30 | $ | 133.69 | $ | 110.03 | $ | 134.25 | $ | 134.02 | |||||||||||
| S&P 500 | $ | 100.00 | $ | 108.00 | $ | 123.08 | $ | 148.80 | $ | 169.03 | $ | 173.18 | |||||||||||
| S&P Information Technology | $ | 100.00 | $ | 120.31 | $ | 118.96 | $ | 148.18 | $ | 175.60 | $ | 192.33 |
Item 6. Selected Financial Data
The following selected consolidated financial data is derived from our Consolidated Financial Statements. This data should be read in conjunction with our Consolidated Financial Statements and related notes included in this annual report and with Item 7. Management’s Discussion and Analysis of Financial Condition and Results of Operations, and Note 3 of the Notes to Consolidated Financial Statements in this annual report. Historical results may not be indicative of future results.
Five-Year Summary
| Summary of operations: | Year Ended (1) | |||||||||||||||||||
| April 1, 2016 | April 3, 2015 | March 28, 2014 | March 29, 2013 | March 30, 2012 | ||||||||||||||||
| (In millions, except per share data) | ||||||||||||||||||||
| Net revenues | $ | 3,600 | $ | 3,956 | $ | 4,183 | $ | 4,268 | $ | 4,175 | ||||||||||
| Operating income (loss) | 457 | 154 | 144 | (60 | ) | (50 | ) | |||||||||||||
| Income (loss) from continuing operations (2) | (821 | ) | 109 | 91 | (138 | ) | 123 | |||||||||||||
| Income from discontinued operations, net of income taxes (3) | 3,309 | 769 | 807 | 893 | 1,064 | |||||||||||||||
| Net income (4) | 2,488 | 878 | 898 | 755 | 1,187 | |||||||||||||||
| Income (loss) per share - basic: (5) | ||||||||||||||||||||
| Continuing operations | $ | (1.23 | ) | $ | 0.16 | $ | 0.13 | $ | (0.20 | ) | $ | 0.17 | ||||||||
| Discontinued operations | $ | 4.94 | $ | 1.12 | $ | 1.16 | $ | 1.27 | $ | 1.44 | ||||||||||
| Net income per share - basic | $ | 3.71 | $ | 1.27 | $ | 1.29 | $ | 1.08 | $ | 1.60 | ||||||||||
| Income (loss) per share - diluted: (5) | ||||||||||||||||||||
| Continuing operations | $ | (1.23 | ) | $ | 0.16 | $ | 0.13 | $ | (0.20 | ) | $ | 0.16 | ||||||||
| Discontinued operations | $ | 4.94 | $ | 1.10 | $ | 1.15 | $ | 1.27 | $ | 1.42 | ||||||||||
| Net income per share - diluted | $ | 3.71 | $ | 1.26 | $ | 1.28 | $ | 1.08 | $ | 1.59 | ||||||||||
| Weighted-average shares outstanding: | ||||||||||||||||||||
| Basic | 670 | 689 | 696 | 701 | 741 | |||||||||||||||
| Diluted | 670 | 696 | 704 | 701 | 748 | |||||||||||||||
| Cash dividends declared per common share | $ | 4.60 | $ | 0.60 | $ | 0.60 | $ | — | $ | — |
| Consolidated Balance Sheets Data: | ||||||||||||||||||||
| April 1, 2016 | April 3, 2015 | March 28, 2014 | March 29, 2013 | March 30, 2012 | ||||||||||||||||
| (In millions) | ||||||||||||||||||||
| Total assets | $ | 11,767 | $ | 13,233 | $ | 13,539 | $ | 14,508 | $ | 13,158 | ||||||||||
| Long-term obligations (6) (7) | 2,207 | 1,746 | 2,095 | 2,094 | 2,039 | |||||||||||||||
| Total stockholders’ equity (8) | 3,676 | 5,935 | 5,797 | 5,476 | 5,237 |
| (1) | We have a 52/53-week fiscal year. Our fiscal 2015 was a 53-week year whereas fiscal 2016, 2014, 2013, and 2012, each consisted of 52 weeks. |
| (2) | In fiscal 2016, the Company recorded $1.1 billion in income tax expense related to unremitted earnings of foreign subsidiaries from the proceeds of the sale of Veritas. This charge is presented in loss from continuing operations in the Consolidated Statements of Operations for fiscal 2016. See Note 11 of the Notes to Consolidated Financial Statements in this annual report for more information. |
| (3) | In fiscal 2016, the Company sold the assets of Veritas to Carlyle for a net gain of $3.0 billion, which is presented as part of income from discontinued operations, net of income taxes in the Consolidated Statements of Operations for fiscal 2016. |
| (4) | In fiscal 2012, we sold our ownership interest in a joint venture for $530 million in cash. The net gain of $526 million, offset by costs to sell the joint venture of $4 million, was included in gain from sale of joint venture in our fiscal 2012 Consolidated Statements of Operations. |
| (5) | Net income per share amounts may not add due to rounding. |
| (6) | On June 15, 2013, the principal balance on the Company's 1.00% Convertible Senior Notes matured and was settled by a cash payment of $1 billion. At the time of issuance of the 1.00% notes, we granted warrants to affiliates of certain initial purchasers of the notes whereby they had the option to purchase up to 52.7 million shares of our common stock. All the warrants expired unexercised during the second quarter of fiscal 2014. In the fourth quarter of fiscal 2016, we issued $500 million in principal amount of 2.50% Convertible Senior Notes, due in April of 2021. See Note 5 of the Notes to Consolidated Financial Statements in this annual report for more information on the Company's long-term obligations. |
| (7) | During the second quarter of fiscal 2016, the principal balance on the Company's 2.75% Senior Notes due September 15, 2015, matured and was settled by a cash payment of $350 million. See Note 5 of the Notes to Consolidated Financial Statements in this annual report for more information. |
| (8) | Includes noncontrolling interest in subsidiary of $78 million in fiscal 2012. |
Item 7. Management’s Discussion and Analysis of Financial Condition and Results of Operations
OVERVIEW
Our business
Symantec Corporation is a global leader in security. We operate our business on a global civilian cyber intelligence threat network and track a vast number of threats across the Internet from hundreds of millions of mobile devices, endpoints, and servers across the globe. We believe one of our competitive advantages is our database of threat indicators which allows us to reduce the number of false positives and provide faster and better protection for customers through our products. Through the delivery of new and enhanced solutions, we are integrating our security offerings across our portfolio. We are also developing novel solutions in growing markets like cloud, advanced threat protection, information protection and cyber security services. Founded in 1982, Symantec has operations in more than 35 countries and our principal executive offices are located at 350 Ellis Street, Mountain View, California, 94043.
Fiscal calendar
We have a 52/53-week fiscal year ending on the Friday closest to March 31. Unless otherwise stated, references to years in this report relate to fiscal year and periods ended April 1, 2016, April 3, 2015 and March 28, 2014. Our fiscal 2016 and 2014 were 52-week years whereas our fiscal 2015 was a 53-week year.
Strategy
Our security strategy is to deliver a unified security analytics platform that provides big data analytics, utilizes our vast telemetry, provides visibility into real-time global threats, and powers Symantec and third-party security analytics applications; leverage this analytics platform to provide best-in-class consumer and enterprise security products; and offer cyber security services that provide a full-suite of services from monitoring to incident response to threat intelligence, all supported by over 500 cyber security experts and nine global security response centers.
After closing the divestiture of Veritas, as the world leader in cybersecurity, we are more focused than ever on the following priorities: delivering upon our Unified Security strategy, building our enterprise security pipeline and go-to-market capabilities, improving our cost structure, and fulfilling our commitment to allocate capital to our stockholders.
Divestiture of Veritas
In August 2015, we entered into a definitive agreement to sell the assets of Veritas to Carlyle and amended the terms in January 2016. Based on the amended terms of the definitive agreement, we received net consideration of $6.6 billion in cash, excluding transaction costs, and 40 million B common shares of Veritas and Veritas assumed certain liabilities in connection with the acquisition. The transaction closed on January 29, 2016. The disposition resulted in a net gain of $3.0 billion, which is presented as part of income from discontinued operations, net of income taxes in the Consolidated Statements of Operations for fiscal 2016. See Note 6 of the Notes to Consolidated Financial Statements for more information on severance, facilities and separation costs related to our fiscal 2015 plans to separate our security and information management businesses.
The results of Veritas are presented as discontinued operations in our Consolidated Statements of Operations and thus have been excluded from continuing operations and segment results for all reported periods. Furthermore, Veritas' assets and liabilities were removed from our Consolidated Balance Sheet upon consummation of its sale on January 29, 2016, and have been classified as discontinued operations on our Consolidated Balance Sheet as of April 3, 2015. Accordingly, the following discussion reflects our current segment reporting structure, which was reduced from three to two segments, and segment results for all reported periods have been adjusted to conform to the current segment structure. In addition, the following discussion relates to our continuing operations unless stated otherwise.
Our operating segments
Our operating segments are significant strategic business units that offer different products and services distinguished by customer needs. The two reporting segments, which are the same as our operating segments, are:
| • | Consumer Security: Our Consumer Security segment focuses on making it simple for customers to be productive and protected at home and at work. Our Norton-branded services provide multi-layer security and identity protection on major desktop and mobile operating systems, to defend against increasingly complex online threats to individuals, families, and small businesses. |
| • | Enterprise Security: Our Enterprise Security segment protects organizations so they can securely conduct business while leveraging new platforms and data. Our Enterprise Security segment includes our threat protection products, information protection products, cyber security services, and website security offerings, previously named trust services. |
For further description of our operating segments see Note 8 of the Notes to Consolidated Financial Statements in this annual report.
Financial results and trends
The following table provides an overview of key financial metrics for each of the last three fiscal years:
| 2016 | 2015 | 2014 | |||||||||
| (In millions, except percentages) | |||||||||||
| Consolidated Statements of Operations Data: | |||||||||||
| Net revenues | $ | 3,600 | $ | 3,956 | $ | 4,183 | |||||
| Gross profit | 2,985 | 3,229 | 3,392 | ||||||||
| Operating income | 457 | 154 | 144 | ||||||||
| Operating margin percentage | 13 | % | 4 | % | 3 | % | |||||
| Consolidated Cash Flow Data: | |||||||||||
| Net cash provided by continuing operating activities | $ | 1,456 | $ | 17 | $ | 108 |
Net revenues decreased $356 million for fiscal 2016 as compared to fiscal 2015, primarily due to unfavorable foreign currency fluctuations, declines in our consumer security revenue, and the impact of the additional week from the 53-week fiscal 2015 year.
Gross margin increased to 83% for fiscal 2016 compared to 82% for fiscal 2015, primarily driven by decreases in OEM royalty fees and service related and content delivery expenses.
Operating income increased $303 million year over year as the reduction in our operating expenses was greater than the decline in our net revenues. The lower operating expenses were primarily due to a decrease in corporate charges previously allocated to our information management business but not classified within discontinued operations. These corporate charges were included in cost of revenues and expenses from continuing operations and include legal, accounting, real estate, information technology services, treasury, human resources and other corporate infrastructure expenses ("unallocated corporate charges"). See Note 8 of the Notes to Consolidated Financial Statements in this annual report for more information on unallocated corporate charges. We anticipate that we will not have unallocated corporate charges in fiscal 2017 and therefore our fiscal 2017 operating income will benefit from a reduction of unallocated corporate charges as compared to fiscal 2016. We expect our operating margins to fluctuate in future periods as a result of a number of factors, including our operating results and the timing and amount of expenses incurred.
Net cash provided by operating activities was $1.5 billion for fiscal 2016 due to increases in deferred income taxes of $1.1 billion and income taxes payable of $693 million. These amounts were partially offset by a loss from continuing operations, net of income taxes of $821 million, including non-cash items depreciation and amortization charges of $304 million and stock-bas
Showing the first 8K of 66K characters. Open the full section
Item 7A. Quantitative and Qualitative Disclosures about Market Risk
We are exposed to various market risks related to fluctuations in interest rates and foreign currency exchange rates. We may use derivative financial instruments to mitigate certain risks in accordance with our investment and foreign exchange policies. We do not use derivatives or other financial instruments for trading or speculative purposes.
Interest rate risk
As of April 1, 2016, we had $2.3 billion in principal amount of fixed-rate Senior Notes and Convertible Senior Notes outstanding, with a carrying amount of $2.2 billion and a fair value of $2.3 billion, which fair value was based on level 2 inputs. As of April 3, 2015, we had $2.1 billion in principal amount of fixed-rate Senior Notes outstanding, with a carrying amount of $2.1 billion and a fair value of $2.2 billion, which was based on level 2 inputs. We have performed sensitivity analysis as of April 1, 2016 and April 3, 2015 by using a modeling technique that measures the change in the fair values arising from a hypothetical 50 bps movement in the levels of market interest rates, with all other variables held constant. On April 1, 2016 and April 3, 2015, a hypothetical 50 bps increase or decrease in market interest rates would change the fair value of the fixed-rate Senior Notes and Convertible Senior Notes by a decrease of approximately $41 million and $39 million, respectively and an increase of approximately $42 million and $40 million, respectively. However, this hypothetical change in market interest rates would not impact the interest expense on the fixed-rate debt.
Foreign currency exchange rate risk
We conduct business in approximately 38 currencies through our worldwide operations and, as such, we are exposed to foreign currency risk. Our entities conduct their businesses in the primary local currency in which they operate, however, they may conduct business in other currencies. To the extend our entities hold monetary assets or liabilities, earn revenues or expend costs in currencies other than that entity's functional currency, they will be exposed to foreign exchange gains or losses and impacts to margins as a result. As part of our foreign currency risk mitigation strategy, we have entered into foreign exchange forward contracts with up to six months in duration to help mitigate foreign exchange risk, however we are not able to mitigate all of our foreign exchange risk. We have considered historical trends in exchange rates and determined that it is possible that adverse changes in exchange rates for any currency could be experienced. The estimated impacts of a ten percent appreciation or depreciation of foreign currency are as follows:
| April 1, 2016 | April 3, 2015 | |||||||||||||||||||||||
| Change in Fair Value Due to 10% | Change in Fair Value Due to 10% | |||||||||||||||||||||||
| Foreign Exchange Forward Contract | Notional Amount | Appreciation | Depreciation | Notional Amount | Appreciation | Depreciation | ||||||||||||||||||
| (Dollars in millions) | ||||||||||||||||||||||||
| Purchased | $ | 693 | $ | 69 | $ | (69 | ) | $ | 102 | $ | 10 | $ | (10 | ) | ||||||||||
| Sold | (198 | ) | (19 | ) | 19 | (195 | ) | (19 | ) | 19 | ||||||||||||||
| Total net outstanding contracts | $ | 495 | $ | 50 | $ | (50 | ) | $ | (93 | ) | $ | (9 | ) | $ | 9 |
We do not use derivative financial instruments for speculative trading purposes, nor do we hedge our foreign currency exposure in a manner that entirely offsets the effects of the changes in foreign exchange rates.
Item 8. Financial Statements and Supplementary Data
Annual financial statements
The Consolidated Financial Statements and related disclosures included in Part IV, Item 15 of this annual report are incorporated by reference into this Item 8.
Selected quarterly financial data
| Fiscal 2016 | Fiscal 2015 | ||||||||||||||||||||||||||||||
| Fourth Quarter | Third Quarter | Second Quarter | First Quarter | Fourth Quarter | Third Quarter | Second Quarter | First Quarter | ||||||||||||||||||||||||
| (In millions, except per share data) | |||||||||||||||||||||||||||||||
| Net revenues | $ | 873 | $ | 909 | $ | 906 | $ | 912 | $ | 899 | $ | 970 | $ | 1,001 | $ | 1,086 | |||||||||||||||
| Gross profit | 726 | 759 | 746 | 754 | 723 | 793 | 825 | 888 | |||||||||||||||||||||||
| Operating income | 128 | 146 | 100 | 83 | (49 | ) | 34 | 96 | 73 | ||||||||||||||||||||||
| Income (loss) from continuing operations | (1,013 | ) | 114 | 53 | 25 | 55 | (25 | ) | 32 | 47 | |||||||||||||||||||||
| Income from discontinued operations, net of income taxes | 3,058 | 56 | 103 | 92 | 121 | 247 | 212 | 189 | |||||||||||||||||||||||
| Net income | 2,045 | 170 | 156 | 117 | 176 | 222 | 244 | 236 | |||||||||||||||||||||||
| Income (loss) per share - basic: | |||||||||||||||||||||||||||||||
| Continuing operations | $ | (1.56 | ) | $ | 0.17 | $ | 0.08 | $ | 0.04 | $ | 0.08 | $ | (0.04 | ) | $ | 0.05 | $ | 0.07 | |||||||||||||
| Discontinued operations | $ | 4.70 | $ | 0.08 | $ | 0.15 | $ | 0.13 | $ | 0.18 | $ | 0.36 | $ | 0.31 | $ | 0.27 | |||||||||||||||
| Net income per share - basic | $ | 3.15 | $ | 0.26 | $ | 0.23 | $ | 0.17 | $ | 0.26 | $ | 0.32 | $ | 0.35 | $ | 0.34 | |||||||||||||||
| Income (loss) per share - diluted: | |||||||||||||||||||||||||||||||
| Continuing operations | $ | (1.56 | ) | $ | 0.17 | $ | 0.08 | $ | 0.04 | $ | 0.08 | $ | (0.04 | ) | $ | 0.05 | $ | 0.07 | |||||||||||||
| Discontinued operations | $ | 4.70 | $ | 0.08 | $ | 0.15 | $ | 0.13 | $ | 0.17 | $ | 0.36 | $ | 0.30 | $ | 0.27 | |||||||||||||||
| Net income per share - diluted | $ | 3.15 | $ | 0.25 | $ | 0.23 | $ | 0.17 | $ | 0.25 | $ | 0.32 | $ | 0.35 | $ | 0.34 |
Note: Net income per share amounts may not add due to rounding.
Item 9. Changes in and Disagreements with Accountants on Accounting and Financial Disclosure
None.
Item 9A. Controls and Procedures
a) Evaluation of Disclosure Controls and Procedures
The SEC defines the term “disclosure controls and procedures” to mean a company’s controls and other procedures that are designed to ensure that information required to be disclosed in the reports that it files or submits under the Exchange Act is recorded, processed, summarized, and reported, within the time periods specified in the SEC’s rules and forms. “Disclosure controls and procedures” include, without limitation, controls and procedures designed to ensure that information required to be disclosed by an issuer in the reports that it files or submits under the Exchange Act is accumulated and communicated to the issuer’s management, including its principal executive and principal financial officers, or persons performing similar functions, as appropriate to allow timely decisions regarding required disclosure. Our disclosure controls and procedures are designed to provide reasonable assurance that such information is accumulated and communicated to our management. Our management (with the participation of our Chief Executive Officer and Chief Financial Officer) has conducted an evaluation of the effectiveness of our disclosure controls and procedures (as defined in Rules 13a-15(e) and 15d-15(e) of the Securities Exchange Act). Based on such evaluation, our Chief Executive Officer and our Chief Financial Officer have concluded that our disclosure controls and procedures were effective at the reasonable assurance level as of the end of the period covered by this report.
b) Management’s Report on Internal Control over Financial Reporting
Our management is responsible for establishing and maintaining adequate internal control over financial reporting (as defined in Rules 13a-15(f) and 15d-15(f) of the Exchange Act) for Symantec. Our management, with the participation of our Chief Executive Officer and our Chief Financial Officer, has conducted an evaluation of the effectiveness of our internal
control over financial reporting as of April 1, 2016, based on criteria established in Internal Control - Integrated Framework (2013) issued by the Committee of Sponsoring Organizations of the Treadway Commission (“COSO”).
Our management has concluded that, as of April 1, 2016, our internal control over financial reporting was effective at the reasonable assurance level based on these criteria.
The Company’s independent registered public accounting firm has issued an attestation report regarding its assessment of the Company’s internal control over financial reporting as of April 1, 2016, which is included in Part IV, Item 15 of this annual report.
c) Changes in Internal Control over Financial Reporting
There were no changes in our internal control over financial reporting during the quarter ended April 1, 2016, that have materially affected, or are reasonably likely to materially affect, our internal control over financial reporting.
d) Limitations on Effectiveness of Controls
Our management, including our Chief Executive Officer and Chief Financial Officer, does not expect that our disclosure controls and procedures or our internal controls will prevent all errors and all fraud. A control system, no matter how well conceived and operated, can provide only reasonable, not absolute, assurance that the objectives of the control system are met. Further, the design of a control system must reflect the fact that there are resource constraints, and the benefits of controls must be considered relative to their costs. Because of the inherent limitations in all control systems, no evaluation of controls can provide absolute assurance that all control issues and instances of fraud, if any, within our company have been detected. Accordingly, our disclosure controls and procedures provide reasonable assurance of achieving their objectives.
Item 9B. Other Information
None.
PART III
Item 10. Directors, Executive Officers and Corporate Governance
The information required by this item will be included in an amendment to this annual report on Form 10-K or incorporated by reference from Symantec’s definitive proxy statement to be filed pursuant to Regulation 14A.
Item 11. Executive Compensation
The information required by this item will be included in an amendment to this annual report on Form 10-K or incorporated by reference from Symantec’s definitive proxy statement to be filed pursuant to Regulation 14A.
Item 12. Security Ownership of Certain Beneficial Owners and Management and Related Stockholder Matters
The information required by this item will be included in an amendment to this annual report on Form 10-K or incorporated by reference from Symantec’s definitive proxy statement to be filed pursuant to Regulation 14A.
Item 13. Certain Relationships and Related Transactions, and Director Independence
The information required by this item will be included in an amendment to this annual report on Form 10-K or incorporated by reference from Symantec’s definitive proxy statement to be filed pursuant to Regulation 14A.
Item 14. Principal Accounting Fees and Services
The information required by this item will be included in an amendment to this annual report on Form 10-K or incorporated by reference from Symantec’s definitive proxy statement to be filed pursuant to Regulation 14A.
PART IV
Item 15. Exhibits, Financial Statement Schedules
Upon written request, we will provide, without charge, a copy of this annual report, including the Consolidated Financial Statements and financial statement schedule. All requests should be sent to:
Symantec Corporation
Attn: Investor Relations
350 Ellis Street
Mountain View, California 94043
650-527-8000
The following documents are filed as part of this report:
REPORT OF INDEPENDENT REGISTERED PUBLIC ACCOUNTING FIRM
The Board of Directors and Stockholders
Symantec Corporation:
We have audited the accompanying consolidated balance sheets of Symantec Corporation and subsidiaries as of April 1, 2016 and April 3, 2015, and the related consolidated statements of operations, comprehensive income, stockholders’ equity, and cash flows for each of the years in the three-year period ended April 1, 2016. We also have audited Symantec Corporation’s internal control over financial reporting as of April 1, 2016, based on criteria established in Internal Control - Integrated Framework (2013) issued by the Committee of Sponsoring Organizations of the Treadway Commission (COSO). Symantec Corporation’s management is responsible for these consolidated financial statements, for maintaining effective internal control over financial reporting, and for its assessment of the effectiveness of internal control over financial reporting, included in Management’s Report on Internal Control over Financial Reporting appearing under Item 9A.b). Our responsibility is to express an opinion on these consolidated financial statements and an opinion on Symantec Corporation’s internal control over financial reporting based on our audits.
We conducted our audits in accordance with the standards of the Public Company Accounting Oversight Board (United States). Those standards require that we plan and perform the audits to obtain reasonable assurance about whether the financial statements are free of material misstatement and whether effective internal control over financial reporting was maintained in all material respects. Our audits of the consolidated financial statements included examining, on a test basis, evidence supporting the amounts and disclosures in the financial statements, assessing the accounting principles used and significant estimates made by management, and evaluating the overall financial statement presentation. Our audit of internal control over financial reporting included obtaining an understanding of internal control over financial reporting, assessing the risk that a material weakness exists, and testing and evaluating the design and operating effectiveness of internal control based on the assessed risk. Our audits also included performing such other procedures as we considered necessary in the circumstances. We believe that our audits provide a reasonable basis for our opinions.
A company’s internal control over financial reporting is a process designed to provide reasonable assurance regarding the reliability of financial reporting and the preparation of financial statements for external purposes in accordance with generally accepted accounting principles. A company’s internal control over financial reporting includes those policies and procedures that (1) pertain to the maintenance of records that, in reasonable detail, accurately and fairly reflect the transactions and dispositions of the assets of the company; (2) provide reasonable assurance that transactions are recorded as necessary to permit preparation of financial statements in accordance with generally accepted accounting principles, and that receipts and expenditures of the company are being made only in accordance with authorizations of management and directors of the company; and (3) provide reasonable assurance regarding prevention or timely detection of unauthorized acquisition, use, or disposition of the company’s assets that could have a material effect on the financial statements.
Because of its inherent limitations, internal control over financial reporting may not prevent or detect misstatements. Also, projections of any evaluation of effectiveness to future periods are subject to the risk that controls may become inadequate because of changes in conditions, or that the degree of compliance with the policies or procedures may deteriorate.
In our opinion, the consolidated financial statements referred to above present fairly, in all material respects, the financial position of Symantec Corporation and subsidiaries as of April 1, 2016 and April 3, 2015, and the results of their operations and their cash flows for each of the years in the three-year period ended April 1, 2016, in conformity with U.S. generally accepted accounting principles. Also in our opinion, Symantec Corporation maintained, in all material respects, effective internal control over financial reporting as of April 1, 2016, based on criteria established in Internal Control - Integrated Framework (2013) issued by the Committee of Sponsoring Organizations of the Treadway Commission (COSO).
As discussed in Note 1 to the consolidated financial statements, the Company has changed its method of the presentation of deferred income taxes as of April 1, 2016 due to the adoption of Accounting Standards Update 2015-17, Accounting for Income Taxes: Balance Sheet Classification of Deferred Taxes. Prior period amounts have not been reclassified.
/s/ KPMG LLP
Santa Clara, California
May 20, 2016
SYMANTEC CORPORATION
CONSOLIDATED BALANCE SHEETS
| April 1, 2016 | April 3, 2015 | ||||||
| (In millions, except par value) | |||||||
| ASSETS | |||||||
| Current assets: | |||||||
| Cash and cash equivalents | $ | 5,983 | $ | 2,843 | |||
| Short-term investments | 42 | 1,017 | |||||
| Accounts receivable, net of allowance for doubtful accounts of $16 and $5, respectively | 556 | 700 | |||||
| Deferred income taxes | — | 152 | |||||
| Other current assets | 378 | 295 | |||||
| Current assets of discontinued operations | — | 415 | |||||
| Total current assets | 6,959 | 5,422 | |||||
| Property and equipment, net | 957 | 950 | |||||
Showing the first 8K of 149K characters. Open the full section