 filings.tools
Gen Digital 10-K 2018-03-30
Filed 2018-10-26. 22 sections, 685K characters. Original on sec.gov · Markdown · JSON
Cover and table of contents
10-K 1 d573170d10k.htm 10-K
Table of Contents
UNITED STATES SECURITIES AND EXCHANGE COMMISSION
Washington, D.C. 20549
Form 10-K
(Mark One)
| ☑ | ANNUAL REPORT PURSUANT TO SECTION 13 OR 15(d) OF THE SECURITIES EXCHANGE ACT OF 1934 |
|---|
| For the Fiscal Year Ended March 30, 2018 |
|---|
or
| ☐ | TRANSITION REPORT PURSUANT TO SECTION 13 OR 15(d) OF THE SECURITIES EXCHANGE ACT OF 1934 |
|---|
| For the Transition Period from to |
|---|
Commission File Number 000-17781
Symantec Corporation
(Exact name of the registrant as specified in its charter)
| Delaware | 77-0181864 | |
| (State or other jurisdiction of incorporation or organization) | (I.R.S. employer Identification no.) | |
| 350 Ellis Street, Mountain View, California | 94043 (Zip code) | |
| (Address of principal executive offices) |
Registrant’s telephone number, including area code:
(650) 527-8000
Securities registered pursuant to Section 12(b) of the Act:
| Common Stock, par value $0.01 per share | The NASDAQ Stock Market LLC | |
| (Title of each class) | (Name of each exchange on which registered) |
Securities registered pursuant to Section 12(g) of the Act:
None
(Title of class)
Indicate by check mark if the registrant is a well-known seasoned issuer, as defined in Rule 405 of the Securities Act. Yes ☐ No ☑
Indicate by check mark if the registrant is not required to file reports pursuant to Section 13 or 15(d) of the Exchange Act. Yes ☐ No ☑
Indicate by check mark whether the registrant (1) has filed all reports required to be filed by Section 13 or 15(d) of the Securities Exchange Act of 1934 during the preceding 12 months (or for such shorter period that the registrant was required to file such reports), and (2) has been subject to such filing requirements for the past 90 days. Yes ☐ No ☑
Indicate by check mark whether the registrant has submitted electronically every Interactive Data File required to be submitted pursuant to Rule 405 of Regulation S-T (§ 232.405 of this chapter) during the preceding 12 months (or for such shorter period that the registrant was required to submit such files). Yes ☑ No ☐
Indicate by check mark if disclosure of delinquent filers pursuant to Item 405 of Regulation S-K is not contained herein, and will not be contained, to the best of registrant’s knowledge, in definitive proxy or information statements incorporated by reference in Part III of this Form 10-K or any amendment to this Form 10-K. ☐
Indicate by check mark whether the registrant is a large accelerated filer, an accelerated filer, a non-accelerated filer, a smaller reporting company, or an emerging growth company. See the definitions of “large accelerated filer,” “accelerated filer,” “smaller reporting company,” and “emerging growth company” in Rule 12b-2 of the Exchange Act. (Check one):
| Large accelerated filer ☑ | Accelerated filer ☐ | Non-accelerated filer ☐ | Smaller reporting company ☐ | |||
| Emerging growth company ☐ |
If an emerging growth company, indicate by check mark if the registrant has elected not to use the extended transition period for complying with any new or revised financial accounting standards provided pursuant to Section 13(a) of the Exchange Act. ☐
Indicate by check mark whether the registrant is a shell company (as defined in Rule 12b-2 of the Exchange Act). Yes ☐ No ☑
Aggregate market value of the voting stock held by non-affiliates of the registrant, based upon the closing sale price of Symantec common stock on September 28, 2018 as reported on the Nasdaq Global Select Market: $7,810,381,908. Solely for purposes of this disclosure, shares of common stock held by each executive officer, director, and holder of 5% or more of the outstanding common stock have been excluded as of such date because such persons may be deemed to be affiliates. This determination of possible affiliate status is not a conclusive determination for any other purposes.
The number of shares of Symantec common stock, $0.01 par value per share, outstanding as of October 15, 2018 was 638,800,147 shares.
DOCUMENTS INCORPORATED BY REFERENCE
None.
Table of Contents
SYMANTEC CORPORATION
FORM 10-K
For the Fiscal Year Ended March 30, 2018
TABLE OF CONTENTS
“Symantec,” “we,” “us,” “our,” and “the Company” refer to Symantec Corporation and all of its subsidiaries. Symantec, the Symantec Logo and Norton are trademarks or registered trademarks of Symantec in the United States (“U.S.”) and other countries. Other names may be trademarks of their respective owners.
EXPLANATORY NOTE
As previously reported, we were unable to timely file our Annual Report on Form 10-K for the fiscal year ended March 30, 2018 and our Quarterly Report on Form 10-Q for the first quarter of fiscal 2019 ended June 29, 2018 and we anticipate being unable to timely file our Quarterly Report on Form 10-Q for the second quarter of fiscal 2019 ended September 28, 2018 as a result of an Audit Committee investigation as described herein. We expect to file the delinquent Quarterly Reports as promptly as practicable following this Annual Report filing.
Table of Contents
FORWARD-LOOKING STATEMENTS AND FACTORS THAT MAY AFFECT FUTURE RESULTS
The discussion below contains forward-looking statements, which are subject to safe harbors under the Securities Act of 1933, as amended (the “Securities Act”) and the Exchange Act of 1934, as amended (the “Exchange Act”). Forward-looking statements include references to our ability to utilize our deferred tax assets, as well as statements including words such as “expects,” “plans,” “anticipates,” “believes,” “estimates,” “predicts,” “goal,” “intent,” “momentum,” “projects,” and similar expressions. In addition, projections of our future financial performance; anticipated growth and trends in our businesses and in our industries; the anticipated impacts of acquisitions, restructurings, stock repurchases and investment activities; the outcome or impact of pending litigation, claims or disputes; our intent to pay quarterly cash dividends in the future; plans for and anticipated benefits of our solutions; matters arising out of our completed Audit Committee investigation and the ongoing U.S. Securities and Exchange Commission (the “SEC”) investigation; and other characterizations of future events or circumstances are forward-looking statements. These statements are only predictions, based on our current expectations about future events and may not prove to be accurate. We do not undertake any obligation to update these forward-looking statements to reflect events occurring or circumstances arising after the date of this report. These forward-looking statements involve risks and uncertainties, and our actual results, performance, or achievements could differ materially from those expressed or implied by the forward-looking statements on the basis of several factors.
These and other risks are described under Item 1A, Risk Factors. We encourage you to read that section carefully.
Table of Contents
PART I
Item 1. Business
Overview
Symantec Corporation is a global leader in cyber security. We provide cyber security products, services and solutions to more than 350,000 organizations and 50 million individuals worldwide. Our Integrated Cyber Defense Platform helps enterprise, business and government customers unify cloud and on-premises security to protect against threats and safeguard information across every control point and attack vector. Our Cyber Safety solutions (delivered through the Norton and LifeLock offerings) help consumers protect their information, identities, devices and networks at home and online.
Our business and consumer offerings are powered by the largest civilian threat intelligence network, which uses machine learning and human intelligence to analyze trillions of rows of data every day across hundreds of millions of devices to discover and help prevent advanced threats that might otherwise go undetected. We believe this threat intelligence data is a competitive advantage, and a primary way we are able to provide faster and better protection for customers.
Founded in 1982, Symantec has operations in more than 45 countries. Our headquarters are located at 350 Ellis Street, Mountain View, California. Our Internet home page is located at www.symantec.com. The information contained, or referred to, on our website is not part of this annual report unless expressly noted.
Fiscal 2018 Business Highlights
During fiscal 2018, we continued to make progress enhancing and expanding our product and services portfolio and improving product integration, partner integration and sales delivery to help business customers deploy our Integrated Cyber Defense Platform. We also made progress driving revenue growth and market adoption for our Consumer Digital Safety solutions, building on our Norton and LifeLock product portfolio. In addition, we implemented operational improvements to reduce costs and complexity, building on the business transformation programs we initiated in fiscal 2017, and leveraged synergies from the successful integration of our acquired businesses.
| • | Our enterprise product teams built extensive point-to-point integrations across endpoint, network, cloud and email security products, responding to customer demand to consolidate vendors and enhance their security posture across control points. |
|---|
| • | We further extended our Integrated Cyber Defense platform through application programming interfaces (APIs) and engineering-level integration with more than 100 certified technology partners. Their complementary products and services expand our ecosystem, helping businesses implement a coordinated and robust approach to threat protection, detection and response. |
|---|
| • | We began offering consumers bundled services of our Norton-branded security services with LifeLock-branded identity theft protection services, allowing individuals and families to help defend against increasingly complex online threats. Bundling these solutions enabled us to combine our Norton and LifeLock demand generation and customer relationship management programs to drive new customer acquisition, improve retention and cross-sell within our large installed base. |
|---|
Table of Contents
| • | We completed several acquisitions, including Fireglass Ltd. and Skycure Ltd. |
|---|
| • | Fireglass provides agentless isolation solutions that prevent ransomware, malware, and phishing threats in real-time from reaching user endpoints or the corporate network. With this acquisition, we further strengthened our enterprise security strategy to deliver an Integrated Cyber Defense Platform and extended our participation in the Secure Web Gateway and Email protection markets delivered both on premises and in the cloud. |
|---|
| • | Skycure provides mobile threat defense for devices running modern operating systems, including iOS and Android. This acquisition extends our endpoint security capabilities. With the addition of Skycure our Integrated Cyber Defense Platform now enables visibility into and control over all endpoint devices, including mobile devices, whether corporate owned or bring your own device. |
|---|
| • | We completed the divestiture of our Website Security (“WSS”) and Public Key Infrastructure (“PKI”) solutions to DigiCert, Inc., allowing us to sharpen our enterprise security focus on Integrated Cyber Defense. At the closing of the transaction, we received a minority ownership stake in DigiCert. |
|---|
| • | We launched significant new products to advance our portfolio and competitive position: |
|---|
| • | Symantec Endpoint Protection 14.1 delivers superior, multi-layer protection to help stop threats regardless of how they attack endpoints, while integrating with other security products to provide an orchestrated response. Its single, lightweight agent offers high performance while maintaining end-user productivity. In addition, Symantec Endpoint Protection 14.1 is designed to be effective even in sites with low connectivity, using advanced machine learning and other signature-less technologies to minimize the need for content updates. |
|---|
| • | Symantec Advanced Threat Protection 3.0 extends and differentiates our endpoint security offering with new technology that includes file-less attack detection and enhanced adversary intelligence. It also enables “flight recorder” functionality, which records all activity on the endpoint, providing valuable forensic data to incident responders with no new agent to install. |
|---|
Business Strategy
Our strategy is to combine best-of-breed technology with unmatched scale to deliver comprehensive cyber security platforms for enterprise, business and government customers, as well as consumers.
Our Enterprise Security strategy is to leverage our product portfolio, partner ecosystem and global threat intelligence network to deliver Integrated Cyber Defense to enterprise, business and government customers. Our Integrated Cyber Defense platform enables us to acquire new customers and cross-sell our full portfolio of products and services to existing customers with improved visibility, enhanced controls, accelerated response and reduced cost of ownership.
Our Consumer Digital Safety strategy is to combine and leverage our portfolio of Norton and LifeLock brands, products, and services to deliver a comprehensive set of Cyber Safety solutions that addresses today’s continually evolving and increasingly complex threat landscape. This threat landscape puts consumers at increased risk of having their security, privacy, and identities compromised. As risks shift from PC-based attacks to more sophisticated threats (ransomware, identity theft, Internet of Things (“IoT”) risks), our software and services provide a multi-layered approach to protect consumers everywhere, regardless of device, network or location.
Table of Contents
Products and Services
Enterprise Security Portfolio: Integrated Cyber Defense
Our Enterprise Security portfolio includes a deep and broad mix of products, services and solutions, delivered as part of an Integrated Cyber Defense platform. Our platform unifies cloud and on-premises security to provide advanced threat protection and information protection across all endpoints, networks, email, and cloud applications. Key components of the platform include:
| • | Core Services |
|---|
| • | Advanced Threat Protection: Multiple layers of threat prevention, detection and forensic technology provide a robust view of malicious activities across control points, enabling users to contain, investigate and remediate threats. |
|---|
| • | Information Protection: Encryption, data loss prevention, multi-factor authentication, tagging, and analytics enable businesses and governments to protect confidential information and IT assets while managing compliance requirements and restricting access to authenticated users. |
|---|
| • | Control Points |
|---|
| • | Endpoint Security: A single agent architecture delivers multi-layered security across all possible endpoints - desktop, server, mobile, and IoT - and enables customers to protect enterprise and mobile workforces regardless of operating system, device or network security approaches. |
|---|
| • | Network Security: Cloud and on-premises network security solutions, based on an advanced proxy architecture, provide superior defense against advanced threats, enable users to protect critical business information, and help ensure secure and compliant use of cloud applications and the web. |
|---|
| • | Email Security: Multiple layers of protection (including threat isolation and advanced analytics) against ransomware, spear phishing and enterprise email compromise help identify targeted attacks, and enable users to protect email against user error and data leakage. |
|---|
| • | Cloud Security: Advanced solutions that secure cloud access, cloud infrastructure and cloud applications, and provide in-depth visibility, data security, and threat protection to safeguard users, information and workloads across public and private clouds. |
|---|
| • | Foundation |
|---|
Our solutions are powered by the following critical features:
| • | Threat Intelligence: A global threat intelligence network applies artificial intelligence to analyze over 1 trillion lines of telemetry annually, automatically updating intelligence on millions of malicious files and URL threat indicators across all control points to discover and block advanced targeted attacks that might otherwise go undetected. |
|---|
| • | Open Ecosystem: A rich set of open APIs (Application Programming Interfaces) with over 100 certified technology partners creating the broadest ecosystem in cyber security, enabling a coordinated and robust approach to threat protection, detection and response. |
|---|
Table of Contents
| • | Platform Integrations: A curated set of multi-point integrations between Symantec and technology partner solutions, orchestrating and automating actions, events and intelligence across the platform and eco-system to empower a powerful cyber defense. |
|---|
In addition to our core product portfolio, Symantec offers enterprise security services including:
| • | Consulting Services: We provide the experience, expertise, and industry intelligence to assist enterprises to better architect, design, implement, and optimize their security software, people and processes. Symantec consultants guide enterprises toward solutions that meet their business goals and leave them with the knowledge to maintain and enhance their security environment. |
|---|
| • | Premium Support Services: Our premium support services for enterprises focus on timely and accurate issue resolution by placing a product family expert at the center of a tailored support experience, who provides technical support, manages escalations, delivers case and system reviews, oversees environmental health checks, and provides proactive services like upgrade planning and feature optimization. |
|---|
| • | Cyber Security Services: We provide continual threat monitoring, customized guidance, and 24x7 personalized service within an enterprise’s security environment through our Managed Security Services, DeepSight Intelligence, and Incident Response Services. |
|---|
Consumer Digital Safety Portfolio
Our Consumer Digital Safety solutions consist of the following key elements, which we are integrating into a singular user experience for individuals and their families:
| • | Norton Security: Our Norton Security solutions are available as a subscription service providing protection for devices against malware, viruses, adware, and ransomware on multiple platforms: Windows, Mac, Android and iOS. Users also have access to a password manager, parental controls, and safe web browsing that blocks malicious sites and filters browser search results. Users also can perform secure cloud backups of photos, financial files and other important documents on Windows, providing additional protection in the event ransomware attacks make these files unavailable. For mobile devices, Norton Security also filters risky apps, enables stolen device recovery, provides contact recovery, and blocks unwanted spam texts and calls. Norton Security includes 24x7 support by trained support agents who work to remediate any problems. |
|---|
| • | LifeLock Identity Theft Protection: Our LifeLock identity theft protection solution provides identity monitoring, alerts, and restoration to our customers. LifeLock puts users in control of their identity elements, including social security numbers, bank accounts, email addresses, physical addresses, driver’s license and phone numbers. The service alerts users on key events and recommends actions to prevent unauthorized access. If an identity theft takes place, LifeLock’s identity experts work with the user to restore their identities, managing interaction with various governmental agencies, financial institutions and merchants - and addressing legal fees, wage loss and associated damages. |
|---|
| • | Norton Wi-Fi Privacy: Our Norton Wi-Fi Privacy service offers a protected way to connect to the Internet, encrypting data users send over Internet connections and enhancing levels of privacy online. With this service, users can confidently send private information like passwords, bank details, and credit card numbers when using public Wi-Fi on PC, Mac or mobile device without risk of compromise. Users can also access globally to their favorite |
|---|
Table of Contents
| apps, websites and online streaming by changing their virtual location. This service also limits the ability of websites to track users, thereby eliminating persistent personalized ads based on browsing history. |
|---|
Business Segments, International Operations and Significant Customers
For financial information regarding our Enterprise Security and Consumer Digital Safety segments, revenues and property and equipment by geographical area and significant customers, see Note 14 to the Consolidated Financial Statements in this annual report. For information regarding risks associated with our international operations, see Item 1A, Risk Factors.
Sales and Go-to-Market Strategy
Our go-to-market network includes direct sales forces and broad e-commerce capabilities, as well as indirect sales resources that support our global partner ecosystem. We also maintain strategic relationships with a number of original equipment manufacturers (“OEMs”), Internet service providers (“ISPs”), global service integrators (“GSI”s), wireless carriers, and retail and online stores through which we market and sell our products.
Enterprise
We sell and market our products and services to large enterprises, including business, government and public-sector customers, through our field sales force and reseller channels. Our field sales team leverages our global partner ecosystem, primarily targeting senior executives and IT department personnel responsible for managing a company’s highest-order IT and cyber security initiatives.
We also sell and market our products and services to small, medium and large businesses through field sales and inside sales forces that leverage indirect sales partners around the world, who are specifically trained and certified to sell our solutions. These partners include national solution providers, regional solution providers, national account resellers, global/federal system integrators, and managed service providers.
Our enterprise products and services are also available on our e-commerce platform, as well as through authorized distributors, GSIs and OEMs, who incorporate our technologies into their products, bundle our products with their offerings, or serve as authorized resellers of our products.
Consumer
We sell and market our consumer products and services to individuals, households and small businesses globally. We bring these products to market through direct marketing and co-marketing programs supported by our e-commerce and tele-sales platforms. In addition, we utilize Internet-based resellers, system builders, ISPs, employee benefits providers, wireless carriers, retailers, and OEMs to distribute our offerings worldwide. We drive consumer business growth through global brand and demand campaigns, new customer acquisition, improved retention cross-sell and customer success programs.
Research and Development
Symantec embraces a global research and development strategy to drive organic innovation and product integration across our portfolio. Our engineering and product management teams are focused on delivering new versions of existing product lines as well as developing entirely new products and
Table of Contents
services to drive the company’s leadership in cyber security. We also have a technology research organization focused on short, medium, and longer-term applied research projects, with the goal of transferring completed innovations into our product groups for commercialization.
Symantec’s Security Technology and Response organization is a global team of security engineers, threat analysts, and researchers who provide the underlying functionality, content, and support for many of our solutions. These front-line security experts analyze threat telemetry collected through our vast cyber intelligence networks to protect our customers against current and emerging threats. Our research and development teams also leverage these vast data sets and insights to develop new technologies and approaches in order to improve security outcomes for our customers.
Research and development expenses were $956 million, $823 million and $748 million in fiscal 2018, 2017 and 2016, respectively. We believe that technical leadership is essential to our success, and we expect to continue to commit substantial resources to research and development.
Product and Technical Support
Symantec has support facilities throughout the world, staffed by technical product experts knowledgeable in the operating environments in which our products are deployed. Our support experts assist customers with both issue resolution and threat detection.
We provide Enterprise Security customers with various levels of support. Our support program offers annual maintenance support contracts, including content, updates, and technical support. Our essential technical support includes: self-service options, assisted support delivered by telephone or electronically during contracted-for hours, immediate patches for severe problems, periodic software updates, and access to our technical knowledge base and frequently asked questions.
Our Consumer Digital Safety support includes self-help online services and phone, chat, and email support worldwide. Most of our Norton Security products come with automatic downloads of the latest virus definitions, application bug fixes, and patches, as well as a “Virus Protection Promise,” which in some markets provides free virus removal services to customers whose protected computers become infected. Our Consumer Digital Safety service and support offerings come with 24x7x365 support, along with remediation services during normal business hours.
Competition
Our markets are consolidating, highly competitive, and subject to rapid changes in technology. The competitive landscape has changed significantly over the past few years, with new competition arising. Some of the market growth has come from startups that focus on solving a particular issue or delivering a niche-oriented product, and from larger integration providers that increasingly seek to add to or extend their offerings. We focus on delivering comprehensive customer solutions, integrating across our broad product portfolio and partnering with other technology providers to differentiate our offerings and platforms from the competition.
In addition to the competition we face from direct competitors, we face indirect or potential competition from retailers, application providers, operating system providers, network equipment manufacturers and other OEMs who may provide various solutions and functions in their current and future offerings. We compete with these same parties to acquire technologies, products, or companies. We also compete with other software companies in our effort to place our products on the computer equipment sold to consumers and enterprises by OEMs. We compete for access to distribution channels and for spending at the retail level for our consumer offerings and in corporate accounts for our enterprise offerings.
Table of Contents
Our Enterprise Security competitors vary by product category, geography, channel and customer size:
| • | Endpoint security competitors include McAfee LLC (formerly Intel Security, “McAfee”), Microsoft Corporation (“Microsoft”), and Carbon Black, Inc., as well as several point-product competitors, freeware providers and regional security companies. |
|---|
| • | Network security competitors include Palo Alto Networks Inc. (“Palo Alto”), FireEye Inc. (“FireEye”), Cisco Systems, Inc. (“Cisco”), McAfee, and Forcepoint LLC (“Forcepoint”), as well as other established and emerging companies. |
|---|
| • | Cloud security competitors include Cisco and McAfee (formerly Skyhigh Networks), as well as other established and emerging companies. We expect additional competition as the market for security-as-a-service continues to develop and expand. |
|---|
| • | Email security competitors include Proofpoint, Inc. and Microsoft. |
|---|
| • | Advanced threat protection competitors include McAfee, Palo Alto, FireEye, International Business Machines Corporation (“IBM”) and Dell EMC, as well as Niksun and Trend Micro. As new IT budgets are created to address next-generation threats, we expect to compete with additional specialized vendors as well as larger vendors that may continue to acquire or bundle their products. |
|---|
| • | Information protection competitors include RSA (a Dell Technologies business), McAfee, Forcepoint, Digital Guardian and Microsoft. |
|---|
| • | Cyber security services and managed security services competitors include FireEye, IBM, and SecureWorks Corporation, as well as other additional established and emerging companies. |
|---|
Our Consumer Digital Safety competitors vary by product category, geography and channel. Norton Security competitors include McAfee, Microsoft and Trend Micro. Consumer backup product competitors include Carbonite, Inc. LifeLock identity theft protection competitors include credit bureaus Experian, Equifax, and TransUnion, as well as others including Affinion, EWS, Intersections, and LexisNexis.
We believe that the principal competitive factors necessary to be successful in our industry include product quality and effectiveness, time-to-market, price, reputation, financial stability, breadth of product offerings, customer support, brand recognition, and effective sales and marketing efforts.
Intellectual Property
Protective measures
We regard some of the features of our internal operations, software, and documentation as proprietary and rely on copyright, patent, trademark and trade secret laws, confidentiality procedures, contractual arrangements, and other measures to protect our proprietary information. Our intellectual property is an important and valuable asset that enables us to gain recognition for our products, services, and technology and enhance our competitive position.
As part of our confidentiality procedures, we generally enter into non-disclosure agreements with our employees, distributors, and corporate partners and we enter into license agreements with respect to our software, documentation, and other proprietary information. These license agreements are
Table of Contents
generally non-transferable and have either a perpetual or subscription based time limited term. We also educate our employees on trade secret protection and employ measures to protect our facilities, equipment, and networks.
Trademarks, patents, copyrights, and licenses
Symantec, and the Symantec Norton and LifeLock logos, are trademarks or registered trademarks in the U.S. and other countries. In addition, we have used, registered, or applied to register other trademarks and service marks to help distinguish our products, technologies, and services from those of our competitors in the U.S. and other countries. We actively enforce our trademark, service mark, and trade name rights in the U.S. and abroad based on our rights under common law, and various state and federal laws and regulations, as well as rights recognized by international treaties and conventions. The duration of our trademark registrations varies from country to country, and in the U.S. we generally are able to maintain our trademark rights and renew any trademark registrations for as long as the trademarks are in use.
We have approximately 2,225 patents, in addition to foreign patents and pending U.S. and foreign patent applications, which relate to various aspects of our products and technology. The duration of our patents is determined by the laws of the country of issuance and for the U.S. is typically 17 years from the date of issuance of the patent or 20 years from the date of filing of the patent application resulting in the patent, which we believe is adequate relative to the expected lives of our products.
Our products are protected under U.S. and international copyright laws and laws related to the protection of intellectual property and proprietary information. We take measures to label such products with the appropriate proprietary rights notices, and we actively enforce such rights in the U.S. and abroad. However, these measures may not provide sufficient protection, and our intellectual property rights may be challenged. In addition, we license some intellectual property from third parties for use in our products, and generally must rely on the third party to protect the licensed intellectual property rights. While we believe that our ability to maintain and protect our intellectual property rights is important to our success, we also believe that our business as a whole is not materially dependent on any particular patent, trademark, license, or other intellectual property right.
Seasonality
As is typical for many large technology companies, our business is seasonal. Revenues are generally higher in our third and fourth fiscal quarters.
Corporate Responsibility
Our annual Corporate Responsibility Report can be found via the Symantec website at https://www.symantec.com/about/corporate-responsibility.
Audit Committee Investigation Completed
As previously disclosed, the Audit Committee has concluded its internal investigation, which was originally announced in May 2018. Please see Part III, Item 11 “Executive Compensation” — “Executive Compensation and Related Information” — “Compensation Discussion & Analysis” — “Additional Matters — Audit Committee Investigation” for more details.
Employees
As of March 30, 2018, we employed more than 11,800 people worldwide.
Table of Contents
Available information
Our Internet home page is located at www.symantec.com. We make available free of charge our annual reports on Form 10-K, quarterly reports on Form 10-Q, current reports on Form 8-K, and amendments to those reports as soon as reasonably practicable after we electronically file such material with the Securities and Exchange Commission (“SEC”) on our investor relations website located at www.symantec.com/invest. The information contained, or referred to, on our website is not part of this annual report unless expressly noted. The SEC maintains a website that contains reports, proxy and information statements, and other information regarding our filings at http://www.sec.gov. In addition, you may read and copy any filing that we make with the SEC at the public reference room maintained by the SEC, located at 100 F Street, N.E., Washington, D.C. 20549. Please call the SEC at 1-800-SEC-0330 for further information about the public reference room.
Item 1A. Risk Factors
A description of the risk factors associated with our business is set forth below. The list is not exhaustive and you should carefully consider these risks and uncertainties before investing in our common stock.
A decrease in demand for our solutions could adversely affect our financial results.
We are subject to fluctuations in demand for our solutions due to a variety of factors, including market transitions, general economic conditions, competition, product obsolescence, technological change, shifts in buying patterns, the timing and duration of hardware refresh cycles, financial difficulties and budget constraints of our current and potential customers, public awareness of security threats to IT systems and other factors. While such factors may, in some periods, increase product sales, fluctuations in demand can also negatively impact our sales. If demand for our solutions declines, whether due to general economic conditions, a shift in buying patterns or otherwise, our revenues and margins would likely be adversely affected.
Fluctuations in our quarterly financial results have affected the trading price of our outstanding securities in the past and could affect the trading price of outstanding securities in the future.
Our quarterly financial results have fluctuated in the past and are likely to vary in the future due to a number of factors, many of which are outside of our control. If our quarterly financial results or our predictions of future financial results fail to meet our expectations or the expectations of securities analysts and investors, the trading price of our outstanding securities could be negatively affected. Volatility in our quarterly financial results may make it more difficult for us to raise capital in the future or pursue acquisitions. Our operating results for prior periods may not be effective predictors of our future performance.
Factors associated with our industry, the operation of our business, and the markets for our solutions may cause our quarterly financial results to fluctuate, including:
| • | Fluctuations in our revenue due to the transition of our sales contracts to a higher mix of products subject to ratable versus point-in-time revenue recognition; |
|---|
| • | The timing of satisfying revenue recognition criteria, particularly with regard to our enterprise sales transactions, as a result of our adoption of new revenue recognition accounting standards under ASC 606 on March 31, 2018; |
|---|
| • | Fluctuations in demand for our solutions; |
|---|
| • | Entry of new competition into our markets; |
|---|
| • | Competitive pricing pressure for one or more of our classes of our solutions; |
|---|
Table of Contents
| • | Our ability to timely complete the release of new or enhanced versions of our solutions; |
|---|
| • | The timing and extent of significant restructuring charges; |
|---|
| • | The impact of acquisitions and our ability to achieve expected synergies; |
|---|
| • | Fluctuations in foreign currency exchange rates; |
|---|
| • | The number, severity, and timing of threat outbreaks (e.g. worms, viruses, malware, ransomware and other malicious threats) and cyber security incidents (e.g., large scale data breaches); |
|---|
| • | Our resellers making a substantial portion of their purchases near the end of each quarter; |
|---|
| • | Customers’ tendency to negotiate licenses and other agreements near the end of each quarter; |
|---|
| • | Cancellation, deferral, or limitation of orders by customers; |
|---|
| • | Changes in the mix or type of products and subscriptions sold; |
|---|
| • | Our ability to achieve targeted operating income and margins; |
|---|
| • | Movements in interest rates; |
|---|
| • | The rate of adoption of new technologies and new releases of operating systems; |
|---|
| • | Changes in tax laws, rules, and regulations; |
|---|
| • | Weakness or uncertainty in general economic or industry conditions in any of the multiple markets in which we operate that could reduce customer demand and ability to pay for our solutions; |
|---|
| • | Political and military instability caused by war or other events, which could slow spending within our target markets, delay sales cycles, and otherwise adversely affect our ability to generate revenues and operate effectively; |
|---|
| • | The timing of and rate and discounts at which customers replace older versions of our hardware products that reach end of life; and |
|---|
| • | Disruptions in our business operations or target markets caused by, among other things, terrorism or other intentional acts, outbreaks of disease, or earthquakes, floods, or other natural disasters. |
|---|
Any of the foregoing factors could cause the trading price of our outstanding securities to fluctuate significantly.
Our business depends on customers renewing their arrangements for maintenance, subscriptions, managed security services and cloud-based (“cloud”) offerings.
A large portion of our revenue is derived from arrangements for maintenance, subscriptions, managed security services and cloud offerings, yet customers have no contractual obligation to purchase additional solutions after the initial subscription or contract period. Our customers’ renewal rates, and our customer retention, may decline or fluctuate as a result of a number of factors, including their level of satisfaction with our solutions or our customer support, customer budgets and the pricing of our solutions compared with the solutions offered by our competitors, any of which may cause our revenue to grow more slowly than expected, or to decline. Accordingly, we must invest significant time and resources in providing ongoing value to our customers. If these efforts fail, or if our customers do not renew for other reasons, or if they renew on terms less favorable to us, our revenue may decline and our business will suffer.
Matters relating to or arising from our Audit Committee investigation, including regulatory investigations and proceedings, litigation matters and potential additional expenses, may adversely affect our business and results of operations.
As previously disclosed in our public filings, the Audit Committee of our Board of Directors (the “Audit Committee”) has recently completed an internal investigation (the “Audit Committee Investigation”). In connection with the Audit Committee Investigation, we voluntarily contacted the SEC in May 2018. The SEC commenced a formal investigation and we continue to cooperate with that investigation.
Table of Contents
Furthermore, if the SEC commences legal action, we could be required to pay significant penalties and become subject to injunctions, a cease and desist order and other equitable remedies. The completion of the Audit Committee investigation and filing of delinquent periodic reports will not automatically resolve the SEC investigation. We can provide no assurances as to the outcome of any governmental investigation.
We have incurred, and may continue to incur, significant expenses related to legal, accounting, and other professional services in connection with the internal investigation and related legal matters. These expenses, the delay in timely filing our periodic reports, and the diversion of the attention of the management team that has occurred, and is expected to continue, ha
Showing the first 8K of 78K characters. Open the full section
Item 1B. Unresolved Staff Comments
There are no unresolved issues with respect to any Commission staff’s written comments that were received at least 180 days before the end of our fiscal year to which this report relates and that relate to our periodic or current reports under the Exchange Act.
Item 2. Properties
Our properties consist primarily of owned and leased office facilities for sales, research and development, administrative, customer service and technical support personnel. Our corporate headquarters is located in Mountain View, California where we occupy facilities totaling approximately 734,000 square feet, of which 723,000 square feet is owned and 11,000 square feet is leased. Our leased facilities are occupied under agreements that expire on various dates through fiscal 2029. The following table presents the approximate square footage of our facilities as of March 30, 2018:
| Approximate Square Footage (1) | ||||||||
| (In thousands) | Owned | Leased | ||||||
| Americas (U.S., Canada and Latin America) | 1,402 | 746 | ||||||
| EMEA (Europe, Middle East and Africa) | 163 | 227 | ||||||
| APJ (Asia Pacific and Japan) | - | 945 | ||||||
| Total approximate square footage | 1,565 | 1,918 | ||||||
| (1) | Included in the total approximate square footage above are vacant and available-for-lease properties totaling approximately 151,000 square feet. Total square footage excludes approximately 664,000 square feet relating to facilities subleased to third parties. As of March 30, 2018, we also own facilities that are held as available-for-sale on our Consolidated Balance Sheets. These facilities comprise approximately 403,000 square feet of space. In October 2018, we completed the sale of these facilities. |
|---|
Table of Contents
We believe that our existing facilities are adequate for our current needs and that the productive capacity of our facilities is substantially utilized.
Item 3. Legal Proceedings
Information with respect to this Item may be found under the heading “Litigation contingencies” in Note 15 to the Consolidated Financial Statements in this Annual Report on Form 10-K which information is incorporated into this Item 3 by reference.
Item 4. Mine Safety Disclosures
Item 5. Market for Registrant’s Common Equity, Related Stockholder Matters and Issuer Purchases of Equity Securities
Price range of common stock and number of stockholders
Our common stock is traded on the Nasdaq Global Select Market under the symbol “SYMC.” As of March 30, 2018, there were 1,665 stockholders of record. The high and low closing sales prices set forth below are as reported on the Nasdaq Global Select Market during each quarter of the two most recent fiscal years.
| 2017 | 2018 | |||||||||||||||||||||||||||||||
| First Quarter | Second Quarter | Third Quarter | Fourth Quarter | First Quarter | Second Quarter | Third Quarter | Fourth Quarter | |||||||||||||||||||||||||
| High | $ | 21.24 | $ | 25.27 | $ | 25.45 | $ | 30.83 | $ | 33.14 | $ | 34.16 | $ | 33.92 | $ | 29.57 | ||||||||||||||||
| Low | $ | 16.60 | $ | 20.28 | $ | 23.49 | $ | 24.01 | $ | 28.06 | $ | 27.47 | $ | 27.36 | $ | 25.51 |
Table of Contents
Stock performance graph
The graph below compares the cumulative total stockholder return on our common stock with the cumulative total return on the S&P 500 Composite Index and the S&P Information Technology Index for the five fiscal years ended March 30, 2018 (assuming the initial investment of $100 in our common stock and in each of the other indices on the last day of trading for fiscal 2013, and the reinvestment of all dividends). The comparisons in the graph below are based on historical data and are not indicative of, nor intended to forecast the possible future performance of our common stock.
COMPARISON OF FIVE-YEAR CUMULATIVE TOTAL RETURN
Among Symantec Corporation, the S&P 500 Index
and the S&P Information Technology Index
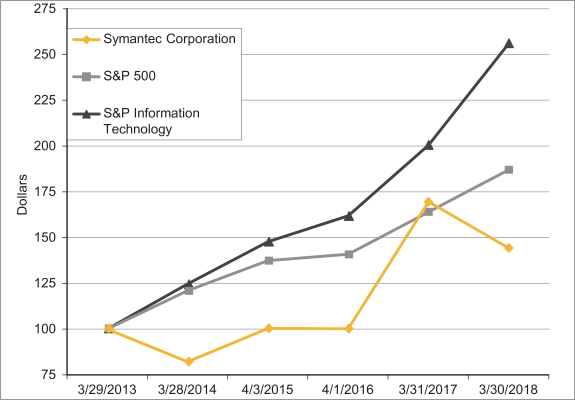
275 Symantec Corporation 250 S&P 500 225 S&P Information Technology 200 Dollars 175 150 125 100 75 3/29/2013 3/28/2014 4/3/2015 4/1/2016 3/31/2017 3/30/2018
This performance graph shall not be deemed “filed” for purposes of Section 18 of the Exchange Act or otherwise subject to the liabilities under that Section, and shall not be deemed to be incorporated by reference into any filing of Symantec under the Securities Act or the Exchange Act.
Dividends
During fiscal 2018 and 2017, we declared and paid aggregate cash dividends and dividend equivalents of $211 million or $0.30 per common share, and $222 million or $0.30 per common share, respectively. Dividends declared and paid each quarter during fiscal 2018 and 2017 were $0.075 per share. All future dividends are subject to the approval of our Board of Directors.
Table of Contents
Repurchases of our equity securities
Through our stock repurchase programs we have repurchased shares of our common stock since the fourth quarter of fiscal 2004. Under these programs, shares may be repurchased on the open market and through accelerated stock repurchase transactions. As of March 30, 2018, we have $800 million remaining authorized to be completed in future periods with no expiration date. Stock repurchases during the three months ended March 30, 2018, were as follows:
| (In millions, except per share data) | Total Number of Shares Purchased | Average Price Paid per Share | Total Number of Shares Purchased as Part of Publicly Announced Program | Maximum Dollar Value of Shares That May Yet Be Purchased Under the Plans or Programs | ||||||||||||
| December 30, 2017 to January 26, 2018 | - | $ | - | - | $ | 800 | ||||||||||
| January 27, 2018 to February 23, 2018 | - | $ | - | - | $ | 800 | ||||||||||
| February 24, 2018 to March 30, 2018 | - | $ | - | - | $ | 800 | ||||||||||
| Total number of shares repurchased | - | - | ||||||||||||||
Table of Contents
Item 6. Selected Financial Data
The following selected consolidated financial data is derived from our Consolidated Financial Statements. This data should be read in conjunction with our Consolidated Financial Statements and related notes included in this annual report and with Item 7. Management’s Discussion and Analysis of Financial Condition and Results of Operations. Historical results may not be indicative of future results.
Five-Year Summary
Summary of Operations:
| Year Ended (1) | ||||||||||||||||||||
| (In millions, except per share data) | March 30, 2018 (2) | March 31, 2017 (3) | April 1, 2016 (4) | April 3, 2015 | March 28, 2014 | |||||||||||||||
| Net revenues | $ | 4,834 | $ | 4,019 | $ | 3,600 | $ | 3,956 | $ | 4,183 | ||||||||||
| Operating income (loss) | $ | 49 | $ | (100 | ) | $ | 457 | $ | 154 | $ | 144 | |||||||||
| Income (loss) from continuing operations (2) | $ | 1,127 | $ | (236 | ) | $ | (821 | ) | $ | 109 | $ | 91 | ||||||||
| Income from discontinued operations, net of income taxes (4) | $ | 11 | $ | 130 | $ | 3,309 | $ | 769 | $ | 807 | ||||||||||
| Net income (loss) | $ | 1,138 | $ | (106 | ) | $ | 2,488 | $ | 878 | $ | 898 | |||||||||
| Income (loss) per share — basic: (5) | ||||||||||||||||||||
| Continuing operations | $ | 1.83 | $ | (0.38 | ) | $ | (1.23 | ) | $ | 0.16 | $ | 0.13 | ||||||||
| Discontinued operations | $ | 0.02 | $ | 0.21 | $ | 4.94 | $ | 1.12 | $ | 1.16 | ||||||||||
| Net income (loss) per share — basic | $ | 1.85 | $ | (0.17 | ) | $ | 3.71 | $ | 1.27 | $ | 1.29 | |||||||||
| Income (loss) per share — diluted: (5) | ||||||||||||||||||||
| Continuing operations | $ | 1.69 | $ | (0.38 | ) | $ | (1.23 | ) | $ | 0.16 | $ | 0.13 | ||||||||
| Discontinued operations | $ | 0.02 | $ | 0.21 | $ | 4.94 | $ | 1.10 | $ | 1.15 | ||||||||||
| Net income (loss) per share — diluted | $ | 1.70 | $ | (0.17 | ) | $ | 3.71 | $ | 1.26 | $ | 1.28 | |||||||||
| Cash dividends declared per common share | $ | 0.30 | $ | 0.30 | $ | 4.60 | $ | 0.60 | $ | 0.60 |
Consolidated Balance Sheets Data:
| (In millions) | March 30, 2018 | March 31, 2017 | April 1, 2016 | April 3, 2015 | March 28, 2014 | |||||||||||||||
| Cash, cash equivalents and short-term investments | $ | 2,162 | $ | 4,256 | $ | 6,025 | $ | 3,860 | $ | 4,084 | ||||||||||
| Total assets | $ | 15,759 | $ | 18,174 | $ | 11,767 | $ | 13,233 | $ | 13,539 | ||||||||||
| Long-term debt | $ | 5,026 | $ | 6,876 | $ | 2,207 | $ | 1,746 | $ | 2,095 | ||||||||||
| Total stockholders’ equity | $ | 5,023 | $ | 3,487 | $ | 3,676 | $ | 5,935 | $ | 5,797 |
| (1) | We have a 52/53-week fiscal year. Our fiscal 2015 was a 53-week year, whereas fiscal 2018, 2017, 2016 and 2014 each consisted of 52 weeks. |
|---|
| (2) | In fiscal 2018, we sold our WSS and PKI solutions and recognized a gain of $653 million before income taxes associated with the sale (see Note 3 to the Consolidated Financial Statements) and we recognized an income tax benefit of $659 million as a result of the enactment of the Tax Cuts and Jobs Act (H.R.1) (see Note 10 to the Consolidated Financial Statements). |
|---|
| (3) | In fiscal 2017, we acquired Blue Coat, Inc. (“Blue Coat”) and LifeLock, Inc. (“LifeLock”) and the results of operations of those entities were included from their respective dates of acquisition (see Note 3 to the Consolidated Financial Statements). |
|---|
| (4) | In fiscal 2016, we recorded $1.1 billion in income tax expense related to unremitted earnings of foreign subsidiaries from the proceeds of the sale of our divested information management business (“Veritas”). This charge was presented in loss from |
|---|
Table of Contents
| continuing operations in the Consolidated Statements of Operations (see Note 10 to the Consolidated Financial Statements). As a result of the sale, a net gain of $3.0 billion was presented as part of income from discontinued operations, net of income taxes (see Note 3 to the Consolidated Financial Statements). |
|---|
| (5) | Net income per share amounts may not add due to rounding. |
|---|
Item 7. Management’s Discussion and Analysis of Financial Condition and Results of Operations
Please read the following discussion and analysis of our financial condition and results of operations together with our Consolidated Financial Statements and related Notes thereto included under Item 15 of this Annual Report on Form 10-K.
OVERVIEW
Fiscal calendar and basis of presentation
We have a 52/53-week fiscal year ending on the Friday closest to March 31. Unless otherwise stated, references to years in this report relate to fiscal year ended March 30, 2018, March 31, 2017 and April 1, 2016, each of which was a 52-week year.
Key financial metrics
The following table provides our key financial metrics for continuing operations for fiscal 2018 compared with fiscal 2017:
| (In millions, except for percentages and per share amounts) | Fiscal 2018 | Fiscal 2017 | ||||||
| Net revenues | $ | 4,834 | $ | 4,019 | ||||
| Operating income (loss) | $ | 49 | $ | (100 | ) | |||
| Income (loss) from continuing operations | $ | 1,127 | $ | (236 | ) | |||
| Income (loss) per share from continuing operations — diluted | $ | 1.69 | $ | (0.38 | ) | |||
| Cash, cash equivalent and short-term investments | $ | 2,162 | $ | 4,256 | ||||
| Net cash provided by (used in) continuing operating activities | $ | 957 | $ | (145 | ) | |||
| Deferred revenue | $ | 3,103 | $ | 2,787 |
| • | Net revenues grew 20% in fiscal 2018 compared to fiscal 2017 primarily as a result of the inclusion of revenue from our consumer identity and information protection products acquired at the end of fiscal 2017 for a full year and increased revenues from sales of our enterprise network and web security solutions which included products acquired in our fiscal 2017 acquisition, partially offset by a decrease in revenue as a result of the divestiture of our WSS and PKI solutions. See Note 14 to the Consolidated Financial Statements for further information on our products and services revenues. |
|---|
| • | Operating income increased primarily as a result of increased net revenues and our cost reduction initiatives and integration synergy program we announced in fiscal 2017. This increase was partially offset by increased operating expenses as a result of acquisitions of Blue Coat and LifeLock, including stock-based compensation, amortization of intangible assets, and advertising and promotional expenses. The increase in operating income was also partially offset by increased transition costs primarily due to costs related to our enterprise resource planning and supporting systems and separation costs related to the divestiture of our WSS and PKI solutions. |
|---|
Table of Contents
| • | Income from continuing operations and diluted income per share from continuing operations increased primarily as a result of the $653 million gain on the divestiture of our WSS and PKI solutions and a net tax benefit of $690 million primarily as a result of the Tax Cuts and Jobs Act (H.R.1) (the “Act”). Partially offsetting the increase in the diluted income per share from continuing operations was a higher diluted share count due to including the dilutive effect of potentially issuable common shares under our equity award programs and convertible debt. Such potentially issuable common shares were excluded from our net loss per share computation in fiscal 2017 as they would have been anti-dilutive. |
|---|
| • | Cash, cash equivalents and short-term investments decreased primarily as a result of our $3.2 billion of debt repayments as part of our plan to deleverage our balance sheet and $401 million paid for acquisitions, partially offset by $933 million in net cash proceeds from the divestiture of our WSS and PKI solutions and cash flow from continuing operating activities of $957 million. |
|---|
| • | Cash flow from continuing operating activities increased primarily due to a one-time tax payment of $887 million related to the gain on sale from the divestiture of our information management business (“Veritas”) in fiscal 2017 and an increase in deferred revenue. |
|---|
| • | Deferred revenue increased $316 million, primarily due to our shift in sales contracts to a higher mix of solutions subject to ratable versus point in time revenue recognition and longer contract duration in our Enterprise Security segment, which resulted in less in-period revenue recognized, and due to higher billings towards the end of the fiscal year, reflecting seasonal sales cycles in that segment. These factors were partially offset by a decrease of $319 million in deferred revenue as a result of the divestiture of our WSS and PKI solutions. |
|---|
CRITICAL ACCOUNTING POLICIES AND ESTIMATES
The preparation of our Consolidated Financial Statements and related notes in accordance with generally accepted accounting principles in the U.S. (“GAAP”) requires us to make estimates, including judgments and assumptions that affect the reported amounts of assets, liabilities, revenue, and expenses, and related disclosure of contingent assets and liabilities. We have based our estimates on historical experience and on various assumptions that we believe to be reasonable under the circumstances. We evaluate our estimates on a regular basis and make changes accordingly. Management believes that the accounting estimates employed and the resulting amounts are reasonable; however, actual results may differ from these estimates. Making estimates and judgments about future events is inherently unpredictable and is subject to significant uncertainties, some of which are beyond our control. Should any of these estimates and assumptions change or prove to have been incorrect, it could have a material impact on our results of operations, financial position and cash flows.
A summary of our significant accounting policies is included in Note 1 of the Notes to Consolidated Financial Statements included in this Annual Report on Form 10-K. An accounting policy is deemed to be critical if it requires an accounting estimate to be made based on assumptions about matters that are highly uncertain at the time the estimate is made, if different estimates reasonably could have been used, or if changes in the estimate that are reasonably possible could materially impact the financial statements. Management believes the following critical accounting policies reflect the significant estimates and assumptions used in the preparation of our Consolidated Financial Statements.
Revenue recognition
We recognize revenue primarily pursuant to the requirements under the authoritative guidance on software revenue recognition, and any applicable amendments or modifications. Revenue recognition requirements in the software industry are very complex and require us to make estimates and assumptions.
Table of Contents
We enter into arrangements that can include various combinations of software and non-software elements. Where elements are delivered over different periods of time, and when allowed under GAAP, revenue is allocated to the respective elements based on their relative selling prices at the inception of the arrangement, and revenue is recognized as each element is delivered. We use a hierarchy to determine the fair value to be used for allocating revenue to non-software elements: (i) vendor-specific objective evidence of fair value (“VSOE”), (ii) third-party evidence, and (iii) estimated selling price (“ESP”). For software elements, we follow the industry-specific software guidance which only allows for the use of VSOE in establishing fair value. VSOE of each element is based on the price for which the undelivered element is sold separately by us. We determine fair value of the undelivered elements based on historical evidence of our stand-alone sales of these elements to third parties or from the stated renewal rate for the undelivered elements. When VSOE does not exist for serial undelivered items, the entire arrangement fee is recognized ratably over the performance period. When VSOE does not exist for a discrete undelivered item, consideration for the entire arrangement is deferred until that item is delivered. Our deferred revenue consists primarily of the unamortized balance of enterprise product maintenance, consumer product content updates, managed security services, subscriptions, and arrangements where VSOE does not exist. Changes to the elements in a software arrangement, the ability to identify VSOE for those elements, the fair value of the respective elements, and increasing flexibility in contractual arrangements could materially impact the amount recognized in the current period and deferred over time. ESPs for non-software elements are established as best estimates of what the selling prices would be if the deliverables were sold regularly on a stand-alone basis. Our process for determining ESPs requires judgment and considers multiple factors that may vary over time depending upon the unique facts and circumstances related to each deliverable.
Valuation of goodwill, intangible assets and long-lived assets
Business combinations. We allocate the purchase price of acquired businesses to the tangible and identifiable intangible assets acquired and liabilities assumed based on their estimated fair values on the acquisition date. Any residual purchase price is recorded as goodwill. Goodwill is allocated to reporting units expected to benefit from the business combination. The allocation of purchase price requires management to make significant estimates and assumptions in determining the fair values of the assets acquired and liabilities assumed especially with respect to intangible assets.
Critical estimates in valuing intangible assets include, but are not limited to, future expected cash flows from customer relationships, developed technology, trade names and acquired patents; and discount rates. Management estimates of fair value are based upon assumptions believed to be reasonable, but which are inherently uncertain and unpredictable. Unanticipated events and circumstances may occur which may affect the accuracy or validity of such assumptions, estimates or actual results.
Income taxes
We are subject to tax in multiple U.S. and foreign tax jurisdictions. We are required to estimate the current tax exposure as well as assess the temporary differences between the accounting and tax treatment of assets and liabilities, including items such as accruals and allowances not currently deductible for tax purposes. We apply judgment in the recognition and measurement of current and deferred income taxes which includes the following critical accounting estimates.
We use a two-step process to recognize liabilities for uncertain tax positions. The first step is to evaluate the tax position for recognition by determining if the weight of available evidence indicates that it is more likely than not that the position will be sustained on audit, including resolution of related appeals or litigation processes, if any. If we determine that the tax position will more likely than not be sustained on audit, the second step requires us to estimate and measure the tax benefit as the largest
Table of Contents
amount that is more than 50% likely to be realized upon ultimate settlement. It is inherently difficult and subjective to estimate such amounts, as this requires us to determine the probability of various outcomes. We re-evaluate these uncertain tax positions on a quarterly basis. This evaluation is based on factors including, but not limited to, changes in facts or circumstances, changes in tax law, effectively settled issues under audit, and new audit activity. Such a change in recognition or measurement would result in the recognition of a tax benefit or an additional charge to the tax provision in the period.
As of March 30, 2018, we have not completed our accounting for the tax effects of enactment of the Act; however, in certain cases, as described below, we have made a reasonable estimate of the effects on our existing deferred tax balances and the one-time transition tax. These amounts may require further adjustments as a result of additional future guidance from the U.S. Department of the Treasury, changes in our assumptions, and the availability of further information and interpretations. In other cases, we have not been able to make a reasonable estimate and we continue to account for those items based on our existing accounting policies and the provisions of the tax laws that were in effect immediately prior to enactment. For the items for which we were able to determine a reasonable estimate, we recognized a provisional tax benefit of $659 million, which is included as a component of income tax expense from continuing operations. This includes an income tax benefit of $1.6 billion resulting from the application of the Act to existing deferred tax balances, including a reduction of the previously accrued deferred tax liability for foreign earnings by $1.4 billion. This was partially offset by $893 million of tax expense that was recorded for the one-time transition tax liability under the Act.
Stock-based compensation
Stock-based compensation expense is measured at the grant date based on the fair value of the award. We recognize stock-based compensation cost over the award’s requisite service period on a straight-line basis except for performance-based restricted stock units (“PRUs”) with graded vesting which we recognize on a graded basis. For awards with performance conditions, the amount of compensation cost we recognize over the requisite service period is based on the actual achievement of the performance condition or management’s best estimate of the achievement if not yet known. No compensation cost is ultimately recognized for forfeited awards in which employees do not render the requisite service. We estimate the number of stock-based awards that will be forfeited due to employee turnover. Our forfeiture assumption is primarily based on historical experience.
The fair value of each restricted stock unit (“RSU”) and PRU that does not contain a market condition is equal to the market value of our common stock on the date of grant. The fair value of each PRU that contains a market condition is estimated using the Monte Carlo simulation option pricing model. The fair values of RSUs and PRUs are not discounted by the dividend yield because our RSUs and PRUs are entitled to dividend equivalents to be paid in the form of cash upon vesting for each share of the underlying unit.
We use the Black-Scholes model to determine the fair value of unvested stock options assumed in acquisitions and the fair value of rights to acquire shares of common stock under our employee stock purchase plan (“ESPP”). The determination of the fair value of awards using the Black-Scholes model is affected by our stock price as well as assumptions regarding a number of complex and subjective variables. If the acquired companies lack sufficient historical exercise data to provide a reasonable basis upon which to estimate expected term, we estimate the expected life of assumed options using the “simplified method”. For vested options, this represents the midpoint between the valuation date and the contractual term. For unvested options, this represents the midpoint between the average vesting time and full contractual term. Expected volatility is based on the average of historical volatility over the most recent period commensurate with the expected life of the option and the implied volatility of traded options. The risk-free interest rate is equal to the U.S. Treasury rates for the period equal to the expected life. The options assumed are without dividend equivalents and their fair values are discounted by our dividend yield.
Table of Contents
We will continue to use judgment in evaluating the assumptions related to our stock-based compensation on a prospective basis. As we continue to accumulate additional data related to our common stock, we may have refinements to our estimates which could materially impact our future stock-based compensation expense.
Loss contingencies
We are subject to contingencies that expose us to losses, including various legal and regulatory proceedings, asserted and potential claims that arise in the ordinary course of business. An estimated loss from such contingencies is recognized as a charge to income if it is probable that a liability has been incurred and the amount of the loss can be reasonably estimated. Judgment is required in both the determination of probability and the determination as to whether a loss is reasonably estimable. We review the status of each significant matter quarterly and we may revise our estimates. Until the final resolution of such matters, there may be an exposure to loss in excess of the amount recorded, and such amounts could be material. Should any of our estimates and assumptions change or prove to have been incorrect, it could have a material impact on our consolidated financial statements for that reporting period.
RESULTS OF OPERATIONS
The following table sets forth our Consolidated Statements of Operations data as a percentage of net revenues for the periods indicated:
| Fiscal Year | ||||||||||||
| 2018 | 2017 | 2016 | ||||||||||
| Net revenues | 100 | % | 100 | % | 100 | % | ||||||
| Cost of revenues | 21 | 21 | 17 | |||||||||
| Gross profit | 79 | 79 | 83 | |||||||||
| Operating expenses: | ||||||||||||
| Sales and marketing | 33 | 36 | 36 | |||||||||
| Research and development | 20 | 20 | 21 | |||||||||
| General and administrative | 12 | 14 | 8 | |||||||||
| Amortization of intangible assets | 5 | 4 | 2 | |||||||||
| Restructuring, transition and other costs | 8 | 7 | 4 | |||||||||
| Total operating expenses | 78 | 81 | 70 | |||||||||
| Operating income (loss) | 1 | (2) | 13 | |||||||||
| Interest expense | (5) | (5) | (2) | |||||||||
| Gain on divestiture | 14 | - | - | |||||||||
| Other income (expense), net | (0) | 1 | 0 | |||||||||
| Income (loss) from continuing operations before income taxes | 9 | (7) | 11 | |||||||||
| Income tax expense (benefit) | (14) | (1) | 34 | |||||||||
| Income (loss) from continuing operations | 23 | (6) | (23) | |||||||||
| Income from discontinued operations, net of income taxes | 0 | 3 | 92 | |||||||||
| Net income (loss) | 24 | % | (3) | % | 69 | % | ||||||
Note: The percentages may not add due to rounding.
Net revenues
| Fiscal Year | Variance in % | |||||||||||||||||||
| (In millions, except for percentages) | 2018 | 2017 | 2016 | 2018 vs. 2017 | 2017 vs. 2016 | |||||||||||||||
| Net revenues | $ | 4,834 | $ | 4,019 | $ | 3,600 | 20 | % | 12 | % |
Table of Contents
Fiscal 2018 compared to fiscal 2017
Net revenues increased $815 million, attributable to increases of $616 million from our Consumer Digital Safety segment and $199 million from our Enterprise Security segment, net of the impact of the divestiture of our WSS and PKI solutions. The increase in revenue from our Consumer Digital Safety segment was primarily a result of the inclusion of revenue from our identity and information protection products acquired at the end of fiscal 2017 for a full year.
Fiscal 2017 compared to fiscal 2016
Net revenues increased $419 million, primarily due to an increase of $425 million in revenue from our Enterprise Security segment as a result of the acquisition of Blue Coat during the second quarter of fiscal 2017.
Net revenues by geographical region
Percentage of revenue by geographic region as presented below is based on the billing location of the customer.
| Fiscal Year | ||||||||||||
| 2018 | 2017 | 2016 | ||||||||||
| Americas | 63 | % | 58 | % | 59 | % | ||||||
| EMEA | 22 | % | 24 | % | 25 | % | ||||||
| APJ | 16 | % | 18 | % | 16 | % |
Note: The Americas include U.S., Canada and Latin America; EMEA includes Europe, Middle East and Africa; APJ includes Asia Pacific and Japan. The percentages may not add up to 100% due to rounding.
Fiscal 2018 compared to fiscal 2017
Our percentage of revenue from the Americas increased, primarily as a result of the inclusion of revenue from our identity and information protection products acquired at the end of fiscal 2017 for a full year as sales of these products are generated entirely in the United States.
Fiscal 2017 compared to fiscal 2016
The geographical distribution of our revenue was relatively consistent in fiscal 2017 compared to fiscal 2016.
Cost of revenues
| Fiscal Year | Variance in % | |||||||||||||||||||
| (In millions, except for percentages) | 2018 | 2017 | 2016 | 2018 vs. 2017 | 2017 vs. 2016 | |||||||||||||||
| Cost of revenues | $ | 1,032 | $ | 853 | $ | 615 | 21 | % | 39 | % |
Fiscal 2018 compared to fiscal 2017
Our cost of revenues increased $179 million primarily due to an increase related to our network and web security solutions and consumer identity and information protection products that were acquired in fiscal 2017, including $88 million of increased amortization of acquired intangible assets and $60 million of increased technical support costs primarily driven by the consumer identity and information protection products, and an increase of $30 million in royalty fees.
Table of Contents
Fiscal 2017 compared to fiscal 2016
Our cost of revenues increased $238 million primarily due to $122 million of increased amortization of acquired intangible assets and increased other costs related to sales of our network and web security solutions and consumer identity and information protection products that were acquired in fiscal 2017, including an acquired product inventory fair value write-up of $24 million. These increases in cost of revenues were partially offset by decreased costs related to Veritas of $22 million.
Operating expenses
| Fiscal Year | Variance in % | |||||||||||||||||||
| (In millions, except for percentages) | 2018 | 2017 | 2016 | 2018 vs. 2017 | 2017 vs. 2016 | |||||||||||||||
| Sales and marketing | $ | 1,593 | $ | 1,459 | $ | 1,292 | 9 | % | 13 | % | ||||||||||
| Research and development | 956 | 823 | 748 | 16 | % | 10 | % | |||||||||||||
| General and administrative | 574 | 564 | 295 | 2 | % | 91 | % | |||||||||||||
| Amortization of intangible assets | 220 | 147 | 57 | 50 | % | 158 | % | |||||||||||||
| Restructuring, transition and other costs | 410 | 273 | 136 | 50 | % | 101 | % | |||||||||||||
| Total | $ | 3,753 | $ | 3,266 | $ | 2,528 | 15 | % | 29 | % | ||||||||||
Fiscal 2018 compared to fiscal 2017
Sales and marketing expense increased $134 million primarily due to increases of $148 million in advertising and promotional expense, largely related to promotion of our identity and information protection products, and $58 million in stock-based compensation expense. These increases were partially offset by the decreased expenses from our divested WSS and PKI solutions.
Research and development expense increased $133 million primarily due to increases of $90 million in stock-based compensation expense and $27 million in salary and benefits expense as a result of higher headcount.
General and administrative expense increased $10 million primarily due to a $35 million increase in salary and benefits expense as a result of higher headcount, a $15 million increase in stock-based compensation expense and increased cybersecurity and compliance costs, partially offset by a decrease of $41 million in acquisition-related and integration expenses due to a lower level of acquisition activities in fiscal 2018.
Stock-based compensation expense reported in operating expenses increased $163 million to $582 million in fiscal 2018 from $419 million in fiscal 2017, primarily due to the equity awards granted in connection with our fiscal 2018 and 2017 acquisitions.
Amortization of intangible assets increased $73 million primarily due to the intangible assets acquired in our fiscal 2017 acquisitions.
Restructuring, transition and other costs increased $137 million, primarily due to an increase of $178 million in transition costs, including increases of $90 million in costs primarily related to our enterprise resource planning and supporting systems and other transformation initiatives and $88 million in separation costs related to the sale of our WSS and PKI solutions.
Fiscal 2017 compared to fiscal 2016
Sales and marketing expense increased $167 million primarily as a result of our fiscal 2017 acquisitions and included increases of $54 million in stock-based compensation expense and
Table of Contents
$24 million in integration expense. These increases were partially offset by a reduction of expenses from new and ongoing cost savings initiatives and decreased costs related to Veritas of $88 million.
Research and development expense increased $75 million primarily as a result of the acquisition of Blue Coat and included an increase of $54 million in stock-based compensation expense. This increase was partially offset by a reduction of expenses from new and ongoing cost savings initiatives and decreased costs related to Veritas of $44 million.
General and administrative expense increased $269 million primarily as a result of the acquisition of Blue Coat and included an increase of $160 million in stock-based compensation expense. In addition, we incurred higher acquisition-related and integration expenses of $79 million. These increases were partly offset by a reduction of expenses from new and ongoing cost savings initiatives and decreased costs related to Veritas of $32 million.
Our stock-based compensation in operating expenses increased $268 million to $419 million in fiscal 2018 from $151 million in fiscal 2017, primarily due to the equity awards granted in connection with the Blue Coat and LifeLock acquisitions, and the expected level of achievement for PRUs granted in fiscal 2017.
Amortization of intangible assets increased $90 million primarily due to the $2.9 billion of intangible assets acquired in the Blue Coat and LifeLock acquisitions.
Restructuring, transition and other costs increased $137 million, primarily due to increases of $60 million in advisory fees incurred in connection with restructuring events and facilities exit costs and $52 million in severance costs as we initiated a restructuring plan during fiscal 2017.
Non-operating income (expense), net
| Fiscal Year | ||||||||||||
| (In millions) | 2018 | 2017 | 2016 | |||||||||
| Interest expense | $ | (256 | ) | $ | (208 | ) | $ | (75 | ) | |||
| Gain on divestiture | 653 | - | - | |||||||||
| Other income (expense), net | (9 | ) | 46 | 10 | ||||||||
| Total other income (expense), net | $ | 388 | $ | (162 | ) | $ | (65 | ) | ||||
Fiscal 2018 compared to fiscal 2017
Non-operating income (expense), net, increased, primarily due to a $653 million gain as a result of the divestiture of our WSS and PKI solutions, partially offset by an increase of $48 million in interest expense primarily due to increased interest associated with the debt issued in fiscal 2017, an increase of $26 million in net foreign currency loss, and a $26 million loss from our equity method investment received in connection with the divestiture of our WSS and PKI solutions.
Fiscal 2017 compared to fiscal 2016
Non-operating expense, net, increased, primarily due to an increase of $133 million in interest expense, mainly related to our increased borrowings in fiscal 2017. This increase was partially offset by an increase of $14 million in income, net of direct costs, from transition services provided to Veritas.
Provision for income taxes
We are a U.S.-based multinational company subject to tax in multiple U.S. and international tax jurisdictions. A substantial portion of our international earnings were generated from subsidiaries
Table of Contents
organized in Ireland and Singapore. Our results of operations would be adversely affected to the extent that our geographical mix of income becomes more weighted toward jurisdictions with higher tax rates and would be favorably affected to the extent the relative geographic mix shifts to lower tax jurisdictions. Any change in our mix of earnings is dependent upon many factors and is therefore difficult to predict.
| Fiscal Year | ||||||||||||
| (In millions, except for percentages) | 2018 | 2017 | 2016 | |||||||||
| Income (loss) from continuing operations before income taxes | $ | 437 | $ | (262 | ) | $ | 392 | |||||
| Provision for (benefit from) income taxes | $ | (690 | ) | $ | (26 | ) | $ | 1,213 | ||||
| Effective tax rate on income from continuing operations | (158 | )% | 10 | % | 309 | % |
Fiscal 2018 compared to fiscal 2017
The decrease in our effective tax rate in fiscal 2018 as compared to fiscal 2017 was primarily due to a provisional tax benefit of $659 million, which is included as a component of income tax expense from continuing operations. This includes an income tax benefit of $1,552 million resulting from the application of the Act to existing deferred tax balances, including a reduction of the previously accrued deferred tax liability for foreign earnings by $1,420 million, partially offset by $893 million of tax expense that was recorded for the one-time transition tax liability under the Act.
Fiscal 2017 compared to fiscal 2016
The decrease in our effective tax rate in fiscal 2017 as compared to fiscal 2016 was primarily driven by tax expense of $1.1 billion in fiscal 2016 for providing U.S. taxes on certain undistributed foreign earnings, primarily those attributable to the sale of Veritas, partially offset by tax expense of $52 million in fiscal 2017 related to the loss of tax attributes as a result of restructuring activities.
See Note 10 to the Consolidated Financial Statements for more information.
Segment operating results
We do not allocate to our operating segments certain operating expenses that we manage separately at the corporate level and are not used in evaluating the results of, or in allocating resources to, our segments. These unallocated expenses primarily consist of unallocated corporate charges related to Veritas in fiscal 2016 and stock-based compensation expense, amortization of intangible assets, restructuring, transition and other costs, and acquisition-related costs in all periods presented. See Note 14 for more information.
Enterprise Security Segment
| Fiscal Year | Variance in % | |||||||||||||||||||
| (In millions, except for percentages) | 2018 | 2017 | 2016 | 2018 vs. 2017 | 2017 vs. 2016 | |||||||||||||||
| Net revenues | $ | 2,554 | $ | 2,355 | $ | 1,930 | 8 | % | 22 | % | ||||||||||
| Percentage of total net revenues | 53 | % | 59 | % | 54 | % | ||||||||||||||
| Operating income | $ | 473 | $ | 187 | $ | 102 | 153 | % | 83 | % | ||||||||||
| Operating margin | 19 | % | 8 | % | 5 | % |
Fiscal 2018 compared to fiscal 2017
Revenue increased $199 million, primarily due to increases of $331 million in revenue from sales of our network and web security solutions and $36 million from sales of endpoint and information
Table of Contents
protection solutions, partially offset by a $184 million decrease in revenue as a result of the divestiture of our WSS and PKI solutions. Revenue during fiscal 2018 was also unfavorably affected by a shift in the mix of sales towards subscription and cloud-delivered solutions subject to ratable revenue recognition, which resulted in less in-period recognized revenue and more revenue deferred to the balance sheet as compared to fiscal 2017. Operating income increased $286 million, primarily due to higher revenue discussed above, a $51 million decrease in sales and marketing expenses and a $38 million decrease in cost of revenues.
Fiscal 2017 compared to fiscal 2016
Revenue increased $425 million, primarily due to a $422 million increase from sales of our network and web security solutions, primarily as a result of our acquisition of Blue Coat. Operating income increased $85 million, primarily due to higher revenue and a reduction of expenses from cost savings initiatives. These increases were partially offset by expenses associated with the Blue Coat acquisition in the post-acquisition period, and the cost of revenues from acquired inventory write-ups related to the Blue Coat acquisition of $24 million.
Consumer Digital Safety Segment
| Fiscal Year | Variance in % | |||||||||||||||||||
| (In millions, except for percentages) | 2018 | 2017 | 2016 | 2018 vs. 2017 | 2017 vs. 2016 | |||||||||||||||
| Net revenues | $ | 2,280 | $ | 1,664 | $ | 1,670 | 37 | % | - | % | ||||||||||
| Percentage of total net revenues | 47 | % | 41 | % | 46 | % | ||||||||||||||
| Operating income | $ | 1,111 | $ | 839 | $ | 924 | 32 | % | (9 | )% | ||||||||||
| Operating margin | 49 | % | 50 | % | 55 | % |
Fiscal 2018 compared to fiscal 2017
Revenue increased $616 million due to a $639 million increase in revenue from sales of our identity and information protection products acquired at the end of fiscal 2017, offset by a $23 million decrease in revenue related to our consumer security products. Our revenue growth reflects the benefit of the shift to subscription-based contracts and bundling of our consumer products, which is helping to mitigate the trend of declining revenues from sales of stand-alone security products. Operating income increased $272 million, primarily due to sales of our identity and information protection products, partially offset by higher related cost of sales and operating expenses.
Fiscal 2017 compared to fiscal 2016
Revenue decreased $6 million due to a decline in revenue from sales of consumer security products of $83 million as the revenue generated from customer additions was not sufficient to replace revenue lost through customer attrition. This decline was mostly offset by a $77 million increase in revenue due to sales of our identity and information protection products acquired in the acquisition of LifeLock. Operating income decreased $85 million, primarily due to the consumer security revenue decline coupled with increased operating expenses as a result of the LifeLock acquisition.
Table of Contents
LIQUIDITY, CAPITAL RESOURCES AND CASH REQUIREMENTS
Liquidity
We have historically relied on cash generated from operations, borrowings under credit facilities, issuances of debt, and proceeds from divestitures for our liquidity needs.
As of March 30, 2018, we had cash, cash equivalents and short-term investments of $2.2 billion, of which $1.3 billion was held by our foreign subsidiaries. Our cash, cash equivalents and short-term investments are managed with the objective to preserve principal, maintain liquidity, and generate investment returns. Under the transition tax of the Act, we have treated all previously untaxed foreign earnings as taxable in the U.S. and as a result we recorded a provisional liability for the one-time transition tax, payable over eight years, of $896 million in fiscal 2018. The move to a participation exemption system under the Act allows us to make distributions of non-U.S. earnings to the U.S. without incurring additional U.S. federal tax, however these distributions may be subject to applicable state or non-U.S. taxes. We have not recognized deferred income taxes for local country income and withholding taxes that could be incurred on distributions of certain non-U.S. earnings or for outside basis differences in our subsidiaries, because we plan to indefinitely reinvest such earnings and basis differences.
We also have an undrawn credit facility of $1.0 billion which expires in May 2021.
Our principal cash requirements are primarily to meet our working capital needs, support on-going business activities, including the payment of taxes, fund capital expenditures, service existing debt, and invest in business acquisitions. As a part of our plan to deleverage our balance sheet, we may from time to time make optional repayments of our debt obligations, which may include repurchases of our outstanding debt, depending on various factors such as market conditions.
Our capital allocation strategy is to balance driving shareholder returns, managing financial risk, and preserving our flexibility to pursue strategic options, including acquisitions. Historically this has included a quarterly cash dividend, the repayment of debt and the repurchase of our common stock.
Cash flows
The following table summarizes our cash flow activities:
| Year Ended | ||||||||||||
| (In millions) | March 30, 2018 | March 31, 2017 | April 1, 2016 | |||||||||
| Net cash provided by (used in): | ||||||||||||
| Continuing operating activities | $ | 957 | $ | (145 | ) | $ | 1,462 | |||||
| Continuing investing activities | $ | (21 | ) | $ | (6,766 | ) | $ | 7,236 | ||||
| Continuing financing activities | $ | (3,475 | ) | $ | 5,280 | $ | (4,740 | ) | ||||
| Increase (decrease) in cash and cash equivalents | $ | (2,473 | ) | $ | (1,736 | ) | $ | 3,109 |
Cash from continuing operating activities
Our primary source of cash from operations has been from cash collections from our customers. Due to seasonality, our billings are generally higher in our third and fourth fiscal quarters and lower in our first and second fiscal quarters. Cash inflows are affected by fluctuations in our billings and timing of the related collections.
Our primary uses of cash include payments for operating expenses and income taxes, payments to our resellers and distribution partners, and other on-going business activities.
Table of Contents
Our cash flows from operations in fiscal 2018 were $957 million, compared to cash used of $145 million in fiscal 2017. Our cash flows for fiscal 2018 reflected net income of $1.1 billion adjusted by non-cash amortization and depreciation of $640 million, stock-based compensation of $610 million, offset by a deferred tax benefit of $1.8 billion, primarily as a result of the enactment of the Act in December 2017, and a gain on divestiture of $653 million. Our cash flows for fiscal 2017 reflected a net loss of $106 million, adjusted by non-cash amortization and depreciation of $492 million, stock-based compensation of $440 million, offset by a deferred tax provision of $168 million.
Changes in operating assets and liabilities consisted primarily of:
Accounts receivable increased $170 million in fiscal 2018, compared to a decrease of $45 million in fiscal 2017, reflecting higher billings in the last month of fiscal 2018 and our shift in sales to solutions with ratable revenue recognition in our Enterprise Security segment.
Deferred revenue increased $541 million in fiscal 2018, compared to an increase of $125 million in fiscal 2017, reflecting the factors discussed in the Overview.
Income taxes payable increased $880 million in fiscal 2018, compared to a decrease of $871 million in fiscal 2017. The increase in fiscal 2018 reflected the one-time transition tax of $896 million discussed above, while the decrease in fiscal 2017 was primarily the result of a one-time tax payment of $887 million related to the gain on sale from the divestiture of Veritas.
The decrease in cash flow from continuing operating activities in fiscal 2017 compared to fiscal 2016 was primarily due to net loss from continuing operation of $106 million in fiscal 2017, compared to net income of $2.5 billion in fiscal 2016, as well as a higher adjustment to net income for deferred taxes in fiscal 2016. In addition, income taxes payable decreased $871 million in fiscal 2017, reflecting the cash payment for taxes as a result of the gain on sale from the divestiture of Veritas, compared to an increase in tax payable of $742 million in fiscal 2016.
Cash from continuing investing activities
Our cash flows from continuing investing activities consisted primarily of proceeds from divestitures, payments for acquisitions, and net purchases of short-term investments. Our investing activities in fiscal 2018 included $933 million in net cash proceeds from the divestiture of our WSS and PKI solutions, partially offset by $401 million paid for acquisitions and net purchases of $387 million of short-term investments, while our investing activities in fiscal 2017 primarily included $6.7 billion paid for the Blue Coat and LifeLock acquisitions.
Our investing activities in fiscal 2016 primarily included proceeds from the divestiture of Veritas of $6.5 billion and net proceeds from short-term investments of $1.0 billion.
Cash from continuing financing activities
Our financing cash flows consist primarily of issuances and repayments of debt, payment of dividends and dividend equivalents to stockholders, stock repurchases, and tax payments related to shares withheld in the settlement of RSUs. Our financing activities in fiscal 2018 primarily consisted of debt repayments of $3.2 billion, while our financing activities in fiscal 2017 primarily consisted of net proceeds from borrowings of $6.1 billion.
Our financing activities in fiscal 2016 primarily consisted of payments of dividends and dividend equivalents of $3.0 billion and repurchases of common stock of $1.9 billion.
Table of Contents
Cash requirements
Debt - As of March 30, 2018, our total outstanding principal amount of indebtedness was $5.1 billion, summarized as follows. Our Senior Term Loans are pre-payable, and we expect to continue to focus on repayment in fiscal 2019. See Note 7 to the Consolidated Financial Statements for further information on our debt.
| (In millions) | March 30, 2018 | |||
| Senior Term Loans | $ | 1,100 | ||
| Senior Notes | 2,250 | |||
| Convertible Senior Notes | 1,750 | |||
| Total debt | $ | 5,100 | ||
Dividends - On May 10, 2018, we announced a cash dividend of $0.075 per share of common stock to be paid in June 2018. On August 2, 2018, we announced a cash dividend of $0.075 per share of common stock to be paid in September 2018. Any future dividends will be subject to the approval of our Board of Directors. See Note 11 to the Consolidated Financial Statements for more information on our dividends and dividend equivalents.
Share repurchases - Under our stock repurchase programs, we may purchase shares of our outstanding common stock through open market and through accelerated stock repurchase transactions. As of March 30, 2018, the remaining balance of our share repurchase authorization is $800 million and does not have an expiration date. See Note 11 to the Consolidated Financial Statements for more information on our share repurchases.
Contractual obligations
The following is a schedule of our significant contractual obligations as of March 30, 2018:
| Payments Due by Period | ||||||||||||||||||||
| (In millions) | Total | Less than 1 Year | 1 - 3 Years | 3 - 5 Years | Over 5 Years | |||||||||||||||
| Debt (1) | $ | 5,100 | $ | - | $ | 1,850 | $ | 2,150 | $ | 1,100 | ||||||||||
| Interest payments on debt (2) | 788 | 180 | 318 | 153 | 137 | |||||||||||||||
| Purchase obligations (3) (4) | 659 | 496 | 126 | 31 | 6 | |||||||||||||||
| Long-term income taxes payable (5) | 896 | 72 | 144 | 144 | 536 | |||||||||||||||
| Operating leases (6) | 253 | 78 | 92 | 46 | 37 | |||||||||||||||
| Total | $ | 7,696 | $ | 826 | $ | 2,530 | $ | 2,524 | $ | 1,816 | ||||||||||
| (1) | See Note 7 to the Consolidated Financial Statements for further information on our debt. |
|---|
| (2) | Interest payments were calculated based on the contractual terms of the related Senior Notes, Convertible Senior Notes and Senior Term Facilities. Interest on variable rate debt was calculated using the interest rate in effect as of March 30, 2018. See Note 7 to the Consolidated Financial Statements for further information on the Senior Notes, Convertible Senior Notes and Senior Term Facilities. |
|---|
| (3) | These amounts are associated with agreements for purchases of goods or services generally including agreements that are enforceable and legally binding and that specify all significant terms, including fixed or minimum quantities to be purchased; fixed, minimum, or variable price provisions; and the approximate timing of the transaction. The table above also includes agreements to purchase goods or services that have cancellation provisions requiring little or no payment. The amounts under such contracts are included in the table above because management believes that cancellation of these contracts is unlikely, and we expect to make future cash payments according to the contract terms or in similar amounts for similar materials. |
|---|
Table of Contents
| (4) | Purchase obligations do not include future minimum contractual obligations related to a five-year purchase agreement with a service provider for a total contract value of $500 million that we entered into in September 2018. |
|---|
| (5) | These amounts represent the transition tax on previously untaxed foreign earnings of foreign subsidiaries under the Act which may be paid in installments over an eight-year period. See Note 10 to the Consolidated Financial Statements for further information on our income taxes and the impact from the recently enacted legislation. |
|---|
| (6) | We have entered into various non-cancelable operating lease agreements that expire on various dates through fiscal 2029. The amounts in the table above exclude expected sublease income. |
|---|
Due to the uncertainty with respect to the timing of future cash flows associated with our unrecognized tax benefits and other long-term taxes as of March 30, 2018 we are unable to make reasonably reliable estimates of the period of cash settlement with the respective taxing authorities. Therefore, $302 million in long-term income taxes payable has been excluded from the contractual obligations table. See Note 10 to the Consolidated Financial Statements for further information.
Fiscal 2019 Restructuring Plan
On August 2, 2018, we announced a restructuring plan under which we will initiate targeted reductions of our global workforce of up to approximately 8%. We estimate that we will incur total costs in connection with the restructuring plan of approximately $50 million, primarily for severance and termination benefits. These actions are expected to be completed in fiscal 2019.
Indemnifications
In the ordinary course of business, we may provide indemnifications of varying scope and terms to customers, vendors, lessors, business partners, subsidiaries and other parties with respect to certain matters, including, but not limited to, losses arising out of our breach of agreements or representations and warranties made by us. Refer to Note 15 to the Consolidated Financial Statements for further information on our indemnifications.
Item 7A. Quantitative and Qualitative Disclosures about Market Risk
We are exposed to various market risks related to fluctuations in interest rates and foreign currency exchange rates. We may use derivative financial instruments to mitigate certain risks in accordance with our investment and foreign exchange policies. We do not use derivatives or other financial instruments for trading or speculative purposes.
Interest rate risk
Our short-term investments primarily consist of corporate bonds. An increase in interest could have an adverse impact on its market value. As of March 30, 2018, the fair value of our short-term investments was $388 million. A hypothetical increase in the corporate bonds’ yield curve of 50 basis points would not result in a significant reduction in fair value.
As of March 30, 2018, we had $4.0 billion in aggregate principal amount of fixed-rate Senior Notes and Convertible Senior Notes outstanding, with a carrying amount and a fair value of $3.9 billion, based on Level 2 inputs. Since these notes bear interest at fixed rates, they do not result in any financial statement risk associated with changes in interest rates. However, the fair value of these notes fluctuates when interest rates change.
As of March 30, 2018, we also had $1.1 billion outstanding debt with variable interest rates based on the London InterBank Offered Rate (“LIBOR”). A reasonably possible hypothetical adverse change of 50 basis points in LIBOR would not result in a significant increase in interest expense on an annualized basis.
Table of Contents
In addition, we have a $1.0 billion revolving credit facility that if drawn bears interest at a variable rate based on LIBOR and would be subject to the same risks associated with adverse changes in LIBOR.
Foreign currency exchange rate risk
We conduct business in numerous currencies through our worldwide operations and, as such, we are exposed to foreign currency risk. Our entities conduct their businesses in the primary local currency in which they operate; however, they may also conduct business in other currencies. To the extent our entities hold monetary assets or liabilities, earn revenues or incur costs in currencies other than the entity’s functional currency, they are exposed to foreign exchange gains or losses and impacts to operating results as a result. As part of our foreign currency risk mitigation strategy, we have entered into foreign exchange forward contracts with up to six months in duration to help mitigate foreign exchange risk; however, we are not able to hedge our foreign currency exposure in a manner that entirely offsets the effects of the changes in foreign exchange rates. We have considered historical trends in exchange rates and determined that it is possible that adverse changes in exchange rates for any currency could occur. As of March 30, 2018 and March 31, 2017, we had open foreign currency forward contracts with notional amounts of $848 million and $696 million, respectively. A hypothetical ten percent depreciation of foreign currency would result in a reduction in fair value of $55 million and $29 million for fiscal 2018 and fiscal 2017, respectively. This analysis disregards the possibilities that the rates can move in opposite directions and that losses from one geographic area may be offset by gains from another geographic area.
Table of Contents
Item 8. Financial Statements and Supplementary Data
The Consolidated Financial Statements and related disclosures included in Part IV, Item 15 of this annual report are incorporated by reference into this Item 8.
Selected Quarterly Financial Data (Unaudited)
| Fiscal 2018 | Fiscal 2017 | |||||||||||||||||||||||||||||||
| (In millions, except per share data) | Fourth Quarter | Third Quarter (1) | Second Quarter | First Quarter | Fourth Quarter | Third Quarter | Second Quarter | First Quarter | ||||||||||||||||||||||||
| Net revenues | $ | 1,210 | $ | 1,209 | $ | 1,240 | $ | 1,175 | $ | 1,115 | $ | 1,041 | $ | 979 | $ | 884 | ||||||||||||||||
| Gross profit | 946 | 960 | 978 | 918 | 856 | 806 | 769 | 735 | ||||||||||||||||||||||||
| Operating income (loss) | 6 | 96 | (9 | ) | (44 | ) | (178 | ) | (16 | ) | (12 | ) | 106 | |||||||||||||||||||
| Income tax expense (benefit) | (7 | ) | (606 | ) | (53 | ) | (24 | ) | (71 | ) | (5 | ) | 19 | 31 | ||||||||||||||||||
| Income (loss) from continuing operations | (58 | ) | 1,311 | (16 | ) | (110 | ) | (177 | ) | (56 | ) | (69 | ) | 66 | ||||||||||||||||||
| Income (loss) from discontinued operations, net of income taxes | (1 | ) | 31 | 4 | (23 | ) | 34 | 102 | (75 | ) | 69 | |||||||||||||||||||||
| Net income (loss) | (59 | ) | 1,342 | (12 | ) | (133 | ) | (143 | ) | 46 | (144 | ) | 135 | |||||||||||||||||||
| Income (loss) per share — basic: (2) | ||||||||||||||||||||||||||||||||
| Continuing operations | $ | (0.09 | ) | $ | 2.12 | $ | (0.03 | ) | $ | (0.18 | ) | $ | (0.29 | ) | $ | (0.09 | ) | $ | (0.11 | ) | $ | 0.11 | ||||||||||
| Discontinued operations | $ | (0.00 | ) | $ | 0.05 | $ | 0.01 | $ | (0.04 | ) | $ | 0.06 | $ | 0.16 | $ | (0.12 | ) | $ | 0.11 | |||||||||||||
| Net income (loss) per share — basic | $ | (0.10 | ) | $ | 2.17 | $ | (0.02 | ) | $ | (0.22 | ) | $ | (0.23 | ) | $ | 0.07 | $ | (0.23 | ) | $ | 0.22 | |||||||||||
| Income (loss) per share — diluted: (2) | ||||||||||||||||||||||||||||||||
| Continuing operations | $ | (0.09 | ) | $ | 1.97 | $ | (0.03 | ) | $ | (0.18 | ) | $ | (0.29 | ) | $ | (0.09 | ) | $ | (0.11 | ) | $ | 0.11 | ||||||||||
| Discontinued operations | $ | (0.00 | ) | $ | 0.05 | $ | 0.01 | $ | (0.04 | ) | $ | 0.06 | $ | 0.16 | $ | (0.12 | ) | $ | 0.11 | |||||||||||||
| Net income (loss) per share — diluted | $ | (0.10 | ) | $ | 2.01 | $ | (0.02 | ) | $ | (0.22 | ) | $ | (0.23 | ) | $ | 0.07 | $ | (0.23 | ) | $ | 0.22 |
| (1) | During the third quarter of fiscal 2018, we recognized a gain on divestiture of our WSS and PKI solutions of $658 million and an income tax benefit of $810 million as a result of the enactment of the Act. |
|---|
| (2) | Net income (loss) per share amounts may not add due to rounding. |
|---|
Item 9. Changes in and Disagreements with Accountants on Accounting and Financial Disclosure
None.
Table of Contents
Item 9A. Controls and Procedures
| a) | Evaluation of Disclosure Controls and Procedures |
|---|
The SEC defines the term “disclosure controls and procedures” to mean a company’s controls and other procedures that are designed to ensure that information required to be disclosed in the reports that it files or submits under the Exchange Act is recorded, processed, summarized, and reported, within the time periods specified in the SEC’s rules and forms. “Disclosure controls and procedures” include, without limitation, controls and procedures designed to ensure that information required to be disclosed by an issuer in the reports that it files or submits under the Exchange Act is accumulated and communicated to the issuer’s management, including its principal executive and principal financial officers, or persons performing similar functions, as appropriate to allow timely decisions regarding required disclosure. Our disclosure controls and procedures are designed to provide reasonable assurance that such information is accumulated and communicated to our management. Our management (with the participation of our Chief Executive Officer and Chief Financial Officer) has conducted an evaluation of the effectiveness of our disclosure controls and procedures (as defined in Rules 13a-15(e) and 15d-15(e) of the Securities Exchange Act). Based on such evaluation, our Chief Executive Officer and our Chief Financial Officer have concluded that our disclosure controls and procedures were effective at the reasonable assurance level as of the end of the period covered by this report.
| b) | Management’s Report on Internal Control over Financial Reporting |
|---|
Our management is responsible for establishing and maintaining adequate internal control over financial reporting (as defined in Rules 13a-15(f) and 15d-15(f) of the Exchange Act) for Symantec. Our management, with the participation of our Chief Executive Officer and our Chief Financial Officer, has conducted an evaluation of the effectiveness of our internal control over financial reporting as of March 30, 2018, based on criteria established in Internal Control - Integrated Framework (2013) issued by the Committee of Sponsoring Organizations of the Treadway Commission (“COSO”).
Our management has concluded that, as of March 30, 2018, our internal control over financial reporting was effective at the reasonable assurance level based on these criteria.
The effectiveness of our internal control over financial reporting as of March 30, 2018 has been audited by KPMG LLP, an independent registered public accounting firm, as stated in their report, which is included in Part IV, Item 15 of this Annual Report on Form 10-K.
| c) | Changes in Internal Control over Financial Reporting |
|---|
There were no changes in our internal control over financial reporting during the quarter ended March 30, 2018, that have materially affected, or are reasonably likely to materially affect, our internal control over financial reporting.
| d) | Limitations on Effectiveness of Controls |
|---|
Our management, including our Chief Executive Officer and Chief Financial Officer, does not expect that our disclosure controls and procedures or our internal controls will prevent all errors and all fraud. A control system, no matter how well conceived and operated, can provide only reasonable, not absolute, assurance that the objectives of the control system are met. Further, the design of a control system must reflect the fact that there are resource constraints, and the benefits of controls must be considered relative to their costs. Because of the inherent limitations in all control systems, no evaluation of controls can provide absolute assurance that all control issues and instances of fraud, if any, within our company have been detected.
Item 9B. Other Information
Item 10. Directors, Executive Officers and Corporate Governance
Criteria for Nomination to the Board
The Nominating and Governance Committee of our Board of Directors (the “Board”) will consider candidates submitted by Symantec stockholders, as well as candidates recommended by directors and management, for nomination to the Board. The Nominating and Governance Committee has generally identified nominees based upon recommendations by outside directors, management and executive recruiting firms. The goal of the Nominating and Governance Committee is to assemble a Board that offers a diverse portfolio of perspectives, backgrounds, experiences, knowledge and skills derived from high-quality business and professional experience. The Nominating and Governance Committee annually reviews the appropriate skills and characteristics required of directors in the context of the current composition of the Board, our operating requirements and the long-term interests of our stockholders.
Two of our director-nominees for our 2018 Annual Meeting of Stockholders (“the Annual Meeting”) have been nominated pursuant to an agreement we entered into with Starboard Value LP on September 16, 2018. For more information about this agreement, see “Agreement with Starboard Value LP” below.
The key attributes, experience and skills we consider important for our directors in light of our current business and structure are:
| • | Industry and Technology Expertise. As a cybersecurity company, understanding new technologies and emerging industry trends or having experience in security and related technologies is useful in understanding our business and the market segments in which we compete, our research and development efforts, competing technologies, the various products and processes that we develop, and evolving customer requirements. |
|---|
| • | Global Expertise. We are a global organization with employees, offices and customers in many countries. Directors with global operating expertise can provide a useful business and cultural perspective regarding many significant aspects of our business. |
|---|
| • | Leadership Experience. Directors who have served in a senior leadership position, as a general manager of a business or as the functional leader of a global sales, marketing or product development organization, are important to us, because they bring experience and perspective in analyzing, shaping, and overseeing the execution of important strategic, operational and policy issues at a senior level. |
|---|
| • | Public Company Board Experience. Directors who have served on other public company boards can offer advice and insights with regard to the dynamics and operation of a board of directors, the relations of a board to the company’s chief executive officer and other senior management personnel and the importance of public-company corporate governance, including oversight matters, strategic decisions and operational and compliance-related matters. |
|---|
| • | Business Combinations and Partnerships Experience. Directors who have a background in mergers and acquisitions and strategic partnership transactions can provide insight into developing and implementing strategies for growing our business through combinations or partnerships with other organizations. |
|---|
Table of Contents
| • | Financial Expertise. Knowledge of financial markets, financial operations, and accounting and financial reporting processes is important because it assists our directors in understanding, advising, and overseeing Symantec’s capital structure, financing and investing activities, financial reporting, and internal control of such activities. |
|---|
| • | Diversity. In addition to a diverse portfolio of professional background, experiences, knowledge and skills, the composition of the Board should reflect the benefits of diversity as to gender, race, and ethnic background. |
|---|
In addition to the brief biographical descriptions set forth under “Our Board of Directors” below, we include under “Director Qualifications” the key individual attributes, experience and skills of each of our directors that led to the conclusion that each director should serve as a member of the Board at this time.
Our Board of Directors
Our Board currently consists of thirteen directors, eleven of whom expect to be nominated for election at our 2018 Annual Meeting of Stockholders (the “Annual Meeting”), including ten independent directors and our Chief Executive Officer. Each director is elected to serve a one-year term, with all directors subject to annual election. Robert S. Miller, a member of our Board since 1994, and Geraldine B. Laybourne, a member of our Board since 2008, are not standing for reelection at the Annual Meeting. These directors are identified below, along with their ages at October 10, 2018 and other information.
| Name | Age | Principal Occupation | Director Since | |||||||
| Gregory S. Clark | 53 | Chief Executive Officer | 2016 | |||||||
| Frank E. Dangeard | 60 | Managing Partner, Harcourt | 2007 | |||||||
| Peter A. Feld | 39 | Managing Member and Head of Research, Starboard Value LP | 2018 | |||||||
| Dale L. Fuller | 60 | Operating Partner, The Riverside Company | 2018 | |||||||
| Kenneth Y. Hao | 50 | Managing Partner and Managing Director, Silver Lake Partners | 2016 | |||||||
| David W. Humphrey | 41 | Managing Director, Bain Capital | 2016 | |||||||
| Geraldine B. Laybourne | 71 | Chairman of the Board, Katapult Studio | 2008 | |||||||
| David L. Mahoney | 64 | Director | 2003 | |||||||
| Robert S. Miller | 76 | Former President and Chief Executive Officer, International Automotive Components Group | 1994 | |||||||
| Anita M. Sands | 42 | Director | 2013 | |||||||
| Daniel H. Schulman | 60 | President and Chief Executive Officer, PayPal Holdings, Inc. | 2000 | |||||||
| V. Paul Unruh | 70 | Director | 2005 | |||||||
| Suzanne M. Vautrinot | 58 | President, Kilovolt Consulting Inc. | 2013 |
Mr. Clark has served as our Chief Executive Officer and a member of our Board since 2016. Prior to joining Symantec, he served as the Chief Executive Officer of Blue Coat, which we acquired in 2016, and as a member of Blue Coat’s board of directors from 2011 to August 2016. From 2008 to 2011, Mr. Clark was the President and Chief Executive Officer of Mincom, a global software and service provider to asset-intensive industries. Before joining Mincom, he was a Founder and served as President and Chief Executive Officer of E2open, a provider of cloud-based supply chain software, from 2001 until 2008. Earlier in his career, Mr. Clark founded a security software firm, Dascom, which was acquired by IBM in 1999. Mr. Clark previously served on the boards of directors of Imperva, Inc. from May 2014 through August 2015 and Emulex Corporation from 2013 through its acquisition by Avago Technologies Ltd. in 2015. He served as a distinguished engineer and Vice President of IBM’s Tivoli Systems, a division providing security and management products, from 1999 until 2001. Mr. Clark holds a Bachelor’s degree from Griffith University.
Table of Contents
Director Qualifications:
| • | Industry and Technology Experience — Chief Executive Officer of Symantec Corporation; former Chief Executive Officer of Blue Coat and former President and Chief Executive Officer of Mincom. |
|---|
| • | Global Experience — Chief Executive Officer of Symantec Corporation; former Chief Executive Officer of Blue Coat and former President and Chief Executive Officer of Mincom. |
|---|
| • | Leadership Experience — Chief Executive Officer of Symantec Corporation; former Chief Executive Officer of Blue Coat; former President and Chief Executive Officer of Mincom and Founder, President and Chief Executive Officer of E2open. |
|---|
| • | Public Company Board Experience — former member of the board of directors of Imperva, Inc. and Emulex Corporation. |
|---|
| • | Business Combinations and Partnerships Experience — Chief Executive Officer of Symantec Corporation; former Chief Executive Officer of Blue Coat; former President and Chief Executive Officer of Mincom and Founder, President and Chief Executive Officer of E2open. |
|---|
| • | Financial Experience — Chief Executive Officer of Symantec Corporation; former Chief Executive Officer of Blue Coat; former President and Chief Executive Officer of Mincom and Founder, President and Chief Executive Officer of E2open. |
|---|
Mr. Dangeard has served as a member of our Board since 2007. He has been the Managing Partner of Harcourt, an advisory firm, since 2008. Mr. Dangeard was Chairman and Chief Executive Officer of Thomson, a provider of digital video technologies, solutions and services, from 2004 to 2008. From 2002 to 2004, he was Deputy Chief Executive Officer of France Telecom, a global telecommunications operator. From 1997 to 2002, Mr. Dangeard was Senior Executive Vice President of Thomson and served as its Vice Chairman in 2000. Prior to joining Thomson, he was Managing Director of SG Warburg & Co. Ltd. from 1989 to 1997 in London, Paris and Madrid and Chairman of SG Warburg France from 1995 to 1997. Prior to that, Mr. Dangeard was a lawyer with Sullivan & Cromwell, in New York and London. He serves on the boards of Arqiva PLC, Royal Bank of Scotland Group PLC (“RBS Group”), as chairman of the board of directors of Nat West Markets PLC, the investment bank of the RBS Group, and on a number of advisory boards. Mr. Dangeard has previously served as a director of a variety of companies, including Crédit Agricole CIB, Eutelsat, Home Credit, SonaeCom, Thomson, Electricité de France and Telenor. He graduated from the École des Hautes Études Commerciales, the Paris Institut d’Études Politiques and holds an LLM degree from Harvard Law School.
Director Qualifications:
| • | Industry and Technology Experience — former Chairman and Chief Executive Officer of Thomson; former Deputy Chief Executive Officer of France Telecom; former Deputy Chairman of Telenor; former member of the boards of directors of Eutelsat, SonaeCom and RPX Corporation. |
|---|
| • | Global Experience — member of the board of directors of RBS Group (UK), of Arqiva (UK) and chairman of NatWest Markets (UK); former Chairman and Chief Executive Officer of Thomson (France); former Deputy Chief Executive Officer of France Telecom (France); former Deputy Chairman of Telenor (Norway) and former member of the boards of directors of Crédit Agricole CIB (France), Eutelsat (France), Home Credit (Czech Republic), Electricité de France (France) and SonaeCom (Portugal). |
|---|
Table of Contents
| • | Leadership Experience — Managing Partner of Harcourt; former Chairman and Chief Executive Officer of Thomson; former Deputy Chief Executive Officer of France Telecom; former Deputy Chairman of Telenor and former Chairman of SG Warburg France and Managing Director of SG Warburg & Co. Ltd; Chairman of NatWest Markets. |
|---|
| • | Public Company Board Experience —member of the board of directors of RBS Group; former Deputy Chairman of Telenor and former member of the boards of directors of Eutelsat, Electricité de France, Thomson, and SonaeCom. |
|---|
| • | Business Combinations and Partnerships Experience — former Chairman and Chief Executive Officer of Thomson; former Deputy Chief Executive Officer of France Telecom; former Deputy Chairman of Telenor; former Chairman of SG Warburg France and former lawyer at Sullivan & Cromwell LLP. |
|---|
| • | Financial Experience — former Chairman and Chief Executive Officer of Thomson; former Deputy Chief Executive Officer of France Telecom; former Chairman of the Audit Committee of Electricité de France and former Deputy Chairman of Telenor; member of the board of RBS Group; Chairman of NatWest Markets. |
|---|
Mr. Feld has served as a member of our Board since September 2018. Mr. Feld has served as a Managing Member and Head of Research of Starboard Value LP since 2011. Mr. Feld previously served on the boards of directors of several technology companies, including Marvell Technology Group Ltd. from May 2016 to June 2018, The Brink’s Company from January 2016 to November 2017, Insperity, Inc. from March 2015 to June 2017, Darden Restaurants, Inc. from October 2014 to September 2015, Tessera Technologies, Inc. (n/k/a Xperi Corporation) from 2013 to April 2014, Integrated Device Technology, Inc. from 2012 to February 2014 and Unwired Planet, Inc. (n/k/a Great Elm Capital Group, Inc.) from 2011 to March 2014 and as Chairman from 2011 to 2013. Mr. Feld received a Bachelor of Arts degree in Economics from Tufts University.
Director Qualifications:
| • | Industry and Technology Experience —member of the boards of directors of many public and private technology companies. |
|---|
| • | Global Expertise — Managing Member and the Head of Research of Starboard Value LP; former member of the board of directors of Marvell Technology Group, Insperity, Inc., and Darden Restaurants, Inc. |
|---|
| • | Leadership Experience — Managing Member and the Head of Research of Starboard Value LP. |
|---|
| • | Public Company Board Experience — former member of the boards of directors of Marvell Technology Group, Insperity, Inc., and Darden Restaurants, Inc. |
|---|
| • | Business Combinations and Partnerships Experience — Managing Member and the Head of Research of Starboard Value LP. |
|---|
| • | Financial Experience — over 10 years of capital markets and corporate governance experience. |
|---|
Mr. Fuller has served as a member of our Board since September 2018. Mr. Fuller has served as an Operating Partner at the Riverside Company, a private equity firm, since 2013 and on the board of
Table of Contents
directors of comScore, Inc., a media measurement and analytics company, since March 2018, and as Chairman of the board of directors of MobiSocial, Inc., a technology startup, since 2013. Mr. Fuller previously served on the boards of directors of several technology companies, including Quantum Corporation from September 2014 to March 2017 and AVG Technologies N.V. from 2008 to October 2016 and as Chairman from 2009 to October 2016. Mr. Fuller holds an honorary doctorate degree from St. Petersburg State University and a Bachelor of Science degree from Pacific College.
Director Qualifications:
| • | Industry and Technology Experience — member of the boards of directors of many public and private technology companies. |
|---|
| • | Global Experience — former member of the boards of directors of Quantum Corporation, AVG Technologies, N.V., Zoran Corporation and Phoenix Technologies, Ltd. |
|---|
| • | Leadership Experience — Operating Partner at the Riverside Company, prior president and CEO of MokaFive and member of the boards of directors of numerous major technology companies. |
|---|
| • | Public Company Board Experience —member of the boards of directors of comScore; former board member of Quantum Corporation and AVG Technologies. |
|---|
| • | Business Combinations and Partnerships Experience — former member of the boards of directors of Quantum Corporation, AVG Technologies, N.V., Zoran Corporation and Phoenix Technologies, Ltd. |
|---|
| • | Financial Experience — over 10 years of capital markets and corporate governance experience. |
|---|
Mr. Hao has served as a member of our Board since 2016. Mr. Hao joined Silver Lake Partners in 2000 and currently serves Silver Lake as a Managing Partner and Managing Director. Mr. Hao also serves on the boards of directors of SMART Global Holdings, Inc., as well as on the boards of directors of a number of private companies in Silver Lake’s portfolio. Prior to joining Silver Lake, he was an investment banker with Hambrecht & Quist, where he served as a Managing Director in the Technology Investment Banking group. He also serves on the Executive Council for UCSF Health. Mr. Hao graduated from Harvard University with a Bachelor’s degree in economics.
Director Qualifications:
| • | Industry and Technology Experience — over 25 years of technology investment experience; member of the boards of directors of many public and private technology companies. |
|---|
| • | Global Experience — extensive experience investing in large global businesses and established Silver Lake’s Asia business. |
|---|
| • | Leadership Experience — Managing Partner and Managing Director of Silver Lake and member of the boards of directors of numerous major technology companies. |
|---|
| • | Public Company Board Experience —member of the board of directors of SMART Global Holdings, Inc.; former board member of Broadcom Limited and Netscout Systems. |
|---|
Table of Contents
| • | Business Combinations and Partnerships Experience — Managing Partner and Managing Director of Silver Lake Partners and former investment banker with Hambrecht & Quist. |
|---|
| • | Financial Experience — over 25 years of investment experience in complex transactions. |
|---|
Mr. Humphrey has served as a member of our Board since August 2016 when he joined in connection with Bain Capital’s investment in Symantec, prior to which he served on Blue Coat’s board of directors since May 2015. He is a Managing Director of Bain Capital, a private equity firm, where he co-leads the firm’s investing efforts in technology, media and telecom investments and where he has worked since 2001. Prior to joining Bain Capital, Mr. Humphrey was an investment banker in the mergers and acquisitions group at Lehman Brothers from 1999 to 2001. He serves on the boards of directors of BMC Software and Genpact Ltd. and on the board of directors of a number of private companies in Bain Capital’s portfolio. Mr. Humphrey previously served on the boards of directors of Bright Horizons Family Solutions, Inc. Burlington Coat Factory Warehouse Corporation, Skillsoft PLC and Bloomin’ Brands, Inc. He received a Master of Business Administration degree from Harvard Business School and a Bachelor’s degree from Harvard University.
Director Qualifications:
| • | Industry and Technology Experience — former member of the board of directors of Blue Coat; Managing Director of Bain Capital; and member of the boards of directors of BMC Software, Inc., Viewpoint Construction Software, Navicure, Inc. and Genpact Ltd. |
|---|
| • | Global Experience — extensive experience investing in large global businesses. |
|---|
| • | Leadership Experience — Managing Director of Bain Capital and leader of its technology, media and telecom vertical; and member of the boards of directors of BMC Software, Inc. Viewpoint Construction Software, Navicure, Inc. and Genpact Ltd. |
|---|
| • | Public Company Board Experience —member of the board of directors of BMC Software and Genpact Ltd. and former member of the boards of directors of Bright Horizons Family Solutions, Inc. Burlington Coat Factory Warehouse Corporation, Skillsoft PLC and Bloomin’ Brands, Inc. |
|---|
| • | Business Combinations and Partnerships Experience — Managing Director of Bain Capital and former investment banker with Lehman Brothers. |
|---|
| • | Financial Experience — Managing Director of Bain Capital and former investment banker with Lehman Brothers. |
|---|
Ms. Laybourne has served as a member of our Board since January 2008. She has been the Chairman of the Board of Katapult Studio (formerly Kandu), a children’s software company, since May 2013, and was acting Chief Executive Officer from October 2014 to May 2015. Ms. Laybourne was the Chairman of the Board of Alloy, Inc., which later merged into Defy Media, LLC, a media company, from November 2010 to April 2015. She founded Oxygen Media in 1998 and served as its Chairman and Chief Executive Officer until November 2007, when the network was acquired by NBC Universal. Prior to starting Oxygen Media, Ms. Laybourne spent 16 years at Nickelodeon. From 1996 to 1998, she was President of Disney/ABC Cable Networks where she managed cable programming for the Walt Disney Company and ABC. Ms. Laybourne is also currently a member of the board of directors of four private companies, serves on the Board of Trustees for Vassar College, and is a former member of the board of directors of J.C. Penney, Electronic Arts and Move, Inc. She earned a Bachelor’s degree in art history from Vassar College and a Master of Science degree in elementary education from the University of Pennsylvania. Ms. Laybourne will not stand for re-election at the Annual Meeting.
Table of Contents
Director Qualifications:
| • | Leadership Experience — Chairman of Katapult Studio; Founder and former Chairman and Chief Executive Officer of Oxygen Media LLC; former President of Disney/ABC Cable Networks; former President of Nickelodeon and former Vice Chairman of MTV Networks. |
|---|
| • | Public Company Board Experience — former board member of J.C. Penney Company, Electronic Arts Inc. and Move, Inc. |
|---|
| • | Business Combinations and Partnerships Experience — Founder, former Chairman and Chief Executive Officer of Oxygen Media LLC until it was acquired by NBC Universal. |
|---|
Mr. Mahoney has served as a member of our Board since 2003. He previously served as co-Chief Executive Officer of McKesson HBOC, Inc., a healthcare services company, and as Chief Executive Officer of iMcKesson LLC, also a healthcare services company, from 1999 to 2001. Mr. Mahoney is a member of the boards of directors of Adamas Pharmaceuticals, Inc. Corcept Therapeutics Incorporated, and Mercy Corps, a non-profit organization, the board of trustees of Mount Holyoke College, as well as a trustee of the Schwab/Laudus fund family and the San Francisco Museum of Modern Art. He has previously served as a director of a variety of companies, including Tercica Inc. Mr. Mahoney has a Bachelor’s degree from Princeton University and a Master of Business Administration degree from Harvard Business School.
Director Qualifications:
| • | Industry and Technology Experience — former co-Chief Executive Officer of McKesson HBOC, Inc.; former Chief Executive Officer of iMcKesson LLC; various executive roles at McKesson Corporation and former Principal at McKinsey & Co. |
|---|
| • | Global Experience — former co-Chief Executive Officer of McKesson HBOC, Inc.; former Chief Executive Officer of iMcKesson LLC; various executive roles at McKesson Corporation and former Principal at McKinsey & Co. |
|---|
| • | Leadership Experience — former co-Chief Executive Officer of McKesson HBOC, Inc.; former Chief Executive Officer of iMcKesson LLC; various executive roles at McKesson Corporation and former Principal at McKinsey & Co. |
|---|
| • | Public Company Board Experience —member of the board of directors of Corcept Therapeutics Incorporated; Lead Independent Director at Adamas Pharmaceuticals, Inc. and former member of the board of directors of Tercica, Inc. |
|---|
| • | Business Combinations and Partnerships Experience — former co-Chief Executive Officer of McKesson HBOC, Inc.; former Chief Executive Officer of iMcKesson LLC; various executive roles at McKesson Corporation and former Principal at McKinsey & Co. |
|---|
| • | Financial Experience — former roles at McKesson HBOC; serves on the Audit Committee of Corcept Therapeutics Incorporated (former Chair of the Audit Committee) and the Investment Committee of the Schwab/Laudus fund family; served on the Audit Committees of Tercica Inc., Adamas Pharmaceuticals, Inc., Symantec, and is Chair of the Finance Committee of Mercy Corps and San Francisco Museum of Modern Art. |
|---|
Mr. Miller has served as a member of our Board since September 1994. Mr. Miller is also the Chairman of the Board of MidOcean Partners, a private equity firm specializing in leveraged buyouts,
Table of Contents
recapitalizations and growth capital investments in middle-market companies and has served on the Board of the Dow Chemical Company since 2015. Mr. Miller previously served as the President and Chief Executive Officer of International Automotive Components (IAC) Group, a global supplier of automotive components and systems, from August 2015 through September 2018. He served as Chairman of the Board of American International Group (AIG), an insurance and financial services organization, from July 2010 to June 2015. Mr. Miller served as Chief Executive Officer of Hawker Beechcraft, an aircraft manufacturing company, from February 2012 to February 2013. He served as Executive Chairman of Delphi Corporation, an auto parts supplier, from January 2007 until November 2009 and as Chairman and Chief Executive Officer from July 2005 until January 2007. From January 2004 to June 2005, Mr. Miller was non-executive Chairman of Federal Mogul Corporation, an auto parts supplier. From September 2001 until December 2003, he was Chairman and Chief Executive Officer of Bethlehem Steel Corporation, a large steel producer. Prior to joining Bethlehem Steel, Mr. Miller served as Chairman and Chief Executive Officer on an interim basis upon the departure of Federal Mogul’s top executive in September 2000. Hawker Beechcraft filed a voluntary petition for reorganization under the United States Bankruptcy Code (USBC) in May 2012. In addition to his executive roles, Mr. Miller has previously served as a director of a variety of companies, including AIG, UAL Corporation, WL Ross Holding Corp., Reynolds American, Inc., U.S. Bancorp, and Waste Management, Inc. He earned a degree in economics from Stanford University, a law degree from Harvard Law School and a Master of Business Administration, majoring in finance from Stanford Business School. Mr. Miller will not stand for re-election at the Annual Meeting.
Director Qualifications:
| • | Global Experience — former President and Chief Executive Officer of IAC Group; former Chairman of AIG; former Chief Executive Officer of Hawker Beechcraft, Inc.; former Chief Executive Officer of Delphi Corporation and former Vice Chairman of Chrysler Corporation. |
|---|
| • | Leadership Experience — former President and Chief Executive Officer of IAC Group; Chairman of Mid Ocean Partners; former Chairman of AIG; former Chief Executive Officer of Hawker Beechcraft, Inc.; former Chairman and Chief Executive Officer of Delphi Corporation; former Chairman and Chief Executive Officer of Federal Mogul Corporation and former Chairman and Chief Executive Officer of Bethlehem Steel Corporation. |
|---|
| • | Public Company Board Experience — member of the board of directors of Dow Chemical and former member of the boards of directors of AIG, UAL Corporation, WL Ross Holding Corp., Reynolds American, Inc., U.S. Bancorp and Waste Management, Inc. |
|---|
| • | Business Combinations and Partnerships Experience — former President and Chief Executive Officer of IAC Group; former Chief Executive Officer of Hawker Beechcraft, Inc., Delphi Corporation and Federal Mogul Corporation and former Vice Chairman of Chrysler Corporation. |
|---|
| • | Financial Experience — former Chief Financial Officer of Chrysler Corporation and served on the Audit Committees of AIG, UAL Corporation, Reynolds American, Waste Management, U.S. Bancorp, Federal Mogul Corporation and Pope & Talbot. |
|---|
Ms. Sands has served as a member of our Board since October 2013. She served as Group Managing Director, Head of Change Leadership and a member of the Wealth Management Americas Executive Committee of UBS Financial Services, a global financial services firm, from April 2012 to September 2013. Ms. Sands was Group Managing Director and Chief Operating Officer of Wealth Management Americas at UBS Financial Services from April 2010 to April 2012. Prior to that, she was a Transformation Consultant at UBS Financial Services from October 2009 to April 2010. Prior to
Table of Contents
joining UBS Financial Services, Ms. Sands was Managing Director, Head of Transformation Management at Citigroup’s Global Operations and Technology organization. She also held several leadership positions with RBC Financial Group and CIBC. Ms. Sands is on the boards of directors of ServiceNow, Inc., Pure Storage, Inc. and two private companies. She received a Bachelor’s degree in physics and applied mathematics from The Queen’s University of Belfast, Northern Ireland, a Doctorate in atomic and molecular physics from The Queen’s University of Belfast, Northern Ireland and a Master of Science degree in public policy and management from Carnegie Mellon University.
Director Qualifications:
| • | Industry and Technology Experience — former Managing Director and Chief Operating Officer at UBS Financial Services and various executive positions of global financial services firms. |
|---|
| • | Global Experience — former Managing Director and Chief Operating Officer at UBS Financial Services and various executive positions of global financial services firms. |
|---|
| • | Leadership Experience — former Managing Director and Chief Operating Officer at UBS Financial Services and various executive positions of global financial services firms. |
|---|
| • | Public Company Board Experience —member of the boards of directors of ServiceNow, Inc. and Pure Storage, Inc. |
|---|
| • | Financial Experience — former Managing Director and Chief Operating Officer at UBS Financial Services and various executive positions of global financial services firms. |
|---|
Mr. Schulman has served as a member of our Board since 2000. He has served as President and then Chief Executive Officer of PayPal Holdings, Inc., an online payment system company, since September 2014. Previously, Mr. Schulman served as Group President, Enterprise Group of American Express, a financial services company, from 2010 to September 2014. He was President, Prepaid Group of Sprint Nextel Corporation, a cellular phone service provider, from 2009 until 2010. Mr. Schulman served as Chief Executive Officer of Virgin Mobile USA, a cellular phone service provider, from 2001 to 2009, when Sprint Nextel acquired that company. He also served as a member of the board of directors of Virgin Mobile USA from 2001 to 2009. Mr. Schulman is a member of the boards of directors of PayPal Holdings, Inc., Verizon Communications Inc. and a non-profit organization. He received a Bachelor’s degree in economics from Middlebury College and a Master of Business Administration degree, majoring in Finance, from New York University.
Director Qualifications:
| • | Industry and Technology Experience — President and Chief Executive Officer of PayPal; former Group President, Enterprise Group of American Express and former Chief Executive Officer and Chief Operating Officer of priceline.com. |
|---|
| • | Global Experience — President and Chief Executive Officer of PayPal and former Group President of American Express. |
|---|
| • | Leadership Experience — President and Chief Executive Officer of PayPal; former Group President, Enterprise Group of American Express; former President, Prepaid Group of Sprint Nextel Corporation; former Chief Executive Officer of Virgin Mobile USA and former Chief Executive Officer and Chief Operating Officer of priceline.com. |
|---|
| • | Public Company Board Experience — member of the boards of directors of PayPal Holdings, Inc. and Verizon Communications Inc. and former member of the boards of directors of Virgin Mobile USA and Flextronics International Ltd. |
|---|
Table of Contents
| • | Business Combinations and Partnerships Experience — President and Chief Executive Officer of PayPal and former Chief Executive Officer of Virgin Mobile USA. |
|---|
| • | Financial Experience — President and Chief Executive Officer of PayPal; former Group President, Enterprise Group of American Express; former President, Prepaid Group of Sprint Nextel Corporation; former Chief Executive Officer of Virgin Mobile USA and former Chief Executive Officer and Chief Operating Officer of priceline.com. |
|---|
Mr. Unruh has served as a member of our Board since 2005 following the acquisition of Veritas, where he had served on the board of directors since 2003. Mr. Unruh retired as Vice Chairman of Bechtel Group, Inc., a global engineering and construction services company, in 2003. During his 25-year tenure at Bechtel Group, he held a number of management positions including Treasurer, Controller and Chief Financial Officer. Mr. Unruh also served as President of Bechtel Enterprises, the finance, development and ownership arm from 1997 to 2001. He is a member of the board of directors of Aconex Ltd., which is traded on the Australian Stock Exchange, and a private company. Mr. Unruh is a Certified Public Accountant.
Director Qualifications:
| • | Global Experience — former Vice Chairman of and held various executive positions at Bechtel Group, Inc.; former President of Bechtel Enterprises and member of the board of directors of Aconex Ltd. (Australia). |
|---|
| • | Leadership Experience — former Vice Chairman of and held various executive positions at Bechtel Group, Inc. and former President of Bechtel Enterprises. |
|---|
| • | Public Company Board Experience — former member of the boards of directors of Heidrick & Struggles International Inc., Move, Inc., URS Corporation and Aconex Ltd. (Australia). |
|---|
| • | Business Combinations and Partnerships Experience — former board member of Veritas Corporation, Move, Inc., and URS Corporation. |
|---|
| • | Financial Experience — certified public accountant; former Chief Financial Officer, Treasurer and Controller of Bechtel Group, Inc.; former President of Bechtel Enterprises; served on the Audit Committees of Heidrick & Struggles International, Inc. and Move, Inc. |
|---|
Ms. Vautrinot has served as a member of our Board since 2013. She has been President of Kilovolt Consulting Inc., an advisory firm, since October 2013. Ms. Vautrinot retired from the United States Air Force in October 2013 after over 30 years of service. During her career with the United States Air Force, she served in a number of leadership positions including Major General and Commander, 24th Air Force/Network Operations from 2011 to October 2013; Special Assistant to the Vice Chief of Staff from December 2010 to 2011; Director of Plans and Policy, U.S. Cyber Command from 2010 to 2010 and Deputy Commander, Network Warfare, U.S. Strategic Command, from 2008 and 2010. Ms. Vautrinot is a member of the board of directors of Ecolab, Inc., Wells Fargo & Company, a private company and a non-profit organization. She received a Bachelor of Science degree from the U.S. Air Force Academy, a Master of Systems Management degree from University of Southern California, and completed Air Command and Staff College as well as Air War College. Ms. Vautrinot was a National Security Fellow at the John F. Kennedy School of Government at Harvard University. In 2017 she was inducted into the National Academy of Engineering.
Director Qualifications:
| • | Industry and Technology Experience — Major General and Commander (retired) and various leadership positions of United States Air Force. |
|---|
Table of Contents
| • | Global Experience — Major General and Commander (retired) of United States Air Force; member of the boards of directors of Ecolab, Inc. and Wells Fargo & Company. |
|---|
| • | Leadership Experience — Major General and Commander (retired) and various leadership positions of United States Air Force. |
|---|
| • | Public Company Board Experience — member of the boards of directors of Ecolab, Inc. and Wells Fargo & Company. |
|---|
| • | Financial Experience — serves on the Audit Committees of Ecolab, Inc. and Wells Fargo & Company. |
|---|
Agreement with Starboard Value LP
In September 2018, the Company entered into an agreement with Starboard Value LP and certain of its affiliates (collectively, “Starboard”) regarding, among other things, the membership and composition of the Board and committees thereof (the “Starboard Agreement”). Under the terms of the Starboard Agreement, the Company appointed Peter A. Feld and Dale L. Fuller to serve on the Board and agreed to nominate them for election to the Board at the Annual Meeting. The Starboard Agreement also provides that Robert S. Miller and Geraldine B. Laybourne will not stand for re-election as directors at the Annual Meeting and that, within 30 days after the Annual Meeting, the Company will appoint Richard S. “Rick” Hill to the Board and an additional director to the Board who will be selected by the then-appointed Board from a list of candidates mutually agreed by the Company and Starboard pursuant to the procedures described in the Starboard Agreement. With respect to the Annual Meeting, Starboard has agreed to, among other things, vote all shares of the Company’s common stock beneficially owned by Starboard in favor of the Company’s director nominees and, subject to certain conditions, vote in accordance with the Board’s recommendations on all other proposals.
Pursuant to the Starboard Agreement, if at any time Starboard beneficially owns less than 3.0% of the Company’s then-outstanding common stock (the “Minimum Ownership Threshold”), Mr. Feld (or, if Mr. Feld is no longer serving on the Board, the substitute Starboard employee director who replaced Mr. Feld) will immediately resign from the Board. Furthermore, until the earlier of (x) 15 business days prior to the deadline for the submission of stockholder nominations for the 2019 annual meeting of stockholders and (y) 90 days prior to the first anniversary of the Annual Meeting, for so long as Starboard satisfies the Minimum Ownership Threshold, Starboard also has certain additional rights to recommend or select substitute directors as provided in the Starboard Agreement.
Summary of Director Qualifications and Experience
| Clark | Dangeard | Feld | Fuller | Hao | Humphrey | Laybourne | Mahoney | Miller | Sands | Schulman | Unruh | Vautrinot | ||||||||||||||
| Industry and Technology Expertise | Ö | Ö | Ö | Ö | Ö | Ö | Ö | Ö | Ö | Ö | Ö | |||||||||||||||
| Global Expertise | Ö | Ö | Ö | Ö | Ö | Ö | Ö | Ö | Ö | Ö | Ö | |||||||||||||||
| Leadership Experience | Ö | Ö | Ö | Ö | Ö | Ö | Ö | Ö | Ö | Ö | Ö | Ö | Ö | |||||||||||||
| Public Company Board Experience | Ö | Ö | Ö | Ö | Ö | Ö | Ö | Ö | Ö | Ö | Ö | Ö | Ö | |||||||||||||
| Business Combinations and Partnerships Experience | Ö | Ö | Ö | Ö | Ö | Ö | Ö | Ö | Ö | Ö | Ö | |||||||||||||||
| Financial Expertise | Ö | Ö | Ö | Ö | Ö | Ö | Ö | Ö | Ö | Ö | Ö | Ö | ||||||||||||||
| Diversity | Ö | Ö | Ö | Ö |
Table of Contents
Our Executive Officers
The names of our current executive officers, their ages as of October 10, 2018, and their positions are shown below.
| Name | Age | Position | ||||
| Gregory S. Clark | 53 | Chief Executive Officer | ||||
| Amy L. Cappellanti-Wolf | 53 | Senior Vice President and Chief Human Resources Officer | ||||
| Michael D. Fey | 43 | President and Chief Operating Officer | ||||
| Samir Kapuria | 45 | Executive Vice President, Cyber Security Services | ||||
| Nicholas R. Noviello | 49 | Executive Vice President and Chief Financial Officer | ||||
| Scott C. Taylor | 54 | Executive Vice President, General Counsel and Secretary |
The Board chooses executive officers, who then serve at the Board’s discretion. There is no family relationship between any of the directors or executive officers and any other director or executive officer of Symantec.
For information regarding Mr. Clark, please refer to “Our Board of Directors” above.
Ms. Cappellanti-Wolf has served as our Senior Vice President and Chief Human Resources Officer since July 2014. Prior to joining us, she was Chief Human Resources Officer at Silver Spring Networks, Inc., a smart grid products provider, from June 2009 to July 2014. From September 2001 to June 2009, Ms. Cappellanti-Wolf served as Vice President, Human Resources of Cisco Systems, Inc., a networking company. From 2000 to 2001, she served as a Human Resources Director at Sun Microsystems, Inc. Ms. Cappellanti-Wolf served as Human Resources Director for The Walt Disney Company from 1995 to 2000 and held various roles in human resources with Frito-Lay, Inc., a division of PepsiCo, Inc., from 1988 to 1995. She has a Bachelor’s degree in journalism from West Virginia University and a Master’s degree in industrial and labor relations from West Virginia University.
Mr. Fey has served as our President and Chief Operating Officer since August 2016. Prior to that, he served as the President and Chief Operating Officer of Blue Coat from December 2014 to August 2016, when we acquired that company. Prior to joining Blue Coat, Mr. Fey served in a variety of capacities at the Intel Security Group from 2012 until 2014, including as Executive Vice President, Chief Technology Officer and as General Manager of Corporate Products. Previously, he served as Senior Vice President, Advanced Technologies and Field Engineering with McAfee, a software security company, from 2007 until 2012. Mr. Fey holds a Bachelor’s degree from Embry-Riddle Aeronautical University.
Mr. Kapuria has served as our Executive Vice President, Cyber Security Services since May 2018. Prior to that, he served as our Senior Vice President, Cyber Security Services from November 2014 to May 2018, as our Vice President, Products and Services from July 2012 to November 2014, and as our Vice President, Business Strategy and Security Intelligence from April 2011 to July 2012. Prior to April 2011, Mr. Kapuria held numerous other management positions with Symantec. Mr. Kapuria holds a bachelor’s degree in finance from the University of Massachusetts.
Mr. Noviello has served as our Executive Vice President and Chief Financial Officer since December 2016. Prior to that, he served as our Executive Vice President and Chief Integration Officer from August 2016 to November 2016. Prior to joining Symantec, Mr. Noviello served as Blue Coat’s Chief Financial Officer from January 2016 to August 2016, when we acquired that company. Prior to joining Blue Coat, he served as Executive Vice President, Finance and Operations, and Chief Financial Officer for NetApp, a publicly traded global data management and storage company, from January 2012 through January 2016. From January 2008 until January 2012, Mr. Noviello held a variety of
Table of Contents
positions of increasing seniority within the finance organization at NetApp, including Controller and Global Controller. Prior to joining NetApp, he spent eight years at Honeywell International, where he was Chief Financial Officer of two global business units, ran investor relations, and was a leader on the corporate mergers and acquisitions team. Mr. Noviello started his career at PricewaterhouseCoopers. He is a Certified Public Accountant and holds a Bachelor’s degree in business administration from Boston University and a Master’s degree in taxation from Fairleigh Dickinson University.
Mr. Taylor has served as our Executive Vice President, General Counsel and Secretary since August 2008. From February 2007 to August 2008, he served as our Vice President, Legal. Prior to joining Symantec, Mr. Taylor held various legal and administrative positions at Phoenix Technologies Ltd., a provider of core systems software, from January 2002 to February 2007, including most recently as Chief Administrative Officer, Senior Vice President and General Counsel. From May 2000 to September 2001, he was Vice President and General Counsel at Narus, Inc., a venture-backed private company that designs IP network management software. Mr. Taylor is a director of Piper Jaffray Companies, a national advisory board member of the Stanford University Center for Comparative Studies on Race and Ethnicity and serves on the board of trustees of Menlo School. He holds a Juris Doctorate from George Washington University and a Bachelor’s degree from Stanford University.
Section 16(a) Beneficial Ownership Reporting Compliance
Section 16 of the Exchange Act requires Symantec’s directors, executive officers and any persons who own more than 10% of Symantec’s common stock, to file initial reports of ownership and reports of changes in ownership with the SEC. Such persons are required by SEC regulation to furnish Symantec with copies of all Section 16(a) forms that they file.
Based solely on its review of the copies of such forms furnished to Symantec and written representations from the directors and executive officers, Symantec believes that all Section 16(a) filing requirements were met in fiscal 2018, except as follows: a Form 5 covering the distribution and sale of shares held in family trusts by Gregory S. Clark, due on May 14, 2018, was filed late on a Form 4 on June 5, 2018.
Code of Conduct and Code of Ethics
We have adopted a code of conduct that applies to all of our Board members, officers and employees. We have also adopted a code of ethics for our Chief Executive Officer and senior financial officers, including our principal financial officer and principal accounting officer. Our Code of Conduct and Financial Code of Ethics are posted on the Investor Relations section of our website located at investor.symantec.com, by clicking on “Company Charters,” under “Corporate Governance.” Any amendments or waivers of our Code of Conduct and Code of Ethics for Chief Executive Officer and Senior Financial Officers pertaining to a member of our Board or one of our executive officers will be disclosed on our website at the above-referenced address.
Table of Contents
Identification of Audit Committee and Financial Expert
We have a separately-designated Audit Committee established in accordance with Section 3(a)(58)(A) of the Exchange Act. The members of the Audit Committee, including each member that our Board has determined is an “audit committee financial expert” under SEC rules and regulations, are identified below.
| Members: | Frank E. Dangeard Robert S. Miller Anita M. Sands V. Paul Unruh (Chair) Suzanne M. Vautrinot | |
| Financial Experts: | Our Board has unanimously determined that all Audit Committee members are financially literate under current Nasdaq listing standards, and at least one member has financial sophistication under Nasdaq listing standards. In addition, our Board has unanimously determined that V. Paul Unruh qualifies as an “audit committee financial expert” under SEC rules and regulations. Mr. Unruh is independent as defined by current Nasdaq listing standards for Audit Committee membership. Designation as an “audit committee financial expert” is an SEC disclosure requirement and does not impose any additional duties, obligations or liability on any person so designated. |
Item 11. Executive Compensation
Executive Compensation and Related Information
COMPENSATION DISCUSSION & ANALYSIS (CD&A)
This compensation discussion and analysis (“CD&A”) describes the material elements of Symantec’s fiscal 2018 executive compensation program. For fiscal 2018, our named executive officers (“NEOs”) included the following current executive officers:
| • | Gregory S. Clark, Chief Executive Officer (“CEO”); |
|---|
| • | Michael D. Fey, President and Chief Operating Officer (“COO”); |
|---|
| • | Nicholas R. Noviello, Executive Vice President and Chief Financial Officer (“CFO”); and |
|---|
| • | Scott C. Taylor, Executive Vice President, General Counsel and Secretary. |
|---|
Our fiscal 2018 NEOs also included one executive officer who resigned following the end of fiscal 2018:
| • | Francis C. Rosch, Former Executive Vice President, Consumer Digital Safety |
|---|
Three Years of Transformation, Success and Challenges
This CD&A largely focuses on executive compensation granted in fiscal 2018. It also includes a discussion of long-term incentive compensation granted in fiscal 2017 and fiscal 2016, but earned based all or partly on fiscal 2018 financial or stock price performance.
Table of Contents
Symantec has undertaken a significant transformation of its business between fiscal 2016 and fiscal 2018. In fiscal 2016, Symantec completed its strategic decision to focus solely on cybersecurity with the divestiture of its information management business, Veritas, which was completed in the fourth quarter of fiscal 2016. Our fiscal 2016 executive compensation program rewarded performance against an EPS target for the first three quarters of fiscal 2016, as well as performance in our TSR ranking over a two- and three-year period, respectively.
In fiscal 2017, Symantec continued its transformation by undertaking a major operational initiative to reduce costs and complexity, continuing to refocus its core business to deliver comprehensive cybersecurity products for both enterprises and consumers with the acquisitions of Blue Coat and LifeLock, and reconstituting its management team, which included a new CEO, COO and CFO from our Blue Coat acquisition. In fiscal 2017, we revised our executive compensation program to ensure that the appropriate incentives were in place to drive and complete our business transformation and cost reduction initiatives, a process we expected to take more than a single fiscal year. The fiscal 2017 executive compensation program leveraged non-GAAP operating income for fiscal 2018 as a key metric to focus the Company’s efforts on the announced cost savings plan and business transformation initiatives.
In fiscal 2018, Symantec focused on continued operational execution of the business transformation embarked upon in fiscal 2017 with a focus on revenue, operating income, EPS and cash flow growth. Key objectives for fiscal 2018 included:
| • | Delivering strong revenue growth with the integrated business portfolio across both our Enterprise and Consumer segments; |
|---|
| • | Growing non-GAAP operating income dollars; |
|---|
| • | Improving non-GAAP operating income margin; |
|---|
| • | Increasing non-GAAP EPS; |
|---|
| • | Reducing debt levels; |
|---|
| • | Increasing deferred revenue balances; and |
|---|
| • | Delivering strong operating cash flow. |
|---|
The improvement in our results over these three years of transformation demonstrates that we have met our key objectives.

Non-GAAP Operating Non-GAAP Revenue Income / Non-GAAP EPS Operating Cash Flow ($mm) (1) Margin Expansion ($)(1) ($mm) ($mm) (1) 29% 27% 9% 18 CAGR CAGR CAGR 18 18 17% 16 16 16 18 CAGR $1,710 16 $1.67 $4,960 $1,194 $950 $4,163 $1,026 $1.03 $1.18 $802 $3,600 34% 29% 29% ($209) FY16A FY17A FY18A FY16A FY17A FY18A FY16A FY17A FY18A FY16A FY17A FY18A
Table of Contents
| (1) | Please see below “- Reconciliation of Selected GAAP Measures to Non-GAAP Measures” for a reconciliation of the relevant adjusted measures to the most directly comparable generally accepted accounting principles (“GAAP”) measures. |
|---|
The design of our fiscal 2018 executive compensation program was aligned with the objectives noted above, with the intent to ultimately reinforce metrics and goals that would support stockholder value creation. In addition, the compensation programs were established in consideration of competitive market practices, the fact that several of the senior leaders were relatively new to Symantec and that we operate in the highly competitive cybersecurity talent market.
In developing our fiscal 2018 executive compensation programs, the Compensation Committee also relied on our regular stockholder outreach and engagement activities as well as more formal channels to communicate with stockholders, including the opportunity for stockholders to cast a non-binding advisory vote regarding executive compensation at our annual meeting. At our 2017 annual meeting of stockholders, the advisory vote on executive compensation for fiscal 2017 was approved by approximately 87% of stockholder votes.
Fiscal Year 2018 Business Results
During fiscal 2018, we focused on executing our plan and strategy following the substantial transformational changes we experienced in fiscal 2017. Symantec’s financial and operational results for fiscal 2018 demonstrate this increased focus on execution:
| • | The Company’s fiscal 2018 total revenue, determined in accordance with GAAP, was $4.834 billion, an increase of 20% over fiscal 2017, with fiscal 2018 Enterprise Security segment GAAP revenue up 8%, and fiscal 2018 Consumer Digital Safety segment GAAP revenue up 37%. |
|---|
| • | Non-GAAP operating margin for fiscal 2018 was 34.5% compared to 28.7% in fiscal 2017. This year-over-year improvement reflects our top-line revenue growth, as well as enhanced operating efficiencies. |
|---|
| • | The Company significantly reduced the principal amount of debt during fiscal 2018 from approximately $8.3 billion to $5.1 billion, with $1.75 billion of the fiscal 2018 year-end balance comprised of convertible notes. |
|---|
| • | The Company grew deferred revenue balances by $316 million in fiscal 2018. |
|---|
| • | The Company generated cash flow from operating activities in fiscal 2018 of $950 million, compared to $209 million used for operating activities in fiscal 2017. Cash flow from operating activities in fiscal 2017 was impacted by a one-time payment for income taxes related to the gain on sale from the divestiture of Veritas during fiscal 2016. The divestiture of Veritas focused our portfolio and was a key component of our strategic refocus of the business to deliver comprehensive cybersecurity products. |
|---|
| • | The Company developed compelling product portfolios across both our Enterprise and Consumer solutions. |
|---|
| • | The Company completed the sale of its website security business and related PKI assets to DigiCert Inc. to refine the Company’s focus on higher growth cybersecurity offerings. |
|---|
Table of Contents
Additional Matters — Audit Committee Investigation
As disclosed on May 10, 2018, the Audit Committee of the Board, with the assistance of independent outside counsel and a forensic accounting firm, undertook a thorough independent investigation relating to allegations raised
Showing the first 8K of 194K characters. Open the full section
Item 12. Security Ownership of Certain Beneficial Owners and Management and Related Stockholder Matters
SECURITY OWNERSHIP OF CERTAIN BENEFICIAL OWNERS AND MANAGEMENT
The following table sets forth information, as of October 10, 2018 with respect to the beneficial ownership of Symantec common stock by (i) each stockholder known by Symantec to be the beneficial owner of more than 5% of Symantec common stock, (ii) each member of the Board and nominee, (iii) the named executive officers of Symantec included in the Summary Compensation Table appearing on page 103 of this Annual Report on Form 10-K and (iv) all current executive officers and directors of Symantec as a group.
Beneficial ownership is determined under the rules of the SEC and generally includes voting or investment power with respect to securities. Unless otherwise indicated below, the persons and entities named in the table have sole voting and sole investment power with respect to all shares beneficially owned, subject to community property laws where applicable. Percentage ownership is based on 638,538,278 shares of Symantec common stock outstanding as of October 10, 2018 (excluding shares held in treasury). Shares of common stock subject to stock options and restricted stock units vesting on or before December 9, 2018 (within 60 days of October 10, 2018) are deemed to be outstanding and beneficially owned for purposes of computing the percentage ownership of such person but are not treated as outstanding for purposes of computing the percentage ownership of others.
Unless otherwise indicated, the address of each of the individuals and entities named below is c/o Symantec Corporation, 350 Ellis Street, Mountain View, California 94043.
| Name and Address of Beneficial Owner | Amount and Nature of Beneficial Ownership | Percent of Class | ||||||
| T. Rowe Price Associates, Inc. (1) | 78,822,026 | 12.3 | % | |||||
| Vanguard Group Inc. (2) | 63,359,516 | 9.9 | % | |||||
| Capital World Investors (3) | 43,353,589 | 6.8 | % | |||||
| BlackRock, Inc. (4) | 40,184,068 | 6.3 | % | |||||
| Starboard Value LP (5) | 36,000,796 | 5.6 | % | |||||
| Directors and Executive Officers | ||||||||
| Gregory S. Clark (6) | 6,566,782 | 1.0 | % | |||||
| Michael D. Fey (7) | 2,308,211 | * | ||||||
| Nicholas R. Noviello (8) | 1,471,135 | * | ||||||
| Scott C. Taylor | 350,364 | * | ||||||
| David L. Mahoney (9) | 187,299 | * | ||||||
| Amy L. Cappellanti-Wolf | 178,361 | * | ||||||
| Daniel H. Schulman (10) | 156,865 | * | ||||||
| Robert S. Miller | 141,097 | * |
Table of Contents
| Name and Address of Beneficial Owner | Amount and Nature of Beneficial Ownership | Percent of Class | ||||||
| Geraldine B. Laybourne | 131,614 | * | ||||||
| Samir Kapuria (11) | 105,116 | * | ||||||
| Frank E. Dangeard | 104,050 | * | ||||||
| V. Paul Unruh | 87,587 | * | ||||||
| Francis C. Rosch** (12) | 83,268 | * | ||||||
| Anita M. Sands | 49,706 | * | ||||||
| Kenneth Y. Hao (13) | 43,899 | * | ||||||
| Suzanne M. Vautrinot | 36,145 | * | ||||||
| David W. Humphrey | 33,190 | * | ||||||
| Dale E. Fuller | 14,200 | * | ||||||
| Peter A. Feld (14) | - | - | ||||||
| All current Symantec executive officers and directors as a group (18 persons) (15) | 11,965,621 | 1.9 | % |
| * | Less than 1%. |
|---|
| ** | Former officer. |
|---|
| (1) | Based solely on a Schedule 13G/A filing made by T. Rowe Price Associates on February 14, 2018, reporting sole voting and dispositive power over the shares. This stockholder’s address is 100 E. Pratt Street, Baltimore, MD 21202. |
|---|
| (2) | Based solely on a Schedule 13G/A filing made by The Vanguard Group on February 9, 2018, reporting sole voting and dispositive power over the shares. This stockholder’s address is 100 Vanguard Blvd., Malvern, PA 19355. |
|---|
| (3) | Based solely on a Schedule 13G/A filing made by Capital World Investors on September 10, 2018, reporting sole voting and dispositive power over the shares. This stockholder’s address is 333 South Hope Street, Los Angeles, CA 90071. |
|---|
| (4) | Based solely on a Schedule 13G/A filing made by the BlackRock, Inc. on February 8, 2018, reporting sole voting and dispositive power over the shares. This stockholder’s address is 55 East 52nd Street, New York, NY 10055. |
|---|
| (5) | Based solely on a Schedule 13D filing made by Starboard Value LP on September 18, 2018, reporting sole voting and dispositive power over the shares. This stockholder’s address is 777 Third Avenue, 18th Floor, New York, New York 10017. Mr. Feld is a Managing Member of Starboard Value LP and may be deemed to share voting and dispositive power over these shares. |
|---|
| (6) | Includes 1,122,938 shares held by the TR UA 01/29/2016 Gregory S. Clark Living Trust for which Mr. Clark exercises voting and dispositive power and 3,665,271 shares subject to options that will be exercisable as of December 9, 2018. |
|---|
| (7) | Includes 1,300,813 shares subject to options that will be exercisable as of December 9, 2018. |
|---|
| (8) | Includes 1,107,183 shares subject to options that will be exercisable as of December 9, 2018. |
|---|
| (9) | Includes 2,835 shares held by the Winnifred C. Ellis & David L Mahoney TR UA 06/25/1998 Trust for which Mr. Mahoney exercises voting and dispositive power. |
|---|
| (10) | Includes 135,952 shares held by the DHS 2017 Annuity Trust Agreement II for which Mr. Schulman exercises voting and dispositive power. |
|---|
| (11) | Includes 3,633 shares issuable upon the settlement of RSUs as of December 9, 2018. |
|---|
| (12) | Beneficial ownership data is current through Mr. Rosch’s departure date of June 28, 2018 and excludes 325,401 shares issued on the settlement of PRUs as of December 9, 2018. |
|---|
| (13) | These securities are held by Mr. Hao for the benefit of Silver Lake Technology Management LLC, certain of its affiliates and certain of the funds they manage (“Silver Lake”) and pursuant to Mr. Hao’s arrangement with Silver Lake, upon the sale of these securities, the proceeds are expected to be remitted to Silver Lake. |
|---|
| (14) | Excludes 36,000,796 shares of common stock beneficially owned by Starboard Value LP and its affiliates, which includes 11,499,000 shares underlying certain forward purchase contracts. |
|---|
| (15) | Includes 6,073,267 shares subject to options that will be exercisable as of December 9, 2018 and 3,633 shares issuable upon the settlement of RSUs as of December 9, 2018. |
|---|
Table of Contents
Equity Compensation Plan Information
The following table gives information about Symantec’s common stock that may be issued upon the exercise of options, warrants and rights under all of Symantec’s existing equity compensation plans as of March 30, 2018:
| Equity Compensation Plan Information | ||||||||||||
| Plan Category | Number of Securities to be Issued Upon Exercise of Outstanding Options, Warrants and Rights | Weighted- Average Exercise Price of Outstanding Options, Warrants and Rights | Number of Securities Remaining Available for Future Issuance Under Equity Compensation Plans (Excluding Securities Reflected in Column (a)) | |||||||||
| (a) | (b) | (c) | ||||||||||
| Equity compensation plans approved by security holders | - | - | 82,997,034 | (1) | ||||||||
| Equity compensation plans not approved by security holders | - | (2) | - | - | ||||||||
| Total | - | - | 82,997,034 |
| (1) | Represents 47,683 shares remaining available for future issuance under Symantec’s 2000 Director Equity Incentive Plan, 35,773,529 shares remaining available for future issuance under Symantec’s 2008 Employee Stock Purchase Plan, 22,019,375 shares issuable upon settlement of RSUs and PRUs (at 100% of target), and 25,156,447 shares issuable for future grant under our 2013 Plan as of March 30, 2018. Excludes 14,125,654 shares issuable upon settlement of RSUs and PRUs (at target) that were assumed in connection with various acquisitions. Note, this does not include shares granted after March 30, 2018 and excludes the proposed increase of 12,000,000 shares under the 2013 Plan. |
|---|
| (2) | Excludes outstanding options to acquire 13,605,035 shares as of March 30, 2018 that were assumed as part of various acquisitions. The weighted average exercise price of these outstanding options was $8.53 as of March 30, 2018. In connection with these acquisitions, Symantec has only assumed outstanding options and rights, but not the plan themselves, and therefore, no further options may be granted under these acquired-company plans. |
|---|
Table of Contents
Item 13. Certain Relationships and Related Transactions, and Director Independence
Related-Person Transactions Policy and Procedure
Symantec has adopted a written related person transactions policy which provides for the Company’s policies and procedures regarding the identification, review, consideration and approval or ratification of “related person transactions.” The Nominating and Governance Committee reviews transactions that may be “related person transactions,” which are transactions between Symantec and any related persons in which the aggregate amount involved exceeds or may be expected to exceed $120,000, and in which the related person has or will have a direct or indirect material interest. For purposes of the policy, a related person is any Symantec executive officer, director, nominee for director, or stockholder holding more than 5% of any class of Symantec’s voting securities, in each case, since the beginning of the previous fiscal year, and their immediate family members.
Under the policy, absent any facts or circumstances indicating special or unusual benefits to the related person, the following transactions are deemed not to be “related person transactions” (meaning the related person is deemed to not have a direct or indirect material interest in the transaction):
| • | compensation to executive officers determined by Symantec’s Compensation Committee; |
|---|
| • | any transaction with another company at which a related person is a director or an employee (other than an executive officer) if the aggregate amount involved does not exceed the greater of $2,000,000, or three percent of that company’s total annual gross revenues, provided that the transaction involves the purchase of either company’s goods and services and the transaction is subject to usual trade terms and is in the ordinary course of business and the related person is not involved in the negotiation of the transaction; |
|---|
| • | any compensation paid to a director if the compensation is required to be reported in Symantec’s proxy statement; |
|---|
| • | any transaction where the related person’s interest arises solely from the ownership of the Company’s common stock and all holders of the Company’s common stock received the same benefit on a pro rata basis; |
|---|
| • | any charitable contribution, grant or endowment by Symantec or the Symantec Foundation to a charitable organization, foundation or university at which a related person’s only relationship is as a director or an employee (other than an executive officer), if the aggregate amount involved does not exceed $120,000, or any non-discretionary matching contribution, grant or endowment made pursuant to a matching gift program; |
|---|
| • | any transaction where the rates or charges involved are determined by competitive bids; |
|---|
| • | any transaction involving the rendering of services as a common or contract carrier, or public utility, at rates or charges fixed in conformity with law or governmental authority; or |
|---|
| • | any transaction involving services as a bank depositary of funds, transfer agent, registrar, trustee under a trust indenture, or similar services. |
|---|
Under the policy, members of Symantec’s legal department review transactions involving related persons that do not fall into one of the above categories. If they determine that a related person could have a significant interest in a transaction, the transaction is referred to the Nominating and Governance Committee. In addition, transactions may be identified through Symantec’s Code of Conduct or other Symantec policies and procedures, and reported to the Nominating and Governance Committee. The Nominating and Governance Committee determines whether the related person has a material interest in a transaction and may approve, ratify, rescind or take other action with respect to the transaction.
Table of Contents
Certain Related Person Transactions
Investments by Firms Affiliated with our Directors
On February 3, 2016, Symantec entered into an investment agreement with investment entities affiliated with Silver Lake, relating to the issuance to Silver Lake of $500 million principal amount of 2.5% convertible unsecured notes, due 2021. In connection with the investment, Kenneth Y. Hao, a managing partner and managing director of Silver Lake, was appointed to our Board.
On June 12, 2016, Symantec entered into an investment agreement with investment entities affiliated with Silver Lake and Bain Capital relating to the issuance of $1.25 billion aggregate principal amount of 2.0% convertible unsecured notes due 2021. Pursuant to the investment agreement, Silver Lake, a private equity firm of which Mr. Hao is a managing partner and managing director, has agreed to purchase $500 million aggregate principal amount of the notes, and Bain Capital, private equity firm of which Mr. Humphrey is a managing director, has agreed to purchase $750 million aggregate principal amount of the notes. The transactions contemplated by this investment agreement closed concurrently with the closing of the Blue Coat acquisition on August 1, 2016. In connection with the investment, David W. Humphrey, a managing director of Bain Capital, was appointed to our Board.
The 2.5% convertible unsecured notes, due 2021 (the “2.5% Notes”), bear interest at a rate of 2.5% per annum. The 2.0% convertible unsecured notes, due 2021 (the “2.0% Notes” and, together with the 2.5% Notes, collectively, the “Notes”), bear interest at a rate of 2.0% per annum. Interest is payable semiannually in cash under the Notes. The initial conversion rate for the 2.5% Notes was 59.6341 shares of our common stock, and cash in lieu of fractional shares, per $1,000 principal amount of the 2.5% Notes, which was equivalent to an initial conversion price of approximately $16.77 per share of common stock. The initial conversion rate for the 2.0% Notes was 48.9860 shares of our common stock, and cash in lieu of fractional shares, per $1,000 principal amount of the 2.0% Notes, which was equivalent to an initial conversion price of approximately $20.41 per share of common stock. The conversion rates under the Notes are subject to customary anti-dilution adjustments. Holders may surrender their Notes for conversion at any time prior to the close of business on the business day immediately preceding the maturity date for the Notes.
As of March 30, 2018, $1.75 billion in aggregate principal amount of the Notes was outstanding. During fiscal 2018, we paid an aggregate of $37.5 million in interest on the Notes.
Symantec also entered into a Registration Rights Agreement pursuant to which holders of the Notes have certain registration rights with respect to the Notes and the shares of our common stock issuable upon conversion of the Notes.
Reinvestment Agreements with our Executive Officers
On June 12, 2016, we entered into reinvestment agreements with Mr. Clark and GSC-OZ Investment LLC, an entity controlled by Mr. Clark, pursuant to which the parties agreed to purchase, in the aggregate, 2,329,520 shares our common stock for an aggregate purchase price of $40,300,696. On August 1, 2016, we issued and sold these shares to Mr. Clark and GSC-OZ Investment LLC. The agreements provide that, in the aggregate, 207,907 of such shares will vest monthly until October 30, 2019, subject to Mr. Clark’s continued service to the Company, and that all of the shares are subject to transfer restrictions. These transfer restrictions were lifted on August 1, 2017 when our common stock achieved the specified volume weighted average trading price over a defined period as set forth in the agreements.
On June 12, 2016, we entered into a reinvestment agreement with each of Mr. Fey and Mr. Noviello pursuant to which each of Mr. Fey and Mr. Noviello agreed not to transfer certain shares
Table of Contents
of common stock to be issued upon exercise of options held by Mr. Fey and Mr. Noviello. On August 1, 2017 these shares were released from transfer restrictions when our common stock achieved the specified volume weighted average trading price over a defined period as set forth in the agreements.
Transactions with Starboard Value LP
In September 2018, the Company entered into the Starboard Agreement with Starboard, an affiliate of Mr. Feld. For more about the Starboard Agreement, see “Item 10–Directors, Executive Officers and Corporate Governance.”
Aircraft Lease Agreement
On November 9, 2017, the Company and Mr. Clark entered into an Aircraft Lease Agreement (the “Aircraft Lease Agreement”) for the occasional lease by the Company of an aircraft owned by Mr. Clark. Under the Aircraft Lease Agreement, the Company will reimburse Mr. Clark for business travel on his aircraft at a rate of $2,500 per flight hour plus additional operating costs. The Nominating and Governance Committee of our Board of Directors approved the Aircraft Lease Agreement after completing a competitive analysis of comparable chartered aircraft rates, which showed that the reimbursement rate is at or below market rates for the charter of similar aircraft. The Nominating and Governance Committee during fiscal 2018 also adopted a Company-wide Aircraft Usage Policy, which governs the approved business usage of corporate aircraft, including Mr. Clark’s, and set an annual cap on the amount of expenses to be incurred by the Company under the policy at two million dollars. During fiscal 2018, we incurred approximately $1,322,200 in fees for the aircraft owned by Mr. Clark. Please see “Executive Compensation and Related Information — Summary Compensation Table” on page 109 for more information.
Familial Relationships
From time to time, the Company or its subsidiaries may have employees who are related to our executive officers or directors. The step-daughter of Anita M. Sands, one of our directors, began employment with the Company in a customer service role during fiscal 2019. Because her employment did not begin until fiscal 2019, she did not earn any compensation in fiscal 2018. The Nominating and Governance Committee of the Board reviewed and approved her employment and determined that her employment with the Company would not present a conflict of interest under the Company’s Related-Person Transaction Policy.
Board Independence
It is the policy of the Board and Nasdaq rules require that listed companies have a board of directors with at least a majority of independent directors, as defined under Nasdaq’s Marketplace Rules. Currently, each member of our Board, other than our Chief Executive Officer, Gregory S. Clark, is an independent director, and all standing committees of the Board are composed entirely of independent directors. The Nasdaq independence definition includes a series of objective tests, such as that the director is not an employee of the company and has not engaged in various types of business dealings with the company. In addition, the Board has made a subjective determination as to each independent director that no relationship exists which, in the opinion of the Board, would interfere with the exercise of independent judgment in carrying out the responsibilities of a director. In making these determinations, the directors reviewed and discussed information provided by the directors and our Company with regard to each director’s business and other activities as they may relate to Symantec and our management. Based on this review and consistent with our independence criteria, the Board has affirmatively determined that the following current directors and director nominees are independent: Frank E. Dangeard, Peter A. Feld, Dale L. Fuller, Kenneth Y. Hao, David W. Humphrey, Geraldine B. Laybourne, David L. Mahoney, Robert S. Miller, Anita M. Sands, Daniel H. Schulman, V. Paul Unruh and Suzanne M. Vautrinot.
Table of Contents
Item 14. Principal Accountant Fees and Services
We regularly review the services and fees from our independent registered public accounting firm, KPMG. These services and fees are also reviewed with the Audit Committee annually. In accordance with standard policy, KPMG periodically rotates the individuals who are responsible for our audit. Our Audit Committee has determined that the providing of certain non-audit services, as described below, is compatible with maintaining the independence of KPMG.
In addition to performing the audit of our consolidated financial statements, KPMG provided various other services during fiscal years 2018 and 2017. Our Audit Committee has determined that KPMG’s provisioning of these services, which are described below, does not impair KPMG’s independence from Symantec. The aggregate fees billed for fiscal years 2018 and 2017 for each of the following categories of services are as follows:
| Fees Billed to Symantec | 2018 | 2017 | ||||||
| Audit fees (1) | $ | 11,370,525 | $ | 9,985,434 | ||||
| Audit related fees (2) | 753,689 | 2,215,628 | ||||||
| Tax fees (3) | 469,449 | 248,467 | ||||||
| All other fees (4) | 311,000 | - | ||||||
| Total fees | $ | 12,904,663 | $ | 12,449,529 | ||||
The categories in the above table have the definitions assigned under Item 9 of Schedule 14A promulgated under the Exchange Act, and these categories include in particular the following components:
| (1) | “Audit fees” include fees for audit services principally related to the year-end examination and the quarterly reviews of our consolidated financial statements, consultation on matters that arise during a review or audit, review of SEC filings, audit services performed in connection with our acquisitions and divestitures and statutory audit fees. |
|---|
| (2) | “Audit related fees” include fees which are for assurance and related services other than those included in Audit fees. |
|---|
| (3) | “Tax fees” include fees for tax compliance and advice. |
|---|
| (4) | “All other fees” include fees for all other non-audit services, principally for services in relation to certain information technology audits. |
|---|
An accounting firm other than KPMG performs supplemental internal audit services for Symantec. Another accounting firm provides the majority of Symantec’s outside tax services.
Policy on Audit Committee Pre-Approval of Audit and Permissible Non-Audit Services of Independent Registered Public Accounting Firm
The Audit Committee’s policy is to pre-approve all audit and permissible non-audit services provided by the independent registered public accounting firm. These services may include audit services, audit-related services, tax services and other services. Pre-approval is detailed as to the particular service or category of services and is generally subject to a specific budget. The independent registered public accounting firm and management are required to periodically report to the Audit Committee regarding the extent of services provided by the independent registered public accounting firm in accordance with this pre-approval, and the fees for the services performed to date. The Audit Committee may also pre-approve particular services on a case-by-case basis.
All of the services relating to the fees described in the table above were approved by the Audit Committee.
Table of Contents
PART IV
Item 15. Exhibits, Financial Statement Schedules
(a)
1. Financial Statements
Upon written request, we will provide, without charge, a copy of this annual report, including the Consolidated Financial Statements and financial statement schedule. All requests should be sent to:
Symantec Corporation
Attn: Investor Relations
350 Ellis Street
Mountain View, California 94043
(650) 527-8000
The following documents are filed as part of this report:
Table of Contents
REPORT OF INDEPENDENT REGISTERED PUBLIC ACCOUNTING FIRM
The Board of Directors and Stockholders
Symantec Corporation:
Opinions on the Consolidated Financial Statements and Internal Control Over Financial Reporting
We have audited the accompanying consolidated balance sheets of Symantec Corporation and subsidiaries (the Company) as of March 30, 2018 and March 31, 2017, the related consolidated statements of operations, comprehensive income (loss), stockholders’ equity, and cash flows for each of the years in the three-year period ended March 30, 2018 and the related notes (collectively, the consolidated financial statements). We also have audited the Company’s internal control over financial reporting as of March 30, 2018, based on criteria established in Internal Control—Integrated Framework (2013) issued by the Committee of Sponsoring Organizations of the Treadway Commission.
In our opinion, the consolidated financial statements referred to above present fairly, in all material respects, the financial position of the Company as of March 30, 2018 and March 31, 2017, and the results of their operations and their cash flows for each of the years in the three-year period ended March 30, 2018, in conformity with U.S. generally accepted accounting principles. Also in our opinion, the Company maintained, in all material respects, effective internal control over financial reporting as of March 30, 2018, based on criteria established in Internal Control—Integrated Framework (2013) issued by the Committee of Sponsoring Organizations of the Treadway Commission.
Basis for Opinions
The Company’s management is responsible for these consolidated financial statements, for maintaining effective internal control over financial reporting, and for their assessment of the effectiveness of internal control over financial reporting, included in the accompanying Management’s Report on Internal Control over Financial Reporting under Item 9A.b. Our responsibility is to express an opinion on the Company’s consolidated financial statements and an opinion on the Company’s internal control over financial reporting based on our audits. We are a public accounting firm registered with the Public Company Accounting Oversight Board (United States) (PCAOB) and are required to be independent with respect to the Company in accordance with the U.S. federal securities laws and the applicable rules and regulations of the Securities and Exchange Commission and the PCAOB.
We conducted our audits in accordance with the standards of the PCAOB. Those standards require that we plan and perform the audits to obtain reasonable assurance about whether the consolidated financial statements are free of material misstatement, whether due to error or fraud, and whether effective internal control over financial reporting was maintained in all material respects.
Our audits of the consolidated financial statements included performing procedures to assess the risks of material misstatement of the consolidated financial statements, whether due to error or fraud, and performing procedures that respond to those risks. Such procedures included examining, on a test basis, evidence regarding the amounts and disclosures in the consolidated financial statements. Our audits also included evaluating the accounting principles used and significant estimates made by management, as well as evaluating the overall presentation of the consolidated financial statements. Our audit of internal control over financial reporting included obtaining an understanding of internal control over financial reporting, assessing the risk that a material weakness exists, and testing and evaluating the design and operating effectiveness of internal control based on the assessed risk. Our audits also included performing such other procedures as we considered necessary in the circumstances. We believe that our audits provide a reasonable basis for our opinions.
Table of Contents
Definition and Limitations of Internal Control Over Financial Reporting
A company’s internal control over financial reporting is a process designed to provide reasonable assurance regarding the reliability of financial reporting and the preparation of financial statements for external purposes in accordance with generally accepted accounting principles. A company’s internal control over financial reporting includes those policies and procedures that (1) pertain to the maintenance of records that, in reasonable detail, accurately and fairly reflect the transactions and dispositions of the assets of the company; (2) provide reasonable assurance that transactions are recorded as necessary to permit preparation of financial statements in accordance with generally accepted accounting principles, and that receipts and expenditures of the company are being made only in accordance with authorizations of management and directors of the company; and (3) provide reasonable assurance regarding prevention or timely detection of unauthorized acquisition, use, or disposition of the company’s assets that c
Showing the first 8K of 220K characters. Open the full section
Item 16. Form 10-K Summary
None.
Table of Contents
SIGNATURES
Pursuant to the requirements of Section 13 or 15(d) of the Securities Exchange Act of 1934, the Registrant has duly caused this report to be signed on its behalf by the undersigned, thereunto duly authorized, in the City of Mountain View, State of California, on the 26th day of October 2018.
| SYMANTEC CORPORATION | ||||
| By: | /s/ Gregory S. Clark | |||
| Gregory S. Clark Chief Executive Officer and Director |
KNOW ALL PERSONS BY THESE PRESENTS, that each person whose signature appears below constitutes and appoints Gregory S. Clark, Nicholas R. Noviello and Scott C. Taylor, and each or any of them, his attorneys-in-fact, each with the power of substitution, for him in any and all capacities to sign any and all amendments to this report on Form 10-K and any other documents in connection therewith, with the Securities and Exchange Commission, granting unto said attorneys-in-fact, and each of them, full power and authority to do and perform each and every act and thing requisite and necessary to be done in and about the premises, as fully to all intents and purposes as he might or could do in person, hereby ratifying and confirming all that such attorneys-in-fact, or his or their substitute or substitutes, may lawfully do or cause to be done by virtue hereof. This Power of Attorney may be signed in several counterparts.
Pursuant to the requirements of the Securities Exchange Act of 1934, this report has been signed below by the following persons on behalf of the Registrant and in the capacities and on the dates indicated below.
| Signature | Title | Date | ||
| /s/ Gregory S. Clark Gregory S. Clark | Chief Executive Officer and Director (Principal Executive Officer) | October 26, 2018 | ||
| /s/ Nicholas R. Noviello Nicholas R. Noviello | Executive Vice President and Chief Financial Officer (Principal Financial Officer and Principal Accounting Officer) | October 26, 2018 | ||
| /s/ Daniel H. Schulman Daniel H. Schulman | Chairman of the Board | October 26, 2018 | ||
| /s/ Frank E. Dangeard Frank E. Dangeard | Director | October 26, 2018 | ||
| /s/ Peter A. Feld Peter A. Feld | Director | October 26, 2018 | ||
| /s/ Dale L. Fuller Dale L. Fuller | Director | October 26, 2018 | ||
| /s/ Kenneth Y. Hao Kenneth Y. Hao | Director | October 26, 2018 | ||
| /s/ David W. Humphrey David W. Humphrey | Director | October 26, 2018 |
Table of Contents
| Signature | Title | Date | ||
| /s/ Geraldine B. Laybourne Geraldine B. Laybourne | Director | October 26, 2018 | ||
| /s/ David L. Mahoney David L. Mahoney | Director | October 26, 2018 | ||
| /s/ Robert S. Miller Robert S. Miller | Director | October 26, 2018 | ||
| /s/ Anita M. Sands Anita M. Sands | Director | October 26, 2018 | ||
| /s/ V. Paul Unruh V. Paul Unruh | Director | October 26, 2018 | ||
| /s/ Suzanne M. Vautrinot Suzanne M. Vautrinot | Director | October 26, 2018 |