 filings.tools
Gen Digital 10-K 2019-03-29
Filed 2019-05-24. 22 sections, 385K characters. Original on sec.gov · Markdown · JSON
Cover and table of contents
10-K 1 symc32919-10k.htm 10-K
UNITED STATES SECURITIES AND EXCHANGE COMMISSION
Washington, D.C. 20549
Form 10-K
(Mark One)
| þ | ANNUAL REPORT PURSUANT TO SECTION 13 OR 15(d) OF THE SECURITIES EXCHANGE ACT OF 1934 |
For the Fiscal Year Ended March 29, 2019
or
| o | TRANSITION REPORT PURSUANT TO SECTION 13 OR 15(d) OF THE SECURITIES EXCHANGE ACT OF 1934 |
For the Transition Period from to
Commission File Number 000-17781
Symantec Corporation
(Exact name of registrant as specified in its charter)
| Delaware | 77-0181864 | |
| (State or other jurisdiction of incorporation or organization) | (I.R.S. Employer Identification No.) | |
| 350 Ellis Street, Mountain View, California | 94043 | |
| (Address of principal executive offices) | (Zip code) |
Registrant’s telephone number, including area code:
(650) 527-8000
Securities registered pursuant to Section 12(b) of the Act:
| Title of each class | Trading symbol(s) | Name of each exchange on which registered |
| Common Stock, par value $0.01 per share | SYMC | The Nasdaq Stock Market LLC |
Securities registered pursuant to Section 12(g) of the Act:
None
(Title of class)
Indicate by check mark if the registrant is a well-known seasoned issuer, as defined in Rule 405 of the Securities Act. Yes o No þ
Indicate by check mark if the registrant is not required to file reports pursuant to Section 13 or 15(d) of the Exchange Act. Yes o No þ
Indicate by check mark whether the registrant (1) has filed all reports required to be filed by Section 13 or 15(d) of the Securities Exchange Act of 1934 during the preceding 12 months (or for such shorter period that the registrant was required to file such reports), and (2) has been subject to such filing requirements for the past 90 days. Yes þ No o
Indicate by check mark whether the registrant has submitted electronically every Interactive Data File required to be submitted pursuant to Rule 405 of Regulation S-T (§ 232.405 of this chapter) during the preceding 12 months (or for such shorter period that the registrant was required to submit such files). Yes þ No o
Indicate by check mark if disclosure of delinquent filers pursuant to Item 405 of Regulation S-K is not contained herein, and will not be contained, to the best of registrant’s knowledge, in definitive proxy or information statements incorporated by reference in Part III of this Form 10-K or any amendment to this Form 10-K. þ
Indicate by check mark whether the registrant is a large accelerated filer, an accelerated filer, a non-accelerated filer, a smaller reporting company, or an emerging growth company. See the definitions of “large accelerated filer,” “accelerated filer,” “smaller reporting company,” and “emerging growth company” in Rule 12b-2 of the Exchange Act.
| Large accelerated filer þ | Accelerated filer o | Non-accelerated filer o | Smaller reporting company o | |||
| Emerging growth company o | ||||||
| If an emerging growth company, indicate by check mark if the registrant has elected not to use the extended transition period for complying with any new or revised financial accounting standards provided pursuant to Section 13(a) of the Exchange Act. o |
Indicate by check mark whether the registrant is a shell company (as defined in Rule 12b-2 of the Act). Yes o No þ
Aggregate market value of the voting stock held by non-affiliates of the registrant, based upon the closing sale price of Symantec common stock on September 28, 2018 as reported on the Nasdaq Global Select Market: $7,810,381,908. Solely for purposes of this disclosure, shares of common stock held by each executive officer, director, and holder of 5% or more of the outstanding common stock have been excluded as of such date because such persons may be deemed to be affiliates. This determination of possible affiliate status is not a conclusive determination for any other purposes.
The number of shares of Symantec common stock, $0.01 par value per share, outstanding as of May 13, 2019 was 618,193,875 shares.
DOCUMENTS INCORPORATED BY REFERENCE
Portions of the registrant’s definitive proxy statement for the 2019 annual meeting of stockholders are incorporated herein by reference into Part III of this Annual Report on Form 10-K where indicated. Such Proxy Statement will be filed with the Securities and Exchange Commission within 120 days of the registrant’s fiscal year ended March 29, 2019.
SYMANTEC CORPORATION
FORM 10-K
For the Fiscal Year Ended March 29, 2019
TABLE OF CONTENTS
“Symantec,” “we,” “us,” “our,” and “the Company” refer to Symantec Corporation and all of its subsidiaries. Symantec, the Symantec Logo and Norton are trademarks or registered trademarks of Symantec in the United States (U.S.) and other countries. Other names may be trademarks of their respective owners.
FORWARD-LOOKING STATEMENTS AND FACTORS THAT MAY AFFECT FUTURE RESULTS
The discussion below contains forward-looking statements, which are subject to safe harbors under the Securities Act of 1933, as amended (the Securities Act) and the Exchange Act of 1934, as amended (the Exchange Act). Forward-looking statements include references to our ability to utilize our deferred tax assets, as well as statements including words such as “expects,” “plans,” “anticipates,” “believes,” “estimates,” “predicts,” “goal,” “intent,” “momentum,” “projects,” and similar expressions. In addition, projections of our future financial performance; anticipated growth and trends in our businesses and in our industries; the anticipated impacts of acquisitions, restructurings, stock repurchases, and investment activities; the outcome or impact of pending litigation, claims or disputes; our intent to pay quarterly cash dividends in the future; plans for and anticipated benefits of our solutions; matters arising out of the ongoing U.S. Securities and Exchange Commission (the SEC) investigation; and other characterizations of future events or circumstances are forward-looking statements. These statements are only predictions, based on our current expectations about future events and may not prove to be accurate. We do not undertake any obligation to update these forward-looking statements to reflect events occurring or circumstances arising after the date of this report. These forward-looking statements involve risks and uncertainties, and our actual results, performance, or achievements could differ materially from those expressed or implied by the forward-looking statements on the basis of several factors.
These and other risks are described under Item 1A. Risk Factors. We encourage you to read that section carefully.
PART I
Item 1. Business
Overview
Symantec Corporation is a global leader in cyber security. We provide cyber security products, services, and solutions to more than 350,000 organizations and 50 million individuals worldwide. Our Integrated Cyber Defense Platform helps business and government customers unify cloud and on-premises security to deliver a more effective cyber defense solution, while driving down cost and complexity. Our Cyber Safety solutions from Norton LifeLock help consumers protect their devices, online privacy, identities, and home networks.
Our business and consumer offerings are powered by the largest civilian threat intelligence network, which uses artificial intelligence, machine learning, and human intelligence to analyze trillions of rows of data every day across hundreds of millions of devices to discover and help prevent advanced threats that might otherwise go undetected. We believe this threat intelligence data is a competitive advantage, and a primary way we are able to provide faster and better protection for customers.
Founded in 1982, Symantec has operations in more than 45 countries. Our headquarters are located at 350 Ellis Street, Mountain View, California. Our internet home page is located at www.symantec.com. The information contained, or referred to, on our website is not part of this annual report unless expressly noted.
Fiscal 2019 Business Highlights
During fiscal 2019, we continued to make progress enhancing and expanding our product and services portfolio and improving product integration, partner integration, and sales delivery to help enterprise customers deploy our Integrated Cyber Defense Platform. We also made progress driving market adoption and increasing customer retention of our Consumer Cyber Safety (previously called Consumer Digital Safety) solutions, building on our Norton LifeLock product portfolio. In addition, we implemented operational improvements to reduce costs and complexity, building on the business transformation programs we completed in fiscal 2019, and leveraged synergies from the successful integration of our acquired businesses.
| • | Our product development teams built extensive point-to-point integrations across endpoint, network, cloud, and email security products, responding to customer demand to consolidate vendors and enhance their security posture across control points. |
| • | We further extended our Integrated Cyber Defense (ICD) Platform through application programming interfaces (APIs) and engineering-level integration with more than 120 certified technology partners that have developed or are in the process of developing over 250 integrations of complementary products and services to expand our ecosystem, helping businesses implement a coordinated and robust approach to threat protection, detection, and response that improves security outcomes and drives down cost and complexity. |
| • | We expanded the marketing of bundled offerings of cyber safety services for consumers through the integration of our Norton-branded security services with LifeLock-branded identity theft protection services, to help individuals and families combat ever-evolving cyberthreats. Bundling these solutions enables us to combine our Norton and LifeLock demand generation and customer relationship management programs to drive new customer acquisition, improve retention, and cross-sell within our large installed base. |
| • | We launched significant new products to advance our portfolio and competitive position: |
| ◦ | Symantec Advanced EDR Tools and Managed EDR: We introduced Symantec’s Advanced Endpoint Detection and Response (EDR) tools and fully managed EDR (MEDR) service, enabling security teams around the world to stay ahead of threats. EDR improves incident response, threat hunting, and forensics, fortifying teams with investigation expertise and threat intelligence from a world-class team of security operations center analysts. MEDR detects stealthy attacks and examines suspicious activity for faster incident validation and response. |
| ◦ | Cloud Security Portfolio Enhancements: We expanded our cloud security portfolio to help organizations protect cloud applications and related infrastructure. Our ICD Platform offers robust cloud protection, providing visibility and control for virtually any cloud app, and integrations with CloudSOC CASB, Cloud Workload Protection (CWP), and Data Loss Protection (DLP), while enabling customers to track more risk attributes and scan cloud applications and repositories with new API Integrations. |
| ◦ | Data Loss Prevention Enhancements for Office 365: We introduced new features to protect data, whether at rest or in transit, on-premises or in the cloud, and everywhere it flows through a single management console. |
| ◦ | Cloud-based Network Security with Web Isolation: We introduced industry-first Web Isolation technology that integrates into our Web Security Service (WSS) and enables web browsing, nearly eliminating the risk of infection by zero-day malware or advanced threats. |
| ◦ | Cloud-based Network Security with Integrated Endpoint Protection: We introduced improved network-to-endpoint protection with the integration of Symantec Endpoint Protection (SEP) and SEP Mobile into WSS, allowing web traffic re-directs to WSS for enforcement of network security policies while consequently eliminating the need for a separate agent to manage traffic flow. Our new SD-Cloud Connector enables customers to combine the performance and reliability of Software Defined WAN (SD-WAN) technology with our |
WSS to create a simple, high-performance method to connect branch office locations with our leading cloud security service.
| ◦ | Targeted Attack Analytics: We expanded our Advanced Threat Protection (ATP) offering to include our targeted attack technology. This feature enables ATP customers to leverage advanced machine learning to automate the discovery of targeted attacks, one of the most dangerous intrusions in corporate networks. |
| • | Consistent with our strategy of acquiring companies with complementary technology to enhance our products, services, and solutions and speed time to market, we completed several acquisitions during our fiscal year 2019, including the following: |
| ◦ | Appthority. With this acquisition, we are able to provide mobile application security to our Consumer Cyber Safety customers, enabling them to analyze mobile apps for both malicious capabilities and unsafe and unwanted behaviors, such as vulnerabilities, risk of sensitive data loss, and privacy-invasive actions. |
| ◦ | Javelin. This acquisition brings advanced software technology to our Enterprise Security solutions, enabling enterprises to defend against Active Directory-based (AD) attacks through detection of AD misconfigurations and backdoors to help prevent AD reconnaissance and credentials misuse by authorized devices and applications. |
| ◦ | Luminate. With this acquisition, our solutions now incorporate software defined perimeter and zero trust technology enabling us to deliver private secure application access to all users, regardless of device, location, or infrastructure, extending the power of our ICD Platform to users and significantly extending our leadership in cloud security beyond alternative approaches. |
| • | We expanded our strategic partnerships in our Enterprise Security and Consumer Cyber Safety segments, including: |
| ◦ | Fortinet. We entered into an expansive partnership agreement with Fortinet in an effort to provide customers with comprehensive and robust firewall security solutions. Under this arrangement, we intend to integrate Fortinet’s Next-Generation Firewall (NGFW) capabilities into our cloud-delivered WSS and to integrate our endpoint protection solutions into the Fortinet Security Fabric platform. This technology partnership is designed to provide essential security controls across endpoint, network, and cloud environments that are critical to enforcing the zero trust security framework, a model built on the reality that threats everywhere, both inside and outside an organization, require a multi-layered approach to prevention, detection, and response. |
| ◦ | AON. We entered into a strategic partnership with AON, as part of our longer-term strategy to drive consumer adoption through business-to-business-to-consumer relationships. AON offers solutions to help high net worth individuals defend their assets against cyber criminals. The partnership provides that we will offer to AON customers features across our Consumer Cyber Safety solutions. We believe Cyber Safety is synergistic with many brands globally, such as insurers, banks, telecom providers and other organizations. As we expand Cyber Safety internationally and to address a growing array of vertical needs, we believe partnerships such as AON will expand the value we bring customers and the revenue potential for our consumer business. |
Business Strategy
Our strategy is to combine best-of-breed technology with unmatched scale to deliver a comprehensive cyber security set of solutions for business and government customers, as well as consumers.
Our Enterprise Security strategy is to leverage our ICD Platform, partner ecosystem and global threat intelligence network to deliver Integrated Cyber Defense to business and government customers, helping them improve security while reducing cost and complexity. Our ICD Platform enables us to acquire new customers and cross-sell our full portfolio of products and services to existing customers and to customers of partners in our expansive ecosystem, such as Amazon.com Inc.’s AWS, Box, Inc., IBM Security, Microsoft Corporation (Microsoft), Oracle Corporation, ServiceNow, Inc., Splunk Inc., and many others.
Our Consumer Cyber Safety strategy is to combine and leverage our portfolio of Norton and LifeLock offerings to deliver a set of Cyber Safety solutions that address today’s continually evolving and increasingly complex threat landscape. This threat landscape puts consumers at increased risk of having their security, online privacy, and identities compromised. As the risks to consumers shift from PC-based attacks to more sophisticated threats such as ransomware, identity theft, and privacy risks, our software and services provide a multi-layered approach to protect consumers, regardless of device, network, or location.
Products and Services
Enterprise Security Portfolio: Integrated Cyber Defense
Our Enterprise Security portfolio includes a deep and broad mix of products, services, and solutions, delivered as part of our ICD Platform. Our platform unifies cloud and on-premises security to provide advanced threat protection and information protection across endpoints, networks, email, and cloud applications. Key components of our ICD Platform include:
| • | Advanced Security Services |
| • | Advanced Threat Protection: Multiple layers of threat prevention, detection, and forensic technology provide a robust view of malicious activities across control points, enabling users to contain, investigate, and remediate threats. |
| • | Information Protection: Encryption, data loss prevention, multi-factor authentication, tagging, and analytics enable businesses and governments to protect confidential information and IT assets while managing compliance requirements and restricting access to authenticated users. |
| • | Identity Management: Cloud-based authentication service with multi-factor authentication to cloud apps, network, and Virtual Private Network (VPN) to reduce the risk of breaches and unauthorized access. |
| • | Compliance enforcement: A suite of governance, risk, and compliance tools help customers inventory their IT assets, evaluate vulnerabilities, govern information access, and automate compliance reporting for more than 100 regulatory and best-practice frameworks including GDPR, HIPAA, NIST, PCI, and SWIFT. |
| • | Third-party applications: Over 250 TIPP (Technology Integration Partner Program) certified integrations enhance productivity for security operations and incident response teams while extending the value of current cyber investments. |
| • | Control Points |
| • | Endpoint Security: A single agent architecture delivers multi-layered security across endpoints - desktop, server, mobile, and IoT - and enables customers to protect enterprise and mobile workforces, regardless of operating system, device, or network security approaches. |
| • | Network Security: Cloud and on-premises network security solutions, based on an advanced proxy architecture, provide superior defense against advanced threats, enable users to protect critical business information, and help ensure secure and compliant use of cloud applications and the web. |
| • | Email Security: Multiple layers of protection (including threat isolation and advanced analytics) against ransomware, spear phishing, and enterprise email compromise help identify targeted attacks and enable users to protect email against user error and data leakage. |
| • | Cloud Application Security: Advanced solutions that secure cloud access, cloud infrastructure, and cloud applications, providing in-depth visibility, data security, and threat protection to safeguard users, information, and workloads across public and private clouds. |
| • | Cyber Security Services |
| • | An integrated portfolio including Managed Security Services, Incident Response, and Deep Sight Threat Intelligence, driven by our private network of cyber security analysts within our global security operations centers. |
| • | ICD Platform Foundations |
Our solutions are powered by the following critical features:
| • | Threat Intelligence: The world’s largest civilian threat intelligence network applies deep security research, expert analysis, and artificial intelligence to monitor and synthesize nine trillion rows of telemetry daily, helping discover and block targeted attacks and cybercrime that would otherwise go undetected. |
| • | AI and Machine Learning Services: Artificial intelligence and machine learning analyze massive amounts of control point data and sift through our entire telemetry data set to help identify potential threats and accelerate response and remediation. |
| • | API and ICD Exchange Services: APIs and ICD Exchange (ICDx) vastly simplify integrations with ICD, providing enhanced protection, investigation, and remediation across Symantec endpoints, networks, email, cloud applications, and third-party products. |
| • | ICD Manager Services: A shared management console provides a single point of control for policy management, monitoring, and reporting. |
| • | Automation: Built-in automation simplifies investigation, accelerates response times, and minimizes damages from attacks, while reducing manual processes and cost of security operations. |
| • | Open Ecosystem |
| • | An expansive set of open APIs with over 100 certified technology partners creating the broadest ecosystem in cyber security, enabling a coordinated and best-in-class approach to threat protection, detection, and response. |
In addition to our core product portfolio, Symantec offers enterprise security services including:
| • | Consulting Services: We provide the experience, expertise, and industry intelligence to assist enterprises to better architect, design, implement, and optimize their security software, people, and processes. Symantec consultants guide enterprises toward solutions that meet their business goals and leave them with the knowledge to maintain and enhance their security environment. |
| • | Premium Support Services: Our premium support services for enterprises focus on timely and accurate issue resolution by placing a product family expert at the center of a tailored support experience, who provides technical support, manages escalations, delivers case and system reviews, oversees environmental health checks, and provides proactive services such as upgrade planning and feature optimization. |
| • | Cyber Security Services: We provide continual threat monitoring, customized guidance, and 24x7 personalized service within an enterprise’s security environment through our Managed Security Services, Deep Sight Intelligence, and Incident Response Services. |
Consumer Cyber Safety Portfolio
Our Consumer Cyber Safety solutions consist primarily of the following product offerings which are being integrated into a unified user experience under the Norton LifeLock brand:
| • | Norton Security: Our Norton Security solutions are available as a subscription service providing protection for devices against malware, viruses, adware, and ransomware on multiple platforms: Windows, Mac, Android, and iOS. Users also have access to a password manager, parental controls, and safe web browsing that blocks malicious sites and filters browser search results. Users also can perform secure cloud backups of photos, financial files, and other important documents on Windows, providing additional protection in the event ransomware attacks make these files unavailable. For mobile devices, Norton Security also filters risky apps, enables stolen device recovery, provides contact recovery, and blocks unwanted spam texts and calls. Norton Security includes 24x7 support by trained support agents who are available to assist customers. |
| • | LifeLock Identity Theft Protection: Our LifeLock identity theft protection solution provides identity monitoring, alerts, and restoration to our customers. LifeLock puts users in control of their identity elements, including social security numbers, bank accounts, email addresses, physical addresses, and driver’s license and phone numbers. The service alerts users on key events and recommends actions to prevent unauthorized access. If an identity theft takes place, LifeLock’s identity experts work with the user to restore their identities, managing interaction with various governmental agencies, financial institutions, and merchants - and addressing legal fees, wage loss, and associated damages. |
| • | Norton Wi-Fi Privacy VPN: Our Norton Wi-Fi Privacy VPN service offers a protected way to connect to the Internet, encrypting data users send over internet connections and enhancing levels of privacy online. With this service, users can confidently access private information such as passwords, bank details, and credit card numbers when using public Wi-Fi on PC, Mac, or mobile device without risk of compromise. Users can also connect globally to their favorite apps, websites, and online streaming by changing their virtual location. This service also limits the ability of websites to track users, thereby eliminating persistent personalized ads based on browsing history. |
Sales and Go-to-Market Strategy
Our go-to-market network includes direct sales forces and broad e-commerce capabilities, as well as indirect sales resources that support our global partner ecosystem. We also maintain strategic relationships with a number of original equipment manufacturers (OEMs), Internet service providers (ISPs), global service integrators (GSIs), wireless carriers, and retail and online stores through which we market and sell our products.
Enterprise
We sell and market our products and services to large enterprises, including business, government, and public-sector customers, through our field sales force and reseller channels. Our field sales team leverages our global partner ecosystem, primarily targeting senior executives and IT department personnel responsible for managing a company’s highest-order IT and cyber security initiatives.
We also sell and market our products and services to small, medium, and large businesses through field sales and inside sales forces that leverage indirect sales partners around the world, who are specifically trained and certified to sell our solutions. These partners include national solution providers, regional solution providers, national account resellers, global/federal system integrators, and managed service providers.
Our enterprise products and services are also available on our e-commerce platform, as well as through authorized distributors, GSIs, and OEMs, who incorporate our technologies into their products, bundle our products with their offerings, or serve as authorized resellers of our products.
Consumer
We sell and market our consumer products and services to individuals, households, and small businesses globally. We bring these products to market through direct marketing and co-marketing programs supported by our e-commerce and tele-sales platforms. In addition, we utilize Internet-based resellers, system builders, ISPs, employee benefits providers, wireless carriers, retailers, and OEMs to distribute our offerings worldwide. We drive consumer business growth through global brand and demand campaigns, new customer acquisition, retention focused cross-selling, and customer success programs.
Research and Development
Symantec embraces a global research and development strategy to drive organic innovation and product integration across our portfolio. Our engineering and product management teams are focused on delivering new versions of existing product lines, as well as developing entirely new products and services to drive the company’s leadership in cyber security. We also have a technology research organization focused on short, medium, and longer-term applied research projects, with the goal of transferring completed innovations into our product groups for commercialization.
Symantec’s Security Technology and Response organization is a global team of security engineers, threat analysts, and researchers who provide the underlying functionality, content, and support for many of our solutions. These front-line security experts analyze threat telemetry collected through our vast cyber intelligence networks to protect our customers against current and emerging threats. Our research and development teams also leverage these vast data sets and insights to develop new technologies and approaches in order to improve security outcomes for our customers.
We believe that technical leadership is essential to our success, and we expect to continue to commit substantial resources to research and development.
Product and Technical Support
Symantec has support facilities throughout the world, staffed by technical product experts knowledgeable in the operating environments in which our products are deployed. Our support experts assist customers with both issue resolution and threat detection.
We provide Enterprise Security customers with various levels of technical support and customer success services. Our support program offers annual maintenance support contracts, including content, updates, and technical support. Our Essential Support includes: self-service options, assisted support delivered by telephone or electronically during contracted-for hours, immediate patches for severe problems, periodic software updates, and access to our technical knowledge base and frequently asked questions. Our Premium Support includes all Essential Support services with the addition of proactive health checks, assigned technical contacts, and other customer success activities.
Our Consumer Cyber Safety support includes self-help online services and phone, chat, and email support worldwide. Most of our Norton Security products come with automatic downloads of the latest virus definitions, application bug fixes, and patches, as well as a “Virus Protection Promise,” which in some markets provides free virus removal services to customers whose protected computers become infected. Our Consumer Cyber Safety service and support offerings come with 24x7x365 customer support, along with alert resolution, lost wallet protection, and restoration services during normal business hours.
Competition
Our markets are consolidating, highly competitive, and subject to rapid changes in technology. The competitive landscape has changed significantly over the past few years, with new competition arising. Some of the market growth has come from startups that focus on solving a particular issue or delivering a niche-oriented product, and from larger integration providers that increasingly seek to add to or extend their offerings. We focus on delivering comprehensive customer solutions, integrating across our broad product portfolio, and partnering with other technology providers to differentiate our offerings and platforms from the competition.
In addition to the competition we face from direct competitors, we face indirect or potential competition from retailers, application providers, operating system providers, network equipment manufacturers, and other OEMs who may provide various solutions and functions in their current and future offerings. We compete with these same parties to acquire technologies, products, or companies. We also compete with other software companies in our effort to place our products on the computer equipment sold to consumers and enterprises by OEMs. We compete for access to distribution channels and for spending at the retail level for our consumer offerings and in corporate accounts for our enterprise offerings.
Our Enterprise Security competitors vary by product category, geography, channel, and customer size:
| • | Endpoint security competitors include McAfee LLC (McAfee), Microsoft, CrowdStrike, Inc., and Carbon Black, Inc., as well as several point-product competitors, freeware providers, and regional security companies. |
| • | Network security competitors include Palo Alto Networks Inc. (Palo Alto), FireEye Inc. (FireEye), Cisco Systems, Inc. (Cisco), McAfee, Forcepoint LLC (Forcepoint), and Zscaler, Inc., as well as other established and emerging companies. |
| • | Cloud security competitors include Cisco, McAfee, Microsoft, and Netskope, Inc., as well as other established and emerging companies. We expect additional competition as the market for security-as-a-service continues to develop and expand. |
| • | Email security competitors include Proofpoint, Inc. and Microsoft. |
| • | Advanced threat protection competitors include McAfee, Palo Alto, FireEye, International Business Machines Corporation (IBM), and Dell EMC, as well as Niksun Inc. and Trend Micro Inc. (Trend Micro). As new IT budgets are created to address next-generation threats, we expect to compete with additional specialized vendors, as well as larger vendors that may continue to acquire or bundle their products. |
| • | Information protection competitors include RSA (a Dell Technologies business), McAfee, Forcepoint, Digital Guardian, Inc., and Microsoft. |
| • | Cyber security services and managed security services competitors include FireEye, IBM, and SecureWorks Corporation, as well as other additional established and emerging companies. |
Our Consumer Cyber Safety competitors vary by product category, geography, and channel. Norton Security competitors include Avast Software s.r.o., McAfee, Microsoft, and Trend Micro. Consumer backup product competitors include Carbonite, Inc. LifeLock identity theft protection competitors include credit bureaus Experian PLC, Equifax Inc., and TransUnion, as well as others including Affinion Group, Inc., Anchor Free, Inc., Credit Karma, Inc., and Intersections, Inc.
We believe that the principal competitive factors necessary to be successful in our industry include product quality and effectiveness, time-to-market, price, reputation, financial stability, breadth of product offerings, customer support, brand recognition, and effective sales and marketing efforts.
Intellectual Property
Protective measures
Our intellectual property is an important and vital asset of the company that enables us to develop, market, and sell our products and services and enhance our competitive position. Intellectual property includes our proprietary business and technical know-how, inventions, works of authorship, and confidential information. To protect our intellectual property, we rely primarily upon legal rights in trade secrets, patents, copyrights, and trademarks, in addition to company policies and procedures, security practices, contracts, and relevant operational measures.
We protect the confidentiality of proprietary information by entering into non-disclosure agreements with our employees, contractors, and channel and business partners, and we enter into license agreements with respect to our software and proprietary information that include confidentiality terms. These agreements are generally non-transferable and have either a perpetual or time-limited term. We also publish company policies on trade secret protection and employ access controls and associated security measures to protect our facilities, equipment, and networks.
Patents, copyrights, trademarks, and licenses
We maintain an internal patent program with the objective of identifying inventions that provide the basis for new patent applications in areas of importance to our business. We have approximately 2,345 U.S. patents, in addition to foreign patents and pending U.S. and foreign patent applications, which relate to inventive aspects of our products and technology. The duration of our patents is determined by the laws of the issuing country. In the U.S., this is typically twenty years from the date of filing of the priority patent application resulting in the patent, which we believe is adequate relative to expected product lifecycles.
Our products, particularly our software and related documentation, are protected under U.S. and international copyright laws and laws related to the protection of intellectual property and proprietary rights. We employ procedures to label copyrightable works with the appropriate proprietary rights notices, and we actively enforce these rights in the U.S. and abroad. However, these measures may not provide adequate protection, and our intellectual property rights may be challenged.
Symantec, Norton, LifeLock, and associated logos, including the checkmark in a circle logo, are trademarks or registered trademarks of the company in the U.S. and other countries in which we conduct business. In addition, we have used, registered, or applied to register other trademarks and service marks to help distinguish our products and services from those of our competitors. We actively enforce our trademark, service mark, and trade name rights in the U.S. and abroad based on our rights under common law, and various U.S. and foreign laws and regulations, as well as rights under international treaties and conventions. The duration of our trademark registrations varies from country to country. In the U.S., we are generally able to maintain our trademark rights and renew trademark registrations for as long as the trademarks are in use.
In limited cases, we license intellectual property from third parties for use in our products and generally must rely on those third parties to protect the licensed rights. This can include open source software which is not subject to proprietary rights protection. While the ability to maintain and protect our intellectual property rights is important to our success, we believe our business is not materially dependent on any individual patent, copyright, trademark, trade secret, license, or other intellectual property right.
Seasonality
As is typical for many technology companies, our business is subject to seasonality. See our quarterly results of operations in “Selected Quarterly Financial Data (Unaudited)” included in Part II, Item 8 of this Annual Report on Form 10-K.
Corporate Responsibility
Our annual Corporate Responsibility Report can be found via the Symantec website at https://www.symantec.com/about/corporate-responsibility. The information contained, or referred to, on our website, including our Corporate Responsibility Report, is not part of this annual report unless expressly noted.
Employees
As of March 29, 2019, we employed more than 11,900 people worldwide.
Available information
Our Internet home page is located at www.symantec.com. We make available free of charge our annual reports on Form 10-K, quarterly reports on Form 10-Q, current reports on Form 8-K, and amendments to those reports as soon as reasonably practicable after we electronically file such material with the Securities and Exchange Commission (SEC) on our investor relations website located at www.symantec.com/invest. The information contained, or referred to, on our website is not part of this annual report unless expressly noted. The SEC maintains a website that contains reports, proxy and information statements, and other information regarding our filings at http://www.sec.gov.
Item 1A. Risk Factors
A description of the risk factors associated with our business is set forth below. The list is not exhaustive, and you should carefully consider these risks and uncertainties before investing in our common stock.
A decrease in demand for our solutions could adversely affect our financial results.
We are subject to fluctuations in demand for our solutions due to a variety of factors, including market transitions, general economic conditions, competition, product obsolescence, technological change, shifts in buying patterns, the timing and duration of hardware refresh cycles, financial difficulties and budget constraints of our current and potential customers, public awareness of security threats to IT systems, and other factors. While such factors may, in some periods, increase product sales, fluctuations in demand can also negatively impact our sales. If demand for our solutions declines, whether due to general economic conditions, a shift in buying patterns or otherwise, our revenues and margins would likely be adversely affected.
Fluctuations in our quarterly financial results have affected the trading price of our outstanding securities in the past and could affect the trading price of our outstanding securities in the future.
Our quarterly financial results have fluctuated in the past and are likely to vary in the future due to a number of factors, many of which are outside of our control. If our quarterly financial results or our predictions of future financial results fail to meet our expectations or the expectations of securities analysts and investors, the trading price of our outstanding securities could be negatively affected. Volatility in our quarterly financial results may make it more difficult for us to raise capital in the future or pursue acquisitions. Our operating results for prior periods may not be effective predictors of our future performance.
Factors associated with our industry, the operation of our business, and the markets for our solutions may cause our quarterly financial results to fluctuate, including but not limited to:
| • | Fluctuations in our revenue due to the transition of our sales contracts to a higher mix of products subject to ratable versus point-in-time revenue recognition; |
| • | Fluctuations in demand for our solutions; |
| • | Entry of new competition into our markets; |
| • | Our ability to achieve targeted operating income and margins and revenues; |
| • | Competitive pricing pressure for one or more of our classes of our solutions; |
| • | Our ability to timely complete the release of new or enhanced versions of our solutions; |
| • | The number, severity, and timing of threat outbreaks (e.g. worms, viruses, malware, ransomware, and other malicious threats) and cyber security incidents (e.g., large scale data breaches); |
| • | Our resellers making a substantial portion of their purchases near the end of each quarter; |
| • | Customers’ tendency to negotiate licenses and other agreements near the end of each quarter; |
| • | Cancellation, deferral, or limitation of orders by customers; |
| • | Loss of customers or strategic partners; |
| • | Changes in the mix or type of products and subscriptions sold and changes in the renewal rates for our subscriptions; |
| • | The rate of adoption of new technologies, new releases of operating systems, and new business processes; |
| • | Consumer confidence and spending changes, which could be impacted by market changes and general economic conditions, among other reasons; |
| • | Political and military instability caused by war or other events, which could slow spending within our target markets, delay sales cycles, and otherwise adversely affect our ability to generate revenues and operate effectively; |
| • | The timing, rate and pricing of customer purchases to replace older versions of our hardware products that have reached end of life; |
| • | The impact of litigation, regulatory inquiries, or investigations; |
| • | The timing and extent of significant restructuring charges; |
| • | The impact of acquisitions and our ability to achieve expected synergies; |
| • | Disruptions in our business operations or target markets caused by, among other things, terrorism or other intentional acts, outbreaks of disease, or earthquakes, floods, or other natural disasters; |
| • | Fluctuations in foreign currency exchange rates; |
| • | Movements in interest rates; and |
| • | Changes in tax laws, rules, and regulations. |
Any of the foregoing factors could cause the trading price of our outstanding securities to fluctuate significantly.
Our business depends on customers renewing their arrangements for maintenance, subscriptions, managed security services, and cloud-based (cloud) offerings.
A large portion of our Enterprise Security revenue is derived from arrangements for maintenance, subscriptions, managed security services, and cloud offerings, yet customers have no contractual obligation to purchase additional solutions after the initial subscription or contract period. In particular, term-based license subscriptions and cloud-based products are increasing as
a percentage of our total revenues. While we believe our customers’ renewal rates, in general, have been relatively stable in recent periods, customer retention and renewal rates may decline or fluctuate as a result of a number of factors, including our customers’ level of satisfaction with our solutions or our customer support, customer budgets, and the pricing of our solutions compared with the solutions offered by our competitors, any of which may cause our revenue to grow more slowly than expected, or to decline. Accordingly, we must invest significant time and resources in providing ongoing value to our customers. If these efforts fail, if our customers do not renew for other reasons, or if our customers renew on terms less favorable to us, our revenue may decline, and our business will suffer.
If we are unable to develop new and enhanced solutions that achieve widespread market acceptance, or if we are unable to continually improve the performance, features, and reliability of our existing solutions or adapt our business model to keep pace with industry trends, our competitive position may weaken, and our business and operating results could be adversely affected.
Our future success depends on our ability to effectively respond to the rapidly changing needs of our customers, as well as competitive technological developments and industry changes, by developing or introducing new and enhanced solutions on a timely basis.
We have in the past incurred, and will continue to incur, significant research and development expenses as we strive to remain competitive. If we are unable to anticipate or react to competitive challenges or if existing or new competitors gain market share in any of our markets, our competitive position could weaken, and we could experience a decline in our sales that could adversely affect our business and operating results. Additionally, we must continually address the challenges of dynamic and accelerating market trends and competitive developments, such as the emergence of advanced persistent threats in the security space, the continued volatility in the PC market, the market shift towards mobility, and the increasing transition towards subscription and cloud-based solutions, all of which continue to make it more difficult for us to compete effectively.
Showing the first 8K of 76K characters. Open the full section
Item 1B. Unresolved Staff Comments
There are no unresolved issues with respect to any Commission staff’s written comments that were received at least 180 days before the end of our fiscal year to which this report relates and that relate to our periodic or current reports under the Exchange Act.
Item 2. Properties
Not applicable.
Item 3. Legal Proceedings
Information with respect to this Item may be found under the heading “Litigation contingencies” in Note 16 to the Consolidated Financial Statements in this Annual Report on Form 10-K which information is incorporated into this Item 3 by reference.
Item 4. Mine Safety Disclosures
Not applicable.
PART II
Item 5. Market for Registrant’s Common Equity, Related Stockholder Matters and Issuer Purchases of Equity Securities
Stockholders of record
Our common stock is traded on the Nasdaq Global Select Market under the symbol “SYMC.” As of March 29, 2019, there were 1,601 stockholders of record.
Stock performance graph
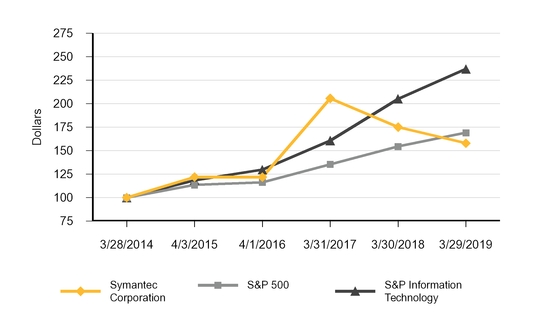
The graph below compares the cumulative total stockholder return on our common stock with the cumulative total return on the S&P 500 Composite Index and the S&P Information Technology Index for the five fiscal years ended March 29, 2019 (assuming the initial investment of $100 in our common stock and in each of the other indices on the last day of trading for fiscal 2014 and the reinvestment of all dividends). The comparisons in the graph below are based on historical data and are not indicative of, nor intended to forecast the possible future performance of our common stock.
COMPARISON OF FIVE-YEAR CUMULATIVE TOTAL RETURN
Among Symantec Corporation, the S&P 500 Index
and the S&P Information Technology Index
This performance graph shall not be deemed “filed” for purposes of Section 18 of the Exchange Act or otherwise subject to the liabilities under that Section and shall not be deemed to be incorporated by reference into any filing of Symantec under the Securities Act or the Exchange Act.
Dividends
During fiscal 2019 and 2018, we declared and paid aggregate cash dividends and dividend equivalents of $217 million or $0.30 per common share, and $211 million or $0.30 per common share, respectively. All future dividends are subject to the approval of our Board of Directors.
Repurchases of our equity securities
Through our stock repurchase programs we have repurchased shares of our common stock since the fourth quarter of fiscal 2004. Under these programs, shares may be repurchased on the open market and through accelerated stock repurchase transactions. In January 2019, our Board of Directors increased their authorization by $500 million. As of March 29, 2019, we have $1,048 million remaining authorized to be completed in future periods with no expiration date. Stock repurchases during the three months ended March 29, 2019, were as follows:
| (In millions, except per share data) | Total Number of Shares Purchased (1) | Average Price Paid per Share | Total Number of Shares Purchased as Part of Publicly Announced Program | Maximum Dollar Value of Shares That May Yet Be Purchased Under the Plans or Programs | |||||||||
| December 29, 2018 to January 25, 2019 | — | $ | — | — | $ | 800 | |||||||
| January 26, 2019 to February 22, 2019 | — | $ | — | — | $ | 1,300 | |||||||
| February 23, 2019 to March 29, 2019 | 11 | $ | 22.68 | 11 | $ | 1,048 | |||||||
| Total number of shares repurchased | 11 | 11 |
(1) The number of shares purchased is reported on trade date. As of March 29, 2019, approximately 1 million share repurchases at the average price per share of $22.95 were executed but not settled until April 2019.
Item 6. Selected Financial Data
The following selected consolidated financial data is derived from our Consolidated Financial Statements. This data should be read in conjunction with our Consolidated Financial Statements and related notes included in this annual report and with Item 7. Management’s Discussion and Analysis of Financial Condition and Results of Operations. Historical results may not be indicative of future results.
Five-Year Summary
| Summary of Operations: | Year Ended (1) | ||||||||||||||||||
| (In millions, except per share data) | March 29, 2019 (2) | March 30, 2018 (3) | March 31, 2017 (4) | April 1, 2016 (5) | April 3, 2015 | ||||||||||||||
| Net revenues | $ | 4,731 | $ | 4,834 | $ | 4,019 | $ | 3,600 | $ | 3,956 | |||||||||
| Operating income (loss) | $ | 380 | $ | 49 | $ | (100 | ) | $ | 457 | $ | 154 | ||||||||
| Income (loss) from continuing operations (3) | $ | 16 | $ | 1,127 | $ | (236 | ) | $ | (821 | ) | $ | 109 | |||||||
| Income from discontinued operations, net of income taxes (5) | $ | 15 | $ | 11 | $ | 130 | $ | 3,309 | $ | 769 | |||||||||
| Net income (loss) | $ | 31 | $ | 1,138 | $ | (106 | ) | $ | 2,488 | $ | 878 | ||||||||
| Income (loss) per share - basic: (6) | |||||||||||||||||||
| Continuing operations | $ | 0.03 | $ | 1.83 | $ | (0.38 | ) | $ | (1.23 | ) | $ | 0.16 | |||||||
| Discontinued operations | $ | 0.02 | $ | 0.02 | $ | 0.21 | $ | 4.94 | $ | 1.12 | |||||||||
| Net income (loss) per share - basic | $ | 0.05 | $ | 1.85 | $ | (0.17 | ) | $ | 3.71 | $ | 1.27 | ||||||||
| Income (loss) per share - diluted: (6) | |||||||||||||||||||
| Continuing operations | $ | 0.02 | $ | 1.69 | $ | (0.38 | ) | $ | (1.23 | ) | $ | 0.16 | |||||||
| Discontinued operations | $ | 0.02 | $ | 0.02 | $ | 0.21 | $ | 4.94 | $ | 1.10 | |||||||||
| Net income (loss) per share - diluted | $ | 0.05 | $ | 1.70 | $ | (0.17 | ) | $ | 3.71 | $ | 1.26 | ||||||||
| Cash dividends declared per common share | $ | 0.30 | $ | 0.30 | $ | 0.30 | $ | 4.60 | $ | 0.60 |
| Consolidated Balance Sheets Data: | |||||||||||||||||||
| (In millions) | March 29, 2019 | March 30, 2018 | March 31, 2017 | April 1, 2016 | April 3, 2015 | ||||||||||||||
| Cash, cash equivalents and short-term investments | $ | 2,043 | $ | 2,162 | $ | 4,256 | $ | 6,025 | $ | 3,860 | |||||||||
| Total assets | $ | 15,938 | $ | 15,759 | $ | 18,174 | $ | 11,767 | $ | 13,233 | |||||||||
| Long-term debt | $ | 3,961 | $ | 5,026 | $ | 6,876 | $ | 2,207 | $ | 1,746 | |||||||||
| Total stockholders’ equity | $ | 5,738 | $ | 5,023 | $ | 3,487 | $ | 3,676 | $ | 5,935 |
| (1) | We have a 52/53-week fiscal year. Our fiscal 2019, 2018, 2017, and 2016 each consisted of 52 weeks, whereas fiscal 2015 was a 53-week year. |
| (2) | We adopted the new revenue recognition accounting standard on a modified retrospective basis during the first quarter of fiscal 2019. The results for fiscal 2019 are presented under the new revenue recognition accounting standard, while prior years are not adjusted. |
| (3) | In fiscal 2018, we sold Website Security (WSS) and Public Key Infrastructure (PKI) solutions and recognized a gain of $653 million before income taxes associated with the sale (see Note 4 to the Consolidated Financial Statements), and we recognized an income tax benefit of $659 million as a result of the enactment of the Tax Cuts and Jobs Act (H.R.1) (the 2017 Tax Act) (see Note 11 to the Consolidated Financial Statements). |
| (4) | In fiscal 2017, we acquired Blue Coat and LifeLock, and the results of operations of those entities were included from their respective dates of acquisition (see Note 4 to the Consolidated Financial Statements). |
| (5) | In fiscal 2016, we recorded $1.1 billion in income tax expense related to unremitted earnings of foreign subsidiaries from the proceeds of the sale of our Veritas information management business. This charge was presented in loss from continuing operations in the Consolidated Statements of Operations. As a result of the sale, a net gain of $3.0 billion was presented as part of income from discontinued operations, net of income taxes. |
| (6) | Net income per share amounts may not add due to rounding. |
Item 7. Management’s Discussion and Analysis of Financial Condition and Results of Operations
Please read the following discussion and analysis of our financial condition and results of operations together with our Consolidated Financial Statements and related Notes thereto included under Item 15 of this Annual Report on Form 10-K.
OVERVIEW
Symantec Corporation is a global leader in cyber security. We provide cyber security products, services, and solutions to organizations and individuals worldwide. Founded in 1982, we have operations in more than 45 countries.
Our segments consist of:
| • | Enterprise Security. Our Enterprise Security segment focuses on providing our Integrated Cyber Defense solutions to help business and government customers unify cloud and on-premises security to deliver a more effective cyber defense solution, while driving down cost and complexity. |
| • | Consumer Cyber Safety. Our Consumer Cyber Safety segment focuses on providing cyber safety solutions under our Norton LifeLock brand to help consumers protect their devices, online privacy, identities, and home networks. |
For additional information about our offerings, see the discussion in Item 1. Business, under the heading “Products and Services.”
Fiscal calendar and basis of presentation
We have a 52/53-week fiscal year ending on the Friday closest to March 31. Fiscal 2019, 2018, and 2017 in this report refers to fiscal year ended March 29, 2019, March 30, 2018, and March 31, 2017, respectively, each of which was a 52-week year.
Our financial results for fiscal 2019 are presented in accordance with the new revenue standard that was adopted under the modified retrospective method at the beginning of fiscal 2019. Prior period results have not been restated. Refer to Note 2 of our notes to Consolidated Financial Statements for further details about our recent adoption of this accounting guidance.
Key financial metrics
The following table provides our key financial metrics for fiscal 2019 compared with fiscal 2018:
| (In millions, except for percentages and per share amounts) | Fiscal 2019 | Fiscal 2018 | |||||
| Net revenues | $ | 4,731 | $ | 4,834 | |||
| Operating income | $ | 380 | $ | 49 | |||
| Net income | $ | 31 | $ | 1,138 | |||
| Net income per share - diluted | $ | 0.05 | $ | 1.70 | |||
| Net cash provided by operating activities | $ | 1,495 | $ | 950 | |||
| As of | |||||||
| March 29, 2019 | March 30, 2018 | ||||||
| Cash, cash equivalents and short-term investments | $ | 2,043 | $ | 2,162 | |||
| Contract liabilities | $ | 3,056 | $ | 3,103 |
| • | Net revenues decreased 2% primarily due to the divestiture of our website security (WSS) and public key infrastructure (PKI) solutions in fiscal 2018, partially offset by increased revenue from our identity and information protection solutions. |
| • | Operating income increased $331 million primarily due to increased revenue from our identity and information protection solutions in our Consumer Cyber Safety segment, lower stock-based compensation expense, and lower restructuring, transition, and other costs, partially offset by the negative impact to Enterprise Security segment operating income due to the fiscal 2018 divestiture of WSS and PKI solutions. |
| • | Net income and diluted net income per share decreased primarily due to the absence in fiscal 2019 of the gain on the divestiture of WSS and PKI solutions and a net income tax benefit as a result of the passage of the 2017 Tax Act, both of which occurred during fiscal 2018. |
| • | Net cash provided by operating activities increased $545 million due to higher net income adjusted for non-cash items, partially offset by unfavorable net changes in operating assets and liabilities. |
| • | Cash, cash equivalents and short-term investments decreased $119 million compared to March 30, 2018, primarily due to cash used for repayment of debt, stock repurchases, and payments of dividends, partially offset by cash from operations. |
| • | Contract liabilities decreased $47 million compared to March 30, 2018, primarily due to a decrease of $169 million in the March 30, 2018 balances as a result of the adoption of the new revenue recognition standard, partially offset by higher billings versus recognized revenue during fiscal 2019. |
CRITICAL ACCOUNTING POLICIES AND ESTIMATES
The preparation of our Consolidated Financial Statements and related notes in accordance with generally accepted accounting principles in the U.S. (GAAP) requires us to make estimates, including judgments and assumptions that affect the reported amounts of assets, liabilities, revenue and expenses, and related disclosure of contingent assets and liabilities. We have based our estimates on historical experience and on various assumptions that we believe to be reasonable under the circumstances. We evaluate our estimates on a regular basis and make changes accordingly. Management believes that the accounting estimates employed, and the resulting amounts are reasonable; however, actual results may differ from these estimates. Making estimates and judgments about future events is inherently unpredictable and is subject to significant uncertainties, some of which are beyond our control. Should any of these estimates and assumptions change or prove to have been incorrect, it could have a material impact on our results of operations, financial position, and cash flows.
A summary of our significant accounting policies is included in Note 1 of the Notes to Consolidated Financial Statements included in this Annual Report on Form 10-K. An accounting policy is deemed to be critical if it requires an accounting estimate to be made based on assumptions about matters that are highly uncertain at the time the estimate is made, if different estimates reasonably could have been used, or if changes in the estimate that are reasonably possible could materially impact the financial statements. Management believes the following critical accounting policies reflect the significant estimates and assumptions used in the preparation of our Consolidated Financial Statements.
Revenue recognition
We recognize revenue primarily pursuant to the requirements under the authoritative guidance on contracts with customers. Revenue recognition requirements are very complex and require us to make estimates and assumptions.
We enter into arrangements with multiple performance obligations, which may include hardware, software licenses, cloud services, support and maintenance, and professional services. We allocate revenue to each performance obligation on a relative fair value basis based on management’s estimate of stand-alone selling price (SSP). Judgments are required to determine the SSP for each performance obligation. The determination of SSP is made by taking into consideration observable prices in historical transactions. When observable prices in historical transactions are not available or are inconsistent, we estimate SSP based on observable prices in historical transactions of similar products, pricing discount practices, product margins, and other factors that may vary over time depending upon the unique facts and circumstances related to each performance obligation. Changes to the performance obligations in an arrangement, the judgments required to estimate the SSP for the respective performance obligations, and increasing variability in contractual arrangements could materially impact the amount and timing of revenue recognition.
Valuation of goodwill, intangible assets, and long-lived assets
Business combinations. We allocate the purchase price of acquired businesses to the tangible and identifiable intangible assets acquired and liabilities assumed based on their estimated fair values on the acquisition date. Any residual purchase price is recorded as goodwill. Goodwill is allocated to reporting units expected to benefit from the business combination. The allocation of purchase price requires management to make significant estimates and assumptions in determining the fair values of the assets acquired and liabilities assumed especially with respect to intangible assets.
Critical estimates in valuing intangible assets include, but are not limited to, future expected cash flows from customer relationships, developed technology, trade names, and acquired patents; and discount rates. Management estimates of fair value are based upon assumptions believed to be reasonable, but which are inherently uncertain and unpredictable. Unanticipated events and circumstances may occur which may affect the accuracy or validity of such assumptions, estimates, or actual results.
Income taxes
We are subject to tax in multiple U.S. and foreign tax jurisdictions. We are required to estimate the current tax exposure as well as assess the temporary differences between the accounting and tax treatment of assets and liabilities, including items such as accruals and allowances not currently deductible for tax purposes. We apply judgment in the recognition and measurement of current and deferred income taxes which includes the following critical accounting estimates.
We use a two-step process to recognize liabilities for uncertain tax positions. The first step is to evaluate the tax position for recognition by determining if the weight of available evidence indicates that it is more likely than not that the position will be sustained on audit, including resolution of related appeals or litigation processes, if any. If we determine that the tax position will more likely than not be sustained on audit, the second step requires us to estimate and measure the tax benefit as the largest amount that is more than 50% likely to be realized upon ultimate settlement. It is inherently difficult and subjective to estimate such amounts, as this requires us to determine the probability of various outcomes. We re-evaluate these uncertain tax positions on a quarterly basis. This evaluation is based on factors including, but not limited to, changes in facts or circumstances, changes in tax law, effectively settled issues under audit, and new audit activity. Such a change in recognition or measurement would result in the recognition of a tax benefit or an additional charge to the tax provision in the period.
As of December 28, 2018, we have completed our accounting for the effects of the enactment of the 2017 Tax Act in accordance with U.S. Securities and Exchange Commission Staff Accounting Bulletin No. 118, and the amounts are no longer considered provisional. We continue to evaluate any new guidance from the U.S. Department of Treasury and the IRS as issued.
Stock-based compensation
Stock-based compensation expense is measured at the grant date based on the fair value of the award. We recognize stock-based compensation cost over the award’s requisite service period on a straight-line basis except for performance-based restricted stock units (PRUs) with graded vesting which we recognize on a graded basis. For awards with performance conditions, the amount of compensation cost we recognize over the requisite service period is based on the actual achievement of the performance condition or management’s best estimate of the achievement if not yet known. No compensation cost is ultimately recognized for forfeited awards in which employees do not render the requisite service. We estimate the number of stock-based awards that will be forfeited due to employee turnover. Our forfeiture assumption is primarily based on historical experience.
The fair value of each restricted stock unit (RSU) and PRU that does not contain a market condition is equal to the market value of our common stock on the date of grant. The fair value of each PRU that contains a market condition is estimated using the Monte Carlo simulation option pricing model. The fair values of RSUs and PRUs are not discounted by the dividend yield because our RSUs and PRUs are entitled to dividend equivalents to be paid in the form of cash upon vesting for each share of the underlying unit.
We use the Black-Scholes model to determine the fair value of unvested stock options assumed in acquisitions. The determination of the fair value of awards using the Black-Scholes model is affected by our stock price as well as assumptions regarding a number of complex and subjective variables. If the acquired companies lack sufficient historical exercise data to provide a reasonable basis upon which to estimate expected term, we estimate the expected life of assumed options using the “simplified method”. For vested options, this represents the midpoint between the valuation date and the contractual term. For unvested options, this represents the midpoint between the average vesting time and full contractual term. Expected volatility is based on the average of historical volatility over the most recent period commensurate with the expected life of the option and the implied volatility of traded options. The risk-free interest rate is equal to the U.S. Treasury rates for the period equal to the expected life. The options assumed are without dividend equivalents, and their fair values are discounted by our dividend yield.
We will continue to use judgment in evaluating the assumptions related to our stock-based compensation on a prospective basis. As we continue to accumulate additional data related to our common stock, we may have refinements to our estimates which could materially impact our future stock-based compensation expense.
Loss contingencies
We are subject to contingencies that expose us to losses, including various legal and regulatory proceedings, asserted and potential claims that arise in the ordinary course of business. An estimated loss from such contingencies is recognized as a charge to income if it is probable that a liability has been incurred and the amount of the loss can be reasonably estimated. Judgment is required in both the determination of probability and the determination as to whether a loss is reasonably estimable. We review the status of each significant matter quarterly, and we may revise our estimates. Until the final resolution of such matters, there may be an exposure to loss in excess of the amount recorded, and such amounts could be material. Should any of our estimates and assumptions change or prove to have been incorrect, it could have a material impact on our consolidated financial statements for that reporting period.
RESULTS OF OPERATIONS
Pursuant to instruction 1 of the instructions to paragraph 303(a) of Regulation S-K, discussion of the results of operations from fiscal year 2018 to fiscal year 2017 has been omitted. Such omitted discussion can be found under Item 7 of our annual report on Form 10-K for the fiscal year ended March 30, 2018, filed with the Commission on October 26, 2018.
Fiscal 2019 compared to fiscal 2018
The following table sets forth our Consolidated Statements of Operations data as a percentage of net revenues for the periods indicated:
| Fiscal Year | |||||
| 2019 | 2018 | ||||
| Net revenues | 100 | % | 100 | % | |
| Cost of revenues | 22 | 21 | |||
| Gross profit | 78 | 79 | |||
| Operating expenses: | |||||
| Sales and marketing | 32 | 33 | |||
| Research and development | 19 | 20 | |||
| General and administrative | 9 | 12 | |||
| Amortization of intangible assets | 4 | 5 | |||
| Restructuring, transition and other costs | 5 | 8 | |||
| Total operating expenses | 70 | 78 | |||
| Operating income | 8 | 1 | |||
| Interest expense | (4 | ) | (5 | ) | |
| Gain on divestiture | — | 14 | |||
| Other expense, net | (1 | ) | — | ||
| Income from continuing operations before income taxes | 2 | 9 | |||
| Income tax expense (benefit) | 2 | (14 | ) | ||
| Income from continuing operations | — | 23 | |||
| Income from discontinued operations, net of income taxes | — | — | |||
| Net income | 1 | % | 24 | % |
Note: The percentages may not add due to rounding.
Net revenues
| Fiscal Year | Variance in | |||||||||||||
| (In millions, except for percentages) | 2019 | 2018 | Dollars | Percent | ||||||||||
| Net revenues | $ | 4,731 | $ | 4,834 | $ | (103 | ) | (2 | )% |
Net revenues decreased primarily due to a $231 million decrease from our Enterprise Security segment as a result of the divestiture of our WSS and PKI solutions, partially offset by an increase of $128 million from our Consumer Cyber Safety segment. The adoption of the new revenue accounting standard had a favorable impact of $47 million on our fiscal 2019 revenues.
Net revenues by geographical region
Percentage of revenue by geographic region as presented below is based on the billing location of the customer.
| Fiscal Year | |||||
| 2019 | 2018 | ||||
| Americas | 64 | % | 63 | % | |
| EMEA | 21 | % | 22 | % | |
| APJ | 15 | % | 16 | % |
Percentages may not add to 100% due to rounding.
The Americas include U.S., Canada, and Latin America; EMEA includes Europe, Middle East, and Africa; APJ includes Asia Pacific and Japan.
Cost of revenues
| Fiscal Year | Variance in | |||||||||||||
| (In millions, except for percentages) | 2019 | 2018 | Dollars | Percent | ||||||||||
| Cost of revenues | $ | 1,050 | $ | 1,032 | $ | 18 | 2 | % |
Our cost of revenues increased primarily due to a $51 million increase in our Consumer Cyber Safety segment, partially offset by a $37 million decrease from the divestiture of our WSS and PKI solutions.
Operating expenses
| Fiscal Year | Variance in | |||||||||||||
| (In millions, except for percentages) | 2019 | 2018 | Dollars | Percent | ||||||||||
| Sales and marketing | $ | 1,493 | $ | 1,593 | $ | (100 | ) | (6 | )% | |||||
| Research and development | 913 | 956 | (43 | ) | (4 | )% | ||||||||
| General and administrative | 447 | 574 | (127 | ) | (22 | )% | ||||||||
| Amortization of intangible assets | 207 | 220 | (13 | ) | (6 | )% | ||||||||
| Restructuring, transition and other costs | 241 | 410 | (169 | ) | (41 | )% | ||||||||
| Total | $ | 3,301 | $ | 3,753 | $ | (452 | ) | (12 | )% |
Sales and marketing expense decreased primarily due to a $51 million decrease in stock-based compensation expense and a $41 million decrease as a result of the divestiture of our WSS and PKI solutions.
Research and development expense decreased primarily due to a $66 million decrease in stock-based compensation expense.
General and administrative expense decreased primarily due to a $130 million decrease in stock-based compensation expense.
Amortization of intangible assets decreased primarily due to the intangible assets sold with the divestiture of WSS and PKI solutions.
Restructuring, transition and other costs reflect a decrease of $70 million in fiscal 2019 compared to fiscal 2018 in severance and other restructuring costs. In addition, fiscal 2018 costs included $88 million of transition related costs related to our fiscal 2018 divestiture of our WSS and PKI solutions compared to $3 million in fiscal 2019.
Non-operating income (expense), net
| Fiscal Year | Variance in | ||||||||||
| (In millions) | 2019 | 2018 | Dollars | ||||||||
| Interest expense | $ | (208 | ) | $ | (256 | ) | $ | 48 | |||
| Gain on divestiture | — | 653 | (653 | ) | |||||||
| Interest income | 42 | 24 | 18 | ||||||||
| Loss from equity interest | (101 | ) | (26 | ) | (75 | ) | |||||
| Foreign exchange loss | (18 | ) | (28 | ) | 10 | ||||||
| Other | 13 | 21 | (8 | ) | |||||||
| Total other income (expense), net | $ | (272 | ) | $ | 388 | $ | (660 | ) |
Non-operating income (expense), net, decreased primarily due to the absence of the fiscal 2018 $653 million gain on the divestiture of our WSS and PKI solutions. In addition, our loss from our equity interest received in connection with the divestiture of our WSS and PKI solutions increased $75 million, which was partially offset by a $48 million decrease in interest expense as a result of lower outstanding borrowings due to repayments.
Provision for income taxes
We are a U.S.-based multinational company subject to tax in multiple U.S. and international tax jurisdictions. A substantial portion of our international earnings were generated from subsidiaries organized in Ireland and Singapore. Our results of operations would be adversely affected to the extent that our geographical mix of income becomes more weighted toward jurisdictions with higher tax rates and would be favorably affected to the extent the relative geographic mix shifts to lower tax jurisdictions. Any change in our mix of earnings is dependent upon many factors and is therefore difficult to predict.
| Fiscal Year | |||||||
| (In millions, except for percentages) | 2019 | 2018 | |||||
| Income from continuing operations before income taxes | $ | 108 | $ | 437 | |||
| Provision for (benefit from) income taxes | $ | 92 | $ | (690 | ) | ||
| Effective tax rate on income from continuing operations | 85 | % | (158 | )% |
The increase in our effective tax rate in fiscal 2019 compared to fiscal 2018 was primarily due to one-time benefits from the 2017 Tax Act in fiscal 2018. In addition, increases in tax expense in fiscal 2019 are attributable to the valuation allowance on capital losses for which we cannot yet recognize a tax benefit.
Segment operating results
We do not allocate certain operating expenses to our operating segments that we manage separately at the corporate level and that are not used in evaluating the results of, or in allocating resources to, our segments. These unallocated expenses primarily consist of stock-based compensation expense, amortization of intangible assets, restructuring, transition and other costs, and acquisition-related costs in all periods presented. See Note 15 for more information.
Enterprise Security segment
| Fiscal Year | Variance in | |||||||||||||
| (In millions, except for percentages) | 2019 | 2018 | Dollars | Percent | ||||||||||
| Net revenues | $ | 2,323 | $ | 2,554 | $ | (231 | ) | (9 | )% | |||||
| Percentage of total net revenues | 49 | % | 53 | % | ||||||||||
| Operating income | $ | 269 | $ | 473 | $ | (204 | ) | (43 | )% | |||||
| Operating margin | 12 | % | 19 | % |
Revenue decreased primarily due to a $238 million decrease as a result of the fiscal 2018 divestiture of our WSS and PKI solutions, partially offset by a $47 million favorable impact from the adoption of the new revenue recognition standard. Operating income decreased primarily due to the divestiture of our WSS and PKI solutions which contributed $141 million to segment operating income in fiscal 2018.
Consumer Cyber Safety segment
| Fiscal Year | Variance in | |||||||||||||
| (In millions, except for percentages) | 2019 | 2018 | Dollars | Percent | ||||||||||
| Net revenues | $ | 2,408 | $ | 2,280 | $ | 128 | 6 | % | ||||||
| Percentage of total net revenues | 51 | % | 47 | % | ||||||||||
| Operating income | $ | 1,145 | $ | 1,111 | $ | 34 | 3 | % | ||||||
| Operating margin | 48 | % | 49 | % |
Revenue increased primarily due to a $161 million increase in revenue from sales of our identity and information protection products, partially offset by a $33 million decrease in revenue from sales of our consumer security solutions. Operating income increased primarily due to increased revenue, partially offset by higher allocated corporate costs and increased cost of revenues.
Performance Metrics
We regularly monitor a number of metrics in order to measure our current performance and estimate our future performance. Our metrics may be calculated in a manner different than similar metrics used by other companies.
The following table summarizes supplemental key performance metrics for our Consumer Cyber Safety segment:
| (In millions, except for per user amounts and percentages) | Fiscal 2019 | Fiscal 2018 | ||||
| Average direct customer count | 20.7 | 21.2 | ||||
| Direct average revenue per user (ARPU) | $ | 8.74 | $7.99/$8.23 (1) | |||
| Annual retention rate | 85 | % | 83 | % |
(1) Represents a non-GAAP financial measure. Estimated net revenue generated from direct customers during fiscal year 2018 used in the calculation of ARPU excluded a reduction in revenue related to contract liability purchase accounting adjustments required by GAAP, as further discussed below.
Average direct customer count presents the average of the total number of direct customers at the end of the most recently completed fiscal quarter and the end of the corresponding period in the prior fiscal year. We define direct customers as those customers in our Consumer Cyber Safety segment who have a direct billing relationship with us, including online acquisition and retention, affiliates, co-marketing, and original contract manufacturer channels.
ARPU is calculated as estimated direct customer revenues for the period divided by the average direct customer count for the same period, expressed as a monthly figure. We estimate direct customer net revenues to be $2.2 billion on a GAAP basis and $2.1 billion on a non-GAAP basis in fiscal year 2019 and 2018, respectively. Non-GAAP fiscal 2018 estimated direct customer revenues used in the calculation of ARPU is adjusted only to exclude a reduction in revenue of $60 million related to purchase accounting adjustments related to the February 2017 acquisition of LifeLock. ARPU for fiscal 2018 would have been $7.99 without this adjustment. We believe the adjustment is useful to investors to reflect ARPU trends in our business by improving the comparability of ARPU between periods. Fiscal 2019 did not include any adjustments to estimated direct customer revenue as the purchase accounting adjustments were fully amortized prior to that period. Non-GAAP estimated direct customer revenues and ARPU have limitations as analytical tools and should not be considered in isolation or as a substitute for GAAP estimated direct customer revenues or other GAAP measures. We monitor APRU because it helps us understand the rate at which we are monetizing our consumer customer base.
Annual retention rate is defined as the number of direct customers who have more than a one-year tenure as of the end of the most recently completed fiscal period divided by the total number of direct customers as of the end of the period from one year ago. We monitor annual retention rate to evaluate the effectiveness of our strategies to improve renewals of subscriptions.
Fiscal 2018 compared to fiscal 2017
The following table summarizes our continuing operations for fiscal 2018 compared with fiscal 2017:
| (In millions, except for percentages and per share amounts) | Fiscal 2018 | Fiscal 2017 | |||||
| Net revenues | $ | 4,834 | $ | 4,019 | |||
| Operating income (loss) | $ | 49 | $ | (100 | ) | ||
| Income (loss) from continuing operations | $ | 1,127 | $ | (236 | ) | ||
| Income (loss) per share from continuing operations - diluted | $ | 1.69 | $ | (0.38 | ) | ||
| Net cash provided by (used in) continuing operating activities | $ | 957 | $ | (145 | ) | ||
| As of | |||||||
| March 30, 2018 | March 31, 2017 | ||||||
| Cash, cash equivalents and short-term investments | $ | 2,162 | $ | 4,256 | |||
| Deferred revenue | $ | 3,103 | $ | 2,787 |
| • | Net revenues grew 20% in fiscal 2018 compared to fiscal 2017 primarily as a result of the inclusion of revenue from our Consumer Cyber Safety segment identity and information protection products acquired through our LifeLock acquisition at the end of fiscal 2017 for a full year and increased revenues from sales of our Enterprise Security segment network and web security solutions which included products acquired in our fiscal 2017 acquisition of Blue Coat, partially offset by a decrease in revenue as a result of the divestiture of our Enterprise Security segment WSS and PKI solutions. |
| • | Operating income increased primarily as a result of increased net revenues and our cost reduction initiatives and integration synergy program we announced in fiscal 2017. This increase was partially offset by increased operating expenses as a result of our fiscal 2017 acquisitions, including stock-based compensation, amortization of intangible assets, and advertising and promotional expenses. The increase in operating income was also partially offset by increased transition costs primarily due to costs related to our enterprise resource planning and supporting systems and separation costs related to the divestiture of our WSS and PKI solutions. |
| • | Income from continuing operations and diluted income per share from continuing operations increased primarily as a result of the $653 million gain on the divestiture of our WSS and PKI solutions and a net tax benefit of $690 million primarily as a result of the 2017 Tax Act. Partially offsetting the increase in the diluted income per share from continuing operations was a higher diluted share count due to including the dilutive effect of potentially issuable common shares under our equity award programs and convertible debt. Such potentially issuable common shares were excluded from our net loss per share computation in fiscal 2017 as they would have been anti-dilutive. |
| • | Cash, cash equivalents and short-term investments decreased primarily as a result of our $3.2 billion of debt repayments as part of our plan to deleverage our balance sheet and $401 million paid for acquisitions, partially offset by $933 million in net cash proceeds from the divestiture of our WSS and PKI solutions and cash flow from continuing operating activities of $957 million. |
| • | Cash flow from continuing operating activities increased primarily due to a one-time tax payment of $887 million related to the gain on sale from the divestiture of our Veritas information management business in fiscal 2017 and an increase in deferred revenue. |
| • | Deferred revenue increased $316 million primarily due to our shift in sales contracts to a higher mix of solutions subject to ratable versus point in time revenue recognition and longer contract duration in our Enterprise Security segment, which resulted in less in-period revenue recognized, and due to higher billings towards the end of the fiscal year, reflecting seasonal sales cycles in that segment. These factors were partially offset by a decrease of $319 million in deferred revenue as a result of the divestiture of our WSS and PKI solutions. |
Segment operating results
Enterprise Security segment
| Fiscal Year | Variance in | |||||||||||||
| (In millions, except for percentages) | 2018 | 2017 | Dollars | Percent | ||||||||||
| Net revenues | $ | 2,554 | $ | 2,355 | $ | 199 | 8 | % | ||||||
| Percentage of total net revenues | 53 | % | 59 | % | ||||||||||
| Operating income | $ | 473 | $ | 187 | $ | 286 | 153 | % | ||||||
| Operating margin | 19 | % | 8 | % |
Revenue increased $199 million primarily due to increases of $331 million in revenue from sales of our network and web security solutions and $36 million from sales of endpoint and information protection solutions, partially offset by a $184 million decrease in revenue as a result of the divestiture of our WSS and PKI solutions. Revenue during fiscal 2018 was also unfavorably affected by a shift in the mix of sales towards subscription and cloud-delivered solutions subject to ratable revenue recognition, which resulted in less in-period recognized revenue and more revenue deferred to the balance sheet as compared
to fiscal 2017. Operating income increased $286 million primarily due to higher revenue discussed above, a $51 million decrease in sales and marketing expenses and a $38 million decrease in cost of revenues.
Consumer Cyber Safety segment
| Fiscal Year | Variance in | |||||||||||||
| (In millions, except for percentages) | 2018 | 2017 | Dollars | Percent | ||||||||||
| Net revenues | $ | 2,280 | $ | 1,664 | $ | 616 | 37 | % | ||||||
| Percentage of total net revenues | 47 | % | 41 | % | ||||||||||
| Operating income | $ | 1,111 | $ | 839 | $ | 272 | 32 | % | ||||||
| Operating margin | 49 | % | 50 | % |
Revenue increased $616 million due to a $639 million increase in revenue from sales of our identity and information protection products acquired at the end of fiscal 2017, offset by a $23 million decrease in revenue related to our consumer security products. Our revenue growth reflects the benefit of the shift to subscription-based contracts and bundling of our consumer products, which is helping to mitigate the trend of declining revenues from sales of stand-alone security products. Operating income increased $272 million primarily due to sales of our identity and information protection products, partially offset by higher related cost of sales and operating expenses.
LIQUIDITY, CAPITAL RESOURCES AND CASH REQUIREMENTS
Liquidity
We have historically relied on cash generated from operations, borrowings under credit facilities, issuances of debt, and proceeds from divestitures for our liquidity needs.
As of March 29, 2019, we had cash, cash equivalents and short-term investments of $2.0 billion, of which $0.5 billion was held by our foreign subsidiaries. Our cash, cash equivalents and short-term investments are managed with the objective to preserve principal, maintain liquidity, and generate investment returns. The participation exemption system under current U.S. federal tax regulations generally allows us to make distributions of non-U.S. earnings to the U.S. without incurring additional U.S. federal tax, however these distributions may be subject to applicable state or non-U.S. taxes. We have not recognized deferred income taxes for local country income and withholding taxes that could be incurred on distributions of certain non-U.S. earnings or for outside basis differences in our subsidiaries, because we plan to indefinitely reinvest such earnings and basis differences.
We also have an undrawn credit facility of $1.0 billion which expires in May 2021.
Our principal cash requirements are primarily to meet our working capital needs, support on-going business activities, including the payment of taxes, fund capital expenditures, service existing debt, and invest in business acquisitions. As a part of our plan to deleverage our balance sheet, we may from time to time make optional repayments of our debt obligations, which may include repurchases of our outstanding debt, depending on various factors such as market conditions.
Our capital allocation strategy is to balance driving stockholder returns, managing financial risk, and preserving our flexibility to pursue strategic options, including acquisitions. Historically this has included a quarterly cash dividend, the repayment of debt and the repurchase of our common stock.
Cash flows
The following table summarizes our cash flow activities in fiscal 2019 compared to fiscal 2018.
| Fiscal Year | |||||||
| (In millions) | 2019 | 2018 | |||||
| Net cash provided by (used in): | |||||||
| Operating activities | $ | 1,495 | $ | 957 | |||
| Investing activities | $ | (241 | ) | $ | (21 | ) | |
| Financing activities | $ | (1,209 | ) | $ | (3,475 | ) | |
| Increase (decrease) in cash and cash equivalents | $ | 17 | $ | (2,473 | ) |
Our cash flow activities in fiscal 2018 compared to fiscal 2017 were discussed under Liquidity, Capital Resources and Cash Requirement in Item 7. Management’s Discussion and Analysis of Financial Condition and Results of Operations included in our Annual Report on Form 10-K for the fiscal year ended March 30, 2018.
Cash from operating activities
Our cash flows for fiscal 2019 reflected net income of $31 million adjusted by non-cash items, including amortization and depreciation of $615 million, stock-based compensation of $352 million, and loss from equity interest of $101 million.
Changes in operating assets and liabilities during fiscal 2019 consisted primarily of the following:
Accounts receivable decreased $113 million, reflecting lower billings and higher collections in the last months of fiscal 2019 compared to the corresponding period in fiscal 2018. Days sales outstanding (DSO) decreased to 54 days in the fourth quarter of fiscal 2019, compared to 61 days in the corresponding period in fiscal 2018. DSO is calculated by dividing ending accounts receivable by revenue per day for a given quarter.
Contract liabilities increased $215 million, reflecting higher billings versus recognized revenue.
Our cash flows for fiscal 2018 reflected net income of $1.1 billion adjusted by non-cash amortization and depreciation of $640 million, stock-based compensation of $610 million, offset by a deferred tax benefit of $1.8 billion, primarily as a result of the enactment of the 2017 Tax Act in December 2017, and a gain on divestiture of $653 million.
Changes in operating assets and liabilities during fiscal 2018 consisted primarily of the following:
Accounts receivable increased $170 million, reflecting higher billings in the last months of fiscal 2018 and our shift in sales to solutions with ratable revenue recognition in our Enterprise Security segment.
Contract liabilities increased $541 million, reflecting our shift in sales contracts to a higher mix of solutions subject to ratable versus point in time revenue recognition and longer contract duration in our Enterprise Security segment, which resulted in less in-period revenue recognized, and higher billings towards the end of the fiscal year, reflecting seasonal sales cycles in that segment. These factors were partially offset by a decrease of $319 million in divestiture of our WSS and PKI solutions.
Income taxes payable increased $880 million, reflecting the one-time transition tax of $896 million under the 2017 Tax Act.
Cash from investing activities
Our cash flows from investing activities consisted primarily of capital expenditures of $207 million, payments for acquisitions of $180 million, partially offset by proceeds from maturities and sales of short-term investments of $139 million. Our investing activities in fiscal 2018 primarily included $933 million in net proceeds from divestiture of our WSS and PKI solutions, partially offset by $401 million paid for acquisitions and net purchases of $387 million of short-term investments.
Cash from financing activities
Our financing activities in fiscal 2019 primarily consisted of debt repayments of $600 million, repurchases of common stock of $234 million, payments of dividends and dividend equivalents of $217 million, and tax payments related to the vesting of equity awards of $173 million. Our financing activities in fiscal 2018 primarily consisted of debt repayments of $3.2 billion.
Cash requirements
Debt - As of March 29, 2019, our total outstanding principal amount of indebtedness was $4.5 billion, summarized as follows. See Note 8 to the Consolidated Financial Statements for further information on our debt.
| (In millions) | March 29, 2019 | ||
| Senior Term Loans | $ | 500 | |
| Senior Notes | 2,250 | ||
| Convertible Senior Notes | 1,750 | ||
| Total debt | $ | 4,500 |
Debt covenant compliance - The Senior Term Loan A-5 agreement contains customary representations and warranties, non-financial covenants for financial reporting, affirmative and negative covenants, including a covenant that we maintain a ratio of consolidated funded debt to consolidated adjusted earnings before interest, taxes, depreciation, and amortization of not more than 6.00 to 1.0 through December 31, 2018, then 5.25 to 1.0 thereafter, and restrictions on subsidiary indebtedness, liens, stock repurchases and dividends (with exceptions permitting our regular quarterly dividend). As of March 29, 2019, we were in compliance with all debt covenants.
Dividends - On May 9, 2019, we announced a cash dividend of $0.075 per share of common stock to be paid in June 2019. Any future dividends will be subject to the approval of our Board of Directors.
Stock repurchases - Under our stock repurchase program, we may purchase shares of our outstanding common stock through open market and through accelerated stock repurchase transactions, open market transactions (including through trading plans intended to qualify under Rule 10b5-1 under the Exchange Act), and privately-negotiated transactions. As of March 29, 2019, the remaining balance of our stock repurchase authorization is $1,048 million and does not have an expiration date. The timing and actual number of shares repurchased will depend on a variety of factors, including price, general business and market conditions, and other investment opportunities.
Contractual obligations
The following is a schedule of our significant contractual obligations as of March 29, 2019:
| Payments Due by Period | |||||||||||||||||||
| (In millions) | Total | Less than 1 Year | 1 - 3 Years | 3 - 5 Years | Over 5 Years | ||||||||||||||
| Debt (1) | $ | 4,500 | $ | — | $ | 3,000 | $ | 400 | $ | 1,100 | |||||||||
| Interest payments on debt (2) | 609 | 170 | 239 | 118 | 82 | ||||||||||||||
| Purchase obligations (3) | 1,071 | 525 | 320 | 217 | 9 | ||||||||||||||
| Long-term income taxes payable (4) | 703 | 65 | 134 | 294 | 210 | ||||||||||||||
| Operating leases (5) | 244 | 55 | 89 | 58 | 42 | ||||||||||||||
| Total | $ | 7,127 | $ | 815 | $ | 3,782 | $ | 1,087 | $ | 1,443 |
| (1) | See Note 8 to the Consolidated Financial Statements for further information on our debt. |
| (2) | Interest payments were calculated based on the contractual terms of the related Senior Notes, Convertible Senior Notes, and Senior Term Facility. Interest on variable rate debt was calculated using the interest rate in effect as of March 29, 2019. See Note 8 to the Consolidated Financial Statements for further information on the Senior Notes, Convertible Senior Notes, and Senior Term Facility. |
| (3) | These amounts are associated with agreements for purchases of goods or services generally including agreements that are enforceable and legally binding and that specify all significant terms, including fixed or minimum quantities to be purchased; fixed, minimum, or variable price provisions; and the approximate timing of the transaction. The table above also includes agreements to purchase goods or services that have cancellation provisions requiring little or no payment. The amounts under such contracts are included in the table above because management believes that cancellation of these contracts is unlikely, and we expect to make future cash payments according to the contract terms or in similar amounts for similar materials. |
| (4) | These amounts represent the transition tax on previously untaxed foreign earnings of foreign subsidiaries under the 2017 Tax Act which may be paid through July 2025. See Note 11 to the Consolidated Financial Statements for further information on our income taxes and the impact from the recently enacted legislation. |
| (5) | We have entered into various non-cancelable operating lease agreements that expire on various dates through fiscal 2029. The amounts in the table above exclude expected sublease income. |
Due to the uncertainty with respect to the timing of future cash flows associated with our unrecognized tax benefits and other long-term taxes as of March 29, 2019, we are unable to make reasonably reliable estimates of the period of cash settlement with the respective taxing authorities. Therefore, $373 million in long-term income taxes payable has been excluded from the contractual obligations table. See Note 11 to the Consolidated Financial Statements for further information.
Indemnifications
In the ordinary course of business, we may provide indemnifications of varying scope and terms to customers, vendors, lessors, business partners, subsidiaries, and other parties with respect to certain matters, including, but not limited to, losses arising out of our breach of agreements or representations and warranties made by us. Refer to Note 16 to the Consolidated Financial Statements for further information on our indemnifications.
Item 7A. Quantitative and Qualitative Disclosures about Market Risk
We are exposed to various market risks related to fluctuations in interest rates and foreign currency exchange rates. We may use derivative financial instruments to mitigate certain risks in accordance with our investment and foreign exchange policies. We do not use derivatives or other financial instruments for trading or speculative purposes.
Interest rate risk
Our short-term investments primarily consist of corporate bonds. An increase in interest could have an adverse impact on its market value. As of March 29, 2019, the fair value of our short-term investments was $252 million. A hypothetical increase in the corporate bonds’ yield curve of 50 basis points would not result in a significant reduction in fair value.
As of March 29, 2019, we had $4.0 billion in aggregate principal amount of fixed-rate Senior Notes and Convertible Senior Notes outstanding, with a carrying amount and a fair value of $4.0 billion, based on Level 2 inputs. Since these notes bear interest at fixed rates, they do not result in any financial statement risk associated with changes in interest rates. However, the fair value of these notes fluctuates when interest rates change.
As of March 29, 2019, we also had $500 million outstanding debt with variable interest rates based on the London InterBank Offered Rate (LIBOR). A reasonably possible hypothetical adverse change of 50 basis points in LIBOR would not result in a significant increase in interest expense on an annualized basis.
In addition, we have a $1.0 billion revolving credit facility that if drawn bears interest at a variable rate based on LIBOR and would be subject to the same risks associated with adverse changes in LIBOR.
Foreign currency exchange rate risk
We conduct business in numerous currencies through our worldwide operations, and our entities hold monetary assets or liabilities, earn revenues, or incur costs in currencies other than the entity’s functional currency primarily in Euro, Japanese Yen, and British Pound. In addition, we charge our international subsidiaries for their use of intellectual property and technology and for certain corporate services we provide. Our cash flow, results of operations and certain of our intercompany balances that are exposed to foreign exchange rate fluctuations may differ materially from expectations, and we may record significant gains or losses due to foreign currency fluctuations and related hedging activities. As a result, we are exposed to foreign exchange gains or losses which impacts our operating results.
We have a foreign exchange exposure management program designed to identify material foreign currency exposures, manage these exposures, and reduce the potential effects of currency fluctuations on our reported consolidated cash flows and results of operations through which we enter into foreign exchange forward contracts on our assets and liabilities denominated in currencies other than the functional currency of our subsidiaries with up to twelve months in duration. We do not use derivative financial instruments for speculative trading purposes, nor do we hedge our foreign currency exposure in a manner that entirely offsets the effects of the changes in foreign exchange rates. The gains and losses on these foreign exchange contracts are recorded in interest and other, net in our statement of operations.
As of March 29, 2019, we had open foreign currency forward contracts with notional amounts of $1.1 billion to hedge foreign currency balance sheet exposure, with an insignificant fair value. A hypothetical ten percent depreciation of foreign currency would result in a reduction in fair value of our forward contracts of $84 million for fiscal 2019. This analysis disregards the possibilities that the rates can move in opposite directions and that losses from one geographic area may be offset by gains from another geographic area.
In addition, to help protect the net investment in a foreign operation from adverse changes in foreign currency exchange rates, during fiscal 2019, we initiated a program under which we may enter into foreign currency forward and option contracts to offset the changes in the carrying amounts of these investments due to fluctuations in foreign currency exchange rates. As of March 29, 2019, the notional amount of the related outstanding forward contracts was $116 million, and their fair value was not significant. These contracts reduce, but do not entirely eliminate, the impact of currency exchange rate movements on investments in foreign operations. The foreign currency gains and losses on these contracts are recorded in other comprehensive income.
For additional details related to our derivative instruments, please see “Note 9 - Derivatives” to our Consolidated Financial Statements included in this report.
Item 8. Financial Statements and Supplementary Data
The Consolidated Financial Statements and related disclosures included in Part IV, Item 15 of this annual report are incorporated by reference into this Item 8.
Selected Quarterly Financial Data (Unaudited)
| Fiscal 2019 | Fiscal 2018 | ||||||||||||||||||||||||||||||
| (In millions, except per share data) | Fourth Quarter | Third Quarter | Second Quarter | First Quarter | Fourth Quarter | Third Quarter (1) | Second Quarter | First Quarter | |||||||||||||||||||||||
| Net revenues | $ | 1,189 | $ | 1,211 | $ | 1,175 | $ | 1,156 | $ | 1,210 | $ | 1,209 | $ | 1,240 | $ | 1,175 | |||||||||||||||
| Gross profit | 910 | 945 | 919 | 907 | 946 | 960 | 978 | 918 | |||||||||||||||||||||||
| Operating income (loss) | 107 | 169 | 102 | 2 | 6 | 96 | (9 | ) | (44 | ) | |||||||||||||||||||||
| Income tax expense (benefit) | 22 | 38 | 36 | (4 | ) | (7 | ) | (606 | ) | (53 | ) | (24 | ) | ||||||||||||||||||
| Income (loss) from continuing operations | 30 | 59 | (8 | ) | (65 | ) | (58 | ) | 1,311 | (16 | ) | (110 | ) | ||||||||||||||||||
| Income (loss) from discontinued operations, net of income taxes | 4 | 6 | — | 5 | (1 | ) | 31 | 4 | (23 | ) | |||||||||||||||||||||
| Net income (loss) | 34 | 65 | (8 | ) | (60 | ) | (59 | ) | 1,342 | (12 | ) | (133 | ) | ||||||||||||||||||
| Income (loss) per share - basic: (2) | |||||||||||||||||||||||||||||||
| Continuing operations | $ | 0.05 | $ | 0.09 | $ | (0.01 | ) | $ | (0.10 | ) | $ | (0.09 | ) | $ | 2.12 | $ | (0.03 | ) | $ | (0.18 | ) | ||||||||||
| Discontinued operations | $ | 0.01 | $ | 0.01 | $ | — | $ | 0.01 | $ | (0.00 | ) | $ | 0.05 | $ | 0.01 | $ | (0.04 | ) | |||||||||||||
| Net income (loss) per share - basic | $ | 0.05 | $ | 0.10 | $ | (0.01 | ) | $ | (0.10 | ) | $ | (0.10 | ) | $ | 2.17 | $ | (0.02 | ) | $ | (0.22 | ) | ||||||||||
| Income (loss) per share - diluted: (2) | |||||||||||||||||||||||||||||||
| Continuing operations | $ | 0.05 | $ | 0.09 | $ | (0.01 | ) | $ | (0.10 | ) | $ | (0.09 | ) | $ | 1.97 | $ | (0.03 | ) | $ | (0.18 | ) | ||||||||||
| Discontinued operations | $ | 0.01 | $ | 0.01 | $ | — | $ | 0.01 | $ | (0.00 | ) | $ | 0.05 | $ | 0.01 | $ | (0.04 | ) | |||||||||||||
| Net income (loss) per share - diluted | $ | 0.05 | $ | 0.10 | $ | (0.01 | ) | $ | (0.10 | ) | $ | (0.10 | ) | $ | 2.01 | $ | (0.02 | ) | $ | (0.22 | ) |
| (1) | During the third quarter of fiscal 2018, we recognized a gain on divestiture of our WSS and PKI solutions of $658 million and an income tax benefit of $810 million as a result of the enactment of the 2017 Tax Act. |
| (2) | Net income (loss) per share amounts may not add due to rounding. |
Item 9. Changes in and Disagreements with Accountants on Accounting and Financial Disclosure
None.
Item 9A. Controls and Procedures
a) Evaluation of Disclosure Controls and Procedures
The SEC defines the term “disclosure controls and procedures” to mean a company’s controls and other procedures that are designed to ensure that information required to be disclosed in the reports that it files or submits under the Exchange Act is recorded, processed, summarized, and reported, within the time periods specified in the SEC’s rules and forms. “Disclosure controls and procedures” include, without limitation, controls and procedures designed to ensure that information required to be disclosed by an issuer in the reports that it files or submits under the Exchange Act is accumulated and communicated to the issuer’s management, including its principal executive and principal financial officers, or persons performing similar functions, as appropriate to allow timely decisions regarding required disclosure. Our disclosure controls and procedures are designed to provide reasonable assurance that such information is accumulated and communicated to our management. Our management (with the participation of our Chief Executive Officer and Chief Financial Officer) has conducted an evaluation of the effectiveness of our disclosure controls and procedures (as defined in Rules 13a-15(e) and 15d-15(e) of the Securities Exchange Act). Based on such evaluation, our Chief Executive Officer and our Chief Financial Officer have concluded that our disclosure controls and procedures were effective at the reasonable assurance level as of the end of the period covered by this report.
b) Management’s Report on Internal Control over Financial Reporting
Our management is responsible for establishing and maintaining adequate internal control over financial reporting (as defined in Rules 13a-15(f) and 15d-15(f) of the Exchange Act) for Symantec. Our management, with the participation of our Chief Executive Officer and our Chief Financial Officer, has conducted an evaluation of the effectiveness of our internal control over financial reporting as of March 29, 2019, based on criteria established in Internal Control - Integrated Framework (2013) issued by the Committee of Sponsoring Organizations of the Treadway Commission (COSO).
Our management has concluded that, as of March 29, 2019, our internal control over financial reporting was effective at the reasonable assurance level based on these criteria.
The effectiveness of our internal control over financial reporting as of March 29, 2019 has been audited by KPMG LLP, an independent registered public accounting firm, as stated in their report, which is included in Part IV, Item 15 of this Annual Report on Form 10-K.
c) Changes in Internal Control over Financial Reporting
Effective March 31, 2018, we adopted ASU 2014-09, Revenue from Contracts with Customers (Topic 606). Changes were made to the relevant business processes and the related control activities, including information systems, in order to monitor and maintain appropriate controls over financial reporting. There were no changes in our internal control over financial reporting that occurred during the quarter ended March 29, 2019, that have materially affected, or are reasonably likely to materially affect, our internal control over financial reporting.
d) Limitations on Effectiveness of Controls
Our management, including our Chief Executive Officer and Chief Financial Officer, does not expect that our disclosure controls and procedures or our internal controls will prevent all errors and all fraud. A control system, no matter how well conceived and operated, can provide only reasonable, not absolute, assurance that the objectives of the control system are met. Further, the design of a control system must reflect the fact that there are resource constraints, and the benefits of controls must be considered relative to their costs. Because of the inherent limitations in all control systems, no evaluation of controls can provide absolute assurance that all control issues and instances of fraud, if any, within our company have been detected.
Item 9B. Other Information
Our Board of Directors has scheduled our 2019 Annual Meeting of Stockholders, or the 2019 Annual Meeting, to be held on September 10, 2019. The record date, time and location of the 2019 Annual Meeting will be as set forth in our proxy statement for the 2019 Annual Meeting.
The 2019 Annual Meeting is being held more than 30 days before the anniversary of our most recent Annual Meeting of Stockholders, which was held on December 3, 2018. As a result, we have set a new deadline for the receipt of any stockholder proposals submitted pursuant to Rule 14a-8 under the Exchange Act for inclusion in our proxy materials for the 2019 Annual Meeting. The new deadline for the submission of such stockholder proposals is the close of business on June 3, 2019.
In addition, in accordance with our Bylaws, because the scheduled date of the 2019 Annual Meeting is more than 30 calendar days before the one-year anniversary of the previous year’s Annual Meeting of Stockholders, if a stockholder desires to make a proposal from the floor during the 2019 Annual Meeting, or if an eligible stockholder or group of stockholders wants to submit nominees for inclusion in our proxy materials for the 2019 Annual Meeting pursuant to the proxy access provisions of our Bylaws, our Bylaws provide that the stockholder or group of stockholders must provide timely written notice to our Corporate Secretary no later than the close of business on June 3, 2019.
PART III
Item 10. Directors, Executive Officers and Corporate Governance
The information required by this item will be included under the caption “Directors, Executive Officers, and Corporate Governance” in our proxy statement for the 2019 Annual Meeting to be filed with the SEC within 120 days of the fiscal year ended March 29, 2019 (the 2019 Proxy Statement) and is incorporated herein by reference.
Item 11. Executive Compensation
The information required by this item will be included under the caption “Executive Compensation” in our 2019 Proxy Statement and is incorporated herein by reference.
Item 12. Security Ownership of Certain Beneficial Owners and Management and Related Stockholder Matters
The information required by this item will be included under the caption “Security Ownership of Certain Beneficial Owners and Management and Related Stockholder Matters” in our 2019 Proxy Statement and is incorporated herein by reference.
Item 13. Certain Relationships and Related Transactions, and Director Independence
The information required by this item will be included under the caption “Certain Relationships and Related Transactions, and Director Independence” in our 2019 Proxy Statement and is incorporated herein by reference.
Item 14. Principal Accounting Fees and Services
The information required by this item will be included under the caption “Principal Accountant Fees and Services” in our 2019 Proxy Statement and is incorporated herein by reference.
PART IV
Item 15. Exhibits, Financial Statement Schedules
(a)
- Financial Statements
Upon written request, we will provide, without charge, a copy of this annual report, including the Consolidated Financial Statements and financial statement schedule. All requests should be sent to:
Symantec Corporation
Attn: Investor Relations
350 Ellis Street
Mountain View, California 94043
(650) 527-8000
The following documents are filed as part of this report:
Report of Independent Registered Public Accounting Firm
The Board of Directors and Stockholders
Symantec Corporation:
Opinions on the Consolidated Financial Statements and Internal Control Over Financial Reporting
We have audited the accompanying consolidated balance sheets of Symantec Corporation and subsidiaries (the Company) as of March 29, 2019 and March 30, 2018, the related consolidated statements of operations, comprehensive income (loss), stockholders’ equity, and cash flows for each of the years in the three-year period ended March 29, 2019 and the related notes (collectively, the consolidated financial statements). We also have audited the Company’s internal control over financial reporting as of March 29, 2019, based on criteria established in Internal Control - Integrated Framework (2013) issued by the Committee of Sponsoring Organizations of the Treadway Commission.
In our opinion, the consolidated financial statements referred to above present fairly, in all material respects, the financial position of the Company as of March 29, 2019 and March 30, 2018, and the results of their operations and their cash flows for each of the years in the three-year period ended March 29, 2019, in conformity with U.S. generally accepted accounting principles. Also, in our opinion, the Company maintained, in all material respects, effective internal control over financial reporting as of March 29, 2019, based on criteria established in Internal Control - Integrated Framework (2013) issued by the Committee of Sponsoring Organizations of the Treadway Commission.
Change in Accounting Principle
As discussed in Note 2 to the consolidated financial statements, the Company has changed its method of accounting for revenue from contracts with customers in fiscal year 2019 due to the adoption of Accounting Standards Update 2014-09 “Revenue from Contracts with Customers (Topic 606)”.
Basis for Opinions
The Company’s management is responsible for these consolidated financial statements, for maintaining effective internal control over financial reporting, and for its assessment of the effectiveness of internal control over financial reporting, included in the accompanying Management’s Report on Internal Control over Financial Reporting under Item 9A. Our responsibility is to express an opinion on the Company’s consolidated financial statements and an opinion on the Company’s internal control over financial reporting based on our audits. We are a public accounting firm registered with the Public Company Accounting Oversight Board (United States) (PCAOB) and are required to be independent with respect to the Company in accordance with the U.S. federal securities laws and the applicable rules and regulations of the Securities and Exchange Commission and the PCAOB.
We conducted our audits in accordance with the standards of the PCAOB. Those standards require that we plan and perform the audits to obtain reasonable assurance about whether the consolidated financial statements are free of material misstatement, whether due to error or fraud, and whether effective internal control over financial reporting was maintained in all material respects.
Our audits of the consolidated financial statements included performing procedures to assess the risks of material misstatement of the consolidated financial statements, whether due to error or fraud, and performing procedures that respond to those risks. Such procedures included examining, on a test basis, evidence regarding the amounts and disclosures in the consolidated financial statements. Our audits also included evaluating the accounting principles used and significant estimates made by management, as well as evaluating the overall presentation of the consolidated financial statements. Our audit of internal control over financial reporting included obtaining an understanding of internal control over financial reporting, assessing the risk that a material weakness exists, and testing and evaluating the design and operating effectiveness of internal control based on the assessed risk. Our audits also included performing such other procedures as we considered necessary in
Showing the first 8K of 189K characters. Open the full section
Item 16. Form 10-K Summary
None.
SIGNATURES
Pursuant to the requirements of Section 13 or 15(d) of the Securities Exchange Act of 1934, the Registrant has duly caused this report to be signed on its behalf by the undersigned, thereunto duly authorized, in the City of Mountain View, State of California, on the 24th day of May 2019.
| SYMANTEC CORPORATION | ||
| By: | /s/ Richard S. Hill | |
| Richard S. Hill Interim President and Chief Executive Officer and Director |
KNOW ALL PERSONS BY THESE PRESENTS, that each person whose signature appears below constitutes and appoints Richard S. Hill, Vincent Pilette, Nicholas R. Noviello, and Scott C. Taylor, and each or any of them, his or her attorneys-in-fact, each with the power of substitution, for him or her in any and all capacities to sign any and all amendments to this report on Form 10-K and any other documents in connection therewith, with the Securities and Exchange Commission, granting unto said attorneys-in-fact, and each of them, full power and authority to do and perform each and every act and thing requisite and necessary to be done in and about the premises, as fully to all intents and purposes as he or she might or could do in person, hereby ratifying and confirming all that such attorneys-in-fact, or his or their substitute or substitutes, may lawfully do or cause to be done by virtue hereof. This Power of Attorney may be signed in several counterparts.
Pursuant to the requirements of the Securities Exchange Act of 1934, this report has been signed below by the following persons on behalf of the Registrant and in the capacities and on the dates indicated below.
| Signature | Title | Date | ||
| /s/ Richard S. Hill | Interim President and Chief Executive Officer and Director (Principal Executive Officer) | May 24, 2019 | ||
| Richard S. Hill | ||||
| /s/ Nicholas R. Noviello | Executive Vice President and Chief Financial Officer (Principal Financial Officer) | May 24, 2019 | ||
| Nicholas R. Noviello | ||||
| /s/ Matthew Brown | Vice President, Finance and Chief Accounting Officer (Principal Accounting Officer) | May 24, 2019 | ||
| Matthew Brown | ||||
| /s/ Daniel H. Schulman | Chairman of the Board | May 24, 2019 | ||
| Daniel H. Schulman | ||||
| /s/ Sue Barsamian | Director | May 24, 2019 | ||
| Sue Barsamian | ||||
| /s/ Frank E. Dangeard | Director | May 24, 2019 | ||
| Frank E. Dangeard | ||||
| /s/ Peter A. Feld | Director | May 24, 2019 | ||
| Peter A. Feld | ||||
| /s/ Dale L. Fuller | Director | May 24, 2019 | ||
| Dale L. Fuller | ||||
| /s/ Kenneth Y. Hao | Director | May 24, 2019 | ||
| Kenneth Y. Hao | ||||
| /s/ David W. Humphrey | Director | May 24, 2019 | ||
| David W. Humphrey | ||||
| /s/ David L. Mahoney | Director | May 24, 2019 | ||
| David L. Mahoney | ||||
| /s/ Anita M. Sands | Director | May 24, 2019 | ||
| Anita M. Sands | ||||
| /s/ V. Paul Unruh | Director | May 24, 2019 | ||
| V. Paul Unruh | ||||
| /s/ Suzanne M. Vautrinot | Director | May 24, 2019 | ||
| Suzanne M. Vautrinot |