 filings.tools
Globe Life 10-K 2018-12-31
Filed 2019-03-01. 21 sections, 497K characters. Original on sec.gov · Markdown · JSON
Cover and table of contents
10-K 1 tmk201810-kdocumentxq42018.htm FY 2018 10-K
UNITED STATES
SECURITIES AND EXCHANGE COMMISSION
Washington, D.C. 20549
FORM 10-K
[X] ANNUAL REPORT PURSUANT TO SECTION 13 OR 15(d) OF THE SECURITIES EXCHANGE ACT OF 1934
For the fiscal year ended December 31, 2018
or
[ ] TRANSITION REPORT PURSUANT TO SECTION 13 OR 15(d) OF THE SECURITIES EXCHANGE ACT OF 1934
For the transition period from to
Commission file number: 001-08052
TORCHMARK CORPORATION
(Exact name of registrant as specified in its charter)
| Delaware | 63-0780404 | |
| (State or other jurisdiction of incorporation or organization) | (I.R.S. Employer Identification No.) | |
| 3700 South Stonebridge Drive, McKinney, TX | 75070 | |
| (Address of principal executive offices) | (Zip Code) |
972-569-4000
(Registrant’s telephone number, including area code)
Securities registered pursuant to Section 12(b) of the Act:
| Title of each class | CUSIP | Name of each exchange on which registered | ||
| Common Stock, $1.00 par value per share | 891027104 | New York Stock Exchange |
Securities registered pursuant to Section 12(g) of the Act: None
Indicate by check mark if the registrant is a well-known seasoned issuer, as defined in Rule 405 of the Securities Act.
Yes x No ¨
Indicate by check mark if the registrant is not required to file reports pursuant to Section 13 or Section 15(d) of the Act.
Yes ¨ No x
Indicate by check mark whether the registrant (1) has filed all reports required to be filed by Section 13 or 15(d) of the Securities Exchange Act of 1934 during the preceding 12 months (or for such shorter period that the registrant was required to file such reports), and (2) has been subject to such filing requirements for the past 90 days.
Yes x No ¨
Indicate by check mark whether the registrant has submitted electronically every Interactive Data File required to be submitted pursuant to Rule 405 of Regulation S-T (§ 232.405 of this chapter) during the preceding 12 months (or for such shorter period that the registrant was required to submit such files).
Yes x No ¨
Indicate by check mark if disclosure of delinquent filers pursuant to Item 405 of Regulation S-K (§ 229.405 of this chapter) is not contained herein, and will not be contained, to the best of registrant’s knowledge, in definitive proxy or information statements incorporated by reference in Part III of this Form 10-K or any amendment to this Form 10-K.
¨
Indicate by check mark whether the registrant is a large accelerated filer, an accelerated filer, a non-accelerated filer, or a smaller reporting company. See the definitions of “large accelerated filer,” “accelerated filer,” “smaller reporting company”, and "emerging growth company" in Rule 12b-2 of the Exchange Act.:
| Large accelerated filer | ý | Accelerated filer | ¨ | |||
| Non-accelerated filer | ¨ | Smaller reporting company | ¨ | |||
| Emerging growth company | ¨ | |||||
| If an emerging growth company, indicate by check mark if the registrant has elected not to use the extended transition period for complying with any new or revised financial accounting standards provided pursuant to Section 13(a) of the Exchange Act. | ¨ |
Indicate by check mark whether the registrant is a shell company (as defined in Rule 12b-2 of the Exchange Act).
Yes ¨ No x
As of June 30, 2018, the aggregate market value of the registrant’s common stock held by non-affiliates of the registrant was $9.0 billion based on the closing sale price as reported on the New York Stock Exchange.
Indicate the number of shares outstanding of each of the issuer’s classes of common stock, as of the latest practicable date.
| Class | Outstanding at February 19, 2019 | |
| Common Stock, $1.00 par value per share | 110,236,297 shares |
DOCUMENTS INCORPORATED BY REFERENCE
| Document | Parts Into Which Incorporated | |
| Proxy Statement for the Annual Meeting of Stockholders to be held April 25, 2019 (Proxy Statement) | Part III |
TORCHMARK CORPORATION
Table of Contents
| Item 14. | Principal Accountant Fees and Services | 119 | |
| PART IV. | |||
| Item 15. | Exhibits and Financial Statement Schedules | 119 |
PART I
Item 1. BUSINESS
Torchmark Corporation ("Torchmark", "we", "our", and "us") is an insurance holding company incorporated in Delaware in 1979. Its primary subsidiaries are Globe Life And Accident Insurance Company (Globe Life), American Income Life Insurance Company (American Income), Liberty National Life Insurance Company (Liberty National), Family Heritage Life Insurance Company of America (Family Heritage), and United American Insurance Company (United American).
Torchmark’s website is: www.torchmarkcorp.com. Torchmark makes available free of charge through its website, its annual report on Form 10-K, its quarterly reports on Form 10-Q, current reports on Form 8-K, and amendments to those reports as soon as reasonably practicable after they have been electronically filed with or furnished to the Securities and Exchange Commission. Other information included in Torchmark's website is not incorporated into this filing.
The following table presents Torchmark’s business by primary marketing distribution method.
| Primary Distribution Method | Company | Products and Target Markets | Distribution | ||||
 | Globe Life Direct Response | Globe Life And Accident Insurance Company McKinney, Texas | Individual life and supplemental health insurance including juvenile and senior life coverage and Medicare Supplement to lower middle to middle-income Americans. | Nationwide distribution through direct-to-consumer channels; including direct mail, electronic media and insert media. | |||
 | American Income Exclusive Agency | American Income Life Insurance Company Waco, Texas | Individual life and supplemental health insurance marketed to working families. | 6,894 producing agents in the U.S., Canada, and New Zealand. | |||
 | Liberty National Exclusive Agency | Liberty National Life Insurance Company McKinney, Texas | Individual life and supplemental health insurance marketed to lower middle to middle-income families. | 2,159 producing agents in the U.S. | |||
 | Family Heritage Exclusive Agency | Family Heritage Life Insurance Company of America Cleveland, Ohio | Supplemental limited-benefit health insurance to lower middle to middle-income families. | 1,097 producing agents in the U.S. | |||
 | United American Independent Agency | United American Insurance Company McKinney, Texas | Medicare Supplement coverage to Medicare beneficiaries and, to a lesser extent, supplemental limited-benefit health coverage to people under age 65. | 4,415 independent producing agents in the U.S. |
Additional information concerning industry segments may be found in Management’s Discussion and Analysis and in Note 14—Business Segments in the Notes to the Consolidated Financial Statements.
TMK 2018 FORM 10-K
Insurance
Life Insurance
Torchmark’s insurance subsidiaries write a variety of nonparticipating ordinary life insurance products. These include traditional and interest sensitive whole-life insurance, term life insurance, and other life insurance. The following tables present selected information about Torchmark’s life products.
| Annualized Premium in Force (Dollar amounts in thousands) | |||||||||||||||||
| 2018 | 2017 | 2016 | |||||||||||||||
| Amount | % of Total | Amount | % of Total | Amount | % of Total | ||||||||||||
| Whole life: | |||||||||||||||||
| Traditional | $ | 1,643,122 | 67 | $ | 1,567,077 | 66 | $ | 1,471,054 | 65 | ||||||||
| Interest-sensitive | 41,414 | 2 | 44,286 | 2 | 47,358 | 2 | |||||||||||
| Term | 671,840 | 27 | 664,558 | 28 | 657,797 | 29 | |||||||||||
| Other | 108,352 | 4 | 97,178 | 4 | 86,527 | 4 | |||||||||||
| $ | 2,464,728 | 100 | $ | 2,373,099 | 100 | $ | 2,262,736 | 100 |
| Policy Count and Average Face Amount Per Policy (Dollar amounts in thousands) | ||||||||||||||||||||
| 2018 | 2017 | 2016 | ||||||||||||||||||
| Policy Count | Average Face Amount per Policy | Policy Count | Average Face Amount per Policy | Policy Count | Average Face Amount per Policy | |||||||||||||||
| Whole life: | ||||||||||||||||||||
| Traditional | 8,112,745 | $ | 13.9 | 8,045,522 | $ | 13.6 | 7,953,837 | $ | 13.2 | |||||||||||
| Interest-sensitive | 209,948 | 20.6 | 219,487 | 20.5 | 229,459 | 20.5 | ||||||||||||||
| Term | 4,459,850 | 14.9 | 4,351,901 | 15.0 | 4,232,417 | 15.2 | ||||||||||||||
| Other | 376,632 | 12.9 | 355,053 | 12.3 | 329,797 | 11.9 | ||||||||||||||
| 13,159,175 | $ | 14.3 | 12,971,963 | $ | 14.1 | 12,745,510 | $ | 13.9 |
The distribution methods for life insurance products include direct response, exclusive agents, and independent agents. These methods are described in more depth in the primary marketing distribution method chart earlier in this report. The following table presents life annualized premium in force by distribution method.
| Annualized Premium in Force (Dollar amounts in thousands) | |||||||||||
| 2018 | 2017 | 2016 | |||||||||
| Globe Life Direct Response | $ | 812,780 | $ | 796,628 | $ | 782,222 | |||||
| Exclusive agents: | |||||||||||
| American Income | 1,129,384 | 1,059,216 | 966,990 | ||||||||
| Liberty National | 300,846 | 295,235 | 288,005 | ||||||||
| Independent agents: | |||||||||||
| United American | 11,094 | 12,121 | 13,292 | ||||||||
| Other | 210,624 | 209,899 | 212,227 | ||||||||
| $ | 2,464,728 | $ | 2,373,099 | $ | 2,262,736 |
TMK 2018 FORM 10-K
Health Insurance
Torchmark offers Medicare Supplement and limited-benefit supplemental health insurance products that include primarily critical illness and accident plans. These policies are designed to supplement health coverage that applicants already own. Medicare Supplements are offered to enrollees in the traditional fee-for-service Medicare program. Medicare Supplement plans are standardized by federal regulation and are designed to pay deductibles and co-payments not paid by Medicare.
The following table presents supplemental health annualized premium in force information for the three years ended December 31, 2018 by product category.
| Annualized Premium in Force (Dollar amounts in thousands) | |||||||||||||||||
| 2018 | 2017 | 2016 | |||||||||||||||
| Amount | % of Total | Amount | % of Total | Amount | % of Total | ||||||||||||
| Medicare Supplement | $ | 524,415 | 49 | $ | 495,982 | 49 | $ | 502,691 | 51 | ||||||||
| Limited-benefit plans | 549,283 | 51 | 522,038 | 51 | 495,943 | 49 | |||||||||||
| $ | 1,073,698 | 100 | $ | 1,018,020 | 100 | $ | 998,634 | 100 |
The following table presents supplemental health annualized premium in force for the three years ended December 31, 2018 by distribution method.
| Annualized Premium in Force (Dollar amounts in thousands) | |||||||||||
| 2018 | 2017 | 2016 | |||||||||
| Direct Response | $ | 79,325 | $ | 76,672 | $ | 74,261 | |||||
| Exclusive agents: | |||||||||||
| Liberty National | 201,294 | 205,136 | 210,260 | ||||||||
| American Income | 88,237 | 84,775 | 78,947 | ||||||||
| Family Heritage | 290,186 | 268,584 | 249,857 | ||||||||
| Independent agents: | |||||||||||
| United American | 414,656 | 382,853 | 385,309 | ||||||||
| $ | 1,073,698 | $ | 1,018,020 | $ | 998,634 |
Annuities
Annuity products include single-premium and flexible-premium deferred annuities. Annuities in each of the three years ended December 31, 2018 comprised less than 1% of premium.
Pricing
Premium rates for life and health insurance products are established using assumptions as to future mortality, morbidity, persistency, investment income, expenses, and target profit margins. These assumptions are based on Company experience and projected investment earnings. Revenues for individual life and health insurance products are primarily derived from premium income, and, to a lesser extent, through policy charges to the policyholder account values on annuity products and certain individual life products. Profitability is affected by actual experience deviations from the pricing assumptions and to the extent investment income varies from that required for policy reserves.
Collections for annuity products and certain life products are not recognized as revenues, but are added to policyholder account values. Revenues from these products are derived from charges to the account balances for insurance risk and administrative costs. Profits are earned to the extent these revenues exceed actual costs. Profits are also earned from investment income in excess of the amounts required for policy reserves.
TMK 2018 FORM 10-K
Underwriting
The underwriting standards of each Torchmark insurance subsidiary are established by management. Each subsidiary uses information obtained from the application and, in some cases, telephone interviews with applicants, including, but not limited to inspection reports, pharmacy data, doctors’ statements and/or medical examinations to determine whether a policy should be issued in accordance with the application, with a different rating, with a rider, with reduced coverage, or rejected.
Reserves
The life insurance policy reserves reflected in Torchmark’s consolidated financial statements as future policy benefits are calculated based on accounting principles generally accepted in the United States of America (GAAP). These reserves, with premiums to be received in the future and the interest thereon compounded annually at assumed rates, must be sufficient to cover policy and contract obligations as they mature. Generally, the mortality and persistency assumptions used in the calculations of reserves are based on Company experience. Similar reserves are held on most of the health policies written by Torchmark’s insurance subsidiaries, since these policies generally are issued on a guaranteed-renewable basis. The assumptions used in the calculation of Torchmark’s reserves are reported in Note 1—Significant Accounting Policies. Reserves for annuity products and certain life products consist of the policyholders’ account values and are increased by policyholder deposits and interest credited and are decreased by policy charges and benefit payments.
Investments
The nature, quality, and percentage mix of insurance company investments are regulated by state laws. The investments of Torchmark insurance subsidiaries consist predominantly of high-quality, investment-grade securities. Approximately 95% of our invested assets at fair value are fixed maturities at December 31, 2018. (See Note 4—Investments and Management’s Discussion and Analysis.)
Competition
Torchmark competes with other insurance carriers through policyholder service, price, product design, and sales efforts. While there are insurance companies competing with Torchmark, no individual company dominates any of Torchmark’s life or health markets.
Torchmark’s health insurance products compete with, in addition to the products of other health insurance carriers, health maintenance organizations, preferred provider organizations, and other health care-related institutions which provide medical benefits based on contractual agreements.
Management believes Torchmark companies operate at lower policy acquisition and administrative expense levels than peer companies. This allows Torchmark to have competitive rates while maintaining higher underwriting margins.
Regulation
Insurance. Insurance companies are subject to regulation and supervision in the states in which they do business. The laws of the various states establish agencies with broad administrative and supervisory powers which include, among other things, granting and revoking licenses to transact business, regulating trade practices, licensing agents, approving policy forms, approving certain premium rates, setting minimum reserve and loss ratio requirements, determining the form and content of required financial statements, and prescribing the type and amount of investments permitted. They are also required to file detailed annual reports with supervisory agencies, and records of their business are subject to examination at any time. Under the rules of the National Association of Insurance Commissioners (NAIC), insurance companies are examined periodically by one or more of the supervisory agencies.
Risk-Based Capital (RBC). The NAIC requires that a risk-based capital formula be applied to all life and health insurers. The risk-based capital formula is a threshold formula rather than a target capital formula. It is designed only to identify companies that require regulatory attention and is not to be used to rate or rank companies that are adequately capitalized. All Torchmark insurance subsidiaries are more than adequately capitalized under the risk-based capital formula.
TMK 2018 FORM 10-K
Guaranty Assessments. State guaranty laws provide for assessments from insurance companies to be placed into a fund which is used, in the event of failure or insolvency of an insurance company, to fulfill the obligations of that company to its policyholders. The amount which a company is assessed is based on its proportional share of the premium in each state. A significant portion of assessments are recoverable as offsets against state premium taxes. (See Note 6—Commitments and Contingencies for current assessment.)
Holding Company. States have enacted legislation requiring registration and periodic reporting by insurance companies domiciled within their respective jurisdictions that control or are controlled by other corporations so as to constitute a holding company system. Torchmark and its subsidiaries have registered as a holding company system pursuant to such legislation in Indiana, Nebraska, Ohio, and New York.
Insurance holding company system statutes and regulations impose various limitations on investments in subsidiaries, and may require prior regulatory approval for material transactions between insurers and affiliates and for the payment of certain dividends and other distributions.
Personnel
At the end of 2018, Torchmark had 3,102 employees, consistent with the prior year.
TMK 2018 FORM 10-K
Item 1A. RISK FACTORS
Risks Related to Our Business
The insurance industry is a regulated industry, populated by many public and private companies. We operate in the industry's life and health insurance sectors, each of which has its own set of risks.
Operational Risks:
The development and maintenance of our various distribution systems are critical to growth in product sales and profits. Development and retention of producing agents are critical to support sales growth in this market because our insurance sales are primarily made to individuals, and the face amounts of the life insurance policies sold are typically lower than those of policies sold in higher-income markets. Compensation that is competitive with other career opportunities and motivates producing agents to increase sales is also critical. Globe Life Direct Response is continuously developing new methods of reaching consumers and realizing cost efficiencies. Less than optimum execution of these strategies may result in reduced sales and profits.
Economic conditions may materially adversely affect our business and results of operations. We primarily serve the lower-middle to middle-income market for individual life and health insurance and, as a result, we compete directly with alternative uses of a customer’s disposable income. If disposable income within this demographic group declines or the use of disposable income becomes more limited as a result of a significant, sustained economic downturn or otherwise, then new sales of our insurance products could become more challenging, and our policyholders may choose to defer or stop payment of insurance premiums altogether. Economic conditions could also impact our investment portfolio as discussed under Investment Risks below.
Variations in expected-to-actual rates of mortality, morbidity and persistency could materially negatively affect our results of operations and financial condition. We establish policy reserves to pay future policyholder benefits. These reserves do not represent an exact calculation of liability, but rather are actuarial estimates based on models that include many assumptions and projections which are inherently uncertain. The reserve computations involve the exercise of significant judgment with respect to levels of mortality, morbidity and persistency, as well as the timing of premium and benefit payments. Even though our actuaries continually test expected-to-actual results, actual levels that occur may differ significantly from the levels assumed when premium rates were first set. Accordingly, we cannot determine with precision the ultimate amounts of policyholder benefits that we will pay or the timing of such payments. Significant adverse variations from the levels assumed when policy reserves are first set could result in increased policy obligations and negatively affect our profit margins and income.
A ratings downgrade or other negative action by a rating agency could materially affect our business, financial condition and results of operations. Various rating agencies review the financial performance and condition of insurers, including our insurance subsidiaries, and publish their financial strength ratings as indicators of an insurer’s ability to fulfill its contractual obligations. These ratings are important to maintaining public confidence in our insurance products. A downgrade or other negative action by a rating agency with respect to the financial strength ratings of our insurance subsidiaries could negatively affect us in many ways, including: limiting or restricting the ability of our insurance subsidiaries to pay dividends to us and adversely affecting our ability to sell insurance products through independent insurance agencies.
Rating agencies also publish credit ratings for us. Credit ratings are indicators of a debt issuer’s ability to meet the terms of debt obligations in a timely manner. These ratings are important to our overall ability to access certain types of capital. Actual or anticipated downgrades in our credit ratings, or an announcement that our ratings are under further review for a downgrade, could potentially have a negative effect on our financial condition and results of operations. Such an event could limit our access to capital markets, increase the cost of debt, or impair our ability to raise capital to refinance maturing debt obligations, thereby potentially limiting our capacity to support growth at our insurance subsidiaries or making it more difficult to maintain or improve the current financial strength ratings of our insurance subsidiaries.
Ratings reflect only a rating agency’s views and are not recommendations to buy, sell or hold our securities. Rating agencies assign ratings based upon several factors. While most of the factors relate to the rated company, some of the factors relate to the views of the rating agency, general economic conditions and circumstances outside the rated
TMK 2018 FORM 10-K
company’s control. In addition, rating agencies use various models and formulas to assess the strength of a rated company, and from time to time rating agencies have, in their discretion, altered the models. Changes to the models could impact a rating agency's judgment of the rating to be assigned to the rated company. There can be no assurance that our current credit ratings will remain in effect for any given period of time or that such ratings will not be lowered, suspended or withdrawn entirely by the rating agencies. We cannot predict what actions the rating agencies may take, or what actions we may take in response to the actions of the rating agencies which could negatively affect our business, financial condition and results of operations.
Life Insurance Marketplace Risk:
Our life insurance products are sold in selected niche markets. We are at risk should any of these markets diminish. We have several life distribution channels that focus on distinct market niches, two of which are labor unions and sales via Globe Life Direct Response solicitation. Deterioration of our relationships with organized labor or adverse changes in the public’s receptivity to direct response marketing initiatives could negatively affect our life insurance business.
Health Insurance Marketplace Risks:
The health insurance market is subject to substantial regulatory scrutiny. Regulatory changes could impact our Medicare Supplement and other supplemental health business. The nature and timing of any such changes cannot be predicted and could have a material adverse effect on our health insurance business.
Competition in the health insurance market can be significant. Sales of our health insurance products are subject to competition from other health insurance companies and alternative healthcare providers, such as those that provide alternatives to traditional Medicare to seniors. In addition, some insurers may be willing to significantly reduce their profit margins or underprice new sales in order to gain market share. We choose not to compete for market share based on these terms. Accordingly, changes in the competitive landscape, including the pricing strategies employed by our competitors, could negatively impact the future sales of our health insurance products.
Obtaining timely and appropriate premium rate increases for certain health insurance policies is critical. A significant percentage of the health insurance premiums that our insurance subsidiaries earn is from Medicare Supplement insurance. Medicare Supplement insurance, including conditions under which the premiums for such policies may be increased, is highly regulated at both the state and federal level. As a result, our Medicare Supplement business is characterized by lower profit margins than life insurance and requires strict administrative discipline and economies of scale for success. Since Medicare Supplement policies are coordinated with the federal Medicare program, which experiences health care inflation every year, annual premium rate increases for the Medicare Supplement policies are typically necessary. Obtaining timely rate increases is of critical importance to our success in this market. Accordingly, the inability of our insurance subsidiaries to obtain approval of premium rate increases in a timely manner from state insurance regulatory authorities could adversely impact their profitability and thus our business, financial condition and results of operations.
Information Security and Technology Risks:
The failure to maintain effective and efficient information systems at the Company could compromise data security, thereby adversely affecting our financial condition and results of operations. Our business is highly dependent upon information systems to operate in an efficient and resilient manner. We gather and maintain data on our information systems, including the identity, health and financial information of our current, former and prospective policyholders, for the purpose of conducting marketing, sales and policy administration functions. This information is highly targeted by malicious threat actors.
Malicious threat actors, employee or agent errors or disasters affecting our information systems could impair our business operations, regulatory compliance and financial condition. An attacker could circumvent security measures in order to access, alter or delete data from our systems or to render our systems unavailable for business use. Additionally, we may not become aware of sophisticated cyber-attacks for some time after they occur, thereby increasing the Company's exposure. We may have to incur significant costs to address existing and future regulatory requirements related thereto. These risks are heightened as the frequency and sophistication of cyber-attacks increase.
TMK 2018 FORM 10-K
Employee or agent errors in the handling of our information systems may inadvertently result in unauthorized access to customer or proprietary information, or an inability to use our information systems to efficiently support business operations.
We may utilize the services of third parties in order to conduct our business. Cyber events affecting these third parties could materially impact our sales and operational efficiency.
We anticipate more frequent and sophisticated cyber-attacks along with more impactful regulatory oversight models. An increasing number of states also require that customers be notified of unauthorized access, use or disclosure of their confidential information. Any such breach of confidential information could damage our reputation in the marketplace, deter potential customers from purchasing our products, result in the loss of existing customers, subject us to significant civil and criminal liability, or require us to incur significant technical, legal or other expenses.
In the event of a disaster, such as a natural catastrophe, an industrial accident, a blackout, or a terrorist attack or war, our computer systems may be inaccessible to our employees, agents or customers for a period of time. A disaster or natural catastrophe, an industrial accident, terrorist attack or war may make our information systems unavailable to support business operations for a period of time, which could adversely affect our financial condition and results of operations. Even if our employees are able to report to work, they may be unable to perform their duties for an extended period of time if our data or systems are disabled or destroyed and existing contingency plans cannot function as designed.
Reputational Risk:
Damage to the reputation of Torchmark or its subsidiaries could affect our ability to conduct business. Negative publicity through traditional media, internet, social media and other public forums could damage our reputation and adversely impact our agent recruiting efforts, the ability to market our products and the persistency of our block of inforce policies. As discussed above in Information Security and Technology Risks, the Company could be subjected to adverse publicity as a result of a significant security breach.
Investment Risks:
Our investments are subject to market and credit risks. Significant downgrades, delinquencies and defaults in our investment portfolio could potentially result in lower net investment income and increased realized and unrealized investment losses. Our invested assets are subject to the customary risks of defaults, downgrades and changes in market values. Our investment portfolio consists predominately of fixed maturity and short-term investments, where we are exposed to the risk that individual issuers will not have the ability to make required interest or principal payments. The concentration of these investments in any particular issuer, industry, group of related industries or geographic areas increases this risk. Factors that may affect both market and credit risks include interest rate levels (consisting of both treasury rate and credit spread), financial market performance, disruptions in credit markets, general economic conditions, legislative changes, particular circumstances affecting the businesses or industries of each issuer and other factors beyond our control.
Additionally, as the majority of our investments are longer-term fixed maturities that we typically hold until maturity, significant increases in interest rates or inactive markets associated with market downturns could cause a material temporary decline in the fair value of our fixed investment portfolio, even with regard to performing assets. These declines could cause a material increase in unrealized losses in our investment portfolio. Significant unrealized losses could substantially reduce our capital position and shareholders’ equity. It is possible that our investment in certain of these securities with unrealized losses could experience a default event and that a portion or all of that unrealized loss could be unrecoverable. In that case, the unrealized loss would be realized, at which point we would take an impairment charge, reducing our net income.
We cannot be assured that any particular issuer, regardless of industry, will be able to make required interest and principal payments on a timely basis or at all. Significant downgrades or defaults of issuers could negatively impact our risk-based capital ratios, leading to potential downgrades of the Company by rating agencies, potential reduction in future dividend capacity from our insurance subsidiaries, and/or higher financing costs at the holding company should additional statutory capital be required.
TMK 2018 FORM 10-K
Changes in interest rates could negatively affect income. Declines in interest rates expose insurance companies to the risk that they will fail to earn the level of interest on investments assumed in pricing products and in setting discount rates used to calculate net policy liabilities. We attempt to manage our investments to earn the level of interest on investments assumed in pricing products and in setting the discount rates used to calculate net policy liabilities. There is a risk that a significant and persistent decline in interest rates will prevent us from doing so, thereby having a negative impact on income. Significant decreases in interest rates could result in calls by issuers of investments, where such features are available to issuers. Any such calls could result in a decline in our investment income, as reinvestment of the proceeds would likely be at lower rates.
Increases in interest rates could cause the fair value of securities within our fixed maturity portfolio to decline. A rise in interest rates could also result in certain policyholders surrendering their annuity policies for cash, thereby potentially requiring our insurance subsidiaries to liquidate invested assets if other sources of liquidity are not available to meet their obligations. In such a case, realized losses could result from such sales and could adversely affect our statutory income, consolidated RBC ratio and results of operations.
Liquidity Risks:
Our ability to fund operations is substantially dependent on funds available, primarily dividends, from our insurance subsidiaries. As a holding company with no direct operations, our principal asset is the capital stock of our insurance subsidiaries, which periodically declare and distribute dividends on their capital stock. Moreover, our liquidity, including our ability to pay our operating expenses and to make principal and interest payments on debt securities or other indebtedness owed by us, as well as our ability to pay dividends on our common stock or any preferred stock, depends significantly upon the surplus and earnings of our insurance subsidiaries and the ability of these subsidiaries to pay dividends or to advance or repay funds to us. Other sources of liquidity include a variety of short-term and long-term instruments, including our credit facility, commercial paper, long-term debt, intercompany financing and reinsurance.
The principal sources of our insurance subsidiaries’ liquidity are insurance premiums, as well as investment income, maturities, repayments and other cash flow from our investment portfolio. Our insurance subsidiaries are subject to various state statutory and regulatory restrictions applicable to insurance companies that limit the amount of cash dividends, loans and advances that those subsidiaries may pay to us, including laws establishing minimum solvency and liquidity thresholds. For example, in the states where our companies are domiciled, an insurance company generally may pay dividends only out of its unassigned surplus as reflected in its statutory financial statements filed in that state. Additionally, dividends paid by insurance subsidiaries are restricted based on regulations by their states of domicile. Accordingly, impairments in assets or disruptions in our insurance subsidiaries’ operations that reduce their capital or cash flow could limit or disallow the payment of dividends to us, a principal source of our cash flow.
Changes in laws or regulations in the states in which our companies are domiciled could constrain the ability of our insurance subsidiaries to pay dividends or to advance or repay funds to us in sufficient amounts and at times necessary to meet our debt obligations and corporate expenses. Additionally, if our insurance subsidiaries were unable to obtain approval of our health insurance premium rate increases in a timely manner from state insurance regulatory authorities, their profitability, and their ability to declare and distribute dividends to us could be negatively impacted. Limitations on the flow of dividends from our subsidiaries could limit our ability to service and repay debt or to pay dividends on our capital stock.
Adverse capital and credit market conditions may significantly affect our ability to meet liquidity needs or access capital, as well as affect our cost of capital. Should interest rates rise in the future, the interest rate on any new debt obligation we may issue could increase and our net income could be reduced. In addition, if the credit and capital markets were to experience significant disruption, uncertainty and instability, these conditions could adversely affect our access to capital. Such market conditions may limit our ability to replace maturing liabilities in a timely manner or at all and/or access the capital necessary to grow our business.
In the unlikely event that current sources of liquidity do not satisfy our needs, we may have to seek additional financing or raise capital. The availability and cost of additional financing or capital depend on a variety of factors such as market conditions, the general availability of credit or capital, the volume of trading activities, the overall availability of credit to the insurance industry and our credit ratings and credit capacity. Additionally, customers, lenders or investors could develop a negative perception of our financial prospects if we were to incur large investment losses or if the level of
TMK 2018 FORM 10-K
our business activity were to decrease due to a market downturn. Our access to funds may also be impaired if regulatory authorities or rating agencies take negative actions against us. If our internal sources of liquidity prove to be insufficient, we may not be able to successfully obtain additional financing on favorable terms or at all. As such, we may be forced to delay raising capital, issue shorter term securities than we would prefer or bear an unattractive cost of capital which could decrease our profitability and significantly reduce our financial flexibility. If so, our results of operations, financial condition and cash flows could be materially negatively affected.
Regulatory Risks:
Our businesses are heavily regulated and changes in regulation may reduce our profitability and growth. Insurance companies, including our insurance subsidiaries, are subject to extensive supervision and regulation in the states in which they do business. The primary purpose of this supervision and regulation is the protection of policyholders, not investors. State agencies have broad administrative power over numerous aspects of our business, including premium rates and other terms and conditions that we can include in the insurance policies offered by our insurance subsidiaries, marketing practices, advertising, agent licensing, policy forms, capital adequacy, solvency, reserves and permitted investments. Also, regulatory authorities have relatively broad discretion to grant, renew or revoke licenses or approvals. The insurance laws, regulations and policies currently affecting the Company may change at any time, possibly having an adverse effect on our business. Should regulatory changes occur, we may be unable to maintain all required licenses and approvals, or fully comply with the wide variety of applicable laws and regulations or the relevant authority’s interpretation of such laws and regulations, which may change from time to time. If we do not have the requisite licenses and approvals or do not comply with applicable regulatory requirements, the insurance regulatory authorities could preclude or temporarily suspend some or all of our business activities and/or impose substantial fines.
We cannot predict the timing or substance of any future regulatory initiatives. In recent years, there has been increased scrutiny of insurance companies, including our insurance subsidiaries, by insurance regulatory authorities, which has included more extensive examinations and more detailed review of disclosure documents. These regulatory authorities may bring regulatory or other legal actions against us if, in their view, our practices, or those of our agents, are improper. Such actions could result in substantial fines, penalties and/or prohibitions or restrictions on our business activities, and could have a material adverse effect on our business, results of operations or financial condition. Additionally, changes in the overall legal or regulatory environment may cause us to change our views regarding the actions that we need to take from a legal or regulatory risk management perspective, thus necessitating changes to our practices that may, in some cases, limit our ability to grow, impact regulatory capital requirements, or otherwise negatively impact our profitability.
Currently, the U.S. federal government does not directly regulate the business of insurance. However, the Dodd-Frank Wall Street Record and Consumer Protection Act of 2010 established a Federal Insurance Office (FIO), charged with monitoring systemic risk exposure in all lines of insurance other than health insurance and long-term care insurance, and a Financial Stability Oversight Council (FSOC), which serves to identify and respond to risks and emerging threats to U.S. financial systems. A Center for Consumer Information and Insurance Oversight (CCIIO), established under the Department of Health and Human Services, is charged with overseeing implementation of the Affordable Care Act (ACA). The creation of these insurance regulatory offices may indicate that the federal government intends to play a larger role in the direct oversight or regulation of the insurance industry. We cannot predict what impact, if any, the ongoing operations of the FIO, FSOC and CCIIO, as well as any other proposals or executive action for federal oversight or regulation of insurance could have on our business, results of operations or financial condition.
Changes in U.S. federal income tax law could increase our tax costs or negatively impact our insurance subsidiaries' capital. Changes to the Internal Revenue Code, administrative rulings, or court decisions affecting the insurance industry, including the products insurers offer, could increase our effective tax rate and lower our net income, adversely impact our insurance subsidiaries' capital, or limit the ability of our insurance subsidiaries to sell certain of their products.
Changes in accounting standards issued by accounting standard-setting bodies may affect our financial statements, reduce our reported profitability and change the timing of profit recognition. Our financial statements are subject to the application of GAAP and accounting practices as promulgated by the National Association of Insurance Commissioners’ statutory accounting practices (NAIC SAP), which principles are periodically revised and/or expanded. Accordingly, from time to time we are required to adopt new or revised accounting standards or guidance issued by
TMK 2018 FORM 10-K
recognized authoritative bodies. Future accounting standards that we are required to adopt could change the current accounting treatment that we apply to our consolidated financial statements and such changes could have a material adverse effect on our financial condition and results of operations. Further, standard setters have a full agenda of unissued topics under review at any given time, many of which have the potential to negatively impact our profitability.
Non-compliance with laws or regulations related to customer and consumer privacy and information security, including a failure to ensure that our business associates with access to sensitive customer and consumer information maintain its confidentiality, could materially adversely affect our reputation and business operations. The collection, maintenance, use, disclosure and disposal of personally identifiable information by our insurance subsidiaries are regulated at the international, federal and state levels. These laws and rules are subject to change by legislation or administrative or judicial interpretation. Various state laws address the use and disclosure of personally identifiable information to the extent they are more restrictive than those contained in the privacy and security provisions in the federal Gramm-Leach-Bliley Act of 1999 (GLBA), the Health Information Technology for Economic and Clinical Health Act (HITECH), and in the Health Insurance Portability and Accountability Act of 1996 (HIPAA). HIPAA also requires that we impose privacy and security requirements on our business associates (as that term is defined in the HIPAA regulations). Noncompliance with any privacy laws, whether by us or by one of our business associates, could have a material adverse effect on our business, reputation and results of operations and could include material fines and penalties, various forms of damages, consent orders regarding our privacy and security practices, adverse actions against our licenses to do business and injunctive relief.
Litigation Risk:
Litigation could result in substantial judgments against us or our subsidiaries. We are, and in the future may be, subject to litigation in the ordinary course of business. Some of these proceedings have been brought on behalf of various alleged classes of complainants, and, in certain of these matters, the plaintiffs are seeking large and/or indeterminate amounts, including punitive or exemplary damages. Members of our management and legal teams review litigation on a quarterly and annual basis. However, the outcome of any such litigation cannot be predicted with certainty. A number of civil jury verdicts involving the insurers’ sales practices, alleged agent misconduct, failure to properly supervise agents and other matters have been returned against insurers in the jurisdictions in which our insurance subsidiaries do business. These lawsuits have resulted in the award of substantial judgments against insurers that are disproportionate to the actual damages, including material amounts of punitive damages. In some states in which we operate, juries have substantial discretion in awarding punitive damages. This discretion creates the potential for unpredictable material adverse judgments in any given punitive damages suit.
Our pending and future litigation could adversely affect us because of the costs of defending these cases, the costs of settlement or judgments against us, or changes in our operations that could result from litigation. Substantial legal liability in these or future legal actions could also have a material adverse financial effect or cause significant harm to our reputation, which, in turn, could materially harm our business and our business prospects.
Actual or alleged misclassification of independent contractors at our insurance subsidiaries could result in adverse legal, tax or financial consequences. A significant portion of our sales agents are independent contractors. Although we believe we have properly classified such individuals, a risk nevertheless exists that a court, the IRS or other authority will take the position that those sales agents are employees. The laws and regulations that govern the status and classification of workers are subject to change and differing interpretations, which we cannot predict.
If there is an adverse determination regarding the classification of some or all of the independent contractors at our insurance subsidiaries by a court or governmental agency, we could incur significant costs with respect to payroll tax liabilities, employee benefits, wage payments, fines, judgments and/or legal settlements, any of which could have a material adverse effect on our business, financial condition and results of operations. In addition, any resulting reclassification could necessitate significant changes in our affected insurance subsidiaries’ business models.
Catastrophic Event Risk:
Our business is subject to the risk of the occurrence of catastrophic events. Our insurance policies are issued to and held by a large number of policyholders throughout the United States in relatively low-face amounts. Accordingly, it is unlikely that a large portion of our policyholder base would be affected by a single natural disaster. However, our insurance operations could be exposed to the risk of catastrophic mortality or morbidity caused by events such as a
TMK 2018 FORM 10-K
pandemic, hurricane, earthquake, or man-made catastrophes, including acts of terrorism or war, which may produce significant claims in larger areas, especially those that are heavily populated. Claims resulting from natural or man-made catastrophic events could cause substantial volatility in our financial results for any fiscal quarter or year and could materially reduce our profitability or harm our financial condition.
TMK 2018 FORM 10-K
Item 1B. UNRESOLVED STAFF COMMENTS
As of December 31, 2018, Torchmark had no unresolved SEC staff comments.
Item 2. PROPERTIES
Torchmark, through its subsidiaries, owns or leases buildings that are used in the normal course of business. Torchmark owns and occupies a 300,000 square foot facility in McKinney, Texas. This facility is Torchmark’s corporate headquarters and also houses the operations of subsidiaries, United American and Liberty National, as well as many operations of other subsidiaries. In addition, United American leases 5,000 square feet of space in Omaha, Nebraska and, through a subsidiary, leases 3,230 square feet of office space in Syracuse, New York.
Globe Life leases 34,000 square feet of an office building located in Oklahoma City, Oklahoma. Globe Marketing Services, a subsidiary of Globe Life, owns a 133,000 square foot facility in Oklahoma City that houses the Globe Life Direct Response operation. Globe Life also leases a 10,000 square foot storage facility in Allen, Texas.
American Income owns and occupies two buildings located in Waco, Texas: a 70,000 square foot building for corporate operations and a 43,000 square foot printing facility. American Income also leases 19,597 square feet in additional corporate office space in Waco, and leases office space throughout the United States to support its marketing operations.
Family Heritage owns 50% of a partnership that owns a 66,000 square foot building in Broadview Heights, Ohio (a suburb of Cleveland). Family Heritage leases 24,157 square feet of the building for various corporate operations. The partnership also leases a portion of the building to unrelated tenants.
Item 3. LEGAL PROCEEDINGS
Torchmark and its subsidiaries, in common with the insurance industry in general, are subject to litigation, including putative class action litigation, claims involving tax matters, alleged breaches of contract, torts, including bad faith and fraud claims based on alleged wrongful or fraudulent acts of agents of Torchmark’s subsidiaries, employment discrimination, and miscellaneous other causes of action. Based upon information presently available, and in light of legal and other factual defenses available to Torchmark and its subsidiaries, management does not believe that such litigation will have a material adverse effect on Torchmark’s financial condition, future operating results or liquidity; however, assessing the eventual outcome of litigation necessarily involves forward-looking speculation as to judgments to be made by judges, juries and appellate courts in the future. This bespeaks caution, particularly in states with reputations for high punitive damage verdicts. Torchmark’s management recognizes that large punitive damage awards bearing little or no relation to actual damages continue to be awarded by juries in jurisdictions in which Torchmark and its subsidiaries have substantial business, creating the potential for unpredictable material adverse judgments in any given punitive damage suit.
See further discussion of litigation and unclaimed property audits in Note 6—Commitments and Contingencies.
Item 4. MINE SAFETY DISCLOSURES
Not Applicable.
TMK 2018 FORM 10-K
PART II
Item 5. MARKET FOR REGISTRANT'S COMMON EQUITY, RELATED STOCKHOLDER MATTERS AND ISSUER PURCHASES OF EQUITY SECURITIES
Market Price of and Dividends on the Registrant’s Common Equity and Related Stockholder Matters
The principal market in which Torchmark’s common stock is traded is the New York Stock Exchange (NYSE: TMK). There were 2,521 shareholders of record on December 31, 2018, excluding shareholder accounts held in nominee form.
The line graph shown below compares Torchmark’s cumulative total return on its common stock with the cumulative total returns of the Standard and Poor’s 500 Stock Index (S&P 500) and the Standard and Poor’s Life & Health Insurance Index (S&P Life & Health Insurance). Torchmark is one of the companies whose stock is included within both the S&P 500 and the S&P Life & Health Insurance Index.
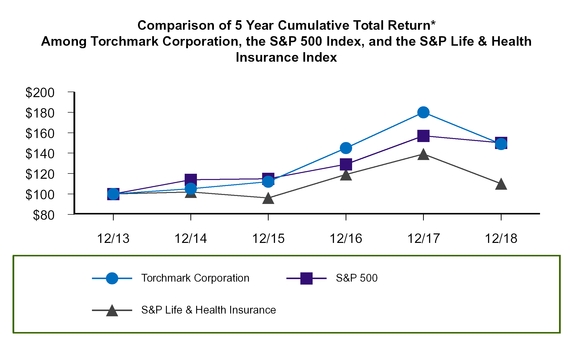
*$100 invested on 12/31/13 in stock or index, including reinvestment of dividends. Fiscal year ended December 31.
(Copyright © 2019 Standard & Poor's, a division of S&P Global. All rights reserved.)
Purchases of Certain Equity Securities by the Issuer and Others for the Fourth Quarter 2018
| Period | (a) Total Number of Shares Purchased | (b) Average Price Paid Per Share | (c) Total Number of Shares Purchased as Part of Publicly Announced Plans or Programs | (d) Maximum Number of Shares (or Approximate Dollar Amount) that May Yet Be Purchased Under the Plans or Programs | |||||||
| October 1-31, 2018 | 658,923 | $ | 84.59 | 658,923 | — | ||||||
| November 1-30, 2018 | 199,443 | 86.20 | 199,443 | — | |||||||
| December 1-31, 2018 | 644,199 | 78.40 | 644,199 | — |
On August 7, 2018, Torchmark’s Board reaffirmed its continued authorization of the Company’s stock repurchase program in amounts and with timing that management, in consultation with the Board, determined to be in the best interest of the Company. The program has no defined expiration date or maximum number of shares to be purchased.
TMK 2018 FORM 10-K
Item 6. SELECTED FINANCIAL DATA
The following information should be read in conjunction with Torchmark’s Consolidated Financial Statements and related notes reported elsewhere in this Form 10-K:
(Dollar amounts in thousands except per share and percentage data)
| Year ended December 31, | 2018 | 2017 | 2016 | 2015 | 2014 | ||||||||||||||
| Premium revenue: | |||||||||||||||||||
| Life | $ | 2,406,555 | $ | 2,306,547 | $ | 2,189,333 | $ | 2,073,065 | $ | 1,966,300 | |||||||||
| Health | 1,015,339 | 976,373 | 947,663 | 925,520 | 869,440 | ||||||||||||||
| Other | 12 | 15 | 38 | 135 | 400 | ||||||||||||||
| Total premium | 3,421,906 | 3,282,935 | 3,137,034 | 2,998,720 | 2,836,140 | ||||||||||||||
| Net investment income | 882,512 | 847,885 | 806,903 | 773,951 | 758,286 | ||||||||||||||
| Realized gains (losses) | (1,804 | ) | 23,611 | (10,683 | ) | (8,791 | ) | 23,548 | |||||||||||
| Total revenue | 4,303,751 | 4,155,573 | 3,934,629 | 3,766,065 | 3,620,095 | ||||||||||||||
| Income from continuing operations, net of tax | 701,510 | 1,458,263 | 539,590 | 516,293 | 528,074 | ||||||||||||||
| Income from discontinued operations, net of tax | (44 | ) | (3,769 | ) | 10,189 | 10,807 | 14,865 | ||||||||||||
| Net income(1) | 701,466 | 1,454,494 | 549,779 | 527,100 | 542,939 | ||||||||||||||
| Per common share: | |||||||||||||||||||
| Basic earnings: | |||||||||||||||||||
| Income from continuing operations | 6.22 | 12.53 | 4.50 | 4.13 | 4.04 | ||||||||||||||
| Income from discontinued operations | — | (0.03 | ) | 0.08 | 0.08 | 0.11 | |||||||||||||
| Net income(1) | 6.22 | 12.50 | 4.58 | 4.21 | 4.15 | ||||||||||||||
| Diluted earnings: | |||||||||||||||||||
| Income from continuing operations | 6.09 | 12.26 | 4.41 | 4.07 | 3.98 | ||||||||||||||
| Income from discontinued operations | — | (0.04 | ) | 0.08 | 0.09 | 0.11 | |||||||||||||
| Net income(1) | 6.09 | 12.22 | 4.49 | 4.16 | 4.09 | ||||||||||||||
| Cash dividends declared | 0.64 | 0.60 | 0.56 | 0.54 | 0.51 | ||||||||||||||
| Cash dividends paid | 0.63 | 0.59 | 0.56 | 0.53 | 0.49 | ||||||||||||||
| Basic weighted average shares outstanding | 112,873 | 116,343 | 120,001 | 125,095 | 130,722 | ||||||||||||||
| Diluted weighted average shares outstanding | 115,249 | 118,983 | 122,368 | 126,757 | 132,640 | ||||||||||||||
| As of December 31, | 2018 | 2017 | 2016 | 2015 | 2014 | ||||||||||||||
| Cash and invested assets | $ | 17,239,570 | $ | 17,853,047 | $ | 15,955,891 | $ | 14,405,073 | $ | 15,058,996 | |||||||||
| Total assets | 23,095,722 | 23,474,985 | 21,436,087 | 19,853,213 | 20,272,259 | ||||||||||||||
| Short-term debt | 307,848 | 328,067 | 264,475 | 490,129 | 238,398 | ||||||||||||||
| Long-term debt | 1,357,185 | 1,132,201 | 1,133,165 | 743,733 | 992,130 | ||||||||||||||
| Shareholders' equity(1) | 5,415,177 | 6,231,421 | 4,566,861 | 4,055,552 | 4,697,466 | ||||||||||||||
| Per diluted common share(1) | 48.11 | 52.95 | 37.76 | 32.71 | 36.19 | ||||||||||||||
| Effect of fixed maturity revaluation on diluted equity per common share(2) | 3.79 | 13.18 | 5.63 | 2.62 | 8.28 | ||||||||||||||
| Annualized premium in force: | |||||||||||||||||||
| Life | 2,464,728 | 2,373,099 | 2,262,736 | 2,150,498 | 2,044,545 | ||||||||||||||
| Health | 1,073,698 | 1,018,020 | 998,634 | 973,042 | 947,323 | ||||||||||||||
| Total | 3,538,426 | 3,391,119 | 3,261,370 | 3,123,540 | 2,991,868 | ||||||||||||||
| Basic shares outstanding | 110,693 | 114,593 | 118,031 | 122,370 | 127,930 | ||||||||||||||
| Diluted shares outstanding | 112,561 | 117,696 | 120,958 | 123,996 | 129,812 |
Note: Certain figures have been revised to reflect the adoption of new accounting guidance and discontinued operations.
| (1) | See discussion of tax legislation impact in 2017 in the Results of Operations. |
| (2) | See discussion under the caption Capital Resources in Management’s Discussion and Analysis in this report concerning the effect this rule has on Torchmark’s equity. |
TMK 2018 FORM 10-K
Item 7. MANAGEMENT'S DISCUSSION AND ANALYSIS OF FINANCIAL CONDITION AND RESULTS OF OPERATIONS
The following discussion should be read in conjunction with the Selected Financial Data and Torchmark’s Consolidated Financial Statements and Notes thereto appearing elsewhere in this report.
RESULTS OF OPERATIONS
 | How Torchmark Views Its Operations. Torchmark is the holding company for a group of insurance companies that market primarily individual life and supplemental health insurance to lower middle to middle income households throughout the United States. We view our operations by segments, which are the insurance product lines of life, health, and annuities, and the investment segment that supports the product lines. Segments are aligned based on their common characteristics, comparability of the profit margins, and management techniques used to operate each segment. | |
 | Insurance Product Line Segments. The insurance product line segments involve the marketing, underwriting, and administration of policies. Each product line is further segmented by the various distribution units that market the insurance policies. Each distribution unit operates in a niche market offering insurance products designed for that particular market. Whether analyzing profitability of a segment as a whole, or the individual distribution units within the segment, the measure of profitability used by management is the underwriting margin, which is: | |
| Premium revenue Less: Policy obligations Policy acquisition costs and commissions | ||
 | Investment Segment. The investment segment involves the management of our capital resources, including investments and the management of corporate debt and liquidity. Our measure of profitability for the investment segment is excess investment income, which is: | |
| Net investment income Less: Required interest on net policy liabilities Financing costs |
TMK 2018 FORM 10-K
CURRENT YEAR HIGHLIGHTS:
| • | Net income as a return on equity (ROE) was 12.3%(1) and net operating income as an ROE, excluding net unrealized gains on the fixed maturity portfolio was 14.6%(1,2). |
| • | Total premium increased by 4% over the prior year. Life premium increased by 4% for the year from $2.3 billion to $2.4 billion. Life underwriting margin increased 8% from $604 million in 2017 to $652 million in 2018. |
| • | Net investment income increased 4% over the prior year. In addition, excess investment income, a measure used by management as explained below, increased by 2% over the prior year. |
| • | During 2018, the Company repurchased 4.4 million shares at a total cost of $372 million for an average share price of $84.38. |
The following represents net income and net operating income from continuing operations for the 3 years ended December 31, 2018.
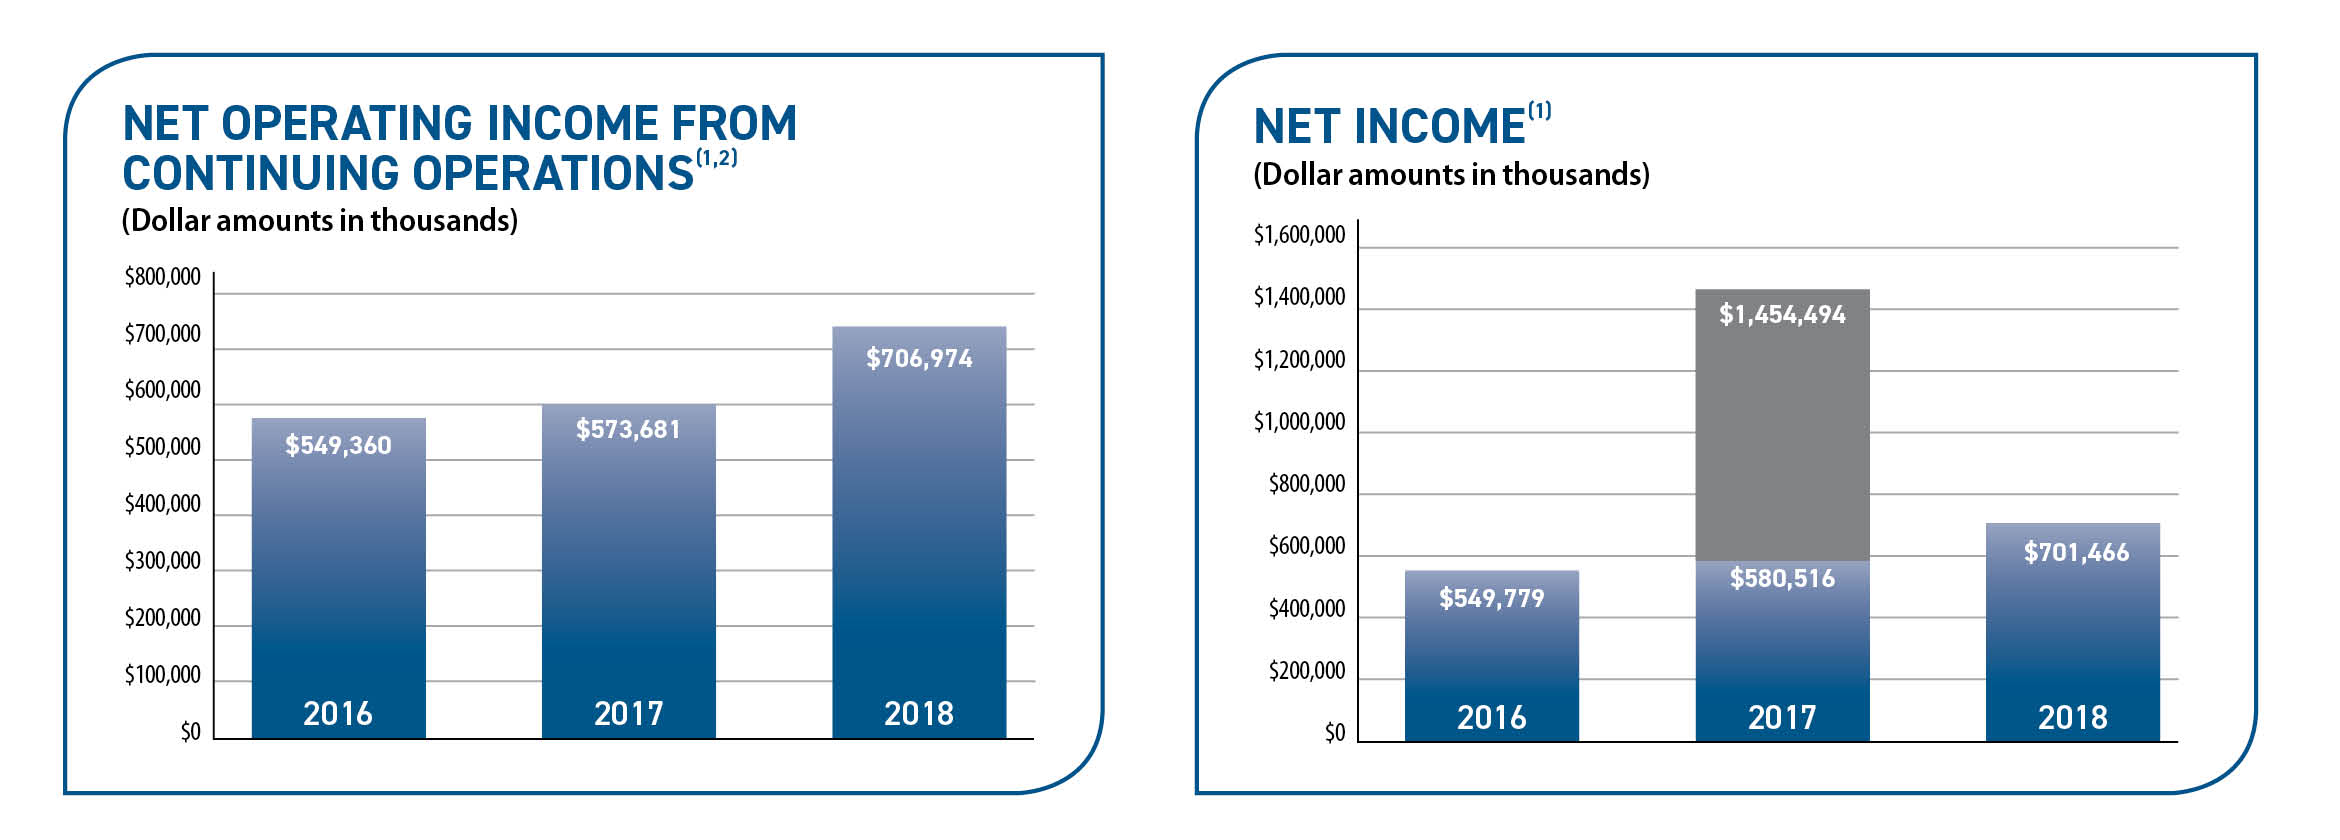
| (1) | In 2017, tax legislation revised the corporate income tax rate from 35% to 21% effective January 1, 2018. See Note 5—Income Taxes for further discussion. In 2018, income tax expense was calculated based on the 21% rate as compared with a 35% rate for 2017. |
In addition, the Company recorded an adjustment of $874 million to net income during 2017. In 2018, the Company completed its analysis of the tax legislation and recorded an additional $798 thousand adjustment related to the remeasurement of the deferred tax assets and liabilities based on the 21% rate. As the impact of the tax legislation was treated as a non-operating event, it was excluded from net operating income.
| (2) | Net operating income is considered a non-GAAP measure and it has been used consistently by Torchmark’s management for many years to evaluate the operating performance of the Company. It differs from net income primarily because it excludes certain non-operating items such as realized gains and losses and certain significant and unusual items included in net income. Net income is the most directly comparable GAAP measure. |
Net operating income as an ROE, excluding net unrealized gains on the fixed maturity portfolio, is also considered a non-GAAP measure. Management utilizes this measure to view the business without the effect of the unrealized gains or losses, which are primarily attributable to fluctuation in interest rates on the available for sale portfolio.
Summary of Operations
Net income was $701 million in 2018, compared with $1.5 billion in 2017. This decrease was primarily due to an $874 million increase to net income in 2017, relating to new tax legislation as described above. Net income increased in 2017 from $550 million in 2016. On a diluted per common share basis, 2018 net income fell 50% to $6.09 after a 172% increase in 2017. Net income per diluted common share in 2017 rose to $12.22 from $4.49 in 2016. As previously noted, 2017 net income per diluted common share includes the effect of the adjustment to net income relating to new tax legislation. The percentage growth in net income per share results continues to exceed the growth in dollar amounts due to our share repurchase program. Each year’s net income per share was affected by realized gains (losses), which were $(0.01), $0.15, and $(0.06), in 2018, 2017 and 2016, respectively. More information concerning realized gains and losses can be found under the caption Realized Gains and Losses in this report.
Net operating income from continuing operations rose each year over the prior year from $549 million in 2016 to $574 million in 2017 to $707 million in 2018. Net operating income is the consolidated total of segment profits after tax and
TMK 2018 FORM 10-K
as such is considered a non-GAAP measure. Net income is the most directly comparable GAAP measure. We do not consider realized gains and losses to be a component of our core insurance operations or operating segments. Additionally, net income was affected by certain significant and unusual non-operating items in each of the years 2016 through 2018. We do not view these items as components of core operating results because they are not indicative of past performance or future prospects of the insurance operations. We remove items such as these that relate to prior periods or are non-operating items when evaluating the results of current operations, and therefore exclude such items from our segment analysis for current periods.
Torchmark’s operations on a segment-by-segment basis are discussed in depth under the appropriate captions following in this report.
Analysis of Profitability by Segment
(Dollar amounts in thousands)
| 2018 | 2017 | 2016 | 2018 Change | % | 2017 Change | % | |||||||||||||||||||
| Life insurance underwriting margin | $ | 652,301 | $ | 604,337 | $ | 573,762 | $ | 47,964 | 8 | $ | 30,575 | 5 | |||||||||||||
| Health insurance underwriting margin | 236,053 | 219,508 | 210,056 | 16,545 | 8 | 9,452 | 4 | ||||||||||||||||||
| Annuity underwriting margin | 10,376 | 10,562 | 9,394 |
Showing the first 8K of 132K characters. Open the full section
Item 7A. QUANTITATIVE AND QUALITATIVE DISCLOSURES ABOUT MARKET RISK
Information required by this item is found under the heading Market Risk Sensitivity in Item 7 of this report.
TMK 2018 FORM 10-K
Item 8. FINANCIAL STATEMENTS AND SUPPLEMENTARY DATA
Consolidated Financial Statements Index
TMK 2018 FORM 10-K
REPORT OF INDEPENDENT REGISTERED PUBLIC ACCOUNTING FIRM
To the shareholders and the Board of Directors of Torchmark Corporation (McKinney, Texas)
Opinion on the Financial Statements
We have audited the accompanying consolidated balance sheets of Torchmark Corporation and subsidiaries (“Torchmark”) as of December 31, 2018 and 2017, the related consolidated statements of operations, comprehensive income, shareholders’ equity, and cash flows, for each of the three years in the period ended December 31, 2018, and the related notes and the schedules listed in the Index at Item 15 (collectively referred to as the “financial statements”). In our opinion, the financial statements present fairly, in all material respects, the financial position of Torchmark as of December 31, 2018 and 2017, and the results of its operations and its cash flows for each of the three years in the period ended December 31, 2018, in conformity with accounting principles generally accepted in the United States of America.
We have also audited, in accordance with the standards of the Public Company Accounting Oversight Board (United States) (PCAOB), Torchmark’s internal control over financial reporting as of December 31, 2018, based on criteria established in Internal Control - Integrated Framework (2013) issued by the Committee of Sponsoring Organizations of the Treadway Commission and our report dated February 28, 2019, expressed an unqualified opinion on Torchmark’s internal control over financial reporting.
Basis for Opinion
These financial statements are the responsibility of Torchmark’s management. Our responsibility is to express an opinion on Torchmark’s financial statements based on our audits. We are a public accounting firm registered with the PCAOB and are required to be independent with respect to Torchmark in accordance with the U.S. federal securities laws and the applicable rules and regulations of the Securities and Exchange Commission and the PCAOB.
We conducted our audits in accordance with the standards of the PCAOB. Those standards require that we plan and perform the audit to obtain reasonable assurance about whether the financial statements are free of material misstatement, whether due to error or fraud. Our audits included performing procedures to assess the risks of material misstatement of the financial statements, whether due to error or fraud, and performing procedures that respond to those risks. Such procedures included examining, on a test basis, evidence regarding the amounts and disclosures in the financial statements. Our audits also included evaluating the accounting principles used and significant estimates made by management, as well as evaluating the overall presentation of the financial statements. We believe that our audits provide a reasonable basis for our opinion.
/s/ DELOITTE & TOUCHE LLP
Dallas, Texas
February 28, 2019
We have served as Torchmark’s auditor since 1999.
TMK 2018 FORM 10-K
TORCHMARK CORPORATION
CONSOLIDATED BALANCE SHEETS
(Dollar amounts in thousands, except per share data)
| December 31, | |||||||
| 2018 | 2017 | ||||||
| Assets: | |||||||
| Investments: | |||||||
| Fixed maturities—available for sale, at fair value (amortized cost: 2018—$15,753,471; 2017—$14,995,101) | $ | 16,297,932 | $ | 16,969,325 | |||
| Policy loans | 550,066 | 529,529 | |||||
| Other long-term investments (includes: 2018—$108,241; 2017—$0, under the fair value option) | 207,258 | 108,559 | |||||
| Short-term investments | 63,288 | 127,071 | |||||
| Total investments | 17,118,544 | 17,734,484 | |||||
| Cash | 121,026 | 118,563 | |||||
| Accrued investment income | 243,003 | 233,453 | |||||
| Other receivables | 415,157 | 391,775 | |||||
| Deferred acquisition costs | 4,137,925 | 3,958,063 | |||||
| Goodwill | 441,591 | 441,591 | |||||
| Other assets | 549,899 | 528,536 | |||||
| Assets related to discontinued operations | 68,577 | 68,520 | |||||
| Total assets | $ | 23,095,722 | $ | 23,474,985 | |||
| Liabilities: | |||||||
| Future policy benefits | $ | 13,953,826 | $ | 13,439,472 | |||
| Unearned and advance premiums | 61,208 | 61,430 | |||||
| Policy claims and other benefits payable | 350,826 | 333,294 | |||||
| Other policyholders' funds | 97,459 | 97,635 | |||||
| Total policy liabilities | 14,463,319 | 13,931,831 | |||||
| Current and deferred income taxes payable | 1,047,737 | 1,312,002 | |||||
| Other liabilities | 453,270 | 489,609 | |||||
| Short-term debt | 307,848 | 328,067 | |||||
| Long-term debt (estimated fair value: 2018—$1,384,455; 2017—$1,228,392) | 1,357,185 | 1,132,201 | |||||
| Liabilities related to discontinued operations | 51,186 | 49,854 | |||||
| Total liabilities | 17,680,545 | 17,243,564 | |||||
| Commitments and Contingencies (Note 6) | |||||||
| Shareholders’ equity: | |||||||
| Preferred stock, par value $1 per share—5,000,000 shares authorized; outstanding: 0 in 2018 and 2017 | — | — | |||||
| Common stock, par value $1 per share—320,000,000 shares authorized; outstanding: (2018—121,218,183 issued; 2017—124,218,183 issued) | 121,218 | 124,218 | |||||
| Additional paid-in capital | 524,414 | 508,476 | |||||
| Accumulated other comprehensive income (loss) | 319,475 | 1,424,274 | |||||
| Retained earnings | 5,213,468 | 4,806,208 | |||||
| Treasury stock, at cost: (2018—10,525,147 shares; 2017—9,625,104 shares) | (763,398 | ) | (631,755 | ) | |||
| Total shareholders’ equity | 5,415,177 | 6,231,421 | |||||
| Total liabilities and shareholders’ equity | $ | 23,095,722 | $ | 23,474,985 |
See accompanying Notes to Consolidated Financial Statements.
TMK 2018 FORM 10-K
TORCHMARK CORPORATION
CONSOLIDATED STATEMENTS OF OPERATIONS
(Dollar amounts in thousands, except per share data)
| Year Ended December 31, | |||||||||||
| 2018 | 2017 | 2016 | |||||||||
| Revenue: | |||||||||||
| Life premium | $ | 2,406,555 | $ | 2,306,547 | $ | 2,189, |
Showing the first 8K of 242K characters. Open the full section
Item 9. CHANGES IN AND DISAGREEMENTS WITH ACCOUNTANTS ON ACCOUNTING AND FINANCIAL DISCLOSURES
None.
Item 9A. CONTROLS AND PROCEDURES
Evaluation of Disclosure Controls and Procedures: Torchmark, under the direction of the Co-Chairmen and Chief Executive Officers and the Executive Vice President and Chief Financial Officer, has established disclosure controls and procedures that are designed to ensure that information required to be disclosed by Torchmark in the reports that it files or submits under the Securities Exchange Act of 1934 is recorded, processed, summarized and reported within the time periods specified in the SEC’s rules and forms. The disclosure controls and procedures are also intended to ensure that such information is accumulated and communicated to Torchmark’s management, including the Co-Chairmen and Chief Executive Officers and the Executive Vice President and Chief Financial Officer, as appropriate to allow timely decisions regarding required disclosures.
As of the end of the fiscal year completed December 31, 2018, an evaluation was performed under the supervision and with the participation of Torchmark management, including the Co-Chairmen and Chief Executive Officers and the Executive Vice President and Chief Financial Officer, of Torchmark’s disclosure controls and procedures (as those terms are defined in Rule 13a-15(e) under the Securities Exchange Act of 1934). Based upon their evaluation, the Co-Chairmen and Chief Executive Officers and the Executive Vice President and Chief Financial Officer have concluded that Torchmark's disclosure controls and procedures are effective as of the date of this Form 10-K. In compliance with Section 302 of the Sarbanes Oxley Act of 2002 (18 U.S.C. § 1350), each of these officers executed a Certification included as an exhibit to this Form 10-K.
Management's Annual Report on Internal Control over Financial Reporting: Management is responsible for establishing and maintaining adequate internal control over financial reporting as defined in Rule 13a-15(f) under the Securities Exchange Act of 1934. Management evaluated the design and operating effectiveness of the Company's internal control over financial reporting based on the criteria established in Internal Control—Integrated Framework (2013) issued by the Committee of Sponsoring Organizations (COSO) of the Treadway Commission. Based upon their evaluation as of December 31, 2018, the Co-Chairmen and Chief Executive Officers, and the Executive Vice President and Chief Financial Officer have concluded that Torchmark’s internal control over financial reporting is effective as of the date of this Form 10-K. In compliance with Section 302 of the Sarbanes-Oxley Act of 2002 (18 U.S.C. § 1350), each of these officers executed a Certification included as an exhibit to this Form 10-K.
Changes in Internal Control over Financial Reporting: As of the quarter ended December 31, 2018, there have not been any changes in Torchmark’s internal control over financial reporting or in other factors that could significantly affect this control over financial reporting subsequent to the date of their evaluation which have materially affected, or are reasonably likely to materially affect, Torchmark’s internal control over financial reporting.
Refer to Deloitte & Touche LLP's, independent registered public accounting firm, attestation report on the Company's internal controls over financial reporting.
TMK 2018 FORM 10-K
MANAGEMENT'S REPORT ON INTERNAL CONTROL OVER FINANCIAL REPORTING
Management at Torchmark Corporation is responsible for establishing and maintaining adequate internal control over financial reporting for the Company and for assessing the effectiveness of internal control on an annual basis. As a framework for assessing internal control over financial reporting, the Company utilizes the criteria for effective internal control over financial reporting described in Internal Control—Integrated Framework (2013) issued by the Committee of Sponsoring Organizations of the Treadway Commission.
There are inherent limitations in the effectiveness of any internal control, including the possibility of human error and the circumvention or overriding of controls. Accordingly, even effective internal controls can provide only reasonable assurance with respect to financial statement preparation. Further, because of changes in conditions, the effectiveness of internal control may vary over time.
Management evaluated the Company’s internal control over financial reporting, and based on its assessment, determined that the Company’s internal control over financial reporting was effective as of December 31, 2018. The Company’s independent registered public accounting firm has issued an attestation report on the Company’s internal control over financial reporting as stated in their report which is included herein.
| /s/ Gary L. Coleman | |
| Gary L. Coleman Co-Chairman and Chief Executive Officer | |
| /s/ Larry M. Hutchison | |
| Larry M. Hutchison Co-Chairman and Chief Executive Officer | |
| /s/ Frank M. Svoboda | |
| Frank M. Svoboda Executive Vice President and Chief Financial Officer |
February 28, 2019
TMK 2018 FORM 10-K
REPORT OF INDEPENDENT REGISTERED PUBLIC ACCOUNTING FIRM
To the shareholders and the Board of Directors of Torchmark Corporation (McKinney, Texas)
Opinion on Internal Control over Financial Reporting
We have audited the internal control over financial reporting of Torchmark Corporation and subsidiaries (“Torchmark”) as of December 31, 2018, based on criteria established in Internal Control - Integrated Framework (2013) issued by the Committee of Sponsoring Organizations of the Treadway Commission (COSO). In our opinion, Torchmark maintained, in all material respects, effective internal control over financial reporting as of December 31, 2018, based on criteria established in Internal Control - Integrated Framework (2013) issued by COSO.
We have also audited, in accordance with the standards of the Public Company Accounting Oversight Board (United States) (PCAOB), the consolidated financial statements and financial statement schedules as of and for the year ended December 31, 2018 of Torchmark and our report dated February 28, 2019 expressed an unqualified opinion on those financial statements and financial statement schedules.
Basis for Opinion
Torchmark’s management is responsible for maintaining effective internal control over financial reporting and for its assessment of the effectiveness of internal control over financial reporting, included in the accompanying Management’s Report on Internal Control over Financial Reporting. Our responsibility is to express an opinion on Torchmark’s internal control over financial reporting based on our audit. We are a public accounting firm registered with the PCAOB and are required to be independent with respect to the Company in accordance with the U.S. federal securities laws and the applicable rules and regulations of the Securities and Exchange Commission and the PCAOB.
We conducted our audit in accordance with the standards of the PCAOB. Those standards require that we plan and perform the audit to obtain reasonable assurance about whether effective internal control over financial reporting was maintained in all material respects. Our audit included obtaining an understanding of internal control over financial reporting, assessing the risk that a material weakness exists, testing and evaluating the design and operating effectiveness of internal control based on the assessed risk, and performing such other procedures as we considered necessary in the circumstances. We believe that our audit provides a reasonable basis for our opinion.
Definition and Limitations of Internal Control over Financial Reporting
A company’s internal control over financial reporting is a process designed to provide reasonable assurance regarding the reliability of financial reporting and the preparation of financial statements for external purposes in accordance with generally accepted accounting principles. A company’s internal control over financial reporting includes those policies and procedures that (1) pertain to the maintenance of records that, in reasonable detail, accurately and fairly reflect the transactions and dispositions of the assets of the company; (2) provide reasonable assurance that transactions are recorded as necessary to permit preparation of financial statements in accordance with generally accepted accounting principles, and that receipts and expenditures of the company are being made only in accordance with authorizations of management and directors of the company; and (3) provide reasonable assurance regarding prevention or timely detection of unauthorized acquisition, use, or disposition of the company’s assets that could have a material effect on the financial statements.
Because of its inherent limitations, internal control over financial reporting may not prevent or detect misstatements. Also, projections of any evaluation of effectiveness to future periods are subject to the risk that controls may become inadequate because of changes in conditions, or that the degree of compliance with the policies or procedures may deteriorate.
/s/ DELOITTE & TOUCHE LLP
Dallas, Texas
February 28, 2019
TMK 2018 FORM 10-K
Item 9B. OTHER INFORMATION
There were no items required.
PART III
Item 10. DIRECTORS, EXECUTIVE OFFICERS AND CORPORATE GOVERNANCE
Information required by this item is incorporated by reference from the sections entitled “Election of Directors,” “Profiles of Director Nominees,” “Executive Officers,” “Audit Committee Report,” “Governance Guidelines and Codes of Ethics,” “Director Qualification Standards,” “Procedures for Director Nominations by Shareholders,” and “Section 16(a) Beneficial Ownership Reporting Compliance” in the Proxy Statement for the Annual Meeting of Shareholders to be held April 25, 2019 (the Proxy Statement), which is to be filed with the Securities and Exchange Commission (SEC).
Item 11. EXECUTIVE COMPENSATION
Information required by this item is incorporated by reference from the sections entitled “Compensation Discussion and Analysis”, “Compensation Committee Report”, “Summary Compensation Table”, "CEO Pay Ratio", “2018 Grants of Plan-based Awards”, “Outstanding Equity Awards at Fiscal Year End 2018”, “Option Exercises and Stock Vested during Fiscal Year Ended December 31, 2018”, “Pension Benefits at December 31, 2018”, “Potential Payments upon Termination or Change in Control”, “2018 Director Compensation”, “Payments to Directors” and “Compensation Committee Interlocks and Insider Participation” in the Proxy Statement, which is to be filed with the SEC.
Item 12. SECURITY OWNERSHIP OF CERTAIN BENEFICIAL OWNERS AND MANAGEMENT AND RELATED STOCKHOLDER MATTERS
| 1. | Equity Compensation Plan Information as of December 31, 2018 |
| Plan Category | Number of securities to be issued upon exercise of outstanding options, warrants, and rights (a) | Weighted-average exercise price of outstanding options, warrants, and rights (b) | Number of securities remaining available for future issuance under equity compensation plans (excluding securities in column (a)) (c) | |||||||
| Equity compensation plans approved by security holders | 7,203,765 | $ | 61.72 | 9,422,760 | ||||||
| Equity compensation plans not approved by security holders | — | — | — | |||||||
| Total | 7,203,765 | $ | 61.72 | 9,422,760 |
2.Security ownership of certain beneficial owners:
Information required by this item is incorporated by reference from the section entitled “Principal Shareholders” in the Proxy Statement, which is to be filed with the SEC.
3.Security ownership of management:
Information required by this item is incorporated by reference from the section entitled “Stock Ownership” in the Proxy Statement, which is to be filed with the SEC.
4.Changes in control:
Torchmark knows of no arrangements, including any pledges by any person of its securities, the operation of which may at a subsequent date result in a change of control.
Item 13. CERTAIN RELATIONSHIPS AND RELATED TRANSACTIONS AND DIRECTOR INDEPENDENCE
Information required by this item is incorporated by reference from the sections entitled “Related Party Transaction Policy and Transactions” and “Director Independence Determinations” in the Proxy Statement, which is to be filed with the SEC.
TMK 2018 FORM 10-K
Item 14. PRINCIPAL ACCOUNTANT FEES AND SERVICES
Information required by this Item is incorporated by reference from the section entitled “Principal Accounting Firm Fees” and “Pre-approval Policy for Accounting Fees” in the Proxy Statement, which is to be filed with the SEC.
PART IV
Item 15. EXHIBITS AND FINANCIAL STATEMENT SCHEDULES
Index of documents filed as a part of this report:
| Page of this report | |
| Financial Statements: | |
| Torchmark Corporation and Subsidiaries: | |
| Report of Independent Registered Public Accounting Firm | 51 |
| Consolidated Balance Sheets at December 31, 2018 and 2017 | 52 |
| Consolidated Statements of Operations for each of the three years in the period ended December 31, 2018 | 53 |
| Consolidated Statements of Comprehensive Income for each of the three years in the period ended December 31, 2018 | 54 |
| Consolidated Statements of Shareholders’ Equity for each of the three years in the period ended December 31, 2018 | 55 |
| Consolidated Statements of Cash Flows for each of the three years in the period ended December 31, 2018 | 56 |
| Notes to Consolidated Financial Statements | 57 |
| Schedules Supporting Financial Statements for each of the three years in the period ended December 31, 2018: | |
| II. Condensed Financial Information of Registrant (Parent Company) | 125 |
| IV. Reinsurance (Consolidated) | 129 |
| Schedules not referred to have been omitted as inapplicable or not required by Regulation S-X. |
TMK 2018 FORM 10-K
EXHIBITS
TMK 2018 FORM 10-K
TMK 2018 FORM 10-K
TMK 2018 FORM 10-K
- Compensatory plan or arrangement.
** To be filed with the Securities and Exchange Commission within 120 days after the fiscal year ended December 31, 2018.
TMK 2018 FORM 10-K
Exhibit 21. Subsidiaries of the Registrant: The following table lists subsidiaries of the registrant which meet the definition of “significant subsidiary” according to Regulation S-X:
| Company | State of Incorporation | Name Under Which Company Does Business | ||
| Globe Life And Accident Insurance Company | Nebraska | Globe Life And Accident Insurance Company | ||
| American Income Life Insurance Company | Indiana | American Income Life Insurance Company | ||
| Liberty National Life Insurance Company | Nebraska | Liberty National Life Insurance Company | ||
| Family Heritage Life Insurance Company of America | Ohio | Family Heritage Life Insurance Company of America |
While United American Life Insurance Company (Nebraska) does not qualify as a significant subsidiary in accordance with Regulation S-X, management views this subsidiary as significant to our operations.
All other exhibits required by Regulation S-K are listed as to location in the “Index of documents filed as a part of this report” in this report. Exhibits not referred to have been omitted as inapplicable or not required.
TMK 2018 FORM 10-K
TORCHMARK CORPORATION
(PARENT COMPANY)
SCHEDULE II. CONDENSED FINANCIAL INFORMATION OF REGISTRANT
Condensed Balance Sheets
(Dollar amounts in thousands)
| December 31, | |||||||
| 2018 | 2017 | ||||||
| Assets: | |||||||
| Investments: | |||||||
| Long-term investments | $ | 29,603 | $ | 35,562 | |||
| Short-term investments | 21 | 5,624 | |||||
| Total investments | 29,624 | 41,186 | |||||
| Cash | 760 | 1,008 | |||||
| Investment in affiliates | 7,128,588 | 7,763,704 | |||||
| Due from affiliates | 96,110 | 95,920 | |||||
| Taxes receivable from affiliates | 50,656 | 63,099 | |||||
| Other assets | 152,103 | 135,616 | |||||
| Total assets | $ | 7,457,841 | $ | 8,100,533 | |||
| Liabilities and shareholders’ equity: | |||||||
| Liabilities: | |||||||
| Short-term debt | $ | 307,848 | $ | 328,067 | |||
| Long-term debt | 1,507,000 | 1,281,971 | |||||
| Due to affiliates | 3,002 | 8,002 | |||||
| Other liabilities | 224,814 | 251,072 | |||||
| Total liabilities | 2,042,664 | 1,869,112 | |||||
| Shareholders’ equity: | |||||||
| Preferred stock | 351 | 351 | |||||
| Common stock | 121,218 | 124,218 | |||||
| Additional paid-in capital | 874,925 | 858,987 | |||||
| Accumulated other comprehensive income | 319,475 | 1,424,274 | |||||
| Retained earnings | 5,213,468 | 4,806,208 | |||||
| Treasury stock | (1,114,260 | ) | (982,617 | ) | |||
| Total shareholders’ equity | 5,415,177 | 6,231,421 | |||||
| Total liabilities and shareholders’ equity | $ | 7,457,841 | $ | 8,100,533 |
See Notes to Condensed Financial Statements and accompanying Report of Independent Registered
Public Accounting Firm.
TMK 2018 FORM 10-K
TORCHMARK CORPORATION
(PARENT COMPANY)
SCHEDULE II. CONDENSED FINANCIAL INFORMATION OF REGISTRANT (continued)
Condensed Statement of Operations
(Dollar amounts in thousands)
| Year Ended December 31, | |||||||||||
| 2018 | 2017 | 2016 | |||||||||
| Net investment income | $ | 28,077 | $ | 26,130 | $ | 25,352 | |||||
| Realized investment gains (losses) | (11,078 | ) | (2,791 | ) | — | ||||||
| Total revenue | 16,999 | 23,339 | 25,352 | ||||||||
| General operating expenses | 65,762 | 61,447 | 52,613 | ||||||||
| Reimbursements from affiliates | (61,620 | ) | (52,776 | ) | (54,288 | ) | |||||
| Interest expense | 94,159 | 88,474 | 86,853 | ||||||||
| Total expenses | 98,301 | 97,145 | 85,178 | ||||||||
| Operating income (loss) before income taxes and equity in earnings of affiliates | (81,302 | ) | (73,806 | ) | (59,826 | ) | |||||
| Income taxes | 15,262 | (9,874 | ) | 23,479 | |||||||
| Net operating loss before equity in earnings of affiliates | (66,040 | ) | (83,680 | ) | (36,347 | ) | |||||
| Equity in earnings of affiliates, net of tax | 767,506 | 1,538,174 | 586,126 | ||||||||
| Net income | 701,466 | 1,454,494 | 549,779 | ||||||||
| Other comprehensive income (loss): | |||||||||||
| Attributable to Parent Company | 23,805 | (8,409 | ) | (11,314 | ) | ||||||
| Attributable to affiliates | (1,128,604 | ) | 602,709 | 356,941 | |||||||
| Comprehensive income (loss) | $ | (403,333 | ) | $ | 2,048,794 | $ | 895,406 |
See Notes to Condensed Financial Statements and accompanying Report of Independent Registered
Public Accounting Firm.
TMK 2018 FORM 10-K
TORCHMARK CORPORATION
(PARENT COMPANY)
SCHEDULE II. CONDENSED FINANCIAL INFORMATION OF REGISTRANT—(continued)
Condensed Statement of Cash Flows
(Dollar amounts in thousands)
| Year Ended December 31, | |||||||||||
| 2018 | 2017 | 2016 | |||||||||
| Net income | $ | 701,466 | $ | 1,454,494 | $ | 549,779 | |||||
| Equity in earnings of affiliates | (767,506 | ) | (1,538,174 | ) | (586,126 | ) | |||||
| Cash dividends from subsidiaries | 448,142 | 453,904 | 437,566 | ||||||||
| Other, net | 64,734 | 52,957 | (6,718 | ) | |||||||
| Cash provided from operations | 446,836 | 423,181 | 394,501 | ||||||||
| Cash provided from (used for) investing activities: | |||||||||||
| Net decrease (increase) in short-term investments | 5,603 | (5,624 | ) | (3,466 | ) | ||||||
| Investment in subsidiaries | (140,000 | ) | (31,000 | ) | (35,000 | ) | |||||
| Additions to properties | (19,888 | ) | (7,230 | ) | (21,965 | ) | |||||
| Loaned money to affiliates | (584,000 | ) | (180,000 | ) | (363,056 | ) | |||||
| Repayments from affiliates | 584,000 | 180,000 | 318,056 | ||||||||
| Cash provided from (used for) investing activities | (154,285 | ) | (43,854 | ) | (105,431 | ) | |||||
| Cash provided from (used for) financing activities: | |||||||||||
| Repayment of debt | (327,762 | ) | (126,875 | ) | (250,000 | ) | |||||
| Proceeds from issuance of debt | 550,000 | 125,000 | 400,000 | ||||||||
| Payment for debt issuance costs | (6,969 | ) | (1,661 | ) | (9,638 | ) | |||||
| Net issuance (repayment) of commercial paper | (22,719 | ) | 61,092 | 22,224 | |||||||
| Issuance of stock | 36,091 | 61,215 | 61,329 | ||||||||
| Acquisitions of treasury stock | (421,749 | ) | (412,989 | ) | (404,784 | ) | |||||
| Borrowed money from affiliate | 197,690 | 278,500 | 60,000 | ||||||||
| Repayments to affiliates | (202,690 | ) | (270,500 | ) | (78,000 | ) | |||||
| Payment of dividends | (94,691 | ) | (92,101 | ) | (90,201 | ) | |||||
| Cash provided from (used for) financing activities | (292,799 | ) | (378,319 | ) | (289,070 | ) | |||||
| Net increase (decrease) in cash | (248 | ) | 1,008 | — | |||||||
| Cash balance at beginning of period | 1,008 | — | — | ||||||||
| Cash balance at end of period | $ | 760 | $ | 1,008 | $ | — |
See Notes to Condensed Financial Statements and accompanying Report of Independent Registered
Public Accounting Firm.
TMK 2018 FORM 10-K
TORCHMARK CORPORATION
(PARENT COMPANY)
SCHEDULE II. CONDENSED FINANCIAL INFORMATION OF REGISTRANT (continued)
Notes to Condensed Financial Statements
(Dollar amounts in thousands)
Note A—Dividends from Subsidiaries
Cash dividends paid to Torchmark from the subsidiaries were as follows:
| Year Ended December 31, | |||||||||||
| 2018 | 2017 | 2016 | |||||||||
| Dividends from subsidiaries | $ | 448,142 | $ | 453,904 | $ | 437,566 |
Note B—Supplemental Disclosures of Cash Flow Information
The following table summarizes noncash transactions, which are not reflected on the Condensed Statements of Cash Flows:
| Year Ended December 31, | |||||||||||
| 2018 | 2017 | 2016 | |||||||||
| Stock-based compensation not involving cash | $ | 39,792 | $ | 37,034 | $ | 26,326 | |||||
| Investment in subsidiaries | 11,889 | 317,027 | — | ||||||||
| Dividend of property to Parent | 11,889 | — | — |
The following table summarizes certain amounts paid (received) during the period:
| Year Ended December 31, | |||||||||||
| 2018 | 2017 | 2016 | |||||||||
| Interest paid | $ | 86,982 | $ | 86,606 | $ | 84,952 | |||||
| Income taxes paid (received) | (21,377 | ) | (19,961 | ) | (20,838 | ) |
Note C—Preferred Stock
As of December 31, 2018, Torchmark had 351 thousand shares of Cumulative Preferred Stock, Series A, issued and outstanding, of which 280 thousand shares were 6.50% Cumulative Preferred Stock, Series A, and 71 thousand shares were 7.15% Cumulative Preferred Stock, Series A (collectively, the “Series A Preferred Stock”). All issued and outstanding shares of Series A Preferred Stock were held by wholly-owned insurance subsidiaries. In the event of liquidation, the holders of the Series A Preferred Stock at the time outstanding would be entitled to receive a liquidating distribution out of the assets legally available to stockholders in the amount of $1 thousand per share or $351 million in the aggregate, plus any accrued and unpaid dividends, before any distribution is made to holders of Torchmark common stock. Holders of Series A Preferred Stock do not have any voting rights nor have rights to convert such shares into shares of any other class of Torchmark capital stock.
See accompanying Report of Independent Registered Public Accounting Firm.
TMK 2018 FORM 10-K
TORCHMARK CORPORATION
SCHEDULE IV. REINSURANCE (CONSOLIDATED)
(Dollar Amounts in thousands)
| Gross Amount | Ceded to Other Companies(1) | Assumed from Other Companies | Net Amount | Percentage of Amount Assumed to Net | |||||||||||||
| For the Year Ended December 31, 2018 | |||||||||||||||||
| Life insurance in force | $ | 185,212,195 | $ | 688,384 | $ | 3,019,737 | $ | 187,543,548 | 1.6 | ||||||||
| Premiums(2): | |||||||||||||||||
| Life insurance | $ | 2,373,423 | $ | 4,581 | $ | 21,305 | $ | 2,390,147 | 0.9 | ||||||||
| Health insurance | 1,019,007 | 3,668 | — | 1,015,339 | — | ||||||||||||
| Total premium | $ | 3,392,430 | $ | 8,249 | $ | 21,305 | $ | 3,405,486 | 0.6 | ||||||||
| For the Year Ended December 31, 2017 | |||||||||||||||||
| Life insurance in force | $ | 179,902,605 | $ | 705,152 | $ | 3,211,423 | $ | 182,408,876 | 1.8 | ||||||||
| Premiums(2): | |||||||||||||||||
| Life insurance | $ | 2,272,038 | $ | 4,437 | $ | 21,912 | $ | 2,289,513 | 1.0 | ||||||||
| Health insurance | 980,082 | 3,709 | — | 976,373 | — | ||||||||||||
| Total premium | $ | 3,252,120 | $ | 8,146 | $ | 21,912 | $ | 3,265,886 | 0.7 | ||||||||
| For the Year Ended December 31, 2016 | |||||||||||||||||
| Life insurance in force | $ | 174,314,897 | $ | 725,867 | $ | 3,352,113 | $ | 176,941,143 | 1.9 | ||||||||
| Premiums(2): | |||||||||||||||||
| Life insurance | $ | 2,152,698 | $ | 4,507 | $ | 22,915 | $ | 2,171,106 | 1.1 | ||||||||
| Health insurance | 951,137 | 3,474 | — | 947,663 | — | ||||||||||||
| Total premium | $ | 3,103,835 | $ | 7,981 | $ | 22,915 | $ | 3,118,769 | 0.7 |
| (1) | No amounts have been netted against ceded premium. |
| (2) | Excludes policy charges of $16.4 million, $17.0 million, and $18.3 million in each of the years 2018, 2017, and 2016, respectively. |
TMK 2018 FORM 10-K
See accompanying Report of Independent Registered Public Accounting Firm.
TMK 2018 FORM 10-K
SIGNATURES
Pursuant to the requirements of Section 12 or 15(d) of the Securities Act of 1934, the registrant has duly caused this report to be signed on its behalf by the undersigned, thereunto duly authorized.
| TORCHMARK CORPORATION | |||
| By: | /s/ GARY L. COLEMAN | ||
| Gary L. Coleman | |||
| Co-Chairman and Chief Executive Officer and Director | |||
| By: | /s/ LARRY M. HUTCHISON | ||
| Larry M. Hutchison | |||
| Co-Chairman and Chief Executive Officer and Director | |||
| By: | /s/ FRANK M. SVOBODA | ||
| Frank M. Svoboda | |||
| Executive Vice President and Chief Financial Officer | |||
| By: | /s/ M. SHANE HENRIE | ||
| M. Shane Henrie | |||
| Vice President and Chief Accounting Officer |
Date: February 28, 2019
Pursuant to the requirements of the Securities Exchange Act of 1934, this report has been signed below by the following persons on behalf of the registrant and in the capacities and on the dates indicated.
| By: | /s/ CHARLES E. ADAIR * | By: | /s/ ROBERT W. INGRAM * | |
| Charles E. Adair | Robert W. Ingram | |||
| Director | Director | |||
| By: | /s/ LINDA L. ADDISON * | By: | /s/ STEVEN P. JOHNSON * | |
| Linda L. Addison | Steven P. Johnson | |||
| Director | Director | |||
| By: | /s/ MARILYN A. ALEXANDER * | By: | /s/ DARREN M. REBELEZ * | |
| Marilyn A. Alexander | Darren M. Rebelez | |||
| Director | Director | |||
| By: | /s/ CHERYL D. ALSTON * | By: | /s/ LAMAR C. SMITH * | |
| Cheryl D. Alston | Lamar C. Smith | |||
| Director | Director | |||
| By: | /s/ DAVID L. BOREN * | By: | /s/ MARY E. THIGPEN * | |
| David L. Boren | Mary E. Thigpen | |||
| Director | Director | |||
| By: | /s/ JANE M. BUCHAN * | By: | /s/ PAUL J. ZUCCONI * | |
| Jane M. Buchan | Paul J. Zucconi | |||
| Director | Director |
| Date: February 28, 2019 | ||
| *By: | /s/ FRANK M. SVOBODA | |
| Frank M. Svoboda | ||
| Attorney-in-fact |
TMK 2018 FORM 10-K