 filings.tools
Item 7. Management's Discussion and Analysis of Financial Condition and Results of Operations
159K characters. Original on sec.gov · Markdown
Item 7. Management's Discussion and Analysis of Financial Condition and Results of Operations
The following discussion should be read in conjunction with Globe Life's Consolidated Financial Statements and Notes thereto appearing elsewhere in this report.
"Globe Life" and the "Company" refer to Globe Life and its subsidiaries and affiliates.
Results of Operations
 | How Globe Life Views Its Operations. Globe Life Inc. is the holding company for a group of insurance companies that market primarily individual life and supplemental health insurance to lower middle to middle income households throughout the United States. We view our operations by segments, which are the insurance product lines of life, supplemental health, and annuities, and the investment segment that supports the product lines. Segments are aligned based on their common characteristics, comparability of the profit margins, and management techniques used to operate each segment. | |||||||
 | Insurance Product Line Segments. The insurance product line segments involve the marketing, underwriting, and administration of policies. Each product line is further segmented by the various distribution channels that market the insurance policies. Each distribution channel operates in a niche market offering insurance products designed for that particular market. Whether analyzing profitability of a segment as a whole, or the individual distribution channels within the segment, the measure of profitability used by management is the underwriting margin, as seen below: | |||||||
| Premium revenue (Policy obligations) (Policy acquisition costs and commissions) Underwriting margin | ||||||||
 | Investment Segment. The investment segment involves the management of our capital resources, including investments and the management of corporate debt and liquidity. Our measure of profitability for the investment segment is excess investment income, as seen below: | |||||||
| Net investment income (Required interest on net policy liabilities) (Financing costs) Excess investment income |
The following discussion in Management's Discussion & Analysis will only reflect current year to prior year. For reference to 2017 results, refer to 2018 form 10-K. Any material comparisons will be discussed.
GL 2019 FORM 10-K
GLOBE LIFE INC.
Management's Discussion & Analysis
Current Highlights, comparing 2019 with 2018.
-
Net income as a return on equity ("ROE") was 11.6% and net operating income as an ROE, excluding net unrealized gains on the fixed maturity portfolio(1) was 14.5%.
-
Total premium increased 5% over the same period in the prior year. Life premium increased 5% for the period from $2.4 billion in 2018 to $2.5 billion in 2019. Life underwriting margin increased 8% from $652 million in 2018 to $703 million in 2019.
-
Net investment income increased 3% over the same period in the prior year. In addition, excess investment income increased 5% over the prior year.
-
Total net sales increased 6% over the same period in the prior year from $584 million to $621 million.
-
Book value per share increased 37% over the same period in the prior year from $48.11 to $66.02. Book value per share, excluding net unrealized gains on the fixed maturity portfolio(1), increased 9% over the prior year from $44.32 to $48.26.
-
In 2019, the Company repurchased 3.9 million Globe Life Inc. common shares at a total cost of $350 million for an average share price of $89.04.
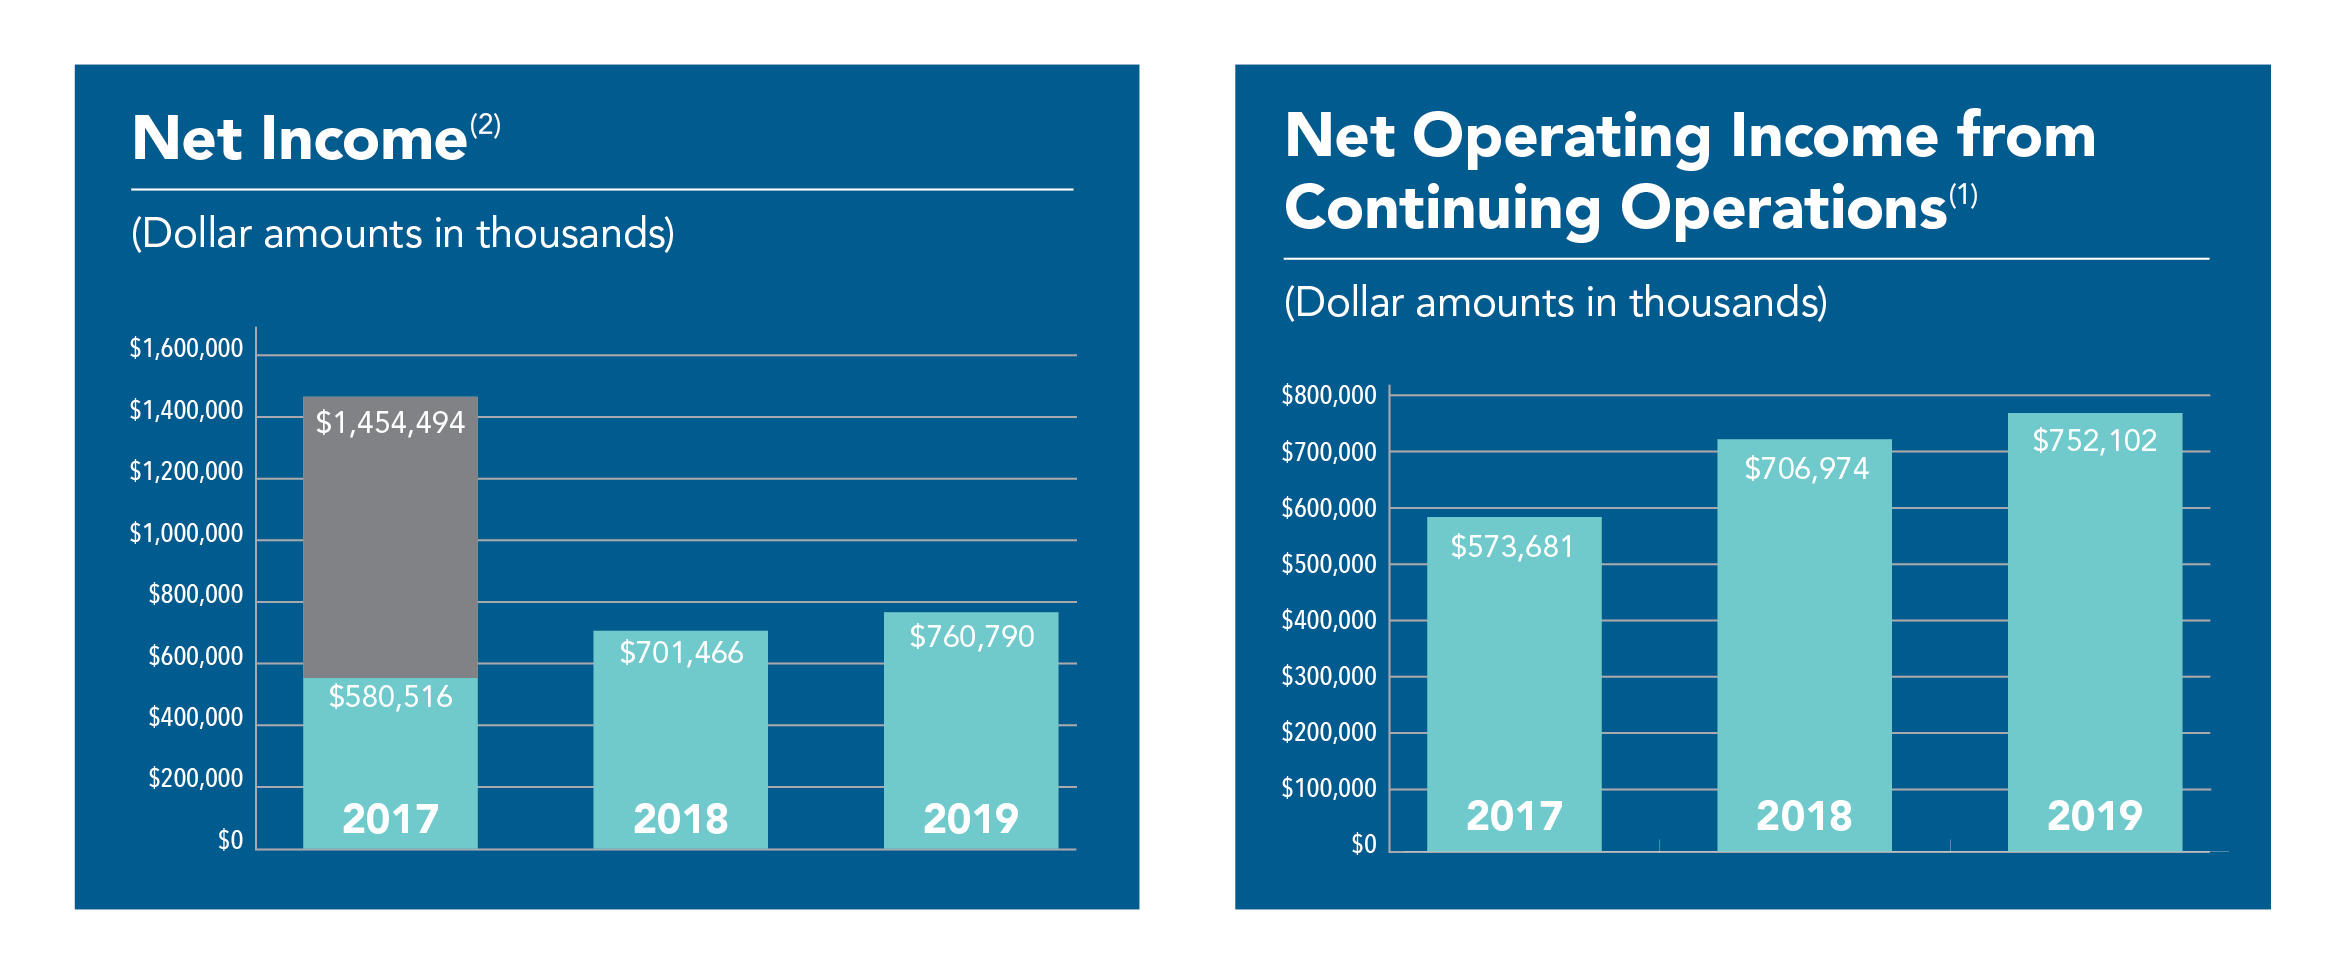
The following graphs represent net income and net operating income from continuing operations for the three years ended December 31, 2019.
(1)Net operating income is the consolidated total of segment profits after tax and as such is considered a non-GAAP measure. It has been used consistently by Globe Life's management for many years to evaluate the operating performance of the Company. It differs from net income primarily because it excludes certain non-operating items such as realized gains and losses and certain significant and unusual items included in net income. Net income is the most directly comparable GAAP measure.
Net operating income as an ROE, excluding net unrealized gains on the fixed maturity portfolio, is considered a non-GAAP measure. Management utilizes this measure to view the business without the effect of the net unrealized gains, which are primarily attributable to fluctuation in interest rates on the available-for-sale portfolio. The impact of the adjustment to exclude net unrealized gains on fixed maturities is $2.0 billion and $426 million for 2019 and 2018, respectively.
Book value per share, excluding net unrealized gains on the fixed maturity portfolio, is also considered a non-GAAP measure. Management utilizes this measure to view the book value of the business without the effect of net unrealized gains, which are primarily attributable to fluctuation in interest rates on the available for sale portfolio. The impact of the adjustment to exclude net unrealized gains on fixed maturities is $17.76 and $3.79 for 2019 and 2018, respectively.
(2)In 2017, tax legislation revised the corporate income tax rate from 35% to 21% effective January 1, 2018. As such, the Company recorded an adjustment of $874 million to net income in 2017.
GL 2019 FORM 10-K
GLOBE LIFE INC.
Management's Discussion & Analysis
Summary of Operations. Net income increased 8% to $761 million in 2019, compared with $701 million in 2018. This increase was primarily related to favorable underwriting income**.** On a diluted per common share basis, net income per common share for 2019 increased 12% from $6.09 to $6.83. The percentage growth in net income per share continues to exceed the growth in dollar amounts due to our share repurchase program. Included in net income were after-tax realized gains of $16 million in 2019, compared with realized after-tax losses of $1 million for 2018. Realized gains and losses are presented more fully under the caption Realized Gains and Losses in this report.
Net operating income from continuing operations increased 6% to $752 million in 2019, compared with $707 million in 2018. On a diluted per common share basis, net operating income per common share increased 10% from $6.13 to $6.75. Net operating income is the consolidated total of segment profits after tax and as such is considered a non-GAAP measure. Net income is the most directly comparable GAAP measure. We do not consider realized gains and losses to be a component of our core insurance operations or operating segments. Additionally, net income was affected by certain significant and unusual non-operating items in 2018 and 2019. We do not view these items as components of core operating results because they are not indicative of past performance or future prospects of the insurance operations. We remove items such as these that relate to prior periods or are non-operating items when evaluating the results of current operations, and therefore exclude such items from our segment analysis for current periods.
Globe Life's operations on a segment-by-segment basis are discussed in depth under the appropriate captions following in this report.
Analysis of Profitability by Segment
(Dollar amounts in thousands)
| 2019 | 2018 | 2017 | 2019 Change | % | 2018 Change | % | |||||||||||||||||||||||||||||||||||
| Life insurance underwriting margin | $ | 703,464 | $ | 652,301 | $ | 604,337 | $ | 51,163 | 8 | $ | 47,964 | 8 | |||||||||||||||||||||||||||||
| Health insurance underwriting margin | 243,638 | 236,053 | 219,508 | 7,585 | 3 | 16,545 | 8 | ||||||||||||||||||||||||||||||||||
| Annuity underwriting margin | 9,458 | 10,376 | 10,562 | (918) | (9) | (186) | (2) | ||||||||||||||||||||||||||||||||||
| Excess investment income | 257,605 | 245,094 | 239,363 | 12,511 | 5 | 5,731 | 2 | ||||||||||||||||||||||||||||||||||
| Other insurance: | |||||||||||||||||||||||||||||||||||||||||
| Other income | 1,318 | 1,236 | 1,270 | 82 | 7 | (34) | (3) | ||||||||||||||||||||||||||||||||||
| Administrative expense | (240,321) | (223,941) | (210,590) | (16,380) | 7 | (13,351) | 6 | ||||||||||||||||||||||||||||||||||
| Corporate and other | (55,103) | (50,476) | (43,285) | (4,627) | 9 | (7,191) | 17 | ||||||||||||||||||||||||||||||||||
| Pre-tax total | 920,059 | 870,643 | 821,165 | 49,416 | 6 | 49,478 | 6 | ||||||||||||||||||||||||||||||||||
| Applicable taxes | (167,957) | (163,669) | (247,484) | (4,288) | 3 | 83,815 | (34) | ||||||||||||||||||||||||||||||||||
| Net operating income | 752,102 | 706,974 | 573,681 | 45,128 | 6 | 133,293 | 23 | ||||||||||||||||||||||||||||||||||
| Reconciling items, net of tax: | |||||||||||||||||||||||||||||||||||||||||
| Realized gain (loss)—investments | 16,291 | 7,327 | 20,217 | 8,964 | (12,890) | ||||||||||||||||||||||||||||||||||||
| Realized loss—redemption of debt | — | (8,752) | (2,627) | 8,752 | (6,125) | ||||||||||||||||||||||||||||||||||||
| Part D adjustments—discontinued operations | (92) | (44) | (3,769) | (48) | 3,725 | ||||||||||||||||||||||||||||||||||||
| Administrative settlements | (400) | (3,590) | (5,628) | 3,190 | 2,038 | ||||||||||||||||||||||||||||||||||||
| Non-operating fees | (508) | (1,247) | (187) | 739 | (1,060) | ||||||||||||||||||||||||||||||||||||
| Legal proceedings | (6,603) | — | — | (6,603) | — | ||||||||||||||||||||||||||||||||||||
| Guaranty fund assessments | — | — | (1,171) | — | 1,171 | ||||||||||||||||||||||||||||||||||||
| Tax reform adjustment | — | 798 | 873,978 | (798) | (873,180) | ||||||||||||||||||||||||||||||||||||
| Net income | $ | 760,790 | $ | 701,466 | $ | 1,454,494 | $ | 59,324 | 8 | $ | (753,028) | (52) |
The life insurance segment is our primary segment and is the largest contributor to earnings in each year presented. This segment contributed $51 million in 2019 and $48 million in 2018 to the growth in our underwriting margin. The health segment also contributed to growth in income in both years contributing $8 million of additional margin in 2019 and $17 million in 2018.
GL 2019 FORM 10-K
GLOBE LIFE INC.
Management's Discussion & Analysis
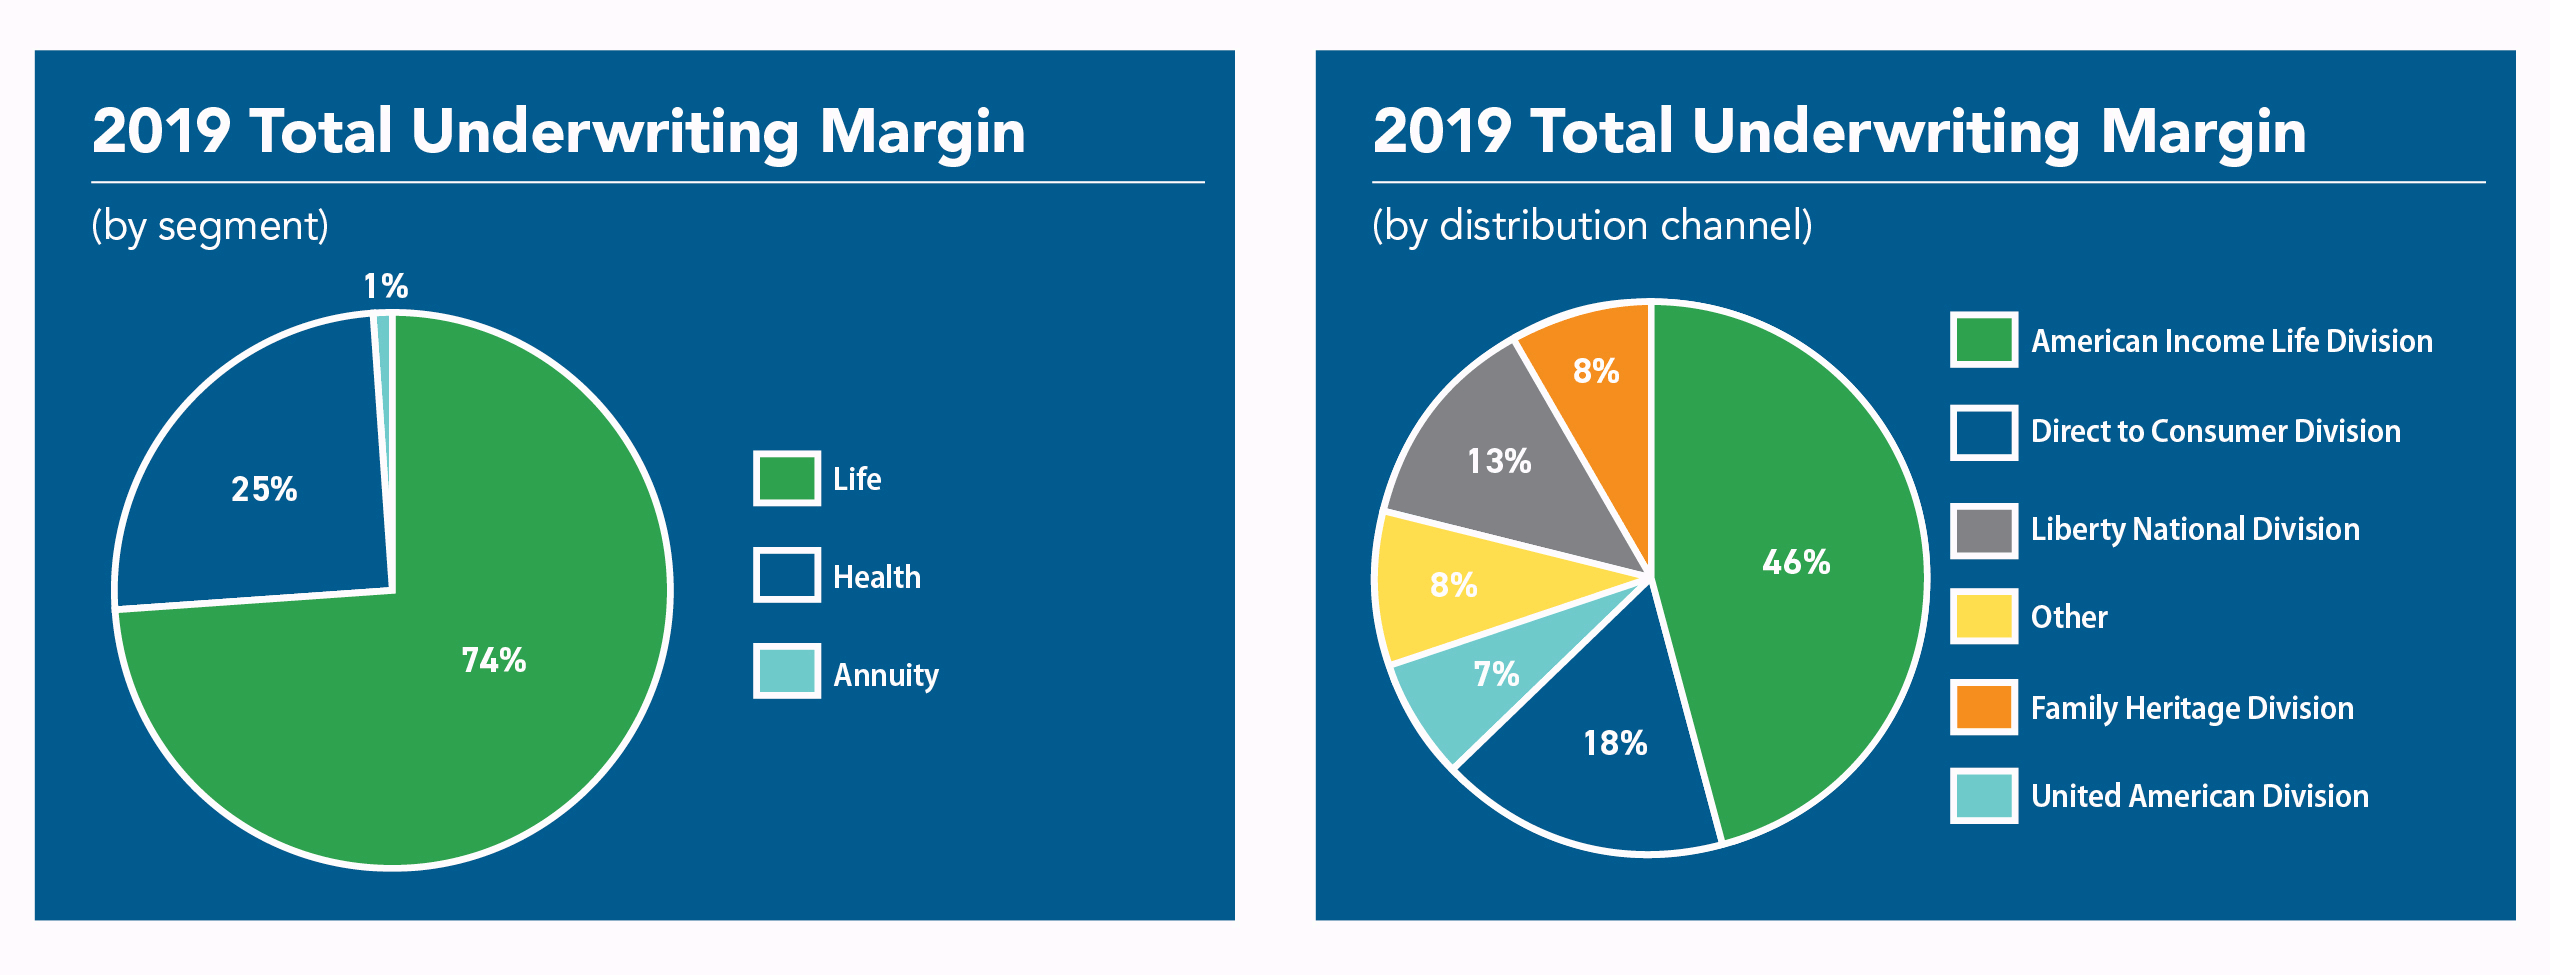
In 2019, the largest contributor of total underwriting margin was the life insurance segment and the primary distribution channel was American Income Life Division. The following tables represent the breakdown of total underwriting margin by operating segment and distribution channel for the year ended December 31, 2019.
Total premium income rose 5% for the year ended December 31, 2019 to $3.6 billion. Total net sales increased 6% to $621 million, when compared with the same period in 2018. Total first-year collected premium was $492 million for the 2019 period, compared with $468 million for the 2018 period.
Life insurance premium income increased 5% to $2.5 billion over the prior year total of $2.4 billion. Life net sales rose 4% to $430 million for the year of 2019. First-year collected life premium rose 3% to $329 million. Life underwriting margins, as a percent of premium, increased to 28% in 2019 from 27% in the prior year. Underwriting margin increased to $703 million for the year ended December 31, 2019, 8% over the same period in 2018.
Health insurance premium income increased 6% to $1.1 billion over the prior year total of $1.0 billion. Health net sales rose 11% to $191 million for the year of 2019. First-year collected health premium rose 10% to $163 million. Health underwriting margins, as a percent of premium, were 23% in both periods. Underwriting margin increased to $244 million for the year of 2019, 3% over the same period in 2018.
Excess investment income, the measure of profitability of our investment segment, increased 5% during the year of 2019 to $258 million from $245 million in the same period in 2018. Excess investment income per common share, reflecting the impact of our share repurchase program, increased 8% to $2.31 from $2.13 in the same period last year.
Insurance administrative expenses increased 7.3% in 2019 when compared with the prior year period. These expenses were 6.7% as a percentage of premium during the year of 2019 compared with 6.5% a year earlier. The increase in administrative expenses was primarily due to an increase in investments in information technology.
For the twelve months ended December 31, 2019, the Company repurchased 3.9 million shares at a total cost of $350 million for an average share price of $89.04.
GL 2019 FORM 10-K
GLOBE LIFE INC.
Management's Discussion & Analysis
A discussion of each of Globe Life's segments follows. The following discussions are presented in the manner we view our operations, as described in Note 14—Business Segments.
We use three statistical measures as indicators of premium growth and sales over the near term: “annualized premium in force,” “net sales,” and “first-year collected premium.”
-
Annualized premium in force is defined as the premium income that would be received over the following twelve months at any given date on all active policies if those policies remain in force throughout the twelve-month period. Annualized premium in force is an indicator of potential growth in premium revenue.
-
Net sales is annualized premium issued (gross premium that would be received during the policies' first year in force and assuming that none of the policies lapsed or terminated), net of cancellations in the first thirty days after issue, except in the case of our Direct to Consumer Division, where net sales is annualized premium issued at the time the first full premium is paid after any introductory offer period has expired. We believe that net sales is a better indicator of the rate of premium growth as compared with annualized premium issued.
-
First-year collected premium is defined as the premium collected during the reporting period for all policies in their first policy year. First-year collected premium takes lapses into account in the first year when lapses are more likely to occur, and thus is a useful indicator of how much new premium is expected to be added to premium income in the future.
LIFE INSURANCE
Life insurance is the Company's predominant segment, with 2019 life premium representing 70% of total premium and life underwriting margin representing 74% of the total. Additionally, investments supporting the reserves for life products produce the majority of excess investment income attributable to the investment segment.
The following table presents the summary of results of life insurance. Further discussion of the results by distribution channel is included below.
Life Insurance
Summary of Results
(Dollar amounts in thousands)
| 2019 | 2018 | 2017 | |||||||||||||||||||||||||||||||||||||||||||||||||||
| Amount | % of Premium | Amount | % of Premium | Amount | % of Premium | ||||||||||||||||||||||||||||||||||||||||||||||||
| Premium and policy charges | $ | 2,517,784 | 100 | $ | 2,406,555 | 100 | $ | 2,306,547 | 100 | ||||||||||||||||||||||||||||||||||||||||||||
| Policy obligations | 1,638,053 | 65 | 1,591,790 | 66 | 1,549,602 | 67 | |||||||||||||||||||||||||||||||||||||||||||||||
| Required interest on reserves | (666,168) | (26) | (636,040) | (26) | (607,007) | (26) | |||||||||||||||||||||||||||||||||||||||||||||||
| Net policy obligations | 971,885 | 39 | 955,750 | 40 | 942,595 | 41 | |||||||||||||||||||||||||||||||||||||||||||||||
| Commissions, premium taxes, and non-deferred acquisition expenses | 203,052 | 8 | 190,007 | 8 | 177,111 | 8 | |||||||||||||||||||||||||||||||||||||||||||||||
| Amortization of acquisition costs | 639,383 | 25 | 608,497 | 25 | 582,504 | 25 | |||||||||||||||||||||||||||||||||||||||||||||||
| Total expense | 1,814,320 | 72 | 1,754,254 | 73 | 1,702,210 | 74 | |||||||||||||||||||||||||||||||||||||||||||||||
| Insurance underwriting margin | $ | 703,464 | 28 | $ | 652,301 | 27 | $ | 604,337 | 26 |
GL 2019 FORM 10-K
GLOBE LIFE INC.
Management's Discussion & Analysis
Life insurance products are marketed through several distribution channels. Premium income by distribution channel for each of the last three years is as follows:
Life Insurance
Premium by Distribution Channel
(Dollar amounts in thousands)
| 2019 | 2018 | 2017 | |||||||||||||||||||||||||||||||||||||||||||||||||||
| Amount | % of Total | Amount | % of Total | Amount | % of Total | ||||||||||||||||||||||||||||||||||||||||||||||||
| American Income | $ | 1,160,495 | 46 | $ | 1,081,333 | 45 | $ | 999,279 | 43 | ||||||||||||||||||||||||||||||||||||||||||||
| Direct to Consumer | 855,543 | 34 | 828,935 | 34 | 812,907 | 35 | |||||||||||||||||||||||||||||||||||||||||||||||
| Liberty National | 285,551 | 11 | 278,878 | 12 | 274,635 | 12 | |||||||||||||||||||||||||||||||||||||||||||||||
| Other | 216,195 | 9 | 217,409 | 9 | 219,726 | 10 | |||||||||||||||||||||||||||||||||||||||||||||||
| Total | $ | 2,517,784 | 100 | $ | 2,406,555 | 100 | $ | 2,306,547 | 100 |
Annualized life premium in force was $2.6 billion at December 31, 2019, an increase of 5% over $2.5 billion a year earlier.
The following table shows net sales information for each of the last three years by distribution channel.
Life Insurance
Net Sales by Distribution Channel
(Dollar amounts in thousands)
| 2019 | 2018 | 2017 | |||||||||||||||||||||||||||||||||||||||||||||||||||
| Amount | % of Total | Amount | % of Total | Amount | % of Total | ||||||||||||||||||||||||||||||||||||||||||||||||
| American Income | $ | 237,587 | 55 | $ | 223,924 | 54 | $ | 223,259 | 54 | ||||||||||||||||||||||||||||||||||||||||||||
| Direct to Consumer | 126,208 | 29 | 126,133 | 31 | 135,704 | 33 | |||||||||||||||||||||||||||||||||||||||||||||||
| Liberty National | 53,718 | 13 | 49,173 | 12 | 46,886 | 11 | |||||||||||||||||||||||||||||||||||||||||||||||
| Other | 12,301 | 3 | 13,293 | 3 | 10,233 | 2 | |||||||||||||||||||||||||||||||||||||||||||||||
| Total | $ | 429,814 | 100 | $ | 412,523 | 100 | $ | 416,082 | 100 |
The table below discloses first-year collected life premium by distribution channel.
Life Insurance
First-Year Collected Premium by Distribution Channel
(Dollar amounts in thousands)
| 2019 | 2018 | 2017 | |||||||||||||||||||||||||||||||||||||||||||||||||||
| Amount | % of Total | Amount | % of Total | Amount | % of Total | ||||||||||||||||||||||||||||||||||||||||||||||||
| American Income | $ | 195,225 | 59 | $ | 190,680 | 60 | $ | 182,538 | 58 | ||||||||||||||||||||||||||||||||||||||||||||
| Direct to Consumer | 82,615 | 25 | 82,432 | 26 | 92,057 | 29 | |||||||||||||||||||||||||||||||||||||||||||||||
| Liberty National | 39,840 | 12 | 36,463 | 11 | 33,191 | 10 | |||||||||||||||||||||||||||||||||||||||||||||||
| Other | 11,564 | 4 | 10,342 | 3 | 9,633 | 3 | |||||||||||||||||||||||||||||||||||||||||||||||
| Total | $ | 329,244 | 100 | $ | 319,917 | 100 | $ | 317,419 | 100 |
GL 2019 FORM 10-K
GLOBE LIFE INC.
Management's Discussion & Analysis
The table below discloses average life exclusive producing agents by distribution channel.
Life Insurance
Average Producing Agent by Distribution Channel(1)
| 2019 | 2018 | 2017 | 2019 Change | % | 2018 Change | % | |||||||||||||||||||||||||||||||||||
| American Income | 7,360 | 6,971 | 6,962 | 389 | 6 | 9 | — | ||||||||||||||||||||||||||||||||||
| Liberty National | 2,350 | 2,156 | 2,017 | 194 | 9 | 139 | 7 |
(1)The average producing agent count is based on the actual count at the end of each week during the year.
A discussion of life operations by distribution channel follows.
The American Income Life Division markets to members of labor unions and continues to diversify its lead sources by building relationships with other affinity groups, utilizing third-party internet vendor leads and obtaining referrals to ensure sustainable growth. This division is Globe Life's largest contributor to life premium of any distribution channel at 46% of the Company's 2019 total. Net sales increased to $238 million in 2019 over the 2018 total of $224 million. Sales growth in our exclusive agencies is generally dependent on growth in the size of the agency force.
American Income continues to focus on growing and strengthening the agency force, specifically through additional agency office openings and focus on middle-management growth. In addition to offering financial incentives and training opportunities, the agency has made considerable investments in information technology, including launching a lead mapping and customer relationship management tool for the agency force. We anticipate this tool will help enhance agent productivity and agent retention.
The Direct to Consumer Division offers adult and juvenile life insurance through a variety of marketing approaches, including direct mailings, insert media, and electronic media. In recent years, electronic media production has grown rapidly as management has aggressively increased marketing activities related to internet and mobile technology, and has focused on driving traffic to our inbound call center. The different approaches support and complement one another in the division's efforts to reach the consumer. The Direct to Consumer Division's long-term growth has been fueled by constant innovation and name recognition. We continually introduce new initiatives in this division in an attempt to increase response rates.
While the juvenile market is an important source of sales, it also is a vehicle to reach the parents and grandparents of juvenile policyholders, who are more likely to respond favorably to a Direct to Consumer solicitation for life coverage on themselves than is the general adult population. Also, both juvenile policyholders and their parents are low acquisition-cost targets for sales of additional coverage over time. The underwriting margin, as a percent of premium, was 18% for the two years ended 2019.
The Liberty National Division markets individual life insurance to middle-income household and worksite customers. Recent investments in new sales technologies as well as recent growth in middle management within the agency will help continue this growth. The underwriting margin as a percent of premium was 26%, up from 24% for the year ended 2018. The increase is primarily attributable to higher than normal policy obligations during 2018 compared with lower policy obligations during the same period in 2019.
The Liberty National Division average producing agent count increased 9% in 2019. We continue to execute our long term plan to grow this agency through expansion from small-town markets in the Southeast to more densely populated areas with larger pools of potential agent recruits and customers. Continued expansion of this agency’s presence into more heavily populated, less-penetrated areas will help create long-term agency growth. Additionally, the agency continues to help improve the ability of agents to develop new worksite marketing business. Systems that have been put in place, including the addition of a customer relationship management (CRM) platform and enhanced analytical capabilities, have helped the agents develop additional worksite marketing opportunities as well improve the productivity of agents selling in the individual market.
GL 2019 FORM 10-K
GLOBE LIFE INC.
Management's Discussion & Analysis
The Other distribution channels offering life insurance include the Military Agency, the United American Division (which predominantly writes health insurance), and various smaller distribution channels. The Other channels contributed $216 million of life premium income, or 9% of Globe Life's total in 2019, but contributed only 3% of net sales for the year.
HEALTH INSURANCE
Health insurance sold by the Company includes primarily Medicare Supplement insurance, accident coverage, and other limited-benefit supplemental health products including cancer, critical illness, heart, and intensive care coverage.
Health premium accounted for 30% of our total premium in 2019, while the health underwriting margin accounted for 25% of total underwriting margin, reflective of the lower underwriting margin as a percent of premium for health compared with life insurance. As noted under the caption Life Insurance, the Company has emphasized life insurance sales relative to health due to life’s superior profitability and its greater contribution to excess investment income.
The following table presents underwriting margin data for health insurance.
Health Insurance
Summary of Results
(Dollar amounts in thousands)
| 2019 | 2018 | 2017 | |||||||||||||||||||||||||||||||||||||||||||||||||||
| Amount | % of Premium | Amount | % of Premium | Amount | % of Premium | ||||||||||||||||||||||||||||||||||||||||||||||||
| Premium and policy charges | $ | 1,077,346 | 100 | $ | 1,015,339 | 100 | $ | 976,373 | 100 | ||||||||||||||||||||||||||||||||||||||||||||
| Policy obligations | 687,764 | 64 | 649,188 | 64 | 628,640 | 65 | |||||||||||||||||||||||||||||||||||||||||||||||
| Required interest on reserves | (87,289) | (8) | (83,243) | (8) | (77,792) | (8) | |||||||||||||||||||||||||||||||||||||||||||||||
| Net policy obligations | 600,475 | 56 | 565,945 | 56 | 550,848 | 57 | |||||||||||||||||||||||||||||||||||||||||||||||
| Commissions, premium taxes, and non-deferred acquisition expenses | 94,973 | 8 | 88,553 | 9 | 86,044 | 9 | |||||||||||||||||||||||||||||||||||||||||||||||
| Amortization of acquisition costs | 138,260 | 13 | 124,788 | 12 | 119,973 | 12 | |||||||||||||||||||||||||||||||||||||||||||||||
| Total expense | 833,708 | 77 | 779,286 | 77 | 756,865 | 78 | |||||||||||||||||||||||||||||||||||||||||||||||
| Insurance underwriting margin | $ | 243,638 | 23 | $ | 236,053 | 23 | $ | 219,508 | 22 |
Health premium increased 6% from $1.02 billion in 2018 to $1.08 billion in 2019. Health underwriting margin increased 3% from $236 million in 2018 to $244 million in 2019. Further discussion is included below by distribution channel.
We market supplemental health insurance products through a number of distribution channels. The following table is an analysis of our health premium by distribution channel for each of the last three years.
GL 2019 FORM 10-K
GLOBE LIFE INC.
Management's Discussion & Analysis
Health Insurance
Premium by Distribution Channel
(Dollar amounts in thousands)
| 2019 | 2018 | 2017 | |||||||||||||||||||||||||||||||||||||||||||||||||||
| Amount | % of Total | Amount | % of Total | Amount | % of Total | ||||||||||||||||||||||||||||||||||||||||||||||||
| United American | $ | 416,582 | 39 | $ | 381,076 | 38 | $ | 364,128 | 37 | ||||||||||||||||||||||||||||||||||||||||||||
| Family Heritage | 294,182 | 27 | 273,275 | 27 | 253,534 | 26 | |||||||||||||||||||||||||||||||||||||||||||||||
| Liberty National | 189,578 | 18 | 191,378 | 19 | 196,207 | 20 | |||||||||||||||||||||||||||||||||||||||||||||||
| American Income | 99,447 | 9 | 93,313 | 9 | 89,036 | 9 | |||||||||||||||||||||||||||||||||||||||||||||||
| Direct to Consumer | 77,557 | 7 | 76,297 | 7 | 73,468 | 8 | |||||||||||||||||||||||||||||||||||||||||||||||
| Total | $ | 1,077,346 | 100 | $ | 1,015,339 | 100 | $ | 976,373 | 100 |
Of total health premium ($1.1 billion), premium from limited-benefit plans comprise $556 million, or 52% of the total, for 2019 compared with $525 million in the prior year. Premium from Medicare Supplement products comprises the remaining 48% or $521 million for 2019 compared with $490 million in 2018. Annualized health premium in force was $1.14 billion at December 31, 2019, an increase of 6% over the prior year balance of $1.07 billion.
Presented below is a table of health net sales by distribution channel for the last three years.
Health Insurance
Net Sales by Distribution Channel
(Dollar amounts in thousands)
| 2019 | 2018 | 2017 | |||||||||||||||||||||||||||||||||||||||||||||||||||
| Amount | % of Total | Amount | % of Total | Amount | % of Total | ||||||||||||||||||||||||||||||||||||||||||||||||
| United American | $ | 79,218 | 41 | $ | 69,967 | 41 | $ | 61,170 | 39 | ||||||||||||||||||||||||||||||||||||||||||||
| Family Heritage | 65,626 | 34 | 60,268 | 35 | 56,534 | 36 | |||||||||||||||||||||||||||||||||||||||||||||||
| Liberty National | 24,504 | 13 | 22,098 | 13 | 20,407 | 13 | |||||||||||||||||||||||||||||||||||||||||||||||
| American Income | 18,059 | 10 | 14,432 | 8 | 13,943 | 9 | |||||||||||||||||||||||||||||||||||||||||||||||
| Direct to Consumer | 3,827 | 2 | 4,769 | 3 | 5,582 | 3 | |||||||||||||||||||||||||||||||||||||||||||||||
| Total | $ | 191,234 | 100 | $ | 171,534 | 100 | $ | 157,636 | 100 |
Of total net sales ($191 million), sales of limited-benefit plans comprise $108 million, or 57% of the total, for 2019 compared with $98 million in 2018. Medicare Supplement sales make up the remaining 43%, or $83 million for 2019 compared with $74 million in 2018.
GL 2019 FORM 10-K
GLOBE LIFE INC.
Management's Discussion & Analysis
The following table discloses first-year collected health premium by distribution channel.
Health Insurance
First-Year Collected Premium by Distribution Channel
(Dollar amounts in thousands)
| 2019 | 2018 | 2017 | |||||||||||||||||||||||||||||||||||||||||||||||||||
| Amount | % of Total | Amount | % of Total | Amount | % of Total | ||||||||||||||||||||||||||||||||||||||||||||||||
| United American | $ | 72,021 | 44 | $ | 62,720 | 42 | $ | 54,851 | 40 | ||||||||||||||||||||||||||||||||||||||||||||
| Family Heritage | 50,204 | 31 | 47,422 | 32 | 44,535 | 33 | |||||||||||||||||||||||||||||||||||||||||||||||
| Liberty National | 19,698 | 12 | 17,809 | 12 | 16,427 | 12 | |||||||||||||||||||||||||||||||||||||||||||||||
| American Income | 17,142 | 11 | 15,249 | 10 | 14,673 | 11 | |||||||||||||||||||||||||||||||||||||||||||||||
| Direct to Consumer | 3,749 | 2 | 5,111 | 4 | 5,657 | 4 | |||||||||||||||||||||||||||||||||||||||||||||||
| Total | $ | 162,814 | 100 | $ | 148,311 | 100 | $ | 136,143 | 100 |
First-year premium related to limited-benefit plans comprise $88 million, or 54% of total first-year collected premium, for 2019 compared with $81 million in 2018. First-year collected premium from Medicare Supplement policies make up the remaining 46%, or $75 million for 2019 compared with $67 million in 2018.
A discussion of health operations by distribution channel follows.
The United American Division consists of non-exclusive independent agencies who may also sell for other companies. The United American Division was Globe Life's largest health agency in terms of health premium income.
This division is also Globe Life's largest producer of Medicare Supplement insurance. The United American Division represents 78% of all Medicare Supplement premium and 95% of Medicare Supplement net sales. Medicare Supplement premium in this agency rose 10% to $406 million in 2019 over the prior period balance of $370 million. Underwriting margin as a percent of premium was 14%, down from 16% for the prior year. This decrease was primarily due to higher policy obligations and amortization of deferred acquisition costs as a percentage of premium in 2019 compared with 2018.
The Family Heritage Division primarily markets limited-benefit supplemental health insurance in non-urban areas. Most of its policies include a cash-back feature, such as a return of premium, where any excess of premiums over claims paid is returned to the policyholder at the end of a specified period stated within the insurance policy. Underwriting margin as a percent of premium was 25%, up from 24% for the year ended December 31, 2018. The increase was primarily attributable to favorable policy obligations in the current period compared with the prior year. A focused effort across the division for more consistent recruiting activity along with two targeted incentive programs in the second half of 2019 helped drive the 5% average producing agent count growth in 2019 as noted below.
| 2019 | 2018 | 2017 | 2019 Change | % | 2018 Change | % | |||||||||||||||||||||||||||||||||||
| Average producing agents | 1,112 | 1,064 | 995 | 48 | 5 | 69 | 7 |
The Liberty National Division represented 18% of all Globe Life health premium income at $190 million in 2019. Liberty National markets limited-benefit supplemental health products consisting primarily of critical illness insurance. Much of Liberty National’s health business is now generated through worksite marketing targeting small businesses of 10 to 100 employees. In 2019, health premium income declined 1%, primarily attributable to the runoff of a block of discontinued Medicare Supplement policies previously sold by the division. Liberty National's first-year collected premium increased 11% to $20 million in 2019 compared with $18 million in 2018, reflecting the steady increase in net sales of limited-benefit plans in the division.
GL 2019 FORM 10-K
GLOBE LIFE INC.
Management's Discussion & Analysis
The American Income Life Division and the Direct to Consumer Division also market health products, although their main emphasis is on life insurance. On a combined basis, they accounted for 16% of health premium in 2019 and 16% in 2018. The American Income Life Division primarily markets accident plans. The Direct to Consumer Division markets primarily Medicare Supplements to employer or union-sponsored groups, adding $4 million of Medicare Supplement net sales in 2019 and $5 million in 2018.
ANNUITIES
Our fixed annuity balances at the end of 2019 and 2018 were $1.10 billion and $1.18 billion, respectively. Underwriting margin was $9.5 million for 2019 and $10.4 million for 2018.
We do not currently market stand-alone fixed or deferred annuity products, favoring instead protection-oriented life and health insurance products. Therefore, we do not expect that annuities will be a significant portion of our business or marketing strategy going forward.
GL 2019 FORM 10-K
GLOBE LIFE INC.
Management's Discussion & Analysis
INVESTMENTS
We manage our capital resources including investments, debt, and cash flow through the investment segment. Excess investment income represents the profit margin attributable to investment operations and is the measure that we use to evaluate the performance of the investment segment as described in Note 14—Business Segments. It is defined as net investment income less both the required interest on net insurance policy liabilities and the interest cost associated with capital funding or “financing costs.”
Management also views excess investment income per diluted common share as an important and useful measure to evaluate the performance of the investment segment. It is defined as excess investment income divided by the total diluted weighted average shares outstanding, representing the contribution by the investment segment to the consolidated earnings per share of the Company. Since implementing our share repurchase program in 1986, we have used $7.8 billion of excess cash flow at the Parent Company to repurchase Globe Life Inc. common shares after determining that the repurchases provided a greater risk adjusted after-tax return than other investment alternatives. If we had not used this excess cash to repurchase shares, but had instead invested it in interest-bearing assets, we would have earned more investment income and had more shares outstanding. As excess investment income per diluted common share incorporates all capital resources, we view excess investment income per diluted share as a useful measure to evaluate the investment segment.
Excess Investment Income**.** The following table summarizes Globe Life's investment income, excess investment income, and excess investment income per diluted common share.
Analysis of Excess Investment Income
(Dollar amounts in thousands except for per share data)
| 2019 | 2018 | 2017 | |||||||||||||||
| Net investment income | $ | 910,459 | $ | 882,512 | $ | 847,885 | |||||||||||
| Interest on net insurance policy liabilities: | |||||||||||||||||
| Interest on reserves | (796,979) | (766,640) | (734,370) | ||||||||||||||
| Interest on deferred acquisition costs | 228,431 | 219,298 | 210,380 | ||||||||||||||
| Net required interest | (568,548) | (547,342) | (523,990) | ||||||||||||||
| Financing costs | (84,306) | (90,076) | (84,532) | ||||||||||||||
| Excess investment income | $ | 257,605 | $ | 245,094 | $ | 239,363 | |||||||||||
| Excess investment income per diluted share | $ | 2.31 | $ | 2.13 | $ | 2.01 | |||||||||||
| Mean invested assets (at amortized cost) | $ | 17,026,058 | $ | 16,249,161 | $ | 15,376,781 | |||||||||||
| Average net insurance policy liabilities(1) | 10,068,120 | 9,744,200 | 9,359,780 | ||||||||||||||
| Average debt and preferred securities (at amortized cost) | 1,650,081 | 1,650,138 | 1,458,706 |
(1)Net of deferred acquisition costs, excluding the associated unrealized gains and losses thereon.
Excess investment income increased $13 million or 5% during 2019. Excess investment income per diluted common share increased 8% during 2019. Excess investment income per diluted common share generally increases at a faster pace than excess investment income because the number of diluted shares outstanding generally decreases from year to year as a result of our share repurchase program.
GL 2019 FORM 10-K
GLOBE LIFE INC.
Management's Discussion & Analysis
Net investment income increased at a compound annual growth rate of 4% during the last three years. Growth in net investment income has been negatively impacted in recent years by the low interest rate environment during which time we have invested new money at yields lower than our average portfolio yield. In addition, we have reinvested the proceeds from bonds that matured or were called or otherwise disposed of at yield rates less than what we earned on these bonds before their maturity or disposition. We currently expect that the turnover rate of fixed maturity assets will be less than 3% in 2020 and the average annual turnover rate during the next five years will not exceed 1% to 1.5% of the portfolio. The following chart presents the growth in net investment income and the growth in mean invested assets.
| 2019 | 2018 | 2017 | |||||||||||||||
| Growth in net investment income | 3.2 | % | 4.1 | % | 5.1 | % | |||||||||||
| Growth in mean invested assets (at amortized cost) | 4.8 | % | 5.7 | % | 6.3 | % |
Should interest rates, especially long-term rates, rise, Globe Life's net investment income would benefit due to higher interest rates on new purchases. While such a rise in interest rates could adversely affect the fair value of the fixed maturities portfolio, we could withstand an increase in interest rates of approximately 115 to 120 basis points before the net unrealized gains on our fixed maturity portfolio as of December 31, 2019 would be eliminated. Should interest rates increase further than that, we would not be concerned with potential interest rate driven unrealized losses in our fixed maturity portfolio because we have the intent and the ability to hold our investments to maturity.
Required interest on net insurance policy liabilities reduces net investment income, as it is the amount of net investment income considered by management necessary to “fund” required interest on net insurance policy liabilities, which is the net of the benefit reserve liability and the deferred acquisition cost asset. As such, it is removed from the investment segment and applied to the insurance segments to offset the effect of the required interest from the insurance segments. As discussed in Note 14—Business Segments, management regards this as a more meaningful analysis of the investment and insurance segments. Required interest is based on the actuarial interest assumptions used in discounting the benefit reserve liability and the amortization of deferred acquisition costs for our insurance policies in force.
The great majority of our life and health insurance policies are fixed interest rate protection policies, not investment products, and are accounted for under current accounting guidance for long-duration insurance products which mandate that interest rate assumptions for a particular block of business be “locked in” for the life of that block of business. Each calendar year, we set the discount rate to be used to calculate the benefit reserve liability and the amortization of the deferred acquisition cost asset for all insurance policies issued that year. That rate is based on the new money yields that we expect to earn on cash flow received in the future from policies of that issue year, and cannot be changed. The discount rate used for policies issued in the current year has no impact on the in force policies issued in prior years as the rates of all prior issue years are also locked in. As such, the overall discount rate for the entire in force block of 5.6% is a weighted average of the discount rates being used from all issue years. Changes in the overall weighted-average discount rate over time are caused by changes in the mix of the reserves and the deferred acquisition cost asset by issue year on the entire block of in force business. Business issued in the current year has very little impact on the overall weighted-average discount rate due to the size of our in force business.
Since actuarial discount rates are locked in for life on essentially all of our business, benefit reserves and deferred acquisition costs are not affected by interest rate fluctuations unless a loss recognition event occurs. Due to the strength of our underwriting margins, we do not expect an extended low interest rate environment to cause a loss recognition event.
GL 2019 FORM 10-K
GLOBE LIFE INC.
Management's Discussion & Analysis
Information about interest on net policy liabilities is shown in the following table.
Required Interest on Net Insurance Policy Liabilities
(Dollar amounts in thousands)
| Required Interest | Average Net Insurance Policy Liabilities | Average Discount Rate | |||||||||||||||
| 2019 | |||||||||||||||||
| Life and Health | $ | 518,623 | $ | 8,947,308 | 5.80 | % | |||||||||||
| Annuity | 49,925 | 1,120,812 | 4.45 | ||||||||||||||
| Total | $ | 568,548 | $ | 10,068,120 | 5.65 | ||||||||||||
| Increase in 2019 | 3.87 | % | 3.32 | % | |||||||||||||
| 2018 | |||||||||||||||||
| Life and Health | $ | 493,557 | $ | 8,535,842 | 5.78 | % | |||||||||||
| Annuity | 53,785 | 1,208,358 | 4.45 | ||||||||||||||
| Total | $ | 547,342 | $ | 9,744,200 | 5.62 | ||||||||||||
| Increase in 2018 | 4.46 | % | 4.11 | % | |||||||||||||
| 2017 | |||||||||||||||||
| Life and Health | $ | 468,038 | $ | 8,099,319 | 5.78 | % | |||||||||||
| Annuity | 55,952 | 1,260,461 | 4.44 | ||||||||||||||
| Total | $ | 523,990 | $ | 9,359,780 | 5.60 | ||||||||||||
| Increase in 2017 | 4.90 | % | 4.63 | % |
Financing costs for the investment segment consist primarily of interest on our various debt instruments. The table below presents the components of financing costs and reconciles interest expense per the Consolidated Statements of Operations**.
Analysis of Financing Costs
(Dollar amounts in thousands)
| 2019 | 2018 | 2017 | |||||||||||||||
| Interest on funded debt | $ | 69,844 | $ | 74,324 | $ | 74,115 | |||||||||||
| Interest on term loan | 3,262 | 3,177 | 2,336 | ||||||||||||||
| Interest on short-term debt | 11,165 | 12,570 | 8,076 | ||||||||||||||
| Other | 35 | 5 | 5 | ||||||||||||||
| Financing costs | $ | 84,306 | $ | 90,076 | $ | 84,532 |
In 2019, financing costs decreased 6% due to the refinancing of a long-term debt instrument at a lower rate in late 2018. More information on our debt transactions are disclosed in the Financial Condition section of this report and in Note 11—Debt.
Realized Gains and Losses. Our life and health insurance companies collect premium income from policyholders for the eventual payment of policyholder benefits, sometimes paid many years or even decades in the future. Since benefits are expected to be paid in future periods, premium receipts in excess of current expenses are invested to provide for these obligations. For this reason, we hold a significant investment portfolio as a part of our core insurance operations. This portfolio consists primarily of high-quality fixed maturities containing an adequate yield to provide for the cost of carrying these long-term insurance product obligations. As a result, fixed maturities are generally held for long periods to support the liabilities. Expected yields on these investments are taken into account when setting insurance premium rates and product profitability expectations.
Despite our intent to hold fixed maturity investments for a long period of time, investments are occasionally sold or called, resulting in a realized gain or loss. These gains and losses generally occur only incidentally, usually as the
GL 2019 FORM 10-K
GLOBE LIFE INC.
Management's Discussion & Analysis
result of bonds sold because of deterioration in investment quality of issuers or calls by the issuers. Investment losses are also caused by write downs due to impairments. We do not engage in trading investments for profit. Therefore, gains or losses which occur in protecting the portfolio or its yield, or which result from events that are beyond our control, are only secondary to our core insurance operations of providing insurance coverage to policyholders. In a bond exchange offer, bondholders may consent to exchange their existing bonds for another class of debt securities. The exchanges on our bonds have generally been the result of mergers and acquisitions, and are offered to move debt to the new or surviving entity.
Realized gains and losses can be significant in relation to the earnings from core insurance operations, and as a result, can have a material positive or negative impact on net income. The significant fluctuations caused by gains and losses can cause period-to-period trends of net income that are not indicative of historical core operating results or predictive of the future trends of core operations. Accordingly, they have no bearing on core insurance operations or segment results as we view operations. For these reasons, and in line with industry practice, we remove the effects of realized gains and losses when evaluating overall insurance operating results.
The following table summarizes our tax-effected realized gains (losses) by component for each of the three years ended December 31, 2019.
Analysis of Realized Gains (Losses), Net of Tax
(Dollar amounts in thousands, except for per share data)
| Year Ended December 31, | |||||||||||||||||||||||||||||||||||||||||||||||||||||||||||||||||
| 2019 | 2018 | 2017 | |||||||||||||||||||||||||||||||||||||||||||||||||||||||||||||||
| Amount | Per Share | Amount | Per Share | Amount | Per Share | ||||||||||||||||||||||||||||||||||||||||||||||||||||||||||||
| Fixed maturities: | |||||||||||||||||||||||||||||||||||||||||||||||||||||||||||||||||
| Sales | $ | (1,933) | $ | (0.02) | $ | (11,005) | $ | (0.10) | $ | 2,587 | $ | 0.02 | |||||||||||||||||||||||||||||||||||||||||||||||||||||
| Other(1) | 17,223 | 0.16 | 15,520 | 0.14 | 20,292 | 0.17 | |||||||||||||||||||||||||||||||||||||||||||||||||||||||||||
| Other-than-temporary impairments | — | — | — | — | (159) | — | |||||||||||||||||||||||||||||||||||||||||||||||||||||||||||
| Fair value option—change in fair value | 992 | 0.01 | 2,093 | 0.01 | — | — | |||||||||||||||||||||||||||||||||||||||||||||||||||||||||||
| Other | 9 | — | 719 | 0.01 | (2,503) | (0.02) | |||||||||||||||||||||||||||||||||||||||||||||||||||||||||||
| Realized investment gains (losses) | 16,291 | 0.15 | 7,327 | 0.06 | 20,217 | 0.17 | |||||||||||||||||||||||||||||||||||||||||||||||||||||||||||
| Loss on redemption of debt | — | — | (8,752) | (0.07) | (2,627) | (0.02) | |||||||||||||||||||||||||||||||||||||||||||||||||||||||||||
| Total realized gains (losses) | $ | 16,291 | $ | 0.15 | $ | (1,425) | $ | (0.01) | $ | 17,590 | $ | 0.15 |
(1)During the three years ended December 31, 2019, 2018, and 2017, the Company recorded $243.2 million, $193.4 million and $84.3 million of exchanges of fixed maturity securities (noncash transactions) that resulted in $16.2 million, $8.0 million, and $3.1 million, respectively in realized gains (losses), net of tax.
GL 2019 FORM 10-K
GLOBE LIFE INC.
Management's Discussion & Analysis
Investment Acquisitions**.** Globe Life's investment policy calls for investing primarily in investment grade fixed maturities that meet our quality and yield objectives. We generally prefer to invest in securities with longer maturities because they more closely match the long-term nature of our policy liabilities. We believe this strategy is appropriate since our expected future cash flows are generally stable and predictable and the likelihood that we will need to sell invested assets to raise cash is low. If longer-term securities that meet our quality and yield objectives are not available, we do not compromise on our quality objectives; instead, we consider investing in shorter-term or lower-yielding securities taking into consideration the slope of the yield curve and other factors such as risk adjusted capital adjusted returns.
During calendar years 2017 through 2019, Globe Life invested predominately in fixed maturity securities, primarily in corporate and municipal bonds with longer-term maturities. The following table summarizes selected information for fixed maturity purchases for the last three years. Premiums and discounts are amortized using the interest method. When amortized cost of a callable debt security exceeds the first call price, the premium is amortized to the earliest call date. Otherwise, the period of amortization or accretion generally extends from the purchase date to the maturity date.
Fixed Maturity Acquisitions Selected Information
(Dollar amounts in thousands)
| Year Ended December 31, | |||||||||||||||||||||||||||||
| 2019 | 2018 | 2017 | |||||||||||||||||||||||||||
| Cost of acquisitions(1): | |||||||||||||||||||||||||||||
| Investment-grade corporate securities | $ | 922,927 | $ | 877,512 | $ | 1,308,567 | |||||||||||||||||||||||
| Investment-grade municipal securities | 627,967 | 269,360 | — | ||||||||||||||||||||||||||
| Other investment-grade securities | 10,483 | 8,708 | 6,042 | ||||||||||||||||||||||||||
| Total fixed maturity acquisitions | $ | 1,561,377 | $ | 1,155,580 | $ | 1,314,609 | |||||||||||||||||||||||
| Effective annual yield (one year compounded)(2) | 4.47 | % | 4.97 | % | 4.67 | % | |||||||||||||||||||||||
| Average life (in years to next call) | 18.7 | 17.0 | 23.0 | ||||||||||||||||||||||||||
| Average life (in years to maturity) | 29.4 | 22.8 | 24.0 | ||||||||||||||||||||||||||
| Average rating | A | A- | BBB+ |
(1)Fixed maturity acquisitions included unsettled trades of $8 million in 2019, $41 thousand in 2018 and $0 in 2017.
(2)Tax-equivalent basis, where the yield on tax-exempt securities is adjusted to produce a yield equivalent to the pretax yield on taxable securities.
For investments in callable bonds, the actual life of the investment will depend on whether the issuer calls the investment prior to the maturity date. Given our investments in callable bonds, the actual average life of our investments cannot be known at the time of the investment. Absent sales and "make-whole calls", however, the average life will not be less than the average life to next call and will not exceed the average life to maturity. Data for both of these average life measures is provided in the above chart.
During 2018 and 2019, acquisitions consisted of securities spanning a diversified range of issuers, industry sectors, and geographical regions. All of the acquired securities were investment grade. In addition to the fixed maturity acquisitions, Globe Life invested $123 million in other long-term investments in 2019 and $94 million in 2018. These investments include commercial mortgage loan participations and investment funds. See Note—4 for further discussion.
New cash flow available for investment has been primarily provided through our insurance operations, cash received on existing investments, and proceeds from dispositions. While dispositions increase funds available for investment, as noted earlier in this discussion, they can also have a negative impact on investment income if the proceeds from the dispositions are reinvested at lower yields than the bonds that were disposed. Dispositions were $919 million in 2019 and $376 million in 2018.
In 2017, it was announced by the head of the United Kingdom's Financial Conduct Authority that they plan to phase out the floating rate, London Interbank Offered Rate (LIBOR), by the end of 2021. As of December 31, 2019, Globe
GL 2019 FORM 10-K
GLOBE LIFE INC.
Management's Discussion & Analysis
Life had limited assets and liabilities that utilize LIBOR as a benchmark rate. As such, we do not expect the phase out of LIBOR to have a meaningful impact on our operations.
Since fixed maturities represent such a significant portion of our investment portfolio, the remainder of the discussion of portfolio composition will focus on fixed maturities. See a breakdown of the Company's other investments in Other Investment Information within Note 4—Investments.
Selected information concerning the fixed-maturity portfolio is as follows:
Fixed Maturity Portfolio Selected Information
| At December 31, | |||||||||||||||||
| 2019 | 2018 | ||||||||||||||||
| Average annual effective yield(1) | 5.41% | 5.55% | |||||||||||||||
| Average life, in years, to: | |||||||||||||||||
| Next call(2) | 16.8 | 16.9 | |||||||||||||||
| Maturity(2) | 19.2 | 18.7 | |||||||||||||||
| Effective duration to: | |||||||||||||||||
| Next call(2,3) | 10.8 | 10.0 | |||||||||||||||
| Maturity(2,3) | 11.8 | 10.8 |
(1)Tax-equivalent basis. The yield on tax-exempt securities is adjusted to produce a yield equivalent to the pretax yield on taxable securities.
(2)Globe Life calculates the average life and duration of the fixed maturity portfolio two ways:
(a) based on the next call date which is the next call date for callable bonds and the maturity date for noncallable bonds, and
(b) based on the maturity date of all bonds, whether callable or not.
(3)Effective duration is a measure of the price sensitivity of a fixed-income security to a particular change in interest rates.
GL 2019 FORM 10-K
GLOBE LIFE INC.
Management's Discussion & Analysis
Credit Risk Sensitivity*.* The following tables summarize certain information about the major corporate sectors and security types held in our fixed maturity portfolio at December 31, 2019 and 2018.
Fixed Maturities by Sector
December 31, 2019
(Dollar amounts in thousands)
| Below Investment Grade | Total Fixed Maturities | % of Total Fixed Maturities | |||||||||||||||||||||||||||||||||||||||||||||||||||||||||
| Cost or Amortized Cost | Gross Unrealized Gains | Gross Unrealized Losses | Fair Value | Cost or Amortized Cost | Gross Unrealized Gains | Gross Unrealized Losses | Fair Value | At Amortized Cost | At Fair Value | ||||||||||||||||||||||||||||||||||||||||||||||||||
| Corporates: | |||||||||||||||||||||||||||||||||||||||||||||||||||||||||||
| Financial | |||||||||||||||||||||||||||||||||||||||||||||||||||||||||||
| Insurance - life, health, P&C | $ | 57,833 | $ | 3,114 | $ | (6,542) | $ | 54,405 | $ | 2,111,735 | $ | 394,326 | $ | (9,277) | $ | 2,496,784 | 13 | 13 | |||||||||||||||||||||||||||||||||||||||||
| Banks | 27,045 | — | (1,196) | 25,849 | 904,449 | 175,771 | (1,300) | 1,078,920 | 6 | 6 | |||||||||||||||||||||||||||||||||||||||||||||||||
| Other financial | 97,580 | 737 | (11,519) | 86,798 | 1,085,733 | 131,099 | (11,730) | 1,205,102 | 7 | 6 | |||||||||||||||||||||||||||||||||||||||||||||||||
| Total financial | 182,458 | 3,851 | (19,257) | 167,052 | 4,101,917 | 701,196 | (22,307) | 4,780,806 | 26 | 25 | |||||||||||||||||||||||||||||||||||||||||||||||||
| Utilities | |||||||||||||||||||||||||||||||||||||||||||||||||||||||||||
| Electric | 47,298 | 1,059 | (1,399) | 46,958 | 1,418,359 | 342,302 | (1,484) | 1,759,177 | 9 | 9 | |||||||||||||||||||||||||||||||||||||||||||||||||
| Gas and water | — | — | — | — | 519,379 | 73,812 | (81) | 593,110 | 3 | 3 | |||||||||||||||||||||||||||||||||||||||||||||||||
| Total utilities | 47,298 | 1,059 | (1,399) | 46,958 | 1,937,738 | 416,114 | (1,565) | 2,352,287 | 12 | 12 | |||||||||||||||||||||||||||||||||||||||||||||||||
| Industrial - Energy | |||||||||||||||||||||||||||||||||||||||||||||||||||||||||||
| Pipelines | 85,428 | 396 | (5,839) | 79,985 | 934,884 | 141,705 | (6,803) | 1,069,786 | 6 | 6 | |||||||||||||||||||||||||||||||||||||||||||||||||
| Exploration and production | 17,129 | 400 | (127) | 17,402 | 559,826 | 96,312 | (335) | 655,803 | 3 | 3 | |||||||||||||||||||||||||||||||||||||||||||||||||
| Oil field services | — | — | — | — | 49,818 | 10,982 | — | 60,800 | — | — | |||||||||||||||||||||||||||||||||||||||||||||||||
| Refiner | — | — | — | — | 89,692 | 20,641 | — | 110,333 | 1 | 1 | |||||||||||||||||||||||||||||||||||||||||||||||||
| Driller | 44,748 | — | (26,586) | 18,162 | 44,749 | — | (26,587) | 18,162 | — | — | |||||||||||||||||||||||||||||||||||||||||||||||||
| Total energy | 147,305 | 796 | (32,552) | 115,549 | 1,678,969 | 269,640 | (33,725) | 1,914,884 | 10 | 10 | |||||||||||||||||||||||||||||||||||||||||||||||||
| Industrial - Basic materials | |||||||||||||||||||||||||||||||||||||||||||||||||||||||||||
| Chemicals | — | — | — | — | 608,081 | 61,263 | (325) | 669,019 | 4 | 3 | |||||||||||||||||||||||||||||||||||||||||||||||||
| Metals and mining | 10,563 | 1,643 | — | 12,206 | 398,477 | 86,138 | (58) | 484,557 | 2 | 3 | |||||||||||||||||||||||||||||||||||||||||||||||||
| Forestry products and paper | — | — | — | — | 111,011 | 15,700 | — | 126,711 | 1 | 1 | |||||||||||||||||||||||||||||||||||||||||||||||||
| Total basic materials | 10,563 | 1,643 | — | 12,206 | 1,117,569 | 163,101 | (383) | 1,280,287 | 7 | 7 | |||||||||||||||||||||||||||||||||||||||||||||||||
| Industrial - Consumer, non-cyclical | 33,474 | 411 | (5,504) | 28,381 | 2,126,768 | 303,088 | (6,875) | 2,422,981 | 13 | 13 | |||||||||||||||||||||||||||||||||||||||||||||||||
| Other industrials | 25,752 | 2,648 | — | 28,400 | 1,309,149 | 199,765 | (539) | 1,508,375 | 8 | 8 | |||||||||||||||||||||||||||||||||||||||||||||||||
| Industrial - Transportation | 25,996 | 1,245 | (16) | 27,225 | 570,694 | 107,704 | (127) | 678,271 | 3 | 4 | |||||||||||||||||||||||||||||||||||||||||||||||||
| Other corporate sectors | 130,069 | 7,105 | (6,401) | 130,773 | 1,390,497 | 182,250 | (8,841) | 1,563,906 | 8 | 8 | |||||||||||||||||||||||||||||||||||||||||||||||||
| Total corporates | 602,915 | 18,758 | (65,129) | 556,544 | 14,233,301 | 2,342,858 | (74,362) | 16,501,797 | 87 | 87 | |||||||||||||||||||||||||||||||||||||||||||||||||
| Other fixed maturities: | |||||||||||||||||||||||||||||||||||||||||||||||||||||||||||
| Government (U.S., municipal, and foreign) | — | — | — | — | 1,981,243 | 202,325 | (1,318) | 2,182,250 | 12 | 12 | |||||||||||||||||||||||||||||||||||||||||||||||||
| Collateralized debt obligations | 56,990 | 24,298 | (7,184) | 74,104 | 56,990 | 24,298 | (7,184) | 74,104 | — | — | |||||||||||||||||||||||||||||||||||||||||||||||||
| Other asset-backed securities | 14,250 | — | (371) | 13,879 | 143,651 | 5,066 | (371) | 148,346 | 1 | 1 | |||||||||||||||||||||||||||||||||||||||||||||||||
| Mortgage-backed securities(1) | — | — | — | — | 591 | 59 | — | 650 | — | — | |||||||||||||||||||||||||||||||||||||||||||||||||
| Total fixed maturities | $ | 674,155 | $ | 43,056 | $ | (72,684) | $ | 644,527 | $ | 16,415,776 | $ | 2,574,606 | $ | (83,235) | $ | 18,907,147 | 100 | 100 |
(1)Includes Government National Mortgage Association (GNMA).
Corporate securities, which consist of bonds and redeemable preferred stocks, were the largest component of the fixed maturity portfolio, representing 87% of amortized cost and fair value. The remainder of the portfolio is invested primarily in securities issued by the U.S. government and U.S. municipalities. The Company holds insignificant amounts in foreign government bonds, collateralized debt obligations, asset-backed securities, and mortgage-
GL 2019 FORM 10-K
GLOBE LIFE INC.
Management's Discussion & Analysis
backed securities. Corporate securities are diversified over a variety of industry sectors and issuers. At December 31, 2019, the total fixed maturity portfolio consisted of 656 issuers.
Fixed Maturities by Sector
December 31, 2018
(Dollar amounts in thousands)
| Below Investment Grade | Total Fixed Maturities | % of Total Fixed Maturities | |||||||||||||||||||||||||||||||||||||||||||||||||||||||||
| Cost or Amortized Cost | Gross Unrealized Gains | Gross Unrealized Losses | Fair Value | Cost or Amortized Cost | Gross Unrealized Gains | Gross Unrealized Losses | Fair Value | At Amortized Cost | At Fair Value | ||||||||||||||||||||||||||||||||||||||||||||||||||
| Corporates: | |||||||||||||||||||||||||||||||||||||||||||||||||||||||||||
| Financial | |||||||||||||||||||||||||||||||||||||||||||||||||||||||||||
| Insurance - life, health, P&C | $ | 66,310 | $ | 3,836 | $ | (8,674) | $ | 61,472 | $ | 1,941,967 | $ | 181,552 | $ | (28,158) | $ | 2,095,361 | 12 | 13 | |||||||||||||||||||||||||||||||||||||||||
| Banks | 27,075 | — | (1,348) | 25,727 | 871,485 | 50,205 | (16,730) | 904,960 | 6 | 5 | |||||||||||||||||||||||||||||||||||||||||||||||||
| Other financial | 74,958 | — | (19,584) | 55,374 | 946,316 | 31,118 | (42,627) | 934,807 | 6 | 6 | |||||||||||||||||||||||||||||||||||||||||||||||||
| Total financial | 168,343 | 3,836 | (29,606) | 142,573 | 3,759,768 | 262,875 | (87,515) | 3,935,128 | 24 | 24 | |||||||||||||||||||||||||||||||||||||||||||||||||
| Utilities | |||||||||||||||||||||||||||||||||||||||||||||||||||||||||||
| Electric | 36,889 | 176 | (3,277) | 33,788 | 1,458,193 | 188,136 | (14,943) | 1,631,386 | 10 | 10 | |||||||||||||||||||||||||||||||||||||||||||||||||
| Gas and water | — | — | — | — | 531,313 | 29,710 | (9,456) | 551,567 | 3 | 3 | |||||||||||||||||||||||||||||||||||||||||||||||||
| Total utilities | 36,889 | 176 | (3,277) | 33,788 | 1,989,506 | 217,846 | (24,399) | 2,182,953 | 13 | 13 | |||||||||||||||||||||||||||||||||||||||||||||||||
| Industrial - Energy | |||||||||||||||||||||||||||||||||||||||||||||||||||||||||||
| Pipelines | 40,553 | — | (4,762) | 35,791 | 925,689 | 50,835 | (25,395) | 951,129 | 6 | 6 | |||||||||||||||||||||||||||||||||||||||||||||||||
| Exploration and production | 17,187 | — | (1,554) | 15,633 | 548,099 | 30,969 | (17,518) | 561,550 | 3 | 3 | |||||||||||||||||||||||||||||||||||||||||||||||||
| Oil field services | — | — | (1) | (1) | 49,837 | 3,893 | (715) | 53,015 | — | — | |||||||||||||||||||||||||||||||||||||||||||||||||
| Refiner | — | — | — | — | 84,255 | 8,183 | (1,496) | 90,942 | 1 | 1 | |||||||||||||||||||||||||||||||||||||||||||||||||
| Driller | 44,820 | — | (17,247) | 27,573 | 44,820 | — | (17,247) | 27,573 | — | — | |||||||||||||||||||||||||||||||||||||||||||||||||
| Total energy | 102,560 | — | (23,564) | 78,996 | 1,652,700 | 93,880 | (62,371) | 1,684,209 | 10 | 10 | |||||||||||||||||||||||||||||||||||||||||||||||||
| Industrial - Basic materials | |||||||||||||||||||||||||||||||||||||||||||||||||||||||||||
| Chemicals | — | — | — | — | 554,481 | 8,818 | (25,302) | 537,997 | 4 | 3 | |||||||||||||||||||||||||||||||||||||||||||||||||
| Metals and mining | 57,409 | 92 | (1,492) | 56,009 | 386,782 | 33,868 | (2,500) | 418,150 | 2 | 3 | |||||||||||||||||||||||||||||||||||||||||||||||||
| Forestry products and paper | — | — | — | — | 111,612 | 7,329 | (2,711) | 116,230 | — | 1 | |||||||||||||||||||||||||||||||||||||||||||||||||
| Total basic materials | 57,409 | 92 | (1,492) | 56,009 | 1,052,875 | 50,015 | (30,513) | 1,072,377 | 6 | 7 | |||||||||||||||||||||||||||||||||||||||||||||||||
| Industrial - Consumer, non-cyclical | 33,847 | 587 | (6,710) | 27,724 | 2,024,230 | 76,669 | (89,536) | 2,011,363 | 13 | 12 | |||||||||||||||||||||||||||||||||||||||||||||||||
| Other industrials | 46,852 | — | (3,311) | 43,541 | 1,364,192 | 62,338 | (42,222) | 1,384,308 | 9 | 8 | |||||||||||||||||||||||||||||||||||||||||||||||||
| Industrial - Transportation | 26,213 | — | (2,592) | 23,621 | 569,786 | 47,496 | (10,325) | 606,957 | 4 | 4 | |||||||||||||||||||||||||||||||||||||||||||||||||
| Other corporate sectors | 135,873 | 982 | (16,241) | 120,614 | 1,371,624 | 47,006 | (69,913) | 1,348,717 | 9 | 9 | |||||||||||||||||||||||||||||||||||||||||||||||||
| Total corporates | 607,986 | 5,673 | (86,793) | 526,866 | 13,784,681 | 858,125 | (416,794) | 14,226,012 | 88 | 87 | |||||||||||||||||||||||||||||||||||||||||||||||||
| Other fixed maturities: | |||||||||||||||||||||||||||||||||||||||||||||||||||||||||||
| Government (U.S., municipal, and foreign) | 306 | 93 | — | 399 | 1,763,496 | 90,475 | (4,537) | 1,849,434 | 11 | 11 | |||||||||||||||||||||||||||||||||||||||||||||||||
| Collateralized debt obligations | 57,769 | 22,014 | (6,414) | 73,369 | 57,769 | 22,014 | (6,414) | 73,369 | — | 1 | |||||||||||||||||||||||||||||||||||||||||||||||||
| Other asset-backed securities | — | — | — | — | 146,546 | 2,159 | (633) | 148,072 | 1 | 1 | |||||||||||||||||||||||||||||||||||||||||||||||||
| Mortgage-backed securities(1) | — | — | — | — | 979 | 67 | (1) | 1,045 | — | — | |||||||||||||||||||||||||||||||||||||||||||||||||
| Total fixed maturities | $ | 666,061 | $ | 27,780 | $ | (93,207) | $ | 600,634 | $ | 15,753,471 | $ | 972,840 | $ | (428,379) | $ | 16,297,932 | 100 | 100 |
(1)Includes Government National Mortgage Association (GNMA).
At December 31, 2019, fixed maturities had a fair value of $18.9 billion, compared with $16.3 billion at December 31, 2018. The net unrealized gain position in the fixed-maturity portfolio increased from $544.5 million at December 31, 2018 to $2.5 billion at December 31, 2019 due to decreases in interest rates during the period.
GL 2019 FORM 10-K
GLOBE LIFE INC.
Management's Discussion & Analysis
For more information about our fixed maturity portfolio by component at December 31, 2019 and 2018, including a discussion of other-than-temporary impairments, an analysis of unrealized investment losses and a schedule of maturities, see Note 4—Investments.
An analysis of the fixed maturity portfolio by a composite quality rating at December 31, 2019 and 2018 is shown in the following tables. The composite rating for each security, other than private-placement securities managed by third parties, is the average of the security’s ratings as assigned by Moody’s Investor Service, Standard & Poor’s, Fitch Ratings, and Dominion Bond Rating Service, LTD. The ratings assigned by these four nationally recognized statistical rating organizations are evenly weighted when calculating the average. The composite quality rating is created using a methodology developed by Globe Life using ratings from the various rating agencies noted above. The composite quality rating is not a Standard & Poor's credit rating. Standard & Poor's does not sponsor, endorse or promote the composite quality rating and shall not be liable for any use of the composite quality rating. Included in the chart below are private placement fixed maturity holdings of $581 million at amortized cost ($609 million at fair value) for which the ratings were assigned by the third party managers.
Fixed Maturities by Rating
At December 31, 2019
(Dollar amounts in thousands)
| Amortized Cost | % of Total | Fair Value | % of Total | Average Composite Quality Rating on Amortized Cost | |||||||||||||||||||||||||||||||||||||||||||||||||
| Investment grade: | |||||||||||||||||||||||||||||||||||||||||||||||||||||
| AAA | $ | 769,564 | 5 | $ | 841,176 | 4 | |||||||||||||||||||||||||||||||||||||||||||||||
| AA | 1,311,902 | 8 | 1,455,815 | 8 | |||||||||||||||||||||||||||||||||||||||||||||||||
| A | 4,608,959 | 28 | 5,603,235 | 30 | |||||||||||||||||||||||||||||||||||||||||||||||||
| BBB+ | 3,509,311 | 21 | 4,119,737 | 22 | |||||||||||||||||||||||||||||||||||||||||||||||||
| BBB | 3,818,589 | 23 | 4,309,394 | 23 | |||||||||||||||||||||||||||||||||||||||||||||||||
| BBB- | 1,723,296 | 11 | 1,933,263 | 10 | |||||||||||||||||||||||||||||||||||||||||||||||||
| Total investment grade | 15,741,621 | 96 | 18,262,620 | 97 | A- | ||||||||||||||||||||||||||||||||||||||||||||||||
| Below investment grade: | |||||||||||||||||||||||||||||||||||||||||||||||||||||
| BB | 465,296 | 3 | 450,925 | 2 | |||||||||||||||||||||||||||||||||||||||||||||||||
| B | 107,653 | 1 | 96,077 | — | |||||||||||||||||||||||||||||||||||||||||||||||||
| Below B | 101,206 | — | 97,525 | 1 | |||||||||||||||||||||||||||||||||||||||||||||||||
| Total below investment grade | 674,155 | 4 | 644,527 | 3 | B+ | ||||||||||||||||||||||||||||||||||||||||||||||||
| $ | 16,415,776 | 100 | $ | 18,907,147 | 100 | ||||||||||||||||||||||||||||||||||||||||||||||||
| Weighted average composite quality rating | A- |
GL 2019 FORM 10-K
GLOBE LIFE INC.
Management's Discussion & Analysis
Fixed Maturities by Rating
At December 31, 2018
(Dollar amounts in thousands)
| Amortized Cost | % of Total | Fair Value | % of Total | Average Composite Quality Rating on Amortized Cost | |||||||||||||||||||||||||||||||||||||||||||||||||
| Investment grade: | |||||||||||||||||||||||||||||||||||||||||||||||||||||
| AAA | $ | 750,101 | 5 | $ | 766,341 | 5 | |||||||||||||||||||||||||||||||||||||||||||||||
| AA | 1,222,158 | 8 | 1,282,834 | 8 | |||||||||||||||||||||||||||||||||||||||||||||||||
| A | 3,983,869 | 25 | 4,378,152 | 26 | |||||||||||||||||||||||||||||||||||||||||||||||||
| BBB+ | 3,606,143 | 23 | 3,707,078 | 23 | |||||||||||||||||||||||||||||||||||||||||||||||||
| BBB | 3,695,585 | 23 | 3,746,661 | 23 | |||||||||||||||||||||||||||||||||||||||||||||||||
| BBB- | 1,829,554 | 12 | 1,816,232 | 11 | |||||||||||||||||||||||||||||||||||||||||||||||||
| Total investment grade | 15,087,410 | 96 | 15,697,298 | 96 | A- | ||||||||||||||||||||||||||||||||||||||||||||||||
| Below investment grade: | |||||||||||||||||||||||||||||||||||||||||||||||||||||
| BB | 403,649 | 3 | 362,090 | 2 | |||||||||||||||||||||||||||||||||||||||||||||||||
| B | 164,052 | 1 | 123,904 | 1 | |||||||||||||||||||||||||||||||||||||||||||||||||
| Below B | 98,360 | — | 114,640 | 1 | |||||||||||||||||||||||||||||||||||||||||||||||||
| Total below investment grade | 666,061 | 4 | 600,634 | 4 | B+ | ||||||||||||||||||||||||||||||||||||||||||||||||
| $ | 15,753,471 | 100 | $ | 16,297,932 | 100 | ||||||||||||||||||||||||||||||||||||||||||||||||
| Weighted average composite quality rating | BBB+ |
The overall quality rating of the portfolio has increased to A- from BBB+ since the prior year, the first time the overall rating of the portfolio has been A- since 2016. The increase was aided by reduced exposure to below investment grade securities as well as acquisitions of fixed maturities rated A and above, primarily in the municipal sector.
Fixed maturities rated BBB are 55% of the total portfolio as compared to 58% at the end of 2018. While this ratio is high relative to our peers, we have limited exposure to higher-risk assets such as derivatives, equities, commercial mortgages, and asset-backed securities. Additionally, the Company does not participate in securities lending, has no off-balance sheet investments, and has no exposure to European sovereign debt as of December 31, 2019. BBB securities provide the Company with the best risk adjusted capital adjusted returns, largely due to our unique ability to hold securities to maturity regardless of fluctuations in interest rates or equity markets.
GL 2019 FORM 10-K
GLOBE LIFE INC.
Management's Discussion & Analysis
An analysis of changes in our portfolio of below-investment grade fixed maturities at amortized cost is as follows:
Below-Investment Grade Fixed Maturities
(Dollar amounts in thousands)
| Twelve Months Ended December 31, | |||||||||||||||||
| 2019 | 2018 | ||||||||||||||||
| Balance at beginning of period | $ | 666,061 | $ | 702,256 | |||||||||||||
| Downgrades by rating agencies | 154,424 | 29,724 | |||||||||||||||
| Upgrades by rating agencies | (65,693) | (10,934) | |||||||||||||||
| Dispositions | (84,902) | (58,827) | |||||||||||||||
| Amortization and other | 4,265 | 3,842 | |||||||||||||||
| Balance at end of period | $ | 674,155 | $ | 666,061 |
Our investment policy calls for investing primarily in fixed maturities that are investment grade and meet our quality and yield objectives. Thus, any increases in below-investment grade issues are typically a result of ratings downgrades of existing holdings. Below-investment grade bonds at amortized cost were 13% of our shareholders’ equity, excluding the effect of unrealized gains and losses on fixed maturities as of December 31, 2019.
Market Risk Sensitivity. Globe Life's investment securities are exposed to interest rate risk, meaning the effect of changes in financial market interest rates on the current fair value of the Company’s investment portfolio. Since 95% of the book value of our investments is attributable to fixed maturity investments (and virtually all of these investments are fixed-rate investments), the portfolio is highly subject to market risk. Declines in market interest rates generally result in the fair value of the investment portfolio rising, and increases in interest rates cause the fair value to decline. Under normal market conditions, we are not concerned about unrealized losses that are interest rate driven since we would not expect to realize them. We have the intent, and more importantly, the ability to hold our investments to maturity. The long-term nature of our insurance policy liabilities and strong operating cash-flow substantially mitigate any future need to liquidate portions of the portfolio. The increase or decrease in the fair value of insurance liabilities and debt due to increases or decreases in market interest rates largely offsets the impact of rates on the investment portfolio. However, as is permitted by GAAP, these liabilities are not recorded at fair value.
The following table illustrates the market risk sensitivity of our interest-rate sensitive fixed maturity portfolio at December 31, 2019 and 2018. This table measures the effect of a parallel shift in interest rates (as represented by the U.S. Treasury curve) on the fair value of the fixed maturity portfolio. The data measures the change in fair value arising from an immediate and sustained change in interest rates in increments of 100 basis points.
Market Value of Fixed Maturity Portfolio
(Dollar amounts in thousands)
| At December 31, | ||||||||||||||||||||
| Change in Interest Rates(1) | 2019 | 2018 | ||||||||||||||||||
| (200) | $ | 23,910,000 | $ | 20,264,000 | ||||||||||||||||
| (100) | 21,212,000 | 18,128,000 | ||||||||||||||||||
| 0 | 18,907,000 | 16,298,000 | ||||||||||||||||||
| 100 | 16,930,000 | 14,720,000 | ||||||||||||||||||
| 200 | 15,226,000 | 13,352,000 |
(1) In basis points.
GL 2019 FORM 10-K
GLOBE LIFE INC.
Management's Discussion & Analysis
OPERATING EXPENSES
Operating expenses are included in the Corporate and Other segment and are classified into two categories: insurance administrative expenses and expenses of the Parent Company. Insurance administrative expenses generally include expenses incurred after a policy has been issued. As these expenses relate to premium for a given period, management measures the expenses as a percentage of premium income. The Company also views stock-based compensation expense as a Parent Company expense. Expenses associated with the issuance of our insurance policies are reflected as acquisition expenses and included in the determination of underwriting margin.
The following table is an analysis of operating expenses for the three years ended December 31, 2019.
Operating Expenses Selected Information
(Dollar amounts in thousands)
| 2019 | 2018 | 2017 | |||||||||||||||||||||||||||||||||||||||||||||||||||
| Amount | % of Premium | Amount | % of Premium | Amount | % of Premium | ||||||||||||||||||||||||||||||||||||||||||||||||
| Insurance administrative expenses: | |||||||||||||||||||||||||||||||||||||||||||||||||||||
| Salaries | $ | 102,862 | 2.8 | $ | 100,688 | 2.9 | $ | 96,185 | 2.9 | ||||||||||||||||||||||||||||||||||||||||||||
| Other employee costs | 34,947 | 1.0 | 35,565 | 1.0 | 33,539 | 1.0 | |||||||||||||||||||||||||||||||||||||||||||||||
| Information technology costs | 42,927 | 1.2 | 29,286 | 0.9 | 26,048 | 0.8 | |||||||||||||||||||||||||||||||||||||||||||||||
| Legal costs | 10,286 | 0.3 | 9,187 | 0.3 | 8,752 | 0.3 | |||||||||||||||||||||||||||||||||||||||||||||||
| Other administrative costs | 49,299 | 1.4 | 49,215 | 1.4 | 46,066 | 1.4 | |||||||||||||||||||||||||||||||||||||||||||||||
| Total insurance administrative expenses | 240,321 | 6.7 | 223,941 | 6.5 | 210,590 | 6.4 | |||||||||||||||||||||||||||||||||||||||||||||||
| Parent company expense | 10,260 | 10,684 | 9,631 | ||||||||||||||||||||||||||||||||||||||||||||||||||
| Stock compensation expense | 44,843 | 39,792 | 37,034 | ||||||||||||||||||||||||||||||||||||||||||||||||||
| Administrative settlements | 400 | 3,590 | — | ||||||||||||||||||||||||||||||||||||||||||||||||||
| Legal proceedings | 8,358 | — | — | ||||||||||||||||||||||||||||||||||||||||||||||||||
| Non-operating fees | 643 | 1,578 | — | ||||||||||||||||||||||||||||||||||||||||||||||||||
| Total operating expenses, per Consolidated Statements of Operations | $ | 304,825 | $ | 279,585 | $ | 257,255 | |||||||||||||||||||||||||||||||||||||||||||||||
| 2019 | 2018 | 2017 | |||||||||||||||||||||||||||||||||||||||||||||||||||
| Amount | % | Amount | % | Amount | % | ||||||||||||||||||||||||||||||||||||||||||||||||
| Total insurance administrative expenses increase (decrease) over prior year | $ | 16,380 | 7.3 | $ | 13,351 | 6.3 | $ | 13,992 | 7.1 | ||||||||||||||||||||||||||||||||||||||||||||
| Total operating expenses increase (decrease) over prior year | 25,240 | 9.0 | 22,330 | 8.7 | 25,191 | 10.9 |
The 7.3% increase in insurance administrative expenses was primarily due to an increase in information technology expenses. The increase in information technology costs reflects investments related to data analytics capabilities, administrative systems modernization, and information security programs. The increase in stock-based compensation expense was primarily due to higher expense associated with equity awards, reflecting the Parent Company's increasing share price over the past several years.
GL 2019 FORM 10-K
GLOBE LIFE INC.
Management's Discussion & Analysis
SHARE PURCHASES
Globe Life has an ongoing share repurchase program that began in 1986, and is reviewed quarterly by management and annually reaffirmed by the Board of Directors. The program was reaffirmed on August 8, 2019. With no specified authorization amount, we determine the amount of repurchases based on the amount of the excess cash flow at the Parent Company, general market conditions, and other alternative uses. The majority of these purchases are made from excess cash flow. Excess cash flow at the Parent Company is primarily comprised of dividends received from the insurance subsidiaries less interest expense paid on its debt, dividends paid to Parent Company shareholders, and other limited operating activities. Additionally, when stock options are exercised, proceeds from these exercises and the resulting tax benefit are used to repurchase additional shares on the open market to minimize dilution as a result of the option exercises. The Board of Directors has authorized the Parent Company’s share repurchase program in amounts and with timing that management, in consultation with the Board, determines to be in the best interest of the Company and its shareholders.
The following table summarizes share purchase activity for each of the last three years.
Analysis of Share Purchases
(Amounts in thousands)
| 2019 | 2018 | 2017 | |||||||||||||||||||||||||||||||||||||||||||||||||||
| Purchases with: | Shares | Amount | Shares | Amount | Shares | Amount | |||||||||||||||||||||||||||||||||||||||||||||||
| Share repurchase program | 3,932 | $ | 350,080 | 4,406 | $ | 371,794 | 4,126 | $ | 324,622 | ||||||||||||||||||||||||||||||||||||||||||||
| Option proceeds | 1,209 | 109,489 | 571 | 49,955 | 1,103 | 88,367 | |||||||||||||||||||||||||||||||||||||||||||||||
| Total | 5,141 | $ | 459,569 | 4,977 | $ | 421,749 | 5,229 | $ | 412,989 |
With the significant pullback of the overall stock market in December 2018, the Company accelerated approximately $25 million of repurchases from 2019 to 2018 at an average price of approximately $76.00. The repurchases were paid from cash at the Parent Company and issuance of commercial paper.
Throughout the remainder of this discussion, share purchases refer only to those made from excess cash flow at the Parent Company.
GL 2019 FORM 10-K
GLOBE LIFE INC.
Management's Discussion & Analysis
FINANCIAL CONDITION
Liquidity. Liquidity provides Globe Life with the ability to meet on demand the cash commitments required to support our business operations and meet our financial obligations. Our liquidity is primarily derived from three sources: positive cash flow from operations, a portfolio of marketable securities, and a line of credit facility.
Insurance Subsidiary Liquidity**.** The operations of our insurance subsidiaries have historically generated substantial cash inflows in excess of immediate cash needs. Cash inflows for the insurance subsidiaries primarily include premium and investment income. In addition to investment income, maturities and scheduled repayments in the investment portfolio are cash in-flows. Cash outflows from operations include policy benefit payments, commissions, administrative expenses, and taxes. The funds to provide for policy benefits, the majority of which are paid in future periods, are invested primarily in long-term fixed maturities as they better match the long-term nature of these obligations. Excess cash available from the insurance subsidiaries’ operations is generally distributed as a dividend to the Parent Company, subject to regulatory restrictions. The dividends are generally paid in amounts equal to the subsidiaries’ prior year statutory net income excluding realized capital gains. While the leading source of the excess cash is investment income, a significant portion of the excess cash also comes from underwriting income due to our high underwriting margins and effective expense control.
Parent Company Liquidity. Cash flows from the insurance subsidiaries are used to pay interest and principal repayments on Parent Company debt, operating expenses of the Parent Company, and Parent Company dividends to Globe Life shareholders.
| Year Ended December 31, | |||||||||||||||||||||||||||||||||||||||||
| Projected 2020 | 2019 | 2018 | 2017 | ||||||||||||||||||||||||||||||||||||||
| Liquidity Sources: | |||||||||||||||||||||||||||||||||||||||||
| Dividends from Subsidiaries | $ | 490,000 | $ | 479,988 | $ | 448,142 | $ | 453,904 | |||||||||||||||||||||||||||||||||
| Excess Cash Flows | 385,000 | 374,232 | 349,243 | 329,556 |
For more information on the restrictions on the payment of dividends by subsidiaries, see the Restrictions section of Note 12—Shareholders' Equity. Although these restrictions exist, dividend availability from subsidiaries historically has been more than sufficient for the cash flow needs of the Parent Company.
Short-Term Borrowings. An additional source of Parent Company liquidity is a line of credit facility with a group of lenders which allows unsecured borrowings and stand-by letters of credit up to $750 million, which could be extended up to $1 billion. While Globe Life can request the extension, it is not guaranteed. The facility is further designated as a back-up line of credit for a commercial paper program as well as the stand-by letters of credit as discussed below. As of December 31, 2019, we had available $310 million of additional borrowing capacity under this facility, compared with $293 million a year earlier. There have been no difficulties in accessing the commercial paper market during the three years ended December 31, 2019. The facility will mature in May 2021.
The Parent Company expects to have readily available funds for 2020 and the foreseeable future to conduct its operations and to maintain target capital ratios in the insurance subsidiaries through internally generated cash flow and the credit facility. In the unlikely event that more liquidity is needed, the Company could generate additional funds through multiple sources including, but not limited to, the issuance of debt, an additional short-term credit facility, and intercompany borrowing.
Consolidated Liquidity*.* Consolidated net cash inflows provided from continuing operations were $1.35 billion in 2019, compared with $1.28 billion in 2018. In addition to cash inflows from operations, our companies received proceeds from maturities, calls, and repayments of fixed maturities in the amount of $840 million in 2019, compared with $344 million in 2018.
Our cash and short-term investments were $114 million at the end of 2019 compared with $184 million at the end of 2018. In addition to these liquid assets, the entire $18.9 billion (fair value at December 31, 2019) portfolio of fixed income securities is available for sale in the event of an unexpected need. Approximately 97% of our fixed income securities are publicly traded, freely tradable under SEC Rule 144, or qualified for resale under SEC Rule 144A. We
GL 2019 FORM 10-K
GLOBE LIFE INC.
Management's Discussion & Analysis
generally expect to hold fixed income securities to maturity, and even though these securities are classified as available for sale, we have the ability and intent to hold any securities which are temporarily impaired until they mature. Our strong cash flows from operations, on-going investment maturities, and credit line availability make any need to sell securities for liquidity highly unlikely.
Off-Balance Sheet Arrangements. As a part of its aforementioned credit facility, Globe Life had outstanding $150 million in stand-by letters of credit at December 31, 2019. On April 2, 2019, the letters of credit were amended to reduce the amount outstanding from $155 million as of December 31, 2018. These letters are issued among our subsidiaries, one of which is an offshore captive reinsurer, and have no impact on company obligations as a whole. Any future regulatory changes that restrict the use of off-shore captive reinsurers might require Globe Life to obtain third-party financing, which could cause an insignificant increase in financing costs.
As of December 31, 2019, we had no unconsolidated affiliates and no guarantees of the obligations of third party entities. All of the Parent Company's guarantees were guarantees of the performance of consolidated subsidiaries, as disclosed in Note 6—Commitments and Contingencies.
The following table presents information about future payments under our contractual obligations for the selected periods as of December 31, 2019.
Contractual Obligations
(Dollar amounts in thousands)
| Actual Liability | Total Payments | Less than One Year | One to Three Years | Three to Five Years | More than Five Years | ||||||||||||||||||||||||||||||
| Fixed and determinable: | |||||||||||||||||||||||||||||||||||
| Debt—principal(1) | $ | 1,647,726 | $ | 1,667,487 | $ | 299,375 | $ | 227,500 | $ | 165,612 | $ | 975,000 | |||||||||||||||||||||||
| Debt—interest(2) | 12,357 | 1,203,019 | 71,771 | 136,640 | 104,879 | 889,729 | |||||||||||||||||||||||||||||
| Capital leases | — | — | — | — | — | — | |||||||||||||||||||||||||||||
| Operating leases | 12,770 | 31,689 | 5,367 | 9,084 | 5,559 | 11,679 | |||||||||||||||||||||||||||||
| Purchase obligations(3) | 51,978 | 307,629 | 28,714 | 34,035 | 12,184 | 232,696 | |||||||||||||||||||||||||||||
| Postretirement obligations(4) | 223,253 | 321,872 | 24,082 | 53,967 | 61,832 | 181,991 | |||||||||||||||||||||||||||||
| Future insurance obligations(5) | 14,508,134 | 57,314,278 | 1,683,715 | 3,239,176 | 3,103,830 | 49,287,557 | |||||||||||||||||||||||||||||
| Total | $ | 16,456,218 | $ | 60,845,974 | $ | 2,113,024 | $ | 3,700,402 | $ | 3,453,896 | $ | 51,578,652 |
(1)Debt is itemized in Note 11—Debt.
(2)Interest on debt is based on our fixed contractual obligations.
(3)Purchase obligations include various long-term non-cancelable purchase commitments as well as commitments to provide capital for low-income housing tax credit interests.
(4)Pension obligations are primarily liabilities in trust funds that are calculated in accordance with the terms of the pension plans. They are offset by invested assets in the trusts, which are funded through periodic contributions by Globe Life in a manner which will provide for the settlement of the obligations as they become due. Therefore, our obligations are offset by those assets when reported on Globe Life's Consolidated Balance Sheets. At December 31, 2019 these pension obligations were $665 million, offset by assets of $469 million in the pension assets. The schedule of pension benefit payments covers ten years and is based on the same assumptions used to measure the pension obligations, except there is no interest assumption because the payments are undiscounted. Please refer to Note 9—Postretirement Benefits for more information on pension obligations.
(5)Future insurance obligations consist primarily of estimated future contingent benefit payments on policies in force at December 31, 2019. These estimated payments were computed using assumptions for future mortality, morbidity and persistency. The actual amount and timing of such payments may differ significantly from the estimated amounts shown. The Company concludes that the assets supporting the liability of $15 billion at December 31, 2019, along with future premiums and investment income, will be sufficient to fund all future insurance obligations.
GL 2019 FORM 10-K
GLOBE LIFE INC.
Management's Discussion & Analysis
Capital Resources. The Parent Company's capital structure consists of short-term debt (the commercial paper facility and the current maturity of funded debt*),* long-term debt, and shareholders’ equity.
Debt: The carrying value of the long-term debt was $1.3 billion at December 31, 2019, which decreased from $1.4 billion a year earlier. A complete analysis and description of long-term debt issues outstanding is presented in Note 11—Debt.
On September 27, 2018, the Parent Company completed the issuance and sale of $550 million in aggregate principal of the Company's 4.55% Senior Notes due 2028. The notes were sold pursuant to the Company's shelf registration statement on Form S-3. The net proceeds from the sale of the notes were $543 million, after giving effect to the underwriting discounts and commissions and offering expenses payable by the Parent Company. The Company used the net proceeds from the sale of the notes to redeem the $293 million outstanding principal amount on the Company's 9.25% Senior Notes on October 29, 2018, the payment of $11 million for the make-whole premium plus accrued and unpaid interest of $10 million, and to fund $150 million of additional capital to its insurance subsidiaries. The Parent Company used the remaining net proceeds to repay outstanding commercial paper and for general corporate purposes.
Due to increasing variable interest rates, on June 15, 2018, the Company called its $20 million Junior Subordinated Debentures.
Subsidiary Capital: The National Association of Insurance Commissioners (NAIC) has established a risk-based factor approach for determining threshold risk-based capital levels for all insurance companies. This approach was designed to assist the regulatory bodies in identifying companies that may require regulatory attention. A Risk-Based Capital (RBC) ratio is typically determined by dividing adjusted total statutory capital by the amount of risk-based capital determined using the NAIC’s factors. If a company’s RBC ratio approaches two times the RBC amount, the company must file a plan with the NAIC for improving their capital levels (this level is commonly referred to as “Company Action Level” RBC). Companies typically hold a multiple of the Company Action Level RBC depending on their particular business needs and risk profile.
Our goal is to maintain statutory capital within our insurance subsidiaries at levels necessary to support our current ratings. For 2019, Globe Life targeted a consolidated Company Action Level RBC ratio of 300% to 320%. The Company concludes that this capital level is more than adequate and sufficient to support its current ratings, given the nature of its business and its risk profile. As of December 31, 2019, our consolidated Company Action Level RBC ratio was 318%.
Globe Life is targeting a consolidated Company Action Level RBC ratio in the range of 300% to 320% for 2020.
Shareholder's Equity: As noted under the caption Analysis of Share Purchases within this report, we have an ongoing share repurchase program.
Globe Life has continually increased the quarterly dividend on its common shares over the past three years.
| Year Ended December 31, | |||||||||||||||||||||||||||||||||||||||||
| Projected 2020 | 2019 | 2018 | 2017 | ||||||||||||||||||||||||||||||||||||||
| Quarterly dividend by annual year | $ | 0.1875 | $ | 0.1725 | $ | 0.1600 | $ | 0.1500 |
Shareholders’ equity was $7.3 billion at December 31, 2019, compared with $5.4 billion at December 31, 2018, an increase of $1.9 billion or 35%. During the twelve months since December 31, 2018, shareholders’ equity was increased by $1.5 billion of after-tax unrealized gains as well as $761 million of net income during this period. Shareholders' equity was reduced by $350 million in share purchases under the repurchase program and an additional $109 million in share purchases to offset the dilution from stock option exercises.
We plan to use excess cash available at the Parent Company as efficiently as possible in the future. Possible uses of excess cash flow include, but are not limited to, share repurchases, acquisitions, increases in shareholder dividends, investment in securities, or repayment of short-term debt. We will determine the best use of excess cash
GL 2019 FORM 10-K
GLOBE LIFE INC.
Management's Discussion & Analysis
after ensuring that targeted capital levels are maintained in our insurance subsidiaries. If market conditions are favorable, we currently expect that share repurchases will continue to be a primary use of those funds.
We maintain a significant available-for-sale fixed maturity portfolio to support our insurance policy liabilities. Current accounting guidance requires that we revalue our portfolio to fair market value at the end of each accounting period. The period-to-period changes in fair value, net of their associated impact on deferred acquisition costs and income tax, are reflected directly in shareholders’ equity. Changes in the fair value of the portfolio can result from changes in interest rates and liquidity in financial markets. While a majority of invested assets are revalued, accounting rules do not permit interest-bearing insurance policy liabilities to be valued at fair value in a consistent manner as that of assets, with changes in value applied directly to shareholders’ equity.
Due to the size of our policy liabilities in relation to our shareholders’ equity, this inconsistency in measurement usually has a material impact on the reported value of shareholders’ equity. Fluctuations in interest rates cause undue volatility in the period-to-period presentation of our shareholders’ equity, capital structure, and financial ratios which would be essentially removed if interest-bearing liabilities were valued in the same manner as assets. From time to time, the market value of our fixed maturity portfolio may be depressed as a result of bond market illiquidity which could result in a significant decrease in shareholders’ equity. Due to the long-term nature of our fixed maturities and liabilities and the strong cash flows consistently generated by our insurance subsidiaries, we have the intent and ability to hold our securities to maturity. As such, we do not expect to incur losses due to fluctuations in market value of fixed maturities caused by interest rate changes and temporarily illiquid markets. Accordingly, our management, credit rating agencies, lenders, many industry analysts, and certain other financial statement users prefer to remove the effect of this accounting rule when analyzing our balance sheet, capital structure, and financial ratios.
The following table presents selected data related to our capital resources. Additionally, the table presents the effect of this accounting guidance on relevant line items, so that investors and other financial statement users may determine its impact on Globe Life's capital structure. Excluding the effect of unrealized gains and losses on the fixed maturity portfolio from shareholders' equity is considered non-GAAP. Below we include the reconciliation to GAAP.
Selected Financial Data
(Dollar amounts in thousands, except per share data)
| At | |||||||||||||||||||||||||||||||||||||||||||||||||||||||||||||||||
| December 31, 2019 | December 31, 2018 | December 31, 2017 | |||||||||||||||||||||||||||||||||||||||||||||||||||||||||||||||
| GAAP | Effect of Accounting Rule Requiring Revaluation(1) | GAAP | Effect of Accounting Rule Requiring Revaluation(1) | GAAP | Effect of Accounting Rule Requiring Revaluation(1) | ||||||||||||||||||||||||||||||||||||||||||||||||||||||||||||
| Fixed maturities | $ | 18,907,147 | $ | 2,491,371 | $ | 16,297,932 | $ | 544,461 | $ | 16,969,325 | $ | 1,974,224 | |||||||||||||||||||||||||||||||||||||||||||||||||||||
| Deferred acquisition costs(2) | 4,341,941 | (7,488) | 4,137,925 | (5,270) | 3,958,063 | (10,819) | |||||||||||||||||||||||||||||||||||||||||||||||||||||||||||
| Total assets | 25,977,460 | 2,483,883 | 23,095,722 | 539,191 | 23,474,985 | 1,963,405 | |||||||||||||||||||||||||||||||||||||||||||||||||||||||||||
| Short-term debt | 298,738 | — | 307,848 | — | 328,067 | — | |||||||||||||||||||||||||||||||||||||||||||||||||||||||||||
| Long-term debt | 1,348,988 | — | 1,357,185 | — | 1,132,201 | — | |||||||||||||||||||||||||||||||||||||||||||||||||||||||||||
| Shareholders' equity | 7,294,307 | 1,962,268 | 5,415,177 | 425,961 | 6,231,421 | 1,551,090 | |||||||||||||||||||||||||||||||||||||||||||||||||||||||||||
| Book value per diluted share | 66.02 | 17.76 | 48.11 | 3.79 | 52.95 | 13.18 | |||||||||||||||||||||||||||||||||||||||||||||||||||||||||||
| Debt to capitalization(3) | 18.4 | % | (5.2) | % | 23.5 | % | (1.5) | % | 19.0 | % | (4.8) | % | |||||||||||||||||||||||||||||||||||||||||||||||||||||
| Diluted shares outstanding | 110,494 | 112,561 | 117,696 | ||||||||||||||||||||||||||||||||||||||||||||||||||||||||||||||
| Actual shares outstanding | 107,720 | 110,693 | 114,593 |
(1)Amount added to (deducted from) comprehensive income to produce the stated GAAP item, per accounting rule ASC 320-10-35-1.
(2)Includes the value of business acquired (VOBA).
(3)Globe Life's debt covenants require that the effect of this accounting rule be removed to determine this ratio. This ratio is computed by dividing total debt by the sum of total debt and shareholders’ equity.
GL 2019 FORM 10-K
GLOBE LIFE INC.
Management's Discussion & Analysis
Financial Strength Ratings. The financial strength of our major insurance subsidiaries is rated by Standard & Poor’s and A. M. Best. The following table presents these ratings for our five largest insurance subsidiaries at December 31, 2019.
| Standard & Poor’s | A.M. Best | ||||||||||
| Liberty National Life Insurance Company | AA- | A+ (Superior) | |||||||||
| Globe Life And Accident Insurance Company | AA- | A+ (Superior) | |||||||||
| United American Insurance Company | AA- | A+ (Superior) | |||||||||
| American Income Life Insurance Company | AA- | A+ (Superior) | |||||||||
| Family Heritage Life Insurance Company of America | NR | A+ (Superior) |
A.M. Best states that it assigns an A+ (Superior) rating to insurance companies that have, in its opinion, a superior ability to meet their ongoing insurance obligations.
The AA financial strength rating category is assigned by Standard & Poor’s Corporation (S&P) to those insurers which have very strong capacity to meet its financial commitments which differs from the highest-rated insurers only to a small degree. An insurer rated A has strong capacity to meet its financial commitments but it is somewhat more susceptible to the adverse effects of changes in circumstances and economic conditions than insurers in higher-rated categories. The plus sign (+) or minus sign (-) shows the relative standing within the major rating category.
OTHER ITEMS
Litigation. For more information concerning litigation, please refer to Note 6—Commitments and Contingencies.
CRITICAL ACCOUNTING POLICIES
Future Policy Benefits. Due to the long-term nature of insurance contracts, our insurance companies are liable for policy benefit payments that will be made in the future. The liability for future policy benefits is determined by standard actuarial procedures common to the life insurance industry. The accounting policies for determining this liability are disclosed in Note 1—Significant Accounting Policies.
Approximately 89% of our liabilities for future policy benefits at December 31, 2019 were traditional insurance liabilities where the liability is determined as the present value of future benefits less the present value of the portion of the gross premium required to pay for such benefits. The assumptions used in estimating the future benefits for this portion of business are set at the time of contract issue. These assumptions are “locked in” and are not revised for the lifetime of the contracts, except where there is a premium deficiency, as defined in Note 1—Significant Accounting Policies under the caption Future Policy Benefits. Otherwise, variability in the accrual of policy reserve liabilities after policy issuance is caused only by variability of the inventory of in force policies.
The remaining portion of liabilities for future policy benefits pertains to business accounted for as deposit business, where the recorded liability is the fund balance attributable to the benefit of policyholders as determined by the policy contract at the consolidated financial statement date. Accordingly, there are no assumptions used to determine the future policy benefit liability for deposit business.
Deferred Acquisition Costs. Certain costs of acquiring new business are deferred and recorded as an asset. Deferred acquisition costs consist primarily of sales commissions and other underwriting costs such as advertising related to the successful issuance of a new insurance contract as indicated in Note 1—Significant Accounting Policies under the caption Deferred Acquisition Costs in the Notes to Consolidated Financial Statements. Additionally, the cost of acquiring blocks of insurance business or insurance business through the purchase of other companies, known as the value of insurance acquired (VOBA), is included in deferred acquisition costs. Our policies for accounting for deferred acquisition costs and the associated amortization are reported under the same caption in Note 1—Significant Accounting Policies.
GL 2019 FORM 10-K
GLOBE LIFE INC.
Management's Discussion & Analysis
Over 99% of our recorded amounts for deferred acquisition costs at December 31, 2019 were related to traditional products and are being amortized over the premium-paying period in proportion to the present value of actual historic and estimated future gross premiums. The projection assumptions for this business are set at the time of contract issue. These assumptions are “locked-in” at that time and, except where there is a loss recognition issue, are not revised for the lifetime of the contracts. Absent a premium deficiency, variability in amortization after policy issuance is caused only by variability in premium volume. We have not recorded a deferred acquisition cost loss recognition event for assets related to this business for any period in the three years ended December 31, 2019.
Less than 1% of deferred acquisition costs pertain to deposit business for which deferred acquisition costs are amortized over the estimated lives of the contracts.
Policy Claims and Other Benefits Payable. This liability consists of known benefits currently payable and an estimate of claims that have been incurred but not yet reported to us. The estimate of unreported claims is based on prior experience and is made after careful evaluation of all information available to us. However, the factors upon which these estimates are based can be subject to change from historical patterns. Factors involved include the litigation environment, regulatory mandates, and the introduction of policy types for which claim patterns are not well established, and medical trend rates and medical cost inflation as they affect our health claims. Changes in these estimates, if any, are reflected in the earnings of the period in which the adjustment is made. The Company concludes that the estimates used to produce the liability for claims and other benefits, including the estimate of unsubmitted claims, are the most appropriate under the circumstances. However, there is no certainty that the resulting stated liability will be our ultimate obligation. At this time, we do not expect any change in this estimate to have a material impact on earnings or financial position consistent with our historical experience.
Valuation of Fixed Maturities. We hold a substantial investment in high-quality fixed maturities to provide for the funding of our future policy contractual obligations over long periods of time. While these securities are generally expected to be held to maturity, they are classified as available for sale and are sold from time to time, primarily to manage risk. We report this portfolio at fair value. Fair value is the price that we would expect to receive upon sale of the asset in an orderly transaction. The fair value of the fixed maturity portfolio is primarily affected by changes in interest rates in financial markets. Because of the size of our fixed maturity portfolio and the long average life, small changes in rates can have a significant effect on the portfolio and the reported financial position of the Company. This impact is disclosed in 100 basis point increments under the caption Market Risk Sensitivity in this report. However, as discussed under the caption Financial Condition in this report, the Company regards these unrealized fluctuations in value as having no meaningful impact on our actual financial condition and, as such, we remove them from consideration when viewing our financial position and financial ratios.
At times, the values of our fixed maturities can also be affected by illiquidity in the financial markets. Illiquidity would contribute to a spread widening, and accordingly to unrealized losses, on many securities that we would expect to be fully recoverable. Even though our fixed maturity portfolio is available for sale, we have the ability and intent to hold the securities until maturity as a result of our strong and stable cash flows generated from our insurance products. Considerable information concerning the policies, procedures, classification levels, and other relevant data concerning the valuation of our fixed maturity investments is presented in Note 1—Significant Accounting Policies and in Note 4—Investments under the captions Fair Value Measurements in both notes.
Impairment of Investments. We continually monitor our investment portfolio for investments where fair value has declined below carrying value and that have become impaired in value. While the values of the investments in our portfolio constantly fluctuate due to market conditions, an other-than-temporary impairment charge is recorded only when a security has experienced a decline in fair market value which is deemed to be other than temporary. The policies and procedures that we use to evaluate and account for impairments of investments are disclosed in Note 1—Significant Accounting Policies and the discussions under the captions Investments and Realized Gains and Losses in this report. While every effort is made to make the best estimate of status and value with the information available regarding an other-than-temporary impairment, it is difficult to predict the future prospects of a distressed or impaired security.
GL 2019 FORM 10-K
GLOBE LIFE INC.
Management's Discussion & Analysis
Defined benefit pension plans. We maintain funded defined benefit plans covering most full-time employees. We also have an unfunded nonqualified defined benefit plan covering certain key and other employees. Our obligations under these plans are determined actuarially based on specified actuarial assumptions. In accordance with GAAP, an expense is recorded each year as these pension obligations grow due to the increase in the service period of employees and the interest cost associated with the passage of time. These obligations are offset, at least in part, by the growth in value of the assets in the funded plans. At December 31, 2019, our gross liability under these plans was $665 million, but was offset by assets of $469 million.
The actuarial assumptions used in determining our obligations for pensions include employee mortality and turnover, retirement age, the expected return on plan assets, projected salary increases, and the discount rate at which future obligations could be settled. These assumptions have an important effect on the pension obligation. A decrease in the discount rate or rate of return on plan assets will cause an increase in the pension obligation. A decrease in projected salary increases will cause a decrease in this obligation. Small changes in assumptions may cause significant differences in reported results for these plans. For example, a sensitivity analysis is presented below for the impact of change in the discount rate and the long-term rate of return on assets assumed on our defined benefit pension plans expense for the year 2019 and projected benefit obligation as of December 31, 2019.
Pension Assumptions
(Dollar amounts in thousands)
| Assumption | Change(1) | Impact on Expense | Impact on Projected Benefit Obligation | |||||||||||||||||
| Discount Rate(2): | ||||||||||||||||||||
| Increase | 25 | $ | (3,369) | $ | (25,800) | |||||||||||||||
| Decrease | (25) | 3,564 | 27,419 | |||||||||||||||||
| Expected Return(3): | ||||||||||||||||||||
| Increase | 25 | (1,108) | — | |||||||||||||||||
| Decrease | (25) | 1,108 | — |
(1)In basis points.
(2)The discount rate for determining the net periodic benefit cost was 4.37% for 2019. The discount rate used for determining the projected benefit obligation as of December 31, 2019 was 3.49%.
(3)The expected long-term return rate assumed was 6.72%.
The Company determines mortality assumptions through the use of published mortality tables that reflect broad-based studies of mortality and published longevity improvement scales.
The criteria used to determine the primary assumptions are discussed in Note 9—Postretirement Benefits. While we have used our best efforts to determine the most reliable assumptions, given the information available from Company experience, economic data, independent consultants and other sources, we cannot be certain that actual results will be the same as expected. The assumptions are reviewed annually and revised, if necessary, based on more current information available to us. Note 9—Postretirement Benefits also contains information about pension plan assets, investment policies, and other related data.
GL 2019 FORM 10-K
GLOBE LIFE INC.
Management's Discussion & Analysis
Previous: Item 6. Selected Financial Data · Next: Item 7A. Quantitative and Qualitative Disclosures about Market Risk