 filings.tools
Item 2. Management's Discussion and Analysis of Financial Condition and Results of Operations
130K characters. Original on sec.gov · Markdown
Item 2. Management's Discussion and Analysis of Financial Condition and Results of Operations
The following discussion should be read in conjunction with Globe Life's Condensed Consolidated Financial Statements and Notes thereto appearing elsewhere in this report.
"Globe Life" and the "Company" refer to Globe Life Inc. and its subsidiaries and affiliates.
Results of Operations
 | How Globe Life Views Its Operations. Globe Life Inc. is the holding company for a group of insurance companies that market primarily individual life and supplemental health insurance to lower middle to middle income households throughout the United States. We view our operations by segments, which are the insurance product lines of life, supplemental health, and annuities, and the investment segment that supports the product lines. Segments are aligned based on their common characteristics, comparability of the profit margins, and management techniques used to operate each segment. | |||||||
 | Insurance Product Line Segments. The insurance product line segments involve the marketing, underwriting, and administration of policies. Each product line is further segmented by the various distribution channels that market the insurance policies. Each distribution channel operates in a niche market offering insurance products designed for that particular market. Whether analyzing profitability of a segment as a whole, or the individual distribution channels within the segment, the measure of profitability used by management is the underwriting margin, as seen below: | |||||||
| Premium revenue (Policy obligations) (Policy acquisition costs and commissions) Underwriting margin | ||||||||
 | Investment Segment. The investment segment involves the management of our capital resources, including investments and the management of corporate debt and liquidity. Our measure of profitability for the investment segment is excess investment income, as seen below: | |||||||
| Net investment income (Required interest on net policy liabilities) (Financing costs) Excess investment income |
GL Q3 2021 FORM 10-Q
GLOBE LIFE INC.
Management's Discussion & Analysis
Current Highlights, comparing year-to-date 2021 with 2020.
-
Net income as a return on equity (ROE) for the nine months ended September 30, 2021 was 8.9% and net operating income as an ROE, excluding net unrealized gains on the fixed maturity portfolio(1) was 12.5%.
-
Total premium increased 7% over the same period in the prior year. Life premium increased 9% for the period from $2.0 billion in 2020 to $2.2 billion in 2021. Life underwriting margin declined 7% from $511 million in 2020 to $477 million in 2021.
-
Net investment income increased 3% over the same period in the prior year. Excess investment income declined 2% below the prior year.
-
Total net sales increased 9% over the same period in the prior year from $473 million to $518 million.
-
Book value per share increased 9% over the same period in the prior year from $77.60 to $84.52. Book value per share, excluding net unrealized gains on the fixed maturity portfolio(1), increased 9% over the prior year from $52.39 to $57.11.
-
The Company incurred $82 million of COVID-19 net life claims (net of reserves released upon death) for the nine months ended September 30, 2021 compared with $40 million during the same period last year.
-
For the nine months ended September 30, 2021, the Company repurchased 3.2 million shares of Globe Life Inc. common stock at a total cost of $310 million for an average share price of $97.17.
The following graphs represent net income and net operating income for the nine months ended September 30, 2021 and 2020.
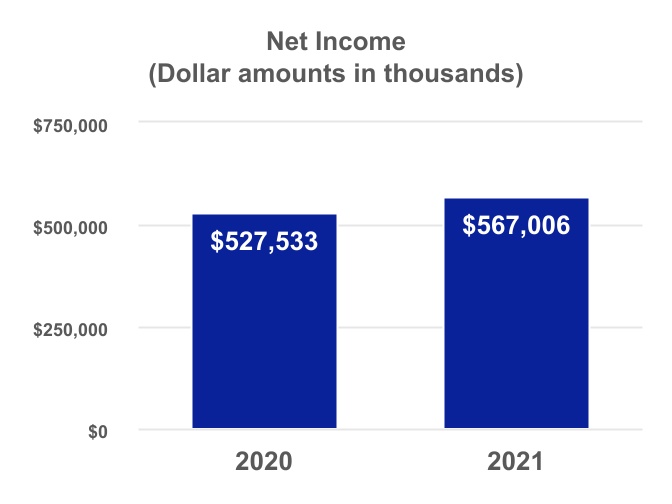
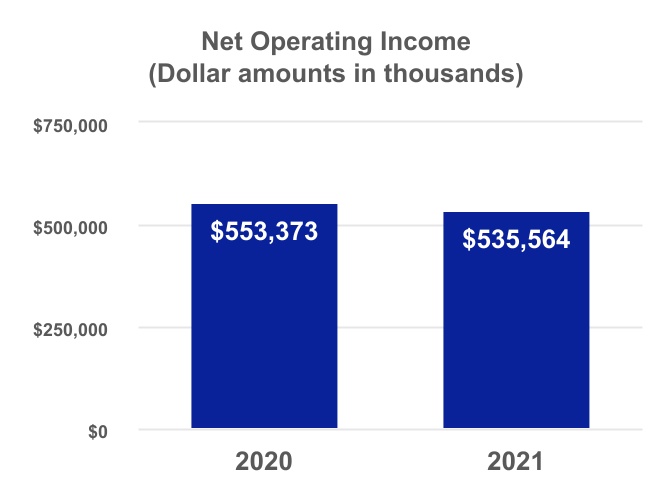
As shown in the charts above, net operating income is the consolidated total of segment profits after tax and as such is considered a non-GAAP measure. It has been used consistently by Globe Life's management for many years to evaluate the operating performance of the Company. It differs from net income primarily because it excludes certain non-operating items such as realized gains and losses and certain significant and unusual items included in net income. Net income is the most directly comparable GAAP measure.
(1) Net operating income as an ROE, excluding net unrealized gains on the fixed maturity portfolio, is considered a non-GAAP measure. Management utilizes this measure to view the business without the effect of the net unrealized gains, which are primarily attributable to fluctuation in interest rates on the available-for-sale portfolio. The impact of the adjustment to exclude net unrealized gains on fixed maturities, net of tax is $2.8 billion and $2.7 billion for the nine months ended September 30, 2021 and 2020, respectively.
Book value per share, excluding net unrealized gains on the fixed maturity portfolio, is also considered a non-GAAP measure. Management utilizes this measure to view the book value of the business without the effect of net unrealized gains, which are primarily attributable to fluctuation in interest rates on the available for sale portfolio. The impact of the adjustment to exclude net unrealized gains on fixed maturities is $27.41 and $25.21 for nine months ended September 30, 2021 and 2020, respectively.
Refer to Analysis of Profitability by Segment for non-GAAP reconciliation to GAAP.
GL Q3 2021 FORM 10-Q
GLOBE LIFE INC.
Management's Discussion & Analysis
Summary of Operations. Net income increased 7% to $567 million during the nine months ended September 30, 2021, compared with $528 million in the same period in 2020. This increase was primarily attributed to $45 million of after tax realized gains on investments in the current period, as compared to $22 million of after tax realized losses on investments in the year-ago period. See further discussion under the caption Investments. The increase in after tax realized gains was partially offset by lower life underwriting results due to higher COVID-19 net life claims. On a diluted per common share basis, net income per common share for the nine months ended September 30, 2021 increased 11% from $4.90 to $5.46.
Net operating income is the consolidated total of segment profits after-tax and as such is considered a non-GAAP measure. Net operating income declined 3% to $536 million for the nine months ended September 30, 2021, compared with $553 million for the same period in 2020 primarily due to COVID-19 net life claims. On a diluted per common share basis, net operating income per common share for the nine months ended September 30, 2021 increased from $5.14 to $5.16.
Despite headwinds with COVID-19, the Company continues to see positive signs in its core operations, including strong sales, favorable persistency and a strong ROE, excluding net unrealized gains on the fixed maturity portfolio.
COVID-19. For the nine months ended September 30, 2021, the Company incurred $82 million of COVID-19 net life claims of which $33 million were incurred in the third quarter. The third quarter COVID-19 net life claims were higher than anticipated primarily due to the impact of the Delta variant, which resulted in higher infection rates and death totals than forecasted. Per the Centers for Disease Control and Prevention (CDC), there were approximately 95,000 U.S. COVID-19 deaths in the third quarter. Compared to prior quarters, the COVID-19 deaths were concentrated in geographies and younger age groups where the Company has greater risk exposure. As such, the Company’s level of COVID-19 net life claims increased in the quarter to approximately $3.5 million per 10,000 U.S. deaths, up from an average of approximately $2 million per 10,000 U.S. deaths incurred in prior periods. While changes in the average age of deaths from COVID-19 and the geographies where these deaths occur will affect this ratio, we anticipate this level of losses per U.S. deaths to continue through the fourth quarter and be in the range of $3 million to $4 million per 10,000 U.S. deaths in 2022.
For the full year and at the mid-point of our guidance, we estimate COVID-19 net life claims will be between $110 million to $125 million based on an estimate of approximately 75,000 to 125,000 U.S. COVID-19 deaths in the fourth quarter. This estimate of U.S. deaths is based on various third-party models. The projected life claims are dependent on this estimate and many other variables, including, but not limited to, the timing and availability of effective treatments for the disease, vaccination rates, and effectiveness of vaccines, impact from potential variants, and the actual ages and geographic areas in which infections and deaths occur.
GL Q3 2021 FORM 10-Q
GLOBE LIFE INC.
Management's Discussion & Analysis
Globe Life's operations on a segment-by-segment basis are discussed in depth below. Net operating income has been used consistently by management for many years to evaluate the operating performance of the Company, and is a measure commonly used in the life insurance industry. It differs from GAAP net income primarily because it excludes certain non-operating items such as realized gains and losses and other significant and unusual items included in net income. Management believes an analysis of net operating income is important in understanding the profitability and operating trends of the Company’s business. Net income is the most directly comparable GAAP measure.
Analysis of Profitability by Segment
(Dollar amounts in thousands)
| Nine Months Ended September 30, | |||||||||||||||||||||||
| 2021 | 2020 | Change | % | ||||||||||||||||||||
| Life insurance underwriting margin | $ | 477,395 | $ | 511,205 | $ | (33,810) | (7) | ||||||||||||||||
| Health insurance underwriting margin | 223,619 | 200,565 | 23,054 | 11 | |||||||||||||||||||
| Annuity underwriting margin | 6,541 | 6,788 | (247) | (4) | |||||||||||||||||||
| Excess investment income | 179,737 | 183,200 | (3,463) | (2) | |||||||||||||||||||
| Other insurance: | |||||||||||||||||||||||
| Other income | 1,004 | 1,021 | (17) | (2) | |||||||||||||||||||
| Administrative expense | (201,715) | (188,194) | (13,521) | 7 | |||||||||||||||||||
| Corporate and other | (31,549) | (34,191) | 2,642 | (8) | |||||||||||||||||||
| Pre-tax total | 655,032 | 680,394 | (25,362) | (4) | |||||||||||||||||||
| Applicable taxes | (119,468) | (127,021) | 7,553 | (6) | |||||||||||||||||||
| Net operating income | 535,564 | 553,373 | (17,809) | (3) | |||||||||||||||||||
| Reconciling items, net of tax: | |||||||||||||||||||||||
| Realized gain (loss)—investments | 44,714 | (21,936) | 66,650 | ||||||||||||||||||||
| Realized loss—redemption of debt | (7,358) | (501) | (6,857) | ||||||||||||||||||||
| Non-operating expenses | (1,894) | (816) | (1,078) | ||||||||||||||||||||
| Legal proceedings | (4,020) | (2,587) | (1,433) | ||||||||||||||||||||
| Net income | $ | 567,006 | $ | 527,533 | $ | 39,473 | 7 |
GL Q3 2021 FORM 10-Q
GLOBE LIFE INC.
Management's Discussion & Analysis
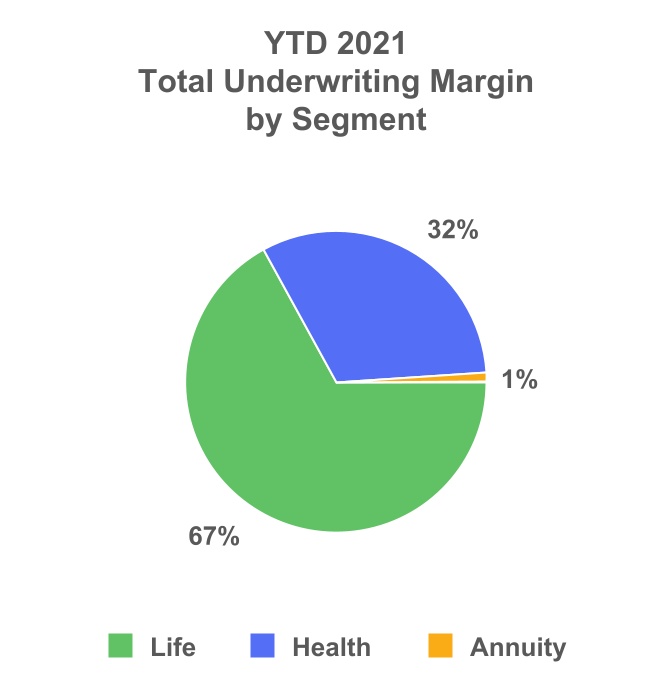
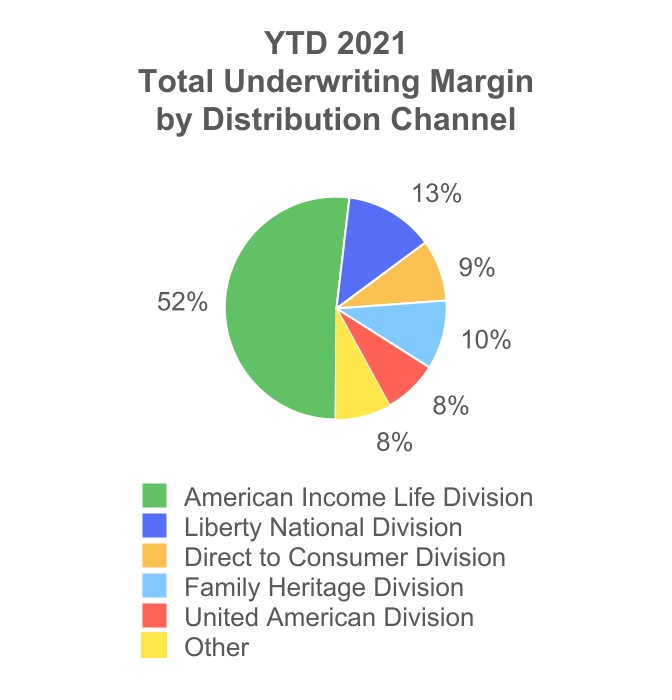
In 2021, the largest contributor of total underwriting margin was the life insurance segment and the primary distribution channel was American Income Life Division. The following charts represent the breakdown of total underwriting margin by operating segment and distribution channel for the nine months ended September 30, 2021.
Total premium income rose 7% for the nine months ended September 30, 2021 to $3.1 billion. Total net sales increased 9% to $518 million, when compared with the same period in 2020. Total first-year collected premium (defined in the following section) was $435 million for the 2021 period, compared with $405 million for the 2020 period.
Life insurance premium income increased 9% to $2.2 billion over the prior year total of $2.0 billion. Life net sales rose 11% to $392 million for the first nine months of 2021. First-year collected life premium rose 16% to $318 million. Life underwriting margins, as a percent of premium, declined to 22% in 2021 from 26% in the prior year. Underwriting margin declined to $477 million for the nine months ended September 30, 2021, 7% below the same period in 2020. The decline in the life underwriting margin is primarily due to an estimated $82 million of COVID-19 net life claims incurred during the first nine months of 2021 versus $40 million during the same period in 2020.
Health insurance premium income increased 4% to $889 million over the prior year total of $851 million. Health net sales rose 4% to $125 million for the first nine months of 2021. First-year collected health premium fell 11% to $118 million. Health underwriting margins, as a percent of premium, increased to 25% in 2021 compared with 24% in 2020. Health underwriting margin increased to $224 million for the first nine months of 2021, 11% over the same period in 2020.
Excess investment income, the measure of profitability of our investment segment, declined 2% during 2021 to $180 million from $183 million in the same period in 2020. Excess investment income per common share, reflecting the impact of our share repurchase program, increased 2% to $1.73 from $1.70 when compared with the same period in 2020.
Insurance administrative expenses increased 7% in 2021 when compared with the prior year period. These expenses were 6.6% as a percent of premium during the first nine months of 2021 and 2020.
For the nine months ended September 30, 2021, the Company repurchased 3.2 million Globe Life Inc. shares at a total cost of $310 million for an average share price of $97.17.
GL Q3 2021 FORM 10-Q
GLOBE LIFE INC.
Management's Discussion & Analysis
The discussions of our segments are presented in the manner we view our operations, as described in Note 10—Business Segments.
We use three statistical measures as indicators of premium growth and sales over the near term: “annualized premium in force,” “net sales,” and “first-year collected premium.”
-
Annualized premium in force is defined as the premium income that would be received over the following twelve months at any given date on all active policies if those policies remain in force throughout the twelve-month period. Annualized premium in force is an indicator of potential growth in premium revenue.
-
Net sales, a statistical performance measure, is calculated as annualized premium issued, net of cancellations in the first thirty days after issue, except in the case of Direct to Consumer, where net sales is annualized premium issued at the time the first full premium is paid after any introductory offer period has expired. Management considers net sales to be a better indicator of the rate of premium growth than annualized premium issued.
-
First-year collected premium is defined as the premium collected during the reporting period for all policies in their first policy year. First-year collected premium takes lapses into account in the first year when lapses are more likely to occur, and thus is a useful indicator of how much new premium is expected to be added to premium income in the future.
See further discussion of the distribution channels below for Life and Health.
GL Q3 2021 FORM 10-Q
GLOBE LIFE INC.
Management's Discussion & Analysis
LIFE INSURANCE
Life insurance is the Company's predominant segment. During 2021, life premium represented 71% of total premium and life underwriting margin represented 67% of the total. Additionally, investments supporting the reserves for life products produce the majority of excess investment income attributable to the investment segment.
The following table presents the summary of results of life insurance. Further discussion of the results by distribution channel is included below.
Life Insurance
Summary of Results
(Dollar amounts in thousands)
| Nine Months Ended September 30, | Change | ||||||||||||||||||||||||||||||||||
| 2021 | 2020 | ||||||||||||||||||||||||||||||||||
| Amount | % of Premium | Amount | % of Premium | Amount | % | ||||||||||||||||||||||||||||||
| Premium and policy charges | $ | 2,165,213 | 100 | $ | 1,994,473 | 100 | $ | 170,740 | 9 | ||||||||||||||||||||||||||
| Policy obligations | 1,532,298 | 71 | 1,340,746 | 67 | 191,552 | 14 | |||||||||||||||||||||||||||||
| Required interest on reserves | (547,715) | (25) | (520,207) | (26) | (27,508) | 5 | |||||||||||||||||||||||||||||
| Net policy obligations | 984,583 | 46 | 820,539 | 41 | 164,044 | 20 | |||||||||||||||||||||||||||||
| Commissions, premium taxes, and non-deferred acquisition expenses | 174,130 | 8 | 159,369 | 8 | 14,761 | 9 | |||||||||||||||||||||||||||||
| Amortization of acquisition costs | 529,105 | 24 | 503,360 | 25 | 25,745 | 5 | |||||||||||||||||||||||||||||
| Total expense | 1,687,818 | 78 | 1,483,268 | 74 | 204,550 | 14 | |||||||||||||||||||||||||||||
| Insurance underwriting margin | $ | 477,395 | 22 | $ | 511,205 | 26 | $ | (33,810) | (7) |
The lower life insurance underwriting margins for the nine months ended September 30, 2021 are primarily attributed to the increase in COVID-19 net life claims in the current year. The Company incurred $82 million for the nine months ended September 30, 2021, compared with $40 million at the same time in the prior year.
The following table presents Globe Life's life insurance premium by distribution channel.
Life Insurance
Premium by Distribution Channel
(Dollar amounts in thousands)
| Nine Months Ended September 30, | Increase (Decrease) | ||||||||||||||||||||||||||||||||||
| 2021 | 2020 | ||||||||||||||||||||||||||||||||||
| Amount | % of Total | Amount | % of Total | Amount | % | ||||||||||||||||||||||||||||||
| American Income | $ | 1,039,047 | 48 | $ | 930,444 | 47 | $ | 108,603 | 12 | ||||||||||||||||||||||||||
| Direct to Consumer | 734,046 | 34 | 682,978 | 34 | 51,068 | 7 | |||||||||||||||||||||||||||||
| Liberty National | 232,118 | 11 | 220,009 | 11 | 12,109 | 6 | |||||||||||||||||||||||||||||
| Other | 160,002 | 7 | 161,042 | 8 | (1,040) | (1) | |||||||||||||||||||||||||||||
| Total | $ | 2,165,213 | 100 | $ | 1,994,473 | 100 | $ | 170,740 | 9 |
Annualized life premium in force was $2.91 billion at September 30, 2021, an increase of 7% over $2.72 billion a year earlier.
GL Q3 2021 FORM 10-Q
Globe Life Inc.
Management's Discussion & Analysis
An analysis of life net sales, an indicator of new business production, by distribution channel is presented below.
Life Insurance
Net Sales by Distribution Channel
(Dollar amounts in thousands)
| Nine Months Ended September 30, | Increase (Decrease) | ||||||||||||||||||||||||||||||||||
| 2021 | 2020 | ||||||||||||||||||||||||||||||||||
| Amount | % of Total | Amount | % of Total | Amount | % | ||||||||||||||||||||||||||||||
| American Income | $ | 216,505 | 55 | $ | 182,091 | 52 | $ | 34,414 | 19 | ||||||||||||||||||||||||||
| Direct to Consumer | 115,041 | 29 | 126,196 | 36 | (11,155) | (9) | |||||||||||||||||||||||||||||
| Liberty National | 52,357 | 14 | 36,866 | 10 | 15,491 | 42 | |||||||||||||||||||||||||||||
| Other | 8,361 | 2 | 7,688 | 2 | 673 | 9 | |||||||||||||||||||||||||||||
| Total | $ | 392,264 | 100 | $ | 352,841 | 100 | $ | 39,423 | 11 |
First-year collected life premium by distribution channel is presented in the table below.
Life Insurance
First-Year Collected Premium by Distribution Channel
(Dollar amounts in thousands)
| Nine Months Ended September 30, | Increase (Decrease) | ||||||||||||||||||||||||||||||||||
| 2021 | 2020 | ||||||||||||||||||||||||||||||||||
| Amount | % of Total | Amount | % of Total | Amount | % | ||||||||||||||||||||||||||||||
| American Income | $ | 186,143 | 59 | $ | 157,178 | 57 | $ | 28,965 | 18 | ||||||||||||||||||||||||||
| Direct to Consumer | 87,135 | 27 | 76,193 | 28 | 10,942 | 14 | |||||||||||||||||||||||||||||
| Liberty National | 36,984 | 12 | 31,953 | 12 | 5,031 | 16 | |||||||||||||||||||||||||||||
| Other | 7,262 | 2 | 7,817 | 3 | (555) | (7) | |||||||||||||||||||||||||||||
| Total | $ | 317,524 | 100 | $ | 273,141 | 100 | $ | 44,383 | 16 |
A discussion of life operations by distribution channel follows.
The American Income Life Division markets to members of labor unions and continues to diversify its lead sources by building relationships with other affinity groups, utilizing third-party internet vendor leads, and obtaining referrals to facilitate sustainable growth. This division is Globe Life's largest contributor to life premium of any distribution channel at 48% of the Company's September 30, 2021 total. Net sales increased 19% to $217 million during the first nine months of 2021 compared with $182 million in 2020 for the same period. The underwriting margin, as a percent of premium, was 31% for the nine months ended September 30, 2021, down from 32% in the year-ago period. The lower underwriting margin was primarily due to higher policy obligations as a result of the pandemic including higher policy obligations due to lower policy lapses.
This division incurred $19 million in COVID-19 net life claims, representing approximately 2% of premium, for the nine months ended September 30, 2021 compared with $11 million in COVID-19 net life claims during the year-ago period. The underwriting margin as a percent of premium, at the mid-point of our full year 2021 guidance, is expected to slightly decrease from prior year as result of higher policy obligations due to the pandemic.
This division is anticipating an increase in net sales for the full year 2021 as compared with 2020. Sales growth in our exclusive agencies is generally dependent on growth in the size of the agency force.
GL Q3 2021 FORM 10-Q
Globe Life Inc.
Management's Discussion & Analysis
Below is the average producing agent count at the end of the period for the American Income Life Division. The average producing agent count is based on the actual count at the end of each week during the year. While the average producing agent count for the nine months ended September 30, 2021 is up substantially from the same period in the prior year, we believe this growth will moderate going forward. Over the past quarter, the agency saw lower new agent recruiting as many new work opportunities became available in this current economy. With the attractiveness of selling products virtually, we believe we will see an increase in agent counts even as COVID-19 moderates.
| At September 30, | Change | ||||||||||||||||||||||
| 2021 | 2020 | Amount | % | ||||||||||||||||||||
| American Income | 10,118 | 8,437 | 1,681 | 20 | |||||||||||||||||||
American Income Life continues to focus on growing and strengthening the agency force, specifically through emphasis on agency middle-management growth and additional agency office openings. In addition to offering financial incentives and training opportunities, the agency has made considerable investments in information technology, including launching a customer relationship management (CRM) tool for the agency force. This tool is designed to drive productivity in lead distribution, conservation of business, manager dash boards and new agent recruiting. Additionally, this division has invested in and successfully implemented technology that allows the agency force to engage in virtual recruiting, training and sales activity. Over the past year and through the pandemic, the agents have shifted to primarily a virtual experience with the customers and have generated 80-85% of its sales through virtual presentations. We find this flexibility to be enticing for new recruits as well as a driver of sustainability for our agency force.
The Direct to Consumer Division (DTC) offers adult and juvenile life insurance through a variety of marketing approaches, including direct mail, insert media, and electronic media. In recent years, electronic media production has grown rapidly as management has aggressively increased marketing activities related to internet and mobile technology as well as focused on driving traffic to our inbound call center. The different approaches support and complement one another in the division's efforts to reach the consumer. The DTC's long-term growth has been fueled by constant innovation and name recognition. We continually introduce new initiatives in this division in an attempt to increase response rates.
While the juvenile market is an important source of sales, it also is a vehicle to reach the parents and grandparents of juvenile policyholders, who are more likely to respond favorably to a DTC solicitation for life coverage on themselves in comparison to the general adult population. Also, both juvenile policyholders and their parents are low acquisition-cost targets for sales of additional coverage over time.
DTC net sales declined 9% to $115 million for the nine months ended September 30, 2021 compared with $126 million for the same period in the prior year, primarily due to the record high net life sales in the prior year at the onset of the pandemic. While we expect continued strong sales due to the heightened awareness as to the benefits of life insurance, we anticipate sales levels over the remainder of 2021 will be lower than the same period in 2020. The lower sales for the nine months ended September 30, 2021 compared with the same period in 2020 are reflective of record high sales during 2020 due to unprecedented demand and lower response rates in 2021. Despite the lower sales in 2021 compared with 2020, we still expect our full year sales to be approximately 19% over 2019 levels. We expect favorable persistency to continue over the remainder of this year, leading to higher premiums.
DTC incurred $42 million of COVID-19 net life claims, representing approximately 6% of premium, for the nine months ended September 30, 2021 compared with $22 million for the same period in 2020. DTC’s underwriting margin, as a percent of premium, was 8% for the nine months ended September 30, 2021, which was lower than the 15% result during the same period in 2020 primarily due to higher COVID-19 net life claims in the current period. Additionally, this division will see a decrease in underwriting margin as a percent of premium for the full year 2021 due to higher policy obligations incurred as a result of higher persistency and higher non-COVID-19 net life claims.
GL Q3 2021 FORM 10-Q
Globe Life Inc.
Management's Discussion & Analysis
The Liberty National Division markets individual life insurance to middle-income household and worksite customers. Recent investments in new sales technologies as well as recent growth in middle management within the agency are expected to help continue this growth. The underwriting margin as a percent of premium was 18% for the nine months ended September 30, 2021, down from 24% during the same period a year ago. The decrease is primarily attributable to higher policy obligations during the nine months ended September 30, 2021 as a result of the COVID-19 pandemic compared with the same period a year ago. This division incurred $18 million of COVID-19 net life claims, representing approximately 8% of premium, for the nine months ended September 30, 2021 compared with $6 million for the same period in 2020. With the division's ability to return to face-to-face customer interaction and the option of virtual sales, the Company is projecting total net life sales to increase for the full year 2021 as compared to the prior year. However, due to increased policy obligations expected to be incurred associated with the pandemic, we anticipate the underwriting margin, as a percent of premium, to be lower for the full year 2021 as compared to 2020.
Below is the average producing agent count at the end of the period for Liberty National Division. As the division gains momentum in the virtual sales environment, the agency should see an increase in recruiting of new agents and an increase in the average producing agent count.
| At September 30, | Change | ||||||||||||||||||||||
| 2021 | 2020 | Amount | % | ||||||||||||||||||||
| Liberty National | 2,713 | 2,531 | 182 | 7 |
The Liberty National Division average producing agent count increased 7% over the prior year comparable period. We continue to execute our long-term plan to grow this agency through expansion from small-town markets in the Southeast to more densely populated areas with larger pools of potential agent recruits and customers. Continued geographic expansion of this agency's presence into more heavily populated, less-penetrated areas will help create long-term agency growth. Additionally, the agency continues to help improve the ability of agents to develop new worksite marketing business. Systems that have been put in place, including the addition of a customer relationship management (CRM) platform and enhanced analytical capabilities, have helped the agents develop additional worksite marketing opportunities as well as improve the productivity of agents selling in the individual life market. Sales were hindered in the first half of 2020 due to difficulties in agents transitioning to a virtual work environment after the onset of the COVID-19 lockdown, as well as mandatory shut-downs of non-essential small businesses which hindered the ability of the division’s agents to prospect at the worksite.
The Other Agencies distribution channels primarily include non-exclusive independent agencies. The Other Agencies contributed $160 million of life premium income, or 7% of Globe Life's total premium income in the nine months ended September 30, 2021, and contributed 2% of net sales for the period.
HEALTH INSURANCE
Health insurance sold by the Company primarily includes Medicare Supplement insurance, accident coverage, and other limited-benefit supplemental health products including cancer, critical illness, heart, and intensive care coverage.
Health premium accounted for 29% of our total premium in the first nine months of 2021, while the health underwriting margin accounted for 32% of total underwriting margin. Health underwriting margin increased 11% to $224 million primarily due to lower policy obligations. The Company continues to emphasize life insurance sales relative to health due to life’s superior long-term profitability and its greater contribution to excess investment income.
GL Q3 2021 FORM 10-Q
Globe Life Inc.
Management's Discussion & Analysis
The following table presents underwriting margin data for health insurance.
Health Insurance
Summary of Results
(Dollar amounts in thousands)
| Nine Months Ended September 30, | Change | ||||||||||||||||||||||||||||||||||
| 2021 | 2020 | ||||||||||||||||||||||||||||||||||
| Amount | % of Premium | Amount | % of Premium | Amount | % | ||||||||||||||||||||||||||||||
| Premium | $ | 888,902 | 100 | $ | 850,877 | 100 | $ | 38,025 | 4 | ||||||||||||||||||||||||||
| Policy obligations | 564,589 | 64 | 546,444 | 64 | 18,145 | 3 | |||||||||||||||||||||||||||||
| Required interest on reserves | (76,288) | (9) | (69,131) | (8) | (7,157) | 10 | |||||||||||||||||||||||||||||
| Net policy obligations | 488,301 | 55 | 477,313 | 56 | 10,988 | 2 | |||||||||||||||||||||||||||||
| Commissions, premium taxes, and non-deferred acquisition expenses | 70,602 | 8 | 70,304 | 8 | 298 | — | |||||||||||||||||||||||||||||
| Amortization of acquisition costs | 106,380 | 12 | 102,695 | 12 | 3,685 | 4 | |||||||||||||||||||||||||||||
| Total expense | 665,283 | 75 | 650,312 | 76 | 14,971 | 2 | |||||||||||||||||||||||||||||
| Insurance underwriting margin | $ | 223,619 | 25 | $ | 200,565 | 24 | $ | 23,054 | 11 |
Globe Life markets supplemental health insurance products through a number of distribution channels. The following table is an analysis of our health premium by distribution channel.
Health Insurance
Premium by Distribution Channel
(Dollar amounts in thousands)
| Nine Months Ended September 30, | Increase (Decrease) | ||||||||||||||||||||||||||||||||||
| 2021 | 2020 | ||||||||||||||||||||||||||||||||||
| Amount | % of Total | Amount | % of Total | Amount | % | ||||||||||||||||||||||||||||||
| United American | $ | 351,544 | 39 | $ | 337,269 | 39 | $ | 14,275 | 4 | ||||||||||||||||||||||||||
| Family Heritage | 255,272 | 29 | 235,195 | 28 | 20,077 | 9 | |||||||||||||||||||||||||||||
| Liberty National | 140,874 | 16 | 142,230 | 17 | (1,356) | (1) | |||||||||||||||||||||||||||||
| American Income | 85,210 | 10 | 78,310 | 9 | 6,900 | 9 | |||||||||||||||||||||||||||||
| Direct to Consumer | 56,002 | 6 | 57,873 | 7 | (1,871) | (3) | |||||||||||||||||||||||||||||
| Total | $ | 888,902 | 100 | $ | 850,877 | 100 | $ | 38,025 | 4 |
Premium related to limited-benefit plans comprise $467 million, or 53%, of the total health premiums, for 2021 compared with $437 million in the same period in the prior year. Premium from Medicare Supplement products comprises the remaining $422 million, or 47% for 2021 compared with $414 million, or 49% in the same period in the prior year.
Annualized health premium in force was $1.27 billion at September 30, 2021, an increase of 8% over $1.17 billion a year earlier.
GL Q3 2021 FORM 10-Q
Globe Life Inc.
Management's Discussion & Analysis
Presented below is a table of health net sales by distribution channel.
Health Insurance
Net Sales by Distribution Channel
(Dollar amounts in thousands)
| Nine Months Ended September 30, | Increase (Decrease) | ||||||||||||||||||||||||||||||||||
| 2021 | 2020 | ||||||||||||||||||||||||||||||||||
| Amount | % of Total | Amount | % of Total | Amount | % | ||||||||||||||||||||||||||||||
| United American | $ | 36,876 | 30 | $ | 39,335 | 33 | $ | (2,459) | (6) | ||||||||||||||||||||||||||
| Family Heritage | 54,111 | 43 | 49,314 | 41 | 4,797 | 10 | |||||||||||||||||||||||||||||
| Liberty National | 18,943 | 15 | 15,820 | 13 | 3,123 | 20 | |||||||||||||||||||||||||||||
| American Income | 13,777 | 11 | 14,580 | 12 | (803) | (6) | |||||||||||||||||||||||||||||
| Direct to Consumer | 1,707 | 1 | 1,608 | 1 | 99 | 6 | |||||||||||||||||||||||||||||
| Total | $ | 125,414 | 100 | $ | 120,657 | 100 | $ | 4,757 | 4 |
Health net sales related to limited-benefit plans comprise $87 million, or 70%, of the total health net sales, for 2021, compared with $80 million in the same period in the prior year. Medicare Supplement sales make up the remaining $38 million, or 30% for 2021, compared with $41 million, or 34% in the same period in the prior year.
The following table presents health insurance first-year collected premium by distribution channel.
Health Insurance
First-Year Collected Premium by Distribution Channel
(Dollar amounts in thousands)
| Nine Months Ended September 30, | Increase (Decrease) | ||||||||||||||||||||||||||||||||||
| 2021 | 2020 | ||||||||||||||||||||||||||||||||||
| Amount | % of Total | Amount | % of Total | Amount | % | ||||||||||||||||||||||||||||||
| United American | $ | 43,038 | 37 | $ | 59,948 | 45 | $ | (16,910) | (28) | ||||||||||||||||||||||||||
| Family Heritage | 42,835 | 36 | 40,425 | 31 | 2,410 | 6 | |||||||||||||||||||||||||||||
| Liberty National | 15,049 | 13 | 15,399 | 12 | (350) | (2) | |||||||||||||||||||||||||||||
| American Income | 14,220 | 12 | 13,859 | 10 | 361 | 3 | |||||||||||||||||||||||||||||
| Direct to Consumer | 2,376 | 2 | 2,256 | 2 | 120 | 5 | |||||||||||||||||||||||||||||
| Total | $ | 117,518 | 100 | $ | 131,887 | 100 | $ | (14,369) | (11) |
First-year collected premium related to limited-benefit plans comprises $73 million, or 62%, of total first-year collected premium, for 2021 compared with $70 million in the same period in the prior year. First-year collected premium from Medicare Supplement policies makes up the remaining $45 million, or 38% for 2021, compared with $62 million, or 47% in the same period in the prior year.
A discussion of health operations by distribution channel follows.
The United American Division consists of non-exclusive independent agencies who may also sell for other companies. The United American Division was Globe Life's largest health agency in terms of health premium income.
This division is also Globe Life's largest producer of Medicare Supplement insurance. The United American Division represents 82% of all Medicare Supplement premium and 96% of Medicare Supplement net sales. For the nine months ended September 30, 2021, Medicare Supplement premium in this agency rose 4% to $344 million in 2021 over the prior period total of $330 million. Medicare Supplement net sales declined 7% to $37 million in 2021 from the prior year period, primarily as a result of a decrease in individual sales. Underwriting margin as a percent of premium was 15% for the nine months ended September 30, 2021, up from 14% in 2020.
GL Q3 2021 FORM 10-Q
Globe Life Inc.
Management's Discussion & Analysis
As discussed in Note 1—Significant Accounting Policies, the Company acquired Beazley Benefits, now rebranded as Globe Life Benefits, on August 1, 2021. This distribution channel will enhance the Company's presence in the worksite market by offering group supplemental health insurance solutions to employer groups through brokers. While the acquisition had an immaterial impact on year to date results, we are optimistic about Globe Life Benefits' ability to contribute additional health premium and profits in the future. Operating results for Globe Life Benefits will be included as part of United American Division results.
The Family Heritage Division primarily markets limited-benefit supplemental health insurance in non-urban areas. Most of its policies include a cash-back feature, such as a return of premium, where any excess of premiums over claims paid is returned to the policyholder at the end of a specified period stated within the insurance policy. Underwriting margin as a percent of premium was 27% for the nine months ended September 30, 2021, up from 26% in the year-ago period primarily due to favorable claims experience.
The division experienced a 10% increase in net health sales as compared with the nine-month period a year ago, primarily due to an increase in agent productivity and training. The division will continue to launch incentive programs to help drive an increase in productivity and the number of producing agents.
Below is the average producing agent count at the end of the period for the Family Heritage Division. While the agency has seen a decrease in agent count as compared with 2020, we anticipate that as COVID-19 and the job economy stabilize, agent recruitment opportunities should increase.
| At September 30, | Change | ||||||||||||||||||||||
| 2021 | 2020 | Amount | % | ||||||||||||||||||||
| Family Heritage Division | 1,219 | 1,282 | (63) | (5) |
The Liberty National Division represented 16% of all Globe Life health premium income for the nine-month period ended September 30, 2021. The Liberty National Division markets limited-benefit supplemental health products consisting primarily of critical illness insurance. Much of this health business is now generated through worksite marketing targeting small businesses of 10 to 100 employees. Health premium at Liberty National Division was $141 million for the nine months ended September 30, 2021, down from $142 million in the year ago period. We anticipate an increase in net health sales in 2021 at this division as the Company has been more able to interact face-to-face with customers than in 2020.
Other distribution. While some of the Company's other distribution channels market health products, their main emphasis is on life insurance. On a combined basis, they accounted for 16% of health premium in 2021 and 16% in 2020. The American Income Life Division primarily markets accident plans. The Direct to Consumer Division primarily markets Medicare Supplements to employer or union-sponsored groups. The Direct to Consumer Division net health sales were $2 million for the nine months ended September 30, 2021 and 2020.
ANNUITIES
Annuities represent an insignificant part of our business. We do not currently market stand-alone fixed or deferred annuity products, favoring instead protection-oriented life and supplemental health insurance products.
GL Q3 2021 FORM 10-Q
Globe Life Inc.
Management's Discussion & Analysis
INVESTMENTS
We manage our capital resources including investments, debt, and cash flow through the investment segment. Excess investment income represents the profit margin attributable to investment operations and is the measure that we use to evaluate the performance of the investment segment as described in Note 10—Business Segments. It is defined as net investment income less both the required interest on net insurance policy liabilities and the interest cost associated with capital funding or “financing costs.”
Management also views excess investment income per diluted common share as an important and useful measure to evaluate the performance of the investment segment. It is defined as excess investment income divided by the total diluted weighted average shares outstanding, representing the contribution by the investment segment to the consolidated earnings per share of the Company. Since implementing our share repurchase program in 1986, we have used $8.5 billion of excess cash flow at the Parent Company to repurchase Globe Life Inc. common shares after determining that the repurchases provided a greater risk adjusted after-tax return than other investment alternatives. If we had not used this excess cash to repurchase shares, but had instead invested it in interest-bearing assets, we would have earned more investment income and had more shares outstanding. As excess investment income per diluted common share incorporates all capital resources, we view excess investment income per diluted share as a useful measure to evaluate the investment segment.
Excess Investment Income**.** The following table summarizes Globe Life's investment income, excess investment income, and excess investment income per diluted common share.
Analysis of Excess Investment Income
(Dollar amounts in thousands, except for per share data)
| Nine Months Ended September 30, | Change | ||||||||||||||||||||||
| 2021 | 2020 | Amount | % | ||||||||||||||||||||
| Net investment income | $ | 713,103 | $ | 691,991 | $ | 21,112 | 3 | ||||||||||||||||
| Interest on net insurance policy liabilities: | |||||||||||||||||||||||
| Interest on reserves | (654,058) | (620,473) | (33,585) | 5 | |||||||||||||||||||
| Interest on deferred acquisition costs | 184,525 | 176,977 | 7,548 | 4 | |||||||||||||||||||
| Net required interest | (469,533) | (443,496) | (26,037) | 6 | |||||||||||||||||||
| Financing costs | (63,833) | (65,295) | 1,462 | (2) | |||||||||||||||||||
| Excess investment income | $ | 179,737 | $ | 183,200 | $ | (3,463) | (2) | ||||||||||||||||
| Excess investment income per diluted share | $ | 1.73 | $ | 1.70 | $ | 0.03 | 2 | ||||||||||||||||
| Mean invested assets (at amortized cost) | $ | 18,846,801 | $ | 17,855,428 | $ | 991,373 | 6 | ||||||||||||||||
| Average net insurance policy liabilities(1) | 10,897,593 | 10,395,811 | 501,782 | 5 | |||||||||||||||||||
| Average debt and preferred securities (at amortized cost) | 2,060,672 | 1,841,942 | 218,730 | 12 |
(1)Net of deferred acquisition costs, excluding the associated unrealized gains and losses thereon.
Excess investment income declined $3 million, or 2%, compared with the year-ago period. Excess investment income per diluted common share was $1.73 for the nine months ended September 30, 2021 an increase of 2% over the prior year period . Excess investment income per diluted common share generally increases at a faster pace than excess investment income because the number of diluted shares outstanding generally decreases from year to year as a result of our share repurchase program.
Net investment income for the nine months ended September 30, 2021 was $713 million or 3% greater than the year-ago period. Mean invested assets increased 6% during the first nine months of 2021 over the same period last year. The effective annual yield rate earned on the fixed maturity portfolio was 5.23% in the first nine months of 2021, compared with 5.35% a year earlier. Growth in net investment income has been negatively impacted in recent years by the low interest rate environment during which time we have invested new money at yields lower than our
GL Q3 2021 FORM 10-Q
Globe Life Inc.
Management's Discussion & Analysis
average portfolio yield. In addition, we have reinvested the proceeds from bonds that matured, were called, or were otherwise disposed of at yield rates less than what we earned on these bonds before their maturity or disposition. We currently expect that the average annual turnover rate of fixed maturity assets will be less than 2% over the next five years and will not have a material negative impact on net investment income. To help mitigate the decline of the portfolio yield over the past few years, the Company has decreased the portion of the investment portfolio allocated to fixed maturity investments by investing in limited partnerships with debt like characteristics that diversify risk and enhance risk adjusted capital adjusted returns on the portfolio. The earned yield on the investment funds for the nine months ended September 30, 2021 was 5.31%. See additional information in Note 4—Investments.
Should the current low interest rate environment continue, the growth of the Company's net investment income will continue to be negatively impacted primarily due to the investment of new money and proceeds from dispositions at rates less than the average portfolio yield rate. While net investment income would grow, it would continue to grow at rates less than the growth in mean invested assets. For the full year 2021, we currently anticipate the average new money yield on our fixed maturity acquisitions to be approximately 30 basis points lower than the rate applicable to our 2020 acquisitions.
Should interest rates, especially long-term rates, rise, Globe Life's net investment income would benefit due to higher interest rates on new investments. While such a rise in interest rates could adversely affect the fair value of the fixed maturities portfolio, we could withstand an increase in interest rates of approximately 145 to 150 basis points before the net unrealized gains on our fixed maturity portfolio as of September 30, 2021 would be eliminated. Should interest rates increase further, we would not be concerned with potential interest rate driven unrealized losses in our fixed maturity portfolio because we do not intend to sell, nor is it likely that management will be required to sell, the fixed maturities prior to their anticipated recovery.
Required interest on net insurance policy liabilities reduces net investment income, as it is the amount of net investment income considered by management necessary to “fund” required interest on net insurance policy liabilities, which is the net of the benefit reserve liability and the deferred acquisition cost asset. As such, it is removed from the investment segment and applied to the insurance segments to offset the effect of the required interest from the insurance segments. As discussed in Note 10—Business Segments, management regards this as a more meaningful analysis of the investment and insurance segments. Required interest is based on the actuarial interest assumptions used in discounting the benefit reserve liability and the amortization of deferred acquisition costs for our insurance policies in force.
The great majority of our life and health insurance policies are fixed interest rate protection policies, not investment products, and are accounted for under current GAAP accounting guidance for long-duration insurance products which mandate that interest rate assumptions for a particular block of business be “locked in” for the life of that block of business. Each calendar year, we set the discount rate to be used to calculate the benefit reserve liability and the amortization of the deferred acquisition cost asset for all insurance policies issued that year. That rate is based on the new money yields that we expect to earn on cash flow received in the future from policies of that issue year, and cannot be changed. The discount rate used for policies issued in the current year has no impact on the in force policies issued in prior years as the rates of all prior issue years are also locked in. As such, the overall discount rate for the entire in force block of 5.7% is a weighted average of the discount rates being used from all issue years. Changes in the overall weighted-average discount rate over time are caused by changes in the mix of the reserves and the deferred acquisition cost asset by issue year on the entire block of in force business. Business issued in the current year has very little impact on the overall weighted-average discount rate due to the size of our in force business.
Since actuarial discount rates are locked in for life on essentially all of our business, benefit reserves and deferred acquisition costs are not affected by interest rate fluctuations unless a loss recognition event occurs. Due to the strength of our underwriting margins, we do not expect an extended low interest rate environment will cause a loss recognition event.
In comparison to the year-ago period, required interest on net insurance policy liabilities increased $26 million, or 6%, to $470 million, compared with the 5% growth in average net interest-bearing insurance policy liabilities.
GL Q3 2021 FORM 10-Q
Globe Life Inc.
Management's Discussion & Analysis
Financing costs for the investment segment consist primarily of interest on our various debt instruments. The table below presents the components of financing costs and reconciles interest expense per the Condensed Consolidated Statements of Operations**.
Analysis of Financing Costs
(Dollar amounts in thousands)
| Nine Months Ended September 30, | Increase (Decrease) | ||||||||||||||||||||||
| 2021 | 2020 | Amount | % | ||||||||||||||||||||
| Interest on funded debt | $ | 59,556 | $ | 53,444 | $ | 6,112 | 11 | ||||||||||||||||
| Interest on term loans | — | 4,193 | (4,193) | (100) | |||||||||||||||||||
| Interest on short-term debt | 4,257 | 7,633 | (3,376) | (44) | |||||||||||||||||||
| Other | 20 | 25 | (5) | (20) | |||||||||||||||||||
| Financing costs | $ | 63,833 | $ | 65,295 | $ | (1,462) | (2) |
During the first nine months of 2021, financing costs decreased 2% compared with the prior year primarily due to lower rates on the short-term debt. The interest on funded debt was higher than prior year as a result of the 2.15% Senior Note issued in August 2020. The debt proceeds were used, in part, to redeem all the outstanding term loans. As discussed in Note 9—Debt, on June 14, 2021, Globe Life Inc. issued $325 million of 4.25% Junior Subordinated Debentures due 2061. The net proceeds from the sale of the Junior Subordinated Debentures were used to redeem the $300 million 6.125% Junior Subordinated Debentures due 2056 on July 15, 2021. The net increase in interest on funded debt was more than offset by lower interest rates on the short-term debt. More information on our debt transactions is disclosed in the Financial Condition section of this report.
GL Q3 2021 FORM 10-Q
Globe Life Inc.
Management's Discussion & Analysis
Realized Gains and Losses. Our core business of providing insurance coverage requires us to maintain a large and diverse investment portfolio to support our insurance liabilities. From time to time, investments are sold or called, or experience a credit loss event, each of which results in a realized gain or loss. The Company also elects to measure its investment in certain limited partnerships at fair value in accordance with the fair value option for financial instruments with changes recognized in "Realized gains (losses)" in the Condensed Consolidated Statements of Operations**.
Realized gains and losses can be significant in relation to the earnings from core insurance operations, and as a result, can have a material positive or negative impact on net income. The significant fluctuations caused by gains and losses can cause period-to-period trends of net income that are not indicative of historical core operating results or predictive of the future trends of core operations. Accordingly, they have no bearing on core insurance operations or segment results as we view operations. For these reasons, and in line with industry practice, we remove the effects of realized gains and losses when evaluating overall insurance operating results. The following table summarizes our tax-effected realized gains (losses) by component.
Analysis of Realized Gains (Losses), Net of Tax
(Dollar amounts in thousands, except for per share data)
| Nine Months Ended September 30, | |||||||||||||||||||||||
| 2021 | 2020 | ||||||||||||||||||||||
| Amount | Per Share | Amount | Per Share | ||||||||||||||||||||
| Fixed maturities: | |||||||||||||||||||||||
| Sales | $ | (8,424) | $ | (0.08) | $ | (28,844) | $ | (0.27) | |||||||||||||||
| Matured or other redemptions(1) | 34,161 | 0.33 | 7,702 | 0.07 | |||||||||||||||||||
| Provision for credit losses | 2,643 | 0.02 | (3,466) | (0.03) | |||||||||||||||||||
| Fair value option—change in fair value | 11,070 | 0.11 | (5,370) | (0.05) | |||||||||||||||||||
| Other | 5,264 | 0.05 | 8,042 | 0.08 | |||||||||||||||||||
| Total realized gains (losses)—investments | 44,714 | 0.43 | (21,936) | (0.20) | |||||||||||||||||||
| Loss on redemption of debt | (7,358) | (0.07) | (501) | (0.01) | |||||||||||||||||||
| Total realized gains (losses) | $ | 37,356 | $ | 0.36 | $ | (22,437) | $ | (0.21) |
(1)During the nine months ended September 30, 2021 and 2020, the Company recorded $108.3 million and $152.1 million of exchanges of fixed maturity securities (noncash transactions) that resulted in $19.9 million and $6.2 million, respectively in realized gains, net of tax.
GL Q3 2021 FORM 10-Q
Globe Life Inc.
Management's Discussion & Analysis
Investment Acquisitions**.** Globe Life's investment policy calls for investing primarily in investment grade fixed maturities that meet our quality and yield objectives. We generally prefer to invest in securities with longer maturities because they more closely match the long-term nature of our policy liabilities. We believe this strategy is appropriate since our expected future cash flows are generally stable and predictable and the likelihood that we will need to sell invested assets to raise cash is low. If longer-term securities that meet our quality and yield objectives are not available, we do not compromise on our quality objectives; instead, we consider investing in shorter-term or lower-yielding securities taking into consideration the slope of the yield curve and other factors such as risk adjusted capital adjusted returns.
The following table summarizes selected information for fixed maturity investments. The effective annual yield shown is based on the acquisition price and call features, if any, of the securities. For non-callable bonds, the yield is calculated to maturity date. For callable bonds acquired at a premium, the yield is calculated to the earliest known call date and call price after acquisition ("first call date"). For all other callable bonds, the yield is calculated to maturity date.
Fixed Maturity Acquisitions Selected Information
(Dollar amounts in thousands)
| Nine Months Ended September 30, | |||||||||||
| 2021 | 2020 | ||||||||||
| Cost of acquisitions: | |||||||||||
| Investment-grade corporate securities | $ | 490,169 | $ | 532,529 | |||||||
| Investment-grade municipal securities | 239,754 | 345,011 | |||||||||
| Other investment-grade securities | 10,465 | 27,831 | |||||||||
| Total fixed maturity acquisitions**(1)** | $ | 740,388 | $ | 905,371 | |||||||
| Effective annual yield (one year compounded)(2) | 3.36 | % | 3.81 | % | |||||||
| Average life (in years, to next call) | 25.0 | 16.5 | |||||||||
| Average life (in years, to maturity) | 32.0 | 26.2 | |||||||||
| Average rating | A+ | A |
(1)Fixed maturity acquisitions included unsettled trades of $52 million in 2021 and $0 in 2020.
(2)Tax-equivalent basis, where the yield on tax-exempt securities is adjusted to produce a yield equivalent to the pretax yield on taxable securities.
For investments in callable bonds, the actual life of the investment will depend on whether the issuer calls the investment prior to the maturity date. Given our investments in callable bonds, the actual average life of our investments cannot be known at the time of the investment. Absent sales and "make-whole calls", however, the average life will not be less than the average life to next call and will not exceed the average life to maturity. Data for both of these average life measures is provided in the above chart.
Acquisitions in both periods consisted primarily of corporate and municipal bonds with securities spanning a diversified range of issuers, industry sectors, and geographical regions. In the first nine months of 2021, we invested primarily in the industrial, municipal, and financial sectors. For the entire portfolio, the taxable equivalent effective yield earned was 5.23%, down approximately 12 basis points from the yield in the first nine months of 2020. As previously noted in the discussion of net investment income, the decrease was primarily due to the combination of lower interest rates applicable to new purchases and fixed maturity dispositions. For the remainder of 2021, the Company will continue to execute on its existing strategy by seeking to invest in assets that satisfy our quality and other objectives, while maximizing the highest risk adjusted capital adjusted return.
GL Q3 2021 FORM 10-Q
Globe Life Inc.
Management's Discussion & Analysis
In 2017, it was announced by the head of the United Kingdom's Financial Conduct Authority of its plan to phase out the floating rate, London Interbank Offered Rate (LIBOR). The rate will transition out from 2021 to mid-year 2023. As of September 30, 2021, the Company had limited assets and liabilities that utilize LIBOR as a benchmark rate. We will continue to monitor the progress toward the establishment of a new floating rate.
Since fixed maturities represent such a significant portion of our investment portfolio, the remainder of the discussion of portfolio composition will focus on fixed maturities. See a breakdown of the Company's Other long-term investments in Note 4—Investments.
Selected information concerning the fixed maturity portfolio is as follows:
Fixed Maturity Portfolio Selected Information
| At | |||||||||||||||||
| September 30, 2021 | December 31, 2020 | September 30, 2020 | |||||||||||||||
| Average annual effective yield(1) | 5.20% | 5.28% | 5.32% | ||||||||||||||
| Average life, in years, to: | |||||||||||||||||
| Next call(2) | 15.9 | 16.2 | 16.4 | ||||||||||||||
| Maturity(2) | 19.0 | 19.0 | 19.1 | ||||||||||||||
| Effective duration to: | |||||||||||||||||
| Next call(2,3) | 10.8 | 11.0 | 10.9 | ||||||||||||||
| Maturity(2,3) | 12.1 | 12.3 | 12.1 |
(1)Tax-equivalent basis. The yield on tax-exempt securities is adjusted to produce a yield equivalent to the pretax yield on taxable securities.
(2)Globe Life calculates the average life and duration of the fixed maturity portfolio two ways:
(a) based on the next call date which is the next call date for callable bonds and the maturity date for noncallable bonds, and
(b) based on the maturity date of all bonds, whether callable or not.
(3)Effective duration is a measure of the price sensitivity of a fixed-income security to a 1% change in interest rates.
GL Q3 2021 FORM 10-Q
Globe Life Inc.
Management's Discussion & Analysis
Credit Risk Sensitivity*.* The following tables summarize certain information about the major corporate sectors and security types held in our fixed maturity portfolio at September 30, 2021 and December 31, 2020.
Fixed Maturities by Sector
September 30, 2021
(Dollar amounts in thousands)
| Below Investment Grade | Total Fixed Maturities | % of Total Fixed Maturities | ||||||||||||||||||||||||||||||||||||
| Amortized Cost, net | Gross Unrealized Gains | Gross Unrealized Losses | Fair Value | Amortized Cost, net | Gross Unrealized Gains | Gross Unrealized Losses | Fair Value | At Amortized Cost, net | At Fair Value | |||||||||||||||||||||||||||||
| Corporates: | ||||||||||||||||||||||||||||||||||||||
| Financial | ||||||||||||||||||||||||||||||||||||||
| Insurance - life, health, P&C | $ | 57,518 | $ | 3,488 | $ | (5,970) | $ | 55,036 | $ | 2,334,750 | $ | 522,364 | $ | (7,373) | $ | 2,849,741 | 13 | 13 | ||||||||||||||||||||
| Banks | 26,988 | 648 | — | 27,636 | 969,030 | 213,106 | (1,903) | 1,180,233 | 6 | 6 | ||||||||||||||||||||||||||||
| Other financial | 98,180 | 674 | (696) | 98,158 | 1,259,954 | 191,951 | (3,198) | 1,448,707 | 7 | 7 | ||||||||||||||||||||||||||||
| Total financial | 182,686 | 4,810 | (6,666) | 180,830 | 4,563,734 | 927,421 | (12,474) | 5,478,681 | 26 | 26 | ||||||||||||||||||||||||||||
| Utilities | ||||||||||||||||||||||||||||||||||||||
| Electric | 49,351 | 5,950 | — | 55,301 | 1,392,055 | 397,858 | (255) | 1,789,658 | 8 | 9 | ||||||||||||||||||||||||||||
| Gas and water | — | — | — | — | 543,434 | 111,424 | (733) | 654,125 | 3 | 3 | ||||||||||||||||||||||||||||
| Total utilities | 49,351 | 5,950 | — | 55,301 | 1,935,489 | 509,282 | (988) | 2,443,783 | 11 | 12 | ||||||||||||||||||||||||||||
| Industrial - Energy | ||||||||||||||||||||||||||||||||||||||
| Pipelines | 85,249 | 7,924 | (1,220) | 91,953 | 919,696 | 212,509 | (1,226) | 1,130,979 | 5 | 5 | ||||||||||||||||||||||||||||
| Exploration and production | 100,681 | 20,831 | — | 121,512 | 544,565 | 113,079 | (905) | 656,739 | 3 | 3 | ||||||||||||||||||||||||||||
| Oil field services | — | — | — | — | 49,783 | 13,905 | — | 63,688 | — | — | ||||||||||||||||||||||||||||
| Refiner | — | — | — | — | 89,119 | 25,406 | — | 114,525 | 1 | 1 | ||||||||||||||||||||||||||||
| Driller | — | — | — | — | — | — | — | — | — | — | ||||||||||||||||||||||||||||
| Total energy | 185,930 | 28,755 | (1,220) | 213,465 | 1,603,163 | 364,899 | (2,131) | 1,965,931 | 9 | 9 | ||||||||||||||||||||||||||||
| Industrial - Basic materials | ||||||||||||||||||||||||||||||||||||||
| Chemicals | — | — | — | — | 673,914 | 141,633 | (203) | 815,344 | 4 | 4 | ||||||||||||||||||||||||||||
| Metals and mining | — | — | — | — | 406,085 | 123,781 | — | 529,866 | 2 | 3 | ||||||||||||||||||||||||||||
| Forestry products and paper | — | — | — | — | 65,642 | 16,556 | — | 82,198 | — | — | ||||||||||||||||||||||||||||
| Total basic materials | — | — | — | — | 1,145,641 | 281,970 | (203) | 1,427,408 | 6 | 7 | ||||||||||||||||||||||||||||
| Industrial - Consumer, non-cyclical | 84,191 | 12,900 | (2,379) | 94,712 | 2,248,326 | 469,398 | (3,115) | 2,714,609 | 13 | 13 | ||||||||||||||||||||||||||||
| Other industrials | 25,589 | 3,676 | — | 29,265 | 1,264,882 | 289,300 | (449) | 1,553,733 | 7 | 7 | ||||||||||||||||||||||||||||
| Industrial - Transportation | 25,545 | 5,618 | — | 31,163 | 570,212 | 138,770 | (38) | 708,944 | 3 | 3 | ||||||||||||||||||||||||||||
| Other corporate sectors | 179,453 | 24,038 | (3,428) | 200,063 | 1,638,857 | 282,931 | (11,534) | 1,910,254 | 10 | 9 | ||||||||||||||||||||||||||||
| Total corporates | 732,745 | 85,747 | (13,693) | 804,799 | 14,970,304 | 3,263,971 | (30,932) | 18,203,343 | 85 | 86 | ||||||||||||||||||||||||||||
| Other fixed maturities: | ||||||||||||||||||||||||||||||||||||||
| Government (U.S., municipal, and foreign) | — | — | — | — | 2,509,932 | 287,357 | (12,955) | 2,784,334 | 14 | 13 | ||||||||||||||||||||||||||||
| Collateralized debt obligations | 36,088 | 27,073 | — | 63,161 | 36,088 | 27,073 | — | 63,161 | — | — | ||||||||||||||||||||||||||||
| Other asset-backed securities | 13,618 | — | (736) | 12,882 | 105,430 | 5,030 | (736) | 109,724 | 1 | 1 | ||||||||||||||||||||||||||||
| Mortgage-backed securities(1) | — | — | — | — | 274 | 30 | — | 304 | — | — | ||||||||||||||||||||||||||||
| Total fixed maturities | $ | 782,451 | $ | 112,820 | $ | (14,429) | $ | 880,842 | $ | 17,622,028 | $ | 3,583,461 | $ | (44,623) | $ | 21,160,866 | 100 | 100 |
(1)Includes Government National Mortgage Association (GNMA).
GL Q3 2021 FORM 10-Q
Globe Life Inc.
Management's Discussion & Analysis
Fixed Maturities by Sector
December 31, 2020
(Dollar amounts in thousands)
| Below Investment Grade | Total Fixed Maturities | % of Total Fixed Maturities | ||||||||||||||||||||||||||||||||||||
| Amortized Cost | Gross Unrealized Gains | Gross Unrealized Losses | Fair Value | Amortized Cost | Gross Unrealized Gains | Gross Unrealized Losses | Fair Value | At Amortized Cost | At Fair Value | |||||||||||||||||||||||||||||
| Corporates: | ||||||||||||||||||||||||||||||||||||||
| Financial | ||||||||||||||||||||||||||||||||||||||
| Insurance - life, health, P&C | $ | 57,658 | $ | 3,894 | $ | (10,788) | $ | 50,764 | $ | 2,275,843 | $ | 563,349 | $ | (14,769) | $ | 2,824,423 | 13 | 13 | ||||||||||||||||||||
| Banks | 27,014 | 15 | (456) | 26,573 | 993,946 | 259,489 | (1,050) | 1,252,385 | 6 | 6 | ||||||||||||||||||||||||||||
| Other financial | 114,919 | 271 | (8,245) | 106,945 | 1,134,414 | 193,975 | (8,402) | 1,319,987 | 7 | 6 | ||||||||||||||||||||||||||||
| Total financial | 199,591 | 4,180 | (19,489) | 184,282 | 4,404,203 | 1,016,813 | (24,221) | 5,396,795 | 26 | 25 | ||||||||||||||||||||||||||||
| Utilities | ||||||||||||||||||||||||||||||||||||||
| Electric | 50,663 | 6,289 | — | 56,952 | 1,438,796 | 476,744 | (108) | 1,915,432 | 9 | 9 | ||||||||||||||||||||||||||||
| Gas and water | — | — | — | — | 536,664 | 131,851 | — | 668,515 | 3 | 3 | ||||||||||||||||||||||||||||
| Total utilities | 50,663 | 6,289 | — | 56,952 | 1,975,460 | 608,595 | (108) | 2,583,947 | 12 | 12 | ||||||||||||||||||||||||||||
| Industrial - Energy | ||||||||||||||||||||||||||||||||||||||
| Pipelines | 85,327 | 1,624 | (2,309) | 84,642 | 923,756 | 187,851 | (2,423) | 1,109,184 | 5 | 5 | ||||||||||||||||||||||||||||
| Exploration and production | 104,719 | 5,980 | (678) | 110,021 | 555,796 | 121,940 | (678) | 677,058 | 3 | 3 | ||||||||||||||||||||||||||||
| Oil field services | — | — | — | — | 49,799 | 13,613 | — | 63,412 | — | — | ||||||||||||||||||||||||||||
| Refiner | — | — | — | — | 89,371 | 22,793 | — | 112,164 | 1 | 1 | ||||||||||||||||||||||||||||
| Driller | 1,902 | — | 18 | 1,920 | 1,902 | — | 18 | 1,920 | — | — | ||||||||||||||||||||||||||||
| Total energy | 191,948 | 7,604 | (2,969) | 196,583 | 1,620,624 | 346,197 | (3,083) | 1,963,738 | 9 | 9 | ||||||||||||||||||||||||||||
| Industrial - Basic materials | ||||||||||||||||||||||||||||||||||||||
| Chemicals | — | — | — | — | 642,258 | 152,016 | — | 794,274 | 4 | 4 | ||||||||||||||||||||||||||||
| Metals and mining | — | — | — | — | 406,564 | 144,110 | — | 550,674 | 2 | 3 | ||||||||||||||||||||||||||||
| Forestry products and paper | — | — | — | — | 88,804 | 21,588 | — | 110,392 | 1 | 1 | ||||||||||||||||||||||||||||
| Total basic materials | — | — | — | — | 1,137,626 | 317,714 | — | 1,455,340 | 7 | 8 | ||||||||||||||||||||||||||||
| Industrial - Consumer, non-cyclical | 96,265 | 8,680 | (1,903) | 103,042 | 2,233,324 | 576,007 | (2,070) | 2,807,261 | 13 | 13 | ||||||||||||||||||||||||||||
| Other industrials | 25,661 | 3,925 | — | 29,586 | 1,260,646 | 328,986 | (6) | 1,589,626 | 7 | 7 | ||||||||||||||||||||||||||||
| Industrial - Transportation | 25,777 | 4,315 | — | 30,092 | 566,935 | 175,405 | — | 742,340 | 3 | 3 | ||||||||||||||||||||||||||||
| Other corporate sectors | 179,878 | 17,459 | (3,595) | 193,742 | 1,489,113 | 329,254 | (4,142) | 1,814,225 | 9 | 9 | ||||||||||||||||||||||||||||
| Total corporates | 769,783 | 52,452 | (27,956) | 794,279 | 14,687,931 | 3,698,971 | (33,630) | 18,353,272 | 86 | 86 | ||||||||||||||||||||||||||||
| Other fixed maturities: | ||||||||||||||||||||||||||||||||||||||
| Government (U.S., municipal, and foreign) | — | — | — | — | 2,313,855 | 341,176 | (1,256) | 2,653,775 | 13 | 13 | ||||||||||||||||||||||||||||
| Collateralized debt obligations | 57,007 | 23,460 | (8,869) | 71,598 | 57,007 | 23,460 | (8,869) | 71,598 | — | — | ||||||||||||||||||||||||||||
| Other asset-backed securities | 13,949 | — | (2,727) | 11,222 | 134,616 | 3,591 | (3,778) | 134,429 | 1 | 1 | ||||||||||||||||||||||||||||
| Mortgage-backed securities(1) | — | — | — | — | 390 | 45 | — | 435 | — | — | ||||||||||||||||||||||||||||
| Total fixed maturities | $ | 840,739 | $ | 75,912 | $ | (39,552) | $ | 877,099 | $ | 17,193,799 | $ | 4,067,243 | $ | (47,533) | $ | 21,213,509 | 100 | 100 |
(1)Includes GNMAs.
GL Q3 2021 FORM 10-Q
Globe Life Inc.
Management's Discussion & Analysis
Corporate securities, which consist of bonds and redeemable preferred stocks, were the largest component of the September 30, 2021 fixed maturity portfolio, representing 85% of amortized cost, net and 86% of fair value. The remainder of the portfolio is invested primarily in securities issued by the U.S. government and U.S. municipalities. The Company holds insignificant amounts in foreign government bonds, collateralized debt obligations, asset-backed securities, and mortgage-backed securities. Corporate securities are diversified over a variety of industry sectors and issuers. At September 30, 2021, the total fixed maturity portfolio consisted of 813 issuers.
Fixed maturities had a fair value of $21.2 billion at September 30, 2021 and at December 31, 2020. The net unrealized gain position in the fixed-maturity portfolio decreased from $4.0 billion at December 31, 2020 to $3.5 billion at September 30, 2021 due to an increase in market rates during the period.
For more information about our fixed maturity portfolio by component at September 30, 2021 and December 31, 2020, including a discussion of allowance for credit losses, an analysis of unrealized investment losses and a schedule of maturities, see Note 4—Investments.
An analysis of the fixed maturity portfolio by a composite quality rating at September 30, 2021 and December 31, 2020 is shown in the following tables. The composite rating for each security, other than private-placement securities managed by third parties, is the average of the security’s ratings as assigned by Moody’s Investor Service, Standard & Poor’s, Fitch Ratings, and Dominion Bond Rating Service, LTD. The ratings assigned by these four nationally recognized statistical rating organizations are evenly weighted when calculating the average. The composite quality rating is created utilizing a methodology developed by Globe Life using ratings from the various rating agencies noted above. The composite quality rating is not a Standard & Poor's credit rating. Standard & Poor's does not sponsor, endorse or promote the composite quality rating and shall not be liable for any use of the composite quality rating. Included in the following chart are private placement fixed maturity holdings of $546 million at amortized cost, net of allowance for credit losses ($590 million at fair value) for which the ratings were assigned by the third-party managers.
Fixed Maturities by Rating
At September 30, 2021
(Dollar amounts in thousands)
| Amortized Cost, net | % of Total | Fair Value | % of Total | Average Composite Quality Rating on Amortized Cost, net | |||||||||||||||||||||||||
| Investment grade: | |||||||||||||||||||||||||||||
| AAA | $ | 739,932 | 4 | $ | 843,516 | 4 | |||||||||||||||||||||||
| AA | 2,058,961 | 12 | 2,234,915 | 11 | |||||||||||||||||||||||||
| A | 4,535,387 | 26 | 5,653,568 | 27 | |||||||||||||||||||||||||
| BBB+ | 3,801,497 | 22 | 4,662,298 | 22 | |||||||||||||||||||||||||
| BBB | 4,119,117 | 23 | 4,981,192 | 23 | |||||||||||||||||||||||||
| BBB- | 1,584,683 | 9 | 1,904,535 | 9 | |||||||||||||||||||||||||
| Total investment grade | 16,839,577 | 96 | 20,280,024 | 96 | A- | ||||||||||||||||||||||||
| Below investment grade: | |||||||||||||||||||||||||||||
| BB | 617,790 | 3 | 681,244 | 3 | |||||||||||||||||||||||||
| B | 128,573 | 1 | 136,438 | 1 | |||||||||||||||||||||||||
| Below B | 36,088 | — | 63,160 | — | |||||||||||||||||||||||||
| Total below investment grade | 782,451 | 4 | 880,842 | 4 | BB- | ||||||||||||||||||||||||
| $ | 17,622,028 | 100 | $ | 21,160,866 | 100 | ||||||||||||||||||||||||
| Weighted average composite quality rating | A- |
GL Q3 2021 FORM 10-Q
Globe Life Inc.
Management's Discussion & Analysis
Fixed Maturities by Rating
At December 31, 2020
(Dollar amounts in thousands)
| Amortized Cost | % of Total | Fair Value | % of Total | Average Composite Quality Rating on Amortized Cost | |||||||||||||||||||||||||
| Investment grade: | |||||||||||||||||||||||||||||
| AAA | $ | 713,053 | 4 | $ | 848,621 | 4 | |||||||||||||||||||||||
| AA | 1,657,270 | 10 | 1,873,323 | 9 | |||||||||||||||||||||||||
| A | 4,566,999 | 26 | 5,969,677 | 28 | |||||||||||||||||||||||||
| BBB+ | 3,634,583 | 21 | 4,612,898 | 22 | |||||||||||||||||||||||||
| BBB | 4,137,099 | 24 | 5,088,114 | 24 | |||||||||||||||||||||||||
| BBB- | 1,644,056 | 10 | 1,943,777 | 9 | |||||||||||||||||||||||||
| Total investment grade | 16,353,060 | 95 | 20,336,410 | 96 | A- | ||||||||||||||||||||||||
| Below investment grade: | |||||||||||||||||||||||||||||
| BB | 686,184 | 4 | 692,609 | 3 | |||||||||||||||||||||||||
| B | 115,646 | 1 | 122,104 | 1 | |||||||||||||||||||||||||
| Below B | 38,909 | — | 62,386 | — | |||||||||||||||||||||||||
| Total below investment grade | 840,739 | 5 | 877,099 | 4 | BB- | ||||||||||||||||||||||||
| $ | 17,193,799 | 100 | $ | 21,213,509 | 100 | ||||||||||||||||||||||||
| Weighted average composite quality rating | A- |
The overall quality rating of the portfolio is A-, the same as year-end 2020. Fixed maturities rated BBB are 54% of the total portfolio at September 30, 2021 compared with 55% at year-end 2020. While this ratio is high relative to our peers, we have limited exposure to higher-risk assets such as derivatives, equities, and asset-backed securities. Additionally, the Company does not participate in securities lending and has no off-balance sheet investments as of September 30, 2021. BBB securities generally provide the Company with the best risk adjusted capital adjusted returns, largely due to our unique ability to hold securities to maturity regardless of fluctuations in interest rates or equity markets.
An analysis of changes in our portfolio of below-investment grade fixed maturities at amortized cost, net of allowance for credit losses is as follows:
Below-Investment Grade Fixed Maturities
(Dollar amounts in thousands)
| Nine Months Ended September 30, | |||||||||||
| 2021 | 2020 | ||||||||||
| Balance at beginning of period | $ | 840,739 | $ | 674,155 | |||||||
| Downgrades by rating agencies | — | 225,819 | |||||||||
| Upgrades by rating agencies | — | (10,551) | |||||||||
| Dispositions | (64,030) | (47,943) | |||||||||
| Provision for credit losses | 3,346 | (4,387) | |||||||||
| Amortization and other | 2,396 | 2,408 | |||||||||
| Balance at end of period | $ | 782,451 | $ | 839,501 |
Our investment policy calls for investing primarily in fixed maturities that are investment grade and meet our quality and yield objectives. Thus, any increases in below-investment grade issues are typically a result of ratings downgrades of existing holdings. Below-investment grade bonds at amortized cost, net of allowance for credit
GL Q3 2021 FORM 10-Q
Globe Life Inc.
Management's Discussion & Analysis
losses, were 13% of our shareholders’ equity, excluding the effect of unrealized gains and losses on fixed maturities as of September 30, 2021. Globe Life invests long term and as such, one of our key criterion in our investment process is to select issuers that have the ability to weather multiple financial cycles. As part of this process, we consider economic, social, and governance (ESG) and other long term sustainability factors.
OPERATING EXPENSES
Operating expenses are included in the "Corporate and Other" segment and are classified into two categories: insurance administrative expenses and expenses of the Parent Company. Insurance administrative expenses generally include expenses incurred after a policy has been issued. As these expenses relate to premium for a given period, management measures the expenses as a percentage of premium income. The Company also views stock-based compensation expense as a Parent Company expense. Expenses associated with the issuance of our insurance policies are reflected as acquisition expenses and included in the determination of underwriting margin.
An analysis of operating expenses is shown below.
Operating Expenses Selected Information
(Dollar amounts in thousands)
| Nine Months Ended September 30, | Increase | ||||||||||||||||||||||||||||||||||
| 2021 | 2020 | (Decrease) | |||||||||||||||||||||||||||||||||
| Amount | % of Premium | Amount | % of Premium | Amount | % | ||||||||||||||||||||||||||||||
| Insurance administrative expenses: | |||||||||||||||||||||||||||||||||||
| Salaries | $ | 85,616 | 2.8 | $ | 79,010 | 2.8 | $ | 6,606 | 8 | ||||||||||||||||||||||||||
| Other employee costs | 32,970 | 1.1 | 30,307 | 1.0 | 2,663 | 9 | |||||||||||||||||||||||||||||
| Information technology costs | 35,561 | 1.2 | 33,785 | 1.2 | 1,776 | 5 | |||||||||||||||||||||||||||||
| Legal costs | 10,743 | 0.3 | 8,540 | 0.3 | 2,203 | 26 | |||||||||||||||||||||||||||||
| Other administrative costs | 36,825 | 1.2 | 36,552 | 1.3 | 273 | 1 | |||||||||||||||||||||||||||||
| Total insurance administrative expenses | 201,715 | 6.6 | 188,194 | 6.6 | 13,521 | 7 | |||||||||||||||||||||||||||||
| Parent company expense | 7,251 | 7,536 | (285) | ||||||||||||||||||||||||||||||||
| Stock compensation expense | 24,298 | 26,655 | (2,357) | ||||||||||||||||||||||||||||||||
| Legal proceedings | 5,089 | 3,275 | 1,814 | ||||||||||||||||||||||||||||||||
| Non-operating expenses | 2,397 | 1,033 | 1,364 | ||||||||||||||||||||||||||||||||
| Total operating expenses, per Condensed Consolidated Statements of Operations | $ | 240,750 | $ | 226,693 | $ | 14,057 | 6 |
Total operating expenses increased 6% over the prior year period primarily due to a 7% increase in insurance administrative expenses. Insurance administrative expenses increased primarily due to higher employee-related expenses, including pension costs and information technology salaries. Pension expense increased due to the lower discount rate used to determine net periodic benefit costs in 2021 as compared to 2020. The decrease in stock-based compensation expense was primarily due to fewer performance based equity awards applicable to the first nine months of 2021 as compared to the same period in 2020. While insurance administrative expenses were up 7% from prior year, as a percentage of premium at 6.6%, it was flat compared with 2020.
GL Q3 2021 FORM 10-Q
Globe Life Inc.
Management's Discussion & Analysis
SHARE REPURCHASES
Globe Life has an ongoing share repurchase program that began in 1986, and is reviewed quarterly by management and annually reaffirmed by the Board of Directors. With no specified authorization amount, we determine the amount of repurchases based on the amount of the excess cash flow at the Parent Company, general market conditions, and other alternative uses. The majority of these purchases are made from excess cash flow. Excess cash flow at the Parent Company is primarily comprised of dividends received from the insurance subsidiaries less interest expense paid on its debt, dividends paid to Parent Company shareholders, and other limited operating activities. Additionally, when stock options are exercised, proceeds from these exercises and the resulting tax benefit are used to repurchase additional shares on the open market to minimize dilution as a result of the option exercises. In August, the Board of Directors reauthorized the Parent Company’s share repurchase program in amounts and with timing that management, in consultation with the Board, determines to be in the best interest of the Company and its shareholders.
The following chart summarizes share repurchases for the nine month periods ended September 30, 2021 and 2020.
Analysis of Share Repurchases
(Amounts in thousands, except per share data)
| Nine Months Ended September 30, | |||||||||||||||||||||||||||||||||||
| 2021 | 2020 | ||||||||||||||||||||||||||||||||||
| Shares | Amount | Average Price | Shares | Amount | Average Price | ||||||||||||||||||||||||||||||
| Purchases with: | |||||||||||||||||||||||||||||||||||
| Excess cash flow at the Parent Company | 3,191 | $ | 310,047 | $ | 97.17 | 3,069 | $ | 257,049 | $ | 83.74 | |||||||||||||||||||||||||
| Option exercise proceeds | 824 | 83,333 | 101.05 | 413 | 39,599 | 95.99 | |||||||||||||||||||||||||||||
| Total | 4,015 | $ | 393,380 | $ | 97.97 | 3,482 | $ | 296,648 | $ | 85.19 |
Throughout the remainder of this discussion, share repurchases will only refer to those made from excess cash flow at the Parent Company.
FINANCIAL CONDITION
Liquidity. Liquidity provides Globe Life with the ability to meet on demand the cash commitments required to support our business operations and meet our financial obligations. Our liquidity is primarily derived from three sources: positive cash flow from operations, a portfolio of marketable securities, and a revolving credit facility.
Insurance Subsidiary Liquidity**.** The operations of our insurance subsidiaries have historically generated substantial cash inflows in excess of immediate cash needs. Cash inflows for the insurance subsidiaries primarily include premium and investment income. In addition to investment income, maturities and scheduled repayments in the investment portfolio are cash inflows. Cash outflows from operations include policy benefit payments, commissions, administrative expenses, and taxes. A portion of the excess cash inflows in the current year will provide for the payment of future policy benefits, and are invested primarily in long-term fixed maturities as they better match the long-term nature of these obligations. Excess cash available from the insurance subsidiaries’ operations is generally distributed as a dividend to the Parent Company, subject to regulatory restrictions. The dividends are generally paid in amounts equal to the subsidiaries’ prior year statutory net income excluding realized capital gains. While the leading source of the excess cash is investment income, a significant portion of the excess cash also comes from underwriting income due to our high underwriting margins and effective expense control. While the insurance subsidiaries routinely generate more operating cash inflows than cash outflows annually, the companies also have the entire available-for-sale fixed maturity investment portfolio available to create additional cash flows if required.
In July, three of our insurance subsidiaries became members of the Federal Loan Home Bank of Dallas (FHLB). FHLB membership provides the insurance subsidiaries with access to various low cost collateralized borrowings
GL Q3 2021 FORM 10-Q
Globe Life Inc.
Management's Discussion & Analysis
and funding agreements. While not a primary source of liquidity, the FHLB could provide the insurance subsidiaries with an additional source of liquidity, if needed. Refer to Note 9—Debt for further details.
Parent Company Liquidity. An important source of Parent Company liquidity is the dividends from its insurance subsidiaries. These dividends are received throughout the year and are used by the Parent Company to pay dividends on common and preferred stock, interest and principal repayment requirements on Parent Company debt, and operating expenses of the Parent Company.
| Nine Months Ended September 30, | Twelve Months Ended December 31, | ||||||||||||||||||||||
| 2021 | 2020 | Projected 2021 | 2020 | ||||||||||||||||||||
| Liquidity Sources: | |||||||||||||||||||||||
| Dividends from Subsidiaries | $ | 422,622 | $ | 440,997 | $ | 480,000 | $ | 485,871 | |||||||||||||||
| Excess Cash Flows | 334,471 | 359,701 | 360,000 | 387,606 |
Additional sources of liquidity for the Parent Company are cash, intercompany receivables, intercompany borrowings, public debt markets, term loans, and a credit facility. At September 30, 2021, the Parent Company had access to $280 million of invested cash, net intercompany receivables and other liquid assets, down from the prior quarter as a result of the redemption of the $300 million 6.125% Junior subordinated debentures due 2056 on July 15, 2021. The Parent Company is expected to generate approximately $25 million excess cash flows in the remainder of the year.
Short-Term Borrowings. An additional source of Parent Company liquidity is a credit facility with a group of lenders allowing for unsecured revolving borrowings and stand-by letters of credit up to $750 million, which could be extended up to $1 billion. The Parent Company may request the extension, however it is not guaranteed. Up to $250 million in letters of credit can be issued against the facility. The facility serves as a back-up credit line for a commercial paper program under which commercial paper may be issued at any time, with total commercial paper outstanding not to exceed the facility maximum, less any letters of credit issued. Interest charged on the commercial paper program resembles variable rate debt due to its short term nature. On September 30, 2021, Globe Life amended the credit agreement dated August 24, 2020. The five-year credit agreement will now mature on September 30, 2026. As of September 30, 2021, the Parent Company was in full compliance with all covenants related to the aforementioned debt.
The following table presents certain information about our commercial paper borrowings.
Credit Facility—Commercial Paper
(Dollar amounts in thousands)
| At | |||||||||||||||||
| September 30, 2021 | December 31, 2020 | September 30, 2020 | |||||||||||||||
| Balance of commercial paper at end of period (par value) | $ | 244,000 | $ | 255,000 | $ | 280,000 | |||||||||||
| Annualized interest rate | 0.20 | % | 0.27 | % | 0.67 | % | |||||||||||
| Letters of credit outstanding | $ | 135,000 | $ | 135,000 | $ | 150,000 | |||||||||||
| Remaining amount available under credit line | 371,000 | 360,000 | 320,000 |
GL Q3 2021 FORM 10-Q
Globe Life Inc.
Management's Discussion & Analysis
Credit Facility—Commercial Paper Activity
(Dollar amounts in thousands)
| Nine Months Ended September 30, | |||||||||||
| 2021 | 2020 | ||||||||||
| Average balance of commercial paper outstanding during period (par value) | $ | 306,126 | $ | 332,802 | |||||||
| Daily-weighted average interest rate (annualized) | 0.23 | % | 1.78 | % | |||||||
| Maximum daily amount outstanding during period (par value) | $ | 425,000 | $ | 482,000 |
The Company reduced the commercial paper borrowings by $11 million since year-end, reflecting timing of cash needs of the Parent Company. We had no difficulties in accessing the commercial paper market under this facility during the nine months ended September 30, 2021 and 2020.
Globe Life expects to have readily available funds for 2021 and the foreseeable future to conduct its operations and to maintain target capital ratios in the insurance subsidiaries through liquid assets currently available, internally-generated cash flow and the credit facility. In the unlikely event that more liquidity is needed, the Parent Company could generate additional funds through multiple sources including, but not limited to, the issuance of debt, an additional short-term credit facility or term loan, and intercompany borrowing.
Consolidated Liquidity. Consolidated net cash inflows from operations were $1.06 billion in the first nine months of 2021, compared with $1.08 billion in the same period of 2020. The decrease is primarily attributable to fluctuations in the settlement of certain amounts included in other liabilities. In addition to cash inflows from operations, our insurance companies received proceeds from dispositions of fixed maturities available for sale in the amount of $250 million during the 2021 period. As previously noted under the caption Credit Facility**, the Parent Company has in place a credit facility. The insurance companies have no additional outstanding credit facilities.
Cash and short-term investments were $190 million at September 30, 2021, compared with $203 million at December 31, 2020. In addition to these liquid assets, the entire $21.2 billion (fair value at September 30, 2021) portfolio of fixed income securities is available for sale in the event of an unexpected need. Approximately 97% of our fixed income securities are publicly traded, freely tradable under SEC Rule 144, or qualified for resale under SEC Rule 144A. We generally expect to hold fixed income securities to maturity, and even though these securities are classified as available for sale, we have the ability and intent to hold any securities to recovery. Our strong cash flows from operations, on-going investment maturities, and available liquidity under our credit facility make any need to sell securities for liquidity highly unlikely.
GL Q3 2021 FORM 10-Q
Globe Life Inc.
Management's Discussion & Analysis
Capital Resources. The Parent Company's capital structure consists of short-term debt (the commercial paper facility and current maturities of long-term debt), long-term debt, and shareholders’ equity.
Long-Term Borrowings**.** The outstanding long-term debt at book value was $1.5 billion at September 30, 2021 and $1.7 billion at December 31, 2020. Refer to Note 9—Debt for a complete analysis and description of long-term debt issues outstanding.
Selected Information about Debt Issues
As of September 30, 2021
(Dollar amounts in thousands)
| Instrument | Issue Date | Maturity Date | Coupon Rate | Interest Payment Dates | Par Value | Book Value | Fair Value | ||||||||||||||||||||||||||||||||||
| Senior notes | 05/27/1993 | 05/15/2023 | 7.875% | semiannual | $ | 165,612 | $ | 165,149 | $ | 184,414 | |||||||||||||||||||||||||||||||
| Senior notes(1) | 09/24/2012 | 09/15/2022 | 3.800% | semiannual | 150,000 | 149,666 | 154,767 | ||||||||||||||||||||||||||||||||||
| Senior notes | 09/27/2018 | 09/15/2028 | 4.550% | semiannual | 550,000 | 544,794 | 637,719 | ||||||||||||||||||||||||||||||||||
| Senior notes | 08/21/2020 | 08/15/2030 | 2.150% | semiannual | 400,000 | 395,672 | 396,944 | ||||||||||||||||||||||||||||||||||
| Junior subordinated debentures | 11/17/2017 | 11/17/2057 | 5.275% | semiannual | 125,000 | 123,392 | 130,349 | ||||||||||||||||||||||||||||||||||
| Junior subordinated debentures | 06/14/2021 | 06/15/2061 | 4.250% | quarterly | 325,000 | 317,187 | 331,110 | ||||||||||||||||||||||||||||||||||
| 1,715,612 | 1,695,860 | 1,835,303 | |||||||||||||||||||||||||||||||||||||||
| Less current maturity of long-term debt(1) | 150,000 | 149,666 | 154,767 | ||||||||||||||||||||||||||||||||||||||
| Total long-term debt | 1,565,612 | 1,546,194 | 1,680,536 | ||||||||||||||||||||||||||||||||||||||
| Current maturity of long-term debt(1) | 150,000 | 149,666 | 154,767 | ||||||||||||||||||||||||||||||||||||||
| Commercial paper | 244,000 | 243,927 | 243,927 | ||||||||||||||||||||||||||||||||||||||
| Total short-term debt | 394,000 | 393,593 | 398,694 | ||||||||||||||||||||||||||||||||||||||
| Total debt | $ | 1,959,612 | $ | 1,939,787 | $ | 2,079,230 |
(1)An additional $150 million par value and book value is held by insurance subsidiaries that eliminates in consolidation.
Subsidiary Capital: The National Association of Insurance Commissioners (NAIC) has established a risk-based factor approach for determining threshold risk-based capital levels for all insurance companies. This approach was designed to assist the regulatory bodies in identifying companies that may require regulatory attention. A Risk-Based Capital (RBC) ratio is typically determined by dividing adjusted total statutory capital by the amount of risk-based capital determined using the NAIC’s factors. If a company’s RBC ratio approaches two times the RBC amount, the company must file a plan with the NAIC for improving their capital levels (this level is commonly referred to as “Company Action Level” RBC). Companies typically hold a multiple of the Company Action Level RBC depending on their particular business needs and risk profile.
Our goal is to maintain statutory capital within our insurance subsidiaries at levels necessary to support our current ratings. For 2021, Globe Life has targeted a consolidated Company Action Level RBC ratio of 300% to 320%. The Company concludes that this capital level is more than adequate and sufficient to support its current ratings, given the nature of its business and its risk profile. As of December 31, 2020, our consolidated Company Action Level RBC ratio was 309%. In August 2021, the NAIC fully adopted new and expanded C-1 investment factors. The adoption of these factors will result in higher amounts of required capital related to our investment portfolio. In addition to the expanded C-1 factors, additional capital will be needed by the end of the year to support higher sales levels, growth of our in-force business, higher COVID-19 net life claims, and the acquisition of Beazley Benefits. As such, we anticipate contributing assets of approximately $150 million to our insurance subsidiaries in the fourth quarter. The Parent Company is committed to maintaining the targeted consolidated RBC ratio at its insurance subsidiaries and has sufficient liquidity available to provide additional capital if necessary.
GL Q3 2021 FORM 10-Q
GLOBE LIFE INC.
Management's Discussion & Analysis
Shareholders' Equity: On August 23, 2021, the Parent Company announced that it had declared a quarterly dividend of $0.1975 per share. This dividend was paid on November 1, 2021.
Shareholders’ equity was $8.6 billion at September 30, 2021. This compares with $8.8 billion at December 31, 2020 and $8.2 billion at September 30, 2020. During the nine months since December 31, 2020, shareholders’ equity decreased primarily due to $379 million of after-tax unrealized losses in the fixed-maturity portfolio as interest rates have increased over the period. In addition, shareholders' equity increased by net income of $567 million during the first nine months of 2021, but was offset by share repurchases of $310 million and an additional $83 million in share purchases to counterbalance the dilution from stock option exercises.
We plan to use excess cash available at the Parent Company as efficiently as possible in the future. Possible uses of excess cash flow include, but are not limited to, share repurchases, acquisitions, increases in shareholder dividends, investment in securities, or repayment of short-term debt. We will determine the best use of excess cash after ensuring that targeted capital levels are maintained in our insurance subsidiaries. If market conditions are favorable, we currently expect that share repurchases will continue to be a primary use of those funds.
GL Q3 2021 FORM 10-Q
GLOBE LIFE INC.
Management's Discussion & Analysis
Globe Life is required under GAAP to revalue its available for sale fixed maturity portfolio to fair market value at the end of each accounting period. These changes, net of their associated impact on deferred acquisition costs and income tax, are reflected directly in shareholders’ equity.
While GAAP requires our fixed maturity assets to be revalued, it does not permit interest-bearing insurance policy liabilities supported by those assets to be valued at fair value in a consistent manner, with changes in value applied directly to shareholders’ equity. However, due to the size of both the investment portfolio and our policy liabilities, this inconsistency in measurement can have a material impact on shareholders’ equity. Because of the long-term nature of our fixed maturities and liabilities and the strong cash flows generated by our insurance subsidiaries, we have the intent and ability to hold our securities to maturity. As such, we do not expect to incur realized gains or losses due to fluctuations in the market value of fixed maturities caused by interest rate changes or losses caused by temporarily illiquid markets. Accordingly, management removes the effect of this rule when analyzing the Company's balance sheet, capital structure, and financial ratios in order to provide a consistent and meaningful portrayal of the Company’s financial position from period to period.
The following table presents selected data related to our capital resources. Additionally, the table presents the effect of this accounting guidance on relevant line items, so that investors and other financial statement users may determine its impact on Globe Life's capital structure. Excluding the effect of unrealized gains and losses on the fixed maturity portfolio from shareholders' equity is considered non-GAAP. Below we include the reconciliation to GAAP.
Selected Financial Data
(Dollar amounts in thousands, except per share data)
| At | |||||||||||||||||||||||||||||||||||
| September 30, 2021 | December 31, 2020 | September 30, 2020 | |||||||||||||||||||||||||||||||||
| GAAP | Effect of Accounting Rule Requiring Revaluation**(1)** | GAAP | Effect of Accounting Rule Requiring Revaluation**(1)** | GAAP | Effect of Accounting Rule Requiring Revaluation**(1)** | ||||||||||||||||||||||||||||||
| Fixed maturities | $ | 21,160,866 | $ | 3,538,838 | $ | 21,213,509 | $ | 4,019,710 | $ | 20,277,056 | $ | 3,389,389 | |||||||||||||||||||||||
| Deferred acquisition costs(2) | 4,837,409 | (4,756) | 4,595,444 | (5,955) | 4,517,255 | (6,338) | |||||||||||||||||||||||||||||
| Total assets | 29,496,578 | 3,534,082 | 29,046,731 | 4,013,755 | 28,041,893 | 3,383,051 | |||||||||||||||||||||||||||||
| Short-term debt | 393,593 | — | 254,918 | — | 279,758 | — | |||||||||||||||||||||||||||||
| Long-term debt | 1,546,194 | — | 1,667,886 | — | 1,667,506 | — | |||||||||||||||||||||||||||||
| Shareholders' equity | 8,608,151 | 2,791,925 | 8,771,092 | 3,170,866 | 8,224,908 | 2,672,610 | |||||||||||||||||||||||||||||
| Book value per diluted share | 84.52 | 27.41 | 83.19 | 30.07 | 77.60 | 25.21 | |||||||||||||||||||||||||||||
| Debt to capitalization(3) | 18.4 | % | (6.6) | % | 18.0 | % | (7.6) | % | 19.1 | % | (6.8) | % | |||||||||||||||||||||||
| Diluted shares outstanding | 101,848 | 105,429 | 105,986 | ||||||||||||||||||||||||||||||||
| Actual shares outstanding | 101,140 | 103,797 | 105,058 |
(1)Amount added to (deducted from) comprehensive income to produce the stated GAAP item, per accounting rule ASC 320-10-35-1.
(2)Includes the value of business acquired (VOBA).
(3)This ratio is computed by dividing total debt by the sum of total debt and shareholders’ equity.
GL Q3 2021 FORM 10-Q
Previous: Item 1. Condensed Consolidated Financial Statements · Next: Item 3. Quantitative and Qualitative Disclosures about Market Risk