 filings.tools
Generac Holdings (GNRC) 10-K risk factor changes: FY2014 vs FY2013
The 2014-12-31 10-K against the 2013-12-31 one, compared heading by heading and sentence by sentence. One of these filings carries no fiscal year tag, so its year is the calendar year of the period end.
Item 1A97 rewritten58 added48 removed134 unchanged
All filing items1,345 rewritten571 added575 removed836 unchanged
Summary
counted, not written
- Item 1A headings could not be compared: only 0 carried over between the two years, which usually means one filing was read wrongly, so none is reported as new or removed.
- Sentence by sentence, 571 added, 575 removed, 1,345 rewritten and 836 unchanged across 19 items that differ.
Sentences by item
21 items, with every count and a link to each item that changed
Underlined words on a shaded ground are new in FY2014; struck-through words were in FY2013. Sentences that are wholly new or wholly gone are labelled rather than marked.
Item 1A. Risk Factors
97 rewritten, 58 added, 48 removed, 134 unchanged
Read the full itemFY2014 item · filed February 27, 2015FY2013 item · filed March 3, 2014
[removed: Risk] [added: Risk] factors related to our business and [removed: industry][added: industry]
[removed: Demand] [added: _Demand] for our products is significantly affected by unpredictable [removed: major] power-outage [removed: events] [added: activity] that can lead to substantial variations in, and uncertainties regarding, our financial results from period to [removed: period.][added: period._]
Sales of our products are subject to consumer buying patterns, and demand for our products is affected by power outage events caused by thunderstorms, hurricanes, ice storms, blackouts and other [added: power] grid reliability issues.
The impact of these outage events on our sales can vary depending on the [removed: location] [added: location, frequency] and severity of the outages.
[removed: Unpredictable] [added: The lack of major power-outage events and] fluctuations [removed: in demand] [added: to the baseline levels of power-outage activity] are [removed: therefore] part of managing our business, and these fluctuations could have an adverse effect on our net sales and profits.
Despite their unpredictable nature, we believe [removed: major] power [removed: outages] [added: disruptions] create awareness and accelerate adoption for our home standby products.
[removed: Demand] [added: _Demand] for our products is significantly affected by durable goods spending by consumers and [removed: businesses] [added: businesses,] and other macroeconomic [removed: conditions.][added: conditions._]
[removed: Decreases] [added: _Decreases] in the availability and quality, or increases in the cost, of raw materials and key components we use could materially reduce our [removed: earnings.][added: earnings._]
[removed: The] [added: _The] industry in which we compete is highly competitive, and our failure to compete [removed: successfully could] [added: successfully_ _could] adversely affect our results of operations and financial [removed: condition.][added: condition._]
For [removed: more] [added: further] information, see “Item 1—Business—Competition.”
[removed: Our] [added: _Our] industry is subject to [removed: technological] [added: te__chnological] change, and our failure to continue developing new and improved products and to bring these products rapidly to market could have an adverse impact on our [removed: business.][added: business._]
[removed: We] [added: _We] rely on independent dealers and distribution partners, and the loss of these dealers and distribution partners, or of any of our sales arrangements with significant private label, telecommunications, retail or equipment rental customers, would adversely affect our [removed: business.][added: business._]
In addition, we sell our products to end users through private label arrangements with leading home equipment, electrical equipment and construction machinery [removed: companies,] [added: companies;] arrangements with top retailers and equipment rental [removed: companies,] [added: companies;] and our direct national accounts with telecommunications and industrial customers.
[removed: Our] [added: _Our] business could be negatively impacted if we fail to adequately protect our intellectual property rights or if third parties claim that we are in violation of their intellectual property [removed: rights.][added: rights._]
Not only are intellectual property-related proceedings burdensome and costly, but they could span years to [removed: get a conclusion] [added: resolve] and we may not [added: ultimately] prevail.
Any such claim, even if it is without merit, may be expensive and time-consuming to defend, subject us to damages, cause us to cease making, using or selling certain products that incorporate the disputed intellectual property, require us to redesign our products, divert management time and [removed: attention] [added: attention,] and/or require us to enter into costly royalty or licensing arrangements.
[removed: Our] [added: _Our] operations are subject to various environmental, health and safety laws and regulations, and non-compliance with or liabilities under such laws and regulations could result in substantial costs, fines, sanctions and [removed: claims.][added: claims._]
Our operations are subject to a variety of foreign, federal, state and local environmental, health and safety laws and regulations including those governing, among other things, emissions to [removed: air,] [added: air;] discharges to [removed: water, noise,] [added: water; noise; and] the generation, handling, storage, transportation, treatment and disposal of waste and other materials.
[removed: Our] [added: _Our] products are subject to substantial government [removed: regulation.][added: regulation._]
Our products are subject to extensive statutory and regulatory requirements governing, among other things, emissions and noise, including standards imposed by the [removed: federal Environmental Protection Agency (“EPA”), state regulatory agencies, such as California Air Resources Board (“CARB”),] [added: EPA, CARB] and other regulatory agencies around the world.
For [removed: example,] [added: example_,_] we were required to modify our spark-ignited air-cooled gaseous engines to comply with the 2011 EPA and CARB regulations, as well as the continued implementation of Tier 4 nonroad diesel engine changes associated with acquisitions serving the mobile product markets.
[removed: We] [added: _W__e] may incur costs and liabilities as a result of product liability [removed: claims.][added: claims._]
[removed: The] [added: _The] loss of any key members of our senior management team or key employees could disrupt our operations and harm our [removed: business.][added: business._]
[removed: Disruptions] [added: _Disruptions] caused by labor [removed: disputes] [added: dis__putes] or organized labor activities could harm our [removed: business.][added: business._]
[removed: We] [added: _We] may experience material disruptions to our manufacturing [removed: operations.][added: operations._]
| [removed: ·] | [added: ● |] equipment or information technology infrastructure failure; |
| [removed: ·] | [added: ● |] disruptions in the transportation infrastructure including roads, bridges, railroad [removed: tracks;] [added: tracks and container ports;] |
| [removed: ·] | [added: ● |] fires, floods, tornados, earthquakes, or other catastrophes; and |
| [removed: ·] | [added: ● |] other operational problems. |
In addition, the majority of our manufacturing and production facilities are located in Wisconsin within a 100-mile [removed: radius.][added: radius of each other.]
[removed: A] [added: _A] significant portion of our purchased components are sourced in foreign countries, exposing us to additional risks that may not exist in the United [removed: States.][added: States._]
| [removed: ·] | [added: ● |] inflation or changes in political and economic conditions; |
| [removed: ·] | [added: ● |] unstable regulatory environments; |
| [removed: ·] | [added: ● |] changes in import and export duties; |
| [removed: ·] | [added: ● |] domestic and foreign customs and tariffs; |
| [removed: ·] | [added: ● |] currency rate fluctuations; |
| [removed: ·] | [added: ● |] trade restrictions; |
| [removed: ·] | [added: ● |] labor unrest; |
| [removed: ·] | [removed: logistical and] [added: ● |] communications challenges; and |
| [removed: ·] | [added: ● |] other restraints and burdensome taxes. |
In addition, there are smaller, more localized power outages that occur frequently that drive a baseline level of demand for back-up power solutions.
A work stoppage or limitations on production at our facilities for any reason could have an adverse effect on our business, results of operations and financial condition.
In addition, many of our suppliers have unionized work forces.
Strikes or work stoppages experienced by our customers or suppliers could have an adverse effect on our business, results of operations and financial condition.
| --- | --- | --- |
| --- | --- | --- |
| --- | --- | --- |
| --- | --- | --- |
| --- | --- | --- |
| --- | --- | --- |
| --- | --- | --- |
| --- | --- | --- |
| --- | --- | --- |
| --- | --- | --- |
| --- | --- | --- |
| | ● | logistical challenges, including extended container port congestion; |
| --- | --- | --- |
| --- | --- | --- |
| --- | --- | --- |
See “Item 7—Management's Discussion and Analysis of Financial Condition and Results of Operations” for further information on the Company’s impairment tests and at-risk goodwill for the Ottomotores reporting unit, and see Note 2, “Significant Accounting Policies,” to the consolidated financial statements included in Item 8 of this Annual Report on Form 10-K for further details.
| --- | --- | --- |
| --- | --- | --- |
| --- | --- | --- |
| --- | --- | --- |
| --- | --- | --- |
| --- | --- | --- |
| --- | --- | --- |
| --- | --- | --- |
| --- | --- | --- |
| --- | --- | --- |
| --- | --- | --- |
| --- | --- | --- |
| --- | --- | --- |
_Security breaches and other disruptions could compromise our information and expose us to liability, which would cause our business and reputation to suffer._
In the ordinary course of our business, we collect and store sensitive information in our data centers and on our networks.
The secure processing, maintenance and transmission of this information is critical to our operations.
Despite our security measures, our information technology and infrastructure may be vulnerable to attacks by hackers or breached due to employee error, malfeasance or other disruptions.
Any such breach could compromise our networks, and the information stored there could be accessed, publicly disclosed, lost or stolen.
Any such access, disclosure or other loss of information could result in legal claims or proceedings, regulatory penalties, disrupt our operations and damage our reputation, which could adversely affect our business.
| --- | --- | --- |
The lack of major power-outage events can affect our net sales in the years following a given storm season.
| --- | --- |
| --- | --- |
| --- | --- |
| --- | --- |
| --- | --- |
| --- | --- |
| --- | --- |
| --- | --- |
| --- | --- |
| --- | --- |
| --- | --- |
| --- | --- |
| --- | --- |
See “Item 7—Management's Discussion and Analysis of Financial Condition and Results of Operations” for details.
Following the refinancing, we used the available proceeds from the new term loan and cash on hand to fund a special cash dividend to our stockholders of $5.00 per share and to pay related financing fees and expenses.
| --- | --- |
| --- | --- |
| --- | --- |
| --- | --- |
| --- | --- |
| --- | --- |
| --- | --- |
| --- | --- |
| --- | --- |
| --- | --- |
| --- | --- |
| --- | --- |
| --- | --- |
| --- | --- |
| --- | --- |
| --- | --- |
| --- | --- |
| --- | --- |
| --- | --- |
| --- | --- |
| --- | --- |
| --- | --- |
| --- | --- |
| --- | --- |
An excerpt. Shown here: 40 of 97 rewritten, 40 of 58 added and 40 of 48 removed. The counts are complete. For every sentence, read Item 1A. Risk Factors in the FY2014 filing and the FY2013 filing.
Item 7. Management’s Discussion and Analysis of Financial Condition and Results of Operations
176 rewritten, 90 added, 165 removed, 154 unchanged
Read the full itemFY2014 item · filed February 27, 2015FY2013 item · filed March 3, 2014
The following discussion and analysis of our financial condition and results of operations should be read together with “Item [added: 1 – Business,” “Item] 6 - Selected Financial Data” and the consolidated financial statements and the related notes [added: thereto] included in Item 8 of this Annual Report on Form 10-K.
[removed: Overview][added: Overview]
We are a leading designer and manufacturer of a wide range of power generation equipment and other engine powered products serving the residential, light commercial, [removed: industrial] [added: industrial, oil & gas,] and construction markets.
Other engine powered products that we design and manufacture include light towers which provide temporary lighting for various end [removed: markets] [added: markets; commercial] and [added: industrial mobile heaters used in the oil & gas, construction and other industrial markets; and] a broad product line of power washers for residential and commercial use.
[removed: Business drivers and operational factors][added: Business Drivers and Operational Factors]
[removed: Business drivers] [added: _Business Drivers] and [removed: trends][added: Trends_]
Our performance is affected by the demand for reliable power [added: generation and other mobile product] solutions by our customer base.
[added: _Increasing penetration opportunity._] Many potential customers are not aware of the costs and benefits of automatic backup power solutions.
We estimate that penetration rates for home standby generators are only approximately [removed: 3.0%] [added: 3.5%] of U.S. single-family detached, owner-occupied households with a home value of over $100,000, as defined by the U.S. Census Bureau's [removed: 2011] [added: 2013] American Housing Survey for the United States.
The decision to purchase backup power for many light-commercial buildings such as convenience stores, restaurants and gas stations [removed: are] [added: is] more return-on-investment (ROI) driven and as a result these applications have relatively lower penetration rates as compared to buildings used in [removed: more] code-driven or mission critical applications such as hospitals, wastewater treatment facilities, 911 call centers, data centers and certain industrial locations.
[removed: In addition, the] [added: The] emergence of lower cost, cleaner burning natural gas fueled generators has helped to accelerate the penetration of standby generators in the light-commercial market.
[removed: Also,] [added: In addition,] the importance of backup power for telecommunications infrastructure is increasing due to the growing importance for uninterrupted voice and data services.
We believe by expanding our distribution network, continuing to develop our product line, and targeting our marketing efforts, we can continue to build awareness and increase penetration for our standby [removed: generators.][added: and mobile generators for residential, commercial and industrial purposes.]
[added: _Effect of large scale_ _and baseline_ _power disruptions._] Power disruptions are an important driver of customer awareness and have historically influenced demand for generators.
Increased frequency and duration of major power outage [removed: events caused by the aging U.S. power grid] [added: events, that have a broader impact beyond a localized level,] increases product awareness and may drive consumers to accelerate their purchase of a standby or portable generator during the immediate and subsequent period, which we believe may last for six to twelve months for standby generators.
[removed: While there are localized] [added: Major] power [removed: outages that occur practically every day across the U.S., major outage activity is] [added: disruptions are] unpredictable by nature and, as a result, our sales levels and profitability may fluctuate from period to period.
[added: _Impact of residential investment cycle._] The market for residential generators is also affected by the residential investment cycle and overall consumer confidence and sentiment.
[added: _Impact of business capital investment cycle._] The market for our commercial and industrial products is affected by the overall capital investment cycle, including non-residential building construction, durable goods and infrastructure spending as well as investments in the exploration and production of oil & gas, as businesses or organizations either add new locations or make investments to upgrade existing locations or equipment.
[added: _Effect of commodity, currency and component price fluctuations._] Industry-wide price fluctuations of key commodities, such as steel, copper and aluminum and other components we use in our products, together with foreign currency fluctuations, can have a material impact on our results of operations.
[added: _Seasonalit__y._] Although there is demand for our products throughout the year, in each of the past three years approximately [removed: 16%] [added: 23%] to 27% of our net sales occurred in the first quarter, 20% to [removed: 23%] [added: 25%] in the second quarter, 24% to [removed: 30%] [added: 26%] in the third quarter and 25% to [removed: 34%] [added: 29%] in the fourth quarter, with different seasonality depending on the presence, timing and severity of major power outage activity in each year.
As a result, the seasonality experienced during this time [removed: period] [added: period, and for the subsequent quarters following the time period,] varied relative to other periods where no major outage events occurred.
We maintain a flexible production and supply chain infrastructure in order to respond to outage-driven peak [removed: demand, but assuming no major outage events, typically increase production levels in the second and third quarters of each year.][added: demand.]
[added: _Factors influencing interest expense_ _and cash interest expense__._] Interest expense can be impacted by a variety of factors, including market fluctuations in LIBOR, interest rate election periods, interest rate swap agreements and repayments of indebtedness.
[removed: See] [added: Refer to] Note [removed: 6 – Credit Agreements] [added: 11, “Credit Agreements,” to the consolidated financial statements] in Item 8 of this Annual Report on Form 10-K for additional details.
[added: _Factors influencing provision for income taxes and cash_ _income_ _taxes paid._] We had approximately [removed: $960] [added: $837] million of tax-deductible goodwill and intangible asset amortization remaining as of December 31, [removed: 2013] [added: 2014] related to our acquisition by CCMP in 2006 that we expect to generate cash tax savings of approximately [removed: $374] [added: $326] million through 2021, assuming continued profitability and a 39% tax rate.
As a result of the asset acquisition of the Magnum [removed: Products] business in the fourth quarter of 2011, we had approximately [removed: $48.3] [added: $45.5] million of incremental tax deductible goodwill and intangible assets remaining as of December 31, [removed: 2013.][added: 2014.]
We expect these assets to generate cash tax savings of [removed: $18.9] [added: $17.8] million through 2026 assuming continued profitability and a 39% tax rate.
[removed: Transactions] [added: Transactions] with [removed: CCMP][added: CCMP]
CCMP’s affiliates then exchanged this debt for additional shares of then-existing Class B Common Stock and Series A Preferred Stock, which were subsequently converted into the same class of our common stock through a corporate reorganization in conjunction with the [removed: initial public offering] [added: IPO] in February 2010.
In August 2013, CCMP completed the last of a series of sale transactions that began in November 2012 by which it sold substantially all of the shares of common stock that it owned as of the [removed: initial public offering.][added: IPO.]
[removed: Initial public offering][added: Initial Public Offering]
On February 17, 2010, the Company completed its [removed: initial public offering] [added: IPO] of 18,750,000 shares of its common stock at a price of $13.00 per share.
[removed: Components] [added: Components] of [removed: net sales] [added: Net Sales] and [removed: expenses][added: Expenses]
Substantially all of our net sales are generated through the sale of our generators and other engine powered products for the residential, light commercial, [removed: industrial] [added: industrial, oil & gas,] and construction markets.
Net sales, which include shipping and handling charges billed to customers, are [added: generally] recognized upon shipment of products to our customers.
During [removed: 2013,] [added: 2014,] our net sales were affected primarily by the U.S. [removed: economy] [added: market] as sales outside of the United States represented approximately [removed: 12%] [added: 16%] of total net sales.
We are not dependent on any one channel or customer for our net sales, with no single customer representing more than [removed: 6%] [added: 8%] of our sales for the year ended December 31, [removed: 2013] [added: 2014] and our top ten customers representing less than [removed: 24%] [added: 26%] of our sales for the same period.
[removed: Costs] [added: _Costs] of [removed: goods sold][added: Goods S__old_]
Component parts and raw materials comprised over 85% of costs of goods sold for the year ended December 31, [removed: 2013.][added: 2014.]
We design and manufacture air-cooled engines for certain of our products up to [removed: 20kW.][added: 22kW.]
Power generation is our primary focus, which differentiates us from our primary competitors that also have broad operations outside of the generator market.
Over the past several years, we have executed a number of acquisitions that support our strategic plan.
A summary of these acquisitions can be found in Note 1, “Description of Business,” to the consolidated financial statements included in Item 8 of this Annual Report on Form 10-K.
Also, in recent years, a more stringent regulatory environment around the flaring of natural gas at oil & gas drilling and production sites has been a catalyst for increased demand for natural gas fueled generators, including mobile solutions.
In addition, there are smaller, more localized power outages that occur frequently across the U.S. that drive the baseline level of demand for back-up power solutions.
The level of baseline power outage activity occurring across the U.S. can also fluctuate, and may cause our financial results to fluctuate from year to year.
_F__actors_ _Affecting Results of O__perations_
Cash interest expense decreased during 2014 compared to 2013, primarily due to a reduction in interest rate from the credit agreement refinancing completed in May 2013 and the 25 basis point reduction in borrowing costs during the second quarter of 2014 as a result of our net debt leverage ratio, as defined in our New Term Loan Credit Agreement, falling below 3.0 times.
_Net_ _S__ales_
_Operating E__xpenses_
Additionally, the amortization expense related to our finite-lived intangible assets is included within operating expenses.
Results of Operations
| Net sales | | $ | 1,460,919 | | | $ | 1,485,765 | |
| Costs of goods sold | | | 944,700 | | | | 916,205 | |
| Gross profit | | | 516,219 | | | | 569,560 | |
| Selling and service | | | 120,408 | | | | 107,515 | |
| Amortization of intangibles | | | 21,024 | | | | 25,819 | |
| Gain on remeasurement of contingent consideration | | | (4,877 | ) | | | \- | |
| Total operating expenses | | | 222,844 | | | | 218,095 | |
| Income from operations | | | 293,375 | | | | 351,465 | |
| Provision for income taxes | | | 83,749 | | | | 104,177 | |
| Net income | | $ | 174,613 | | | $ | 174,539 | |
| Residential power products | | $ | 722,206 | | | $ | 843,727 | |
| Commercial & Industrial power products | | | 652,216 | | | | 569,890 | |
| Other | | | 86,498 | | | | 72,148 | |
| Net sales | | $ | 1,460,919 | | | $ | 1,485,765 | |
_Net sales._ Net sales decreased $24.9 million, or 1.7%, to $1,460.9 million for the year ended December 31, 2014 from $1,485.8 million for the year ended December 31, 2013.
Residential product sales decreased 14.4% to $722.2 million from $843.7 million for the comparable period in 2013.
Residential product sales declined on a year-over-year basis as the prior year benefited from approximately $140 million in incremental shipments as a result of satisfying the extended lead times that resulted from Superstorm Sandy in October 2012, which did not repeat in 2014.
Excluding this benefit in the prior year, residential products increased approximately 3%.
C&I product sales increased 14.4% to $652.2 million from $569.9 million for the comparable period in 2013, primarily due to the contributions from recent acquisitions along with strength in the oil & gas markets, partially offset by reduced capital spending from certain telecom customers and overall softness within Latin America.
_Gross profit._ Gross profit decreased $53.4 million, or 9.4%, to $516.2 million for the year ended December 31, 2014 from $569.6 million for the year ended December 31, 2013.
The decline in gross margin was driven by the combination of a higher mix of organic C&I product shipments, the impact of recent acquisitions, an increase in promotional activities in the current year, and an overall increase in product costs, including a temporary increase in certain costs associated with the slowdown of activity in west coast ports as well as short-term increases in other overhead-related costs.
Operating expenses increased primarily due to the impact of recent acquisitions, a more favorable adjustment to warranty reserves in 2013 as compared to the current year, and increased marketing and advertising expenses to support our Powering Ahead strategy.
These increases were partially offset by a $4.9 million gain recorded in the second quarter of 2014 relating to a remeasurement of a contingent earn-out obligation from a recent acquisition and a $4.8 million year-over-year decline in amortization of intangible assets.
_Other expense._ Other expense decreased $37.7 million, or 51.9%, to $35.0 million for the year ended December 31, 2014 from $72.7 million for the year ended December 31, 2013.
Beginning in the second quarter of 2014, there was a 25 basis point reduction in borrowing costs as a result of the Company’s net debt leverage ratio falling below 3.0 times, resulting in a $16.0 million non-cash gain being recorded in 2014.
In conjunction with the May 2013 refinancing and other debt prepayments made in the prior year, a $15.3 million loss on extinguishment of debt was recorded.
During 2014, $87.0 million of voluntary prepayments of term loan debt were made, which resulted in recording a $2.1 million loss on extinguishment of debt.
Additionally, there was a $7.2 million year-over-year decrease in interest expense due to the refinancing of our debt in May 2013.
Unlike our primary competitors in the generator market, power generation is our main focus.
Increasing penetration opportunity.
Effect of large scale power disruptions.
Impact of residential investment cycle.
Impact of business capital investment cycle.
Factors affecting results of operations
Effect of commodity, currency and component price fluctuations.
Seasonality.
Factors influencing interest expense.
Interest expense increased during 2013 compared to 2012, primarily due to an increase in outstanding debt and the full-year weighted-average cost of debt associated with our credit agreement refinancings.
Factors influencing provision for income taxes and cash income taxes paid.
Net sales
Our generators and other products are fueled by natural gas, liquid propane, gasoline, diesel or Bi-Fuel™ systems with power output from 800W to several megawatts (mW) using our multi-generator systems.
Our products are primarily manufactured and assembled at our Wisconsin (USA), Mexico, Italy and Brazil facilities and distributed through thousands of outlets primarily across the U.S. and Canada, with an expanding presence internationally including Latin America, Europe, the Middle East, Africa and Asia/Pacific regions.
Our smaller kW generators for the residential and commercial markets, as well as light towers and power washers, are primarily built to stock, while our larger kW products for the industrial markets are generally customized and built to order.
Operating expenses
We typically classify our operating expenses into four categories: selling and service, research and development, general and administrative, and amortization of intangibles.
Selling and service.
Research and development.
General and administrative.
Amortization of intangibles.
Goodwill and trade name.
Goodwill primarily represents the excess of the amount paid over the fair market value of net tangible and intangible assets acquired in business combinations.
Other indefinite-lived intangible assets consist of trade names.
The fair value of trade names is measured using a relief-from-royalty approach, which assumes the fair value of the trade name is the discounted cash flows of the amount that would be paid had we not owned the trade name and instead licensed the trade name from another company.
During the fourth quarter of 2011, we recorded a non-cash charge which primarily related to the write down of a certain trade name.
Costs related to acquisition.
Results of operations
| | | | | | | | | |
| | | | | | | | | |
Net sales.
Gross profit.
Operating expenses.
Other expense.
These additional expenses were primarily driven by an increase in interest expense over prior year.
Income tax expense.
Net income.
The increase in net income is due to the items previously described.
Adjusted EBITDA.
Adjusted net income.
An excerpt. Shown here: 40 of 176 rewritten, 40 of 90 added and 40 of 165 removed. The counts are complete. For every sentence, read Item 7. Management’s Discussion and Analysis of Financial Condition and Results of Operations in the FY2014 filing and the FY2013 filing.
Item 7A. Quantitative and Qualitative Disclosures About Market Risk
20 rewritten, 19 added, 13 removed, 14 unchanged
Read the full itemFY2014 item · filed February 27, 2015FY2013 item · filed March 3, 2014
To reduce the risk from changes in certain foreign currency exchange [removed: rates and] [added: rates,] commodity [removed: prices,] [added: prices and interest rates,] we use financial instruments from time to time.
We are exposed to foreign currency exchange risk as a result of purchasing from suppliers in [added: currency] other [removed: countries] [added: than the U.S. Dollar] as well as operating businesses in foreign countries.
Realized [removed: and unrealized] gains and losses on transactions denominated in foreign currency are recorded in earnings as a component of cost of goods [removed: sold.][added: sold on the statements of comprehensive income.]
As of December 31, [removed: 2013,] [added: 2014,] we had the following foreign currency contracts outstanding (in thousands):
| [removed: Currency Denomination |] [added: Currency Denomination] | [added: Trade Date] | [removed: Effective Date] [added: Effective Date] | [removed: Notional Amount (Thousands)] [added: Notional Amount] | [added: Exchange Rate (EUR:GBP)] | [removed: Expiration Date] [added: Expiration Date] |
With the purchase of the Ottomotores [removed: businesses] [added: business] in December 2012 and the Tower Light business in August 2013, a small portion of revenues and expenses are now denominated in Euros, Mexican Pesos, Brazilian Real and British Pounds.
We are a purchaser of commodities and of components manufactured from [removed: commodities,] [added: commodities] including steel, aluminum, copper and others.
We primarily utilize commodity contracts with maturities of [removed: one year or less.][added: less than eighteen months.]
These [added: contracts] are intended to offset the effect of price fluctuations on actual inventory [removed: purchases.][added: purchases and to mitigate the impact on our financial results.]
As of December 31, [removed: 2013,] [added: 2014,] we had the following commodity forward contracts outstanding (in thousands):
| [removed: Hedged Item] [added: Hedged Item] | [removed: Number of Contracts Outstanding] [added: Trade Date] | [removed: Effective Date] [added: Effective Date] | [removed: Aggregate Notional Amount (Thousands)] | [removed: Fixed Copper] [added: Notional Amount | | | | Fixed] Price [added: (per LB)] | [added: | | Expiration Date |]
For additional information on the Company’s commodity forward contracts, including amounts charged to the statement of comprehensive income during [removed: 2013,] [added: 2014,] see Note [removed: 2] [added: 4, “Derivative Instruments and Hedging Activity,”] to [removed: our audited] [added: the] consolidated financial statements included in Item 8 of this Annual Report on Form 10-K.
As of December 31, [removed: 2013,] [added: 2014,] all of the outstanding debt under our term [removed: loans] [added: loan] was subject to floating interest rate risk.
As of [removed: this date,] [added: December 31, 2014,] we had the following interest rate swap contracts outstanding (in thousands):
| [removed: Hedged Item] [added: Hedged Item] | [added: Contract Date] | [removed: Effective Date] [added: Effective Date] | [removed: Notional Amount (Thousands)] | [added: Notional Amount] | [removed: Expiration Date] | [added: | | Fixed LIBOR Rate | | | Expiration Date |]
| Interest rate | October 23, 2013 | July 1, 2014 | [removed: $100,000] | [removed: 1.742%] [added: $] | [added: 100,000 | | | | 1.7420 | % |] July 1, 2018 |
| Interest rate | October 23, 2013 | July 1, 2014 | [removed: $100,000] | [removed: 1.737%] [added: $] | [added: 100,000 | | | | 1.7370 | % |] July 1, 2018 |
For additional information on the Company’s interest rate swaps, including amounts charged to the statement of comprehensive income during [removed: 2013,] [added: 2014,] see Note [removed: 2] [added: 4, “Derivative Instruments and Hedging Activities,” and “Note 6, Accumulated Other Comprehensive Loss,”] to our [removed: audited] consolidated financial statements included in Item 8 of this Annual Report on Form 10-K.
A hypothetical change in the LIBOR interest rate of 100 basis points would have changed annual cash interest expense by approximately [removed: $4.9] [added: $4.1] million (or, without the swaps in place, [removed: $5.9 million).][added: $5.6 million) in 2014.]
The existence of a 0.75% LIBOR floor provision in our New Term Loan Credit Agreement, effective May 31, 2013, limits the impact of a hypothetical 100 basis point change in LIBOR at current December 31, [removed: 2013] [added: 2014] LIBOR rates.
Foreign Currency
| | | | | | |
| GBP | July 24, 2014 | October 1, 2014 | 1,000 | 0.7983 | March 2, 2015 |
| GBP | September 17, 2014 | December 15, 2014 | 500 | 0.8011 | March 31, 2015 |
| GBP | September 17, 2014 | December 15, 2014 | 500 | 0.8030 | March 27, 2015 |
| GBP | October 31, 2014 | November 4, 2014 | 1,000 | 0.7900 | May 29, 2015 |
| GBP | October 31, 2014 | February 26, 2015 | 1,000 | 0.7918 | April 28, 2015 |
| GBP | November 3, 2014 | January 15, 2015 | 1,000 | 0.7885 | April 28, 2015 |
Commodity Prices
| --- | --- | --- | --- | --- | --- | --- | --- | --- | --- | --- | --- |
| | | | | | | | | | | | |
| Copper | October 2, 2014 | October 1, 2014 | | $ | 4,960 | | | $ | 3.000 | | December 31, 2015 |
| Copper | October 15, 2014 | November 1, 2014 | | $ | 4,637 | | | $ | 3.005 | | December 31, 2015 |
| Copper | December 1, 2014 | December 1, 2014 | | $ | 8,232 | | | $ | 2.872 | | December 31, 2015 |
Interest Rates
| --- | --- | --- | --- | --- | --- | --- | --- | --- | --- | --- | --- |
| | | | | | | | | | | | |
| Interest rate | May 19, 2014 | July 1, 2014 | | $ | 100,000 | | | | 1.6195 | % | July 1, 2018 |
At December 31, 2014, the fair value of the swaps was a liability of $1.0 million.
Foreign currency
At December 31, 2012, we had no foreign exchange contracts outstanding.
| --- | --- | --- | --- | --- | --- | --- |
| Number of Contracts Outstanding | Contract Date | Exchange Rate | | | | |
| USD | 3 | October 23, 2013 | Various effective dates between 4/1/2014 and 7/14/2014 | 650 | (EUR:USD) 1.349-1.3515 | May 28, 2014 – October 31, 2014 |
| GBP | 4 | October 23, 2013 | Various effective dates between 2/3/2014 and 5/2/2014 | 4,000 | (EUR:GBP) 0.8384-0.8492 | April 30, 2014 – July 31, 2014 |
Commodity prices
The primary objective of the hedge is to mitigate the impact of potential price fluctuations of commodity on our financial results.
| --- | --- | --- | --- | --- |
| Copper | 1 | October 1, 2013 to June 30, 2014 | $2,169 | $3.12 per LB |
Interest rates
| Contract Date | Fixed LIBOR Rate | | | | |
At December 31, 2013, the fair value of the swaps reduced for our credit risk and excluding any related accrued interest was an asset of $1.2 million.
Item 1. Business
142 rewritten, 25 added, 42 removed, 79 unchanged
Read the full itemFY2014 item · filed February 27, 2015FY2013 item · filed March 3, 2014
We are a leading designer and manufacturer of a wide range of power generation equipment and other engine powered products serving the residential, light commercial, [removed: industrial] [added: industrial, oil & gas,] and construction markets.
Power generation is our [removed: main] [added: primary] focus, which differentiates us from our primary competitors that also have broad operations outside of the generator market.
Other engine powered products that we design and manufacture include light towers which provide temporary lighting for various end [removed: markets] [added: markets; commercial] and [added: industrial mobile heaters used in the oil & gas, construction and other industrial markets; and] a broad product line of power washers for residential and commercial use.
Our products are available primarily across the U.S and Canada, with an expanding presence internationally in [removed: the] Latin America, Europe, [added: the] Middle East, Africa and Asia/Pacific regions.
Products are sold into these regions through a broad network of independent dealers, [added: distributors,] retailers, wholesalers and equipment rental companies under the Generac®, [removed: Magnum™, Ottomotores and] [added: MagnumTM, OttomotoresTM,] Tower [removed: Light] [added: LightTM, Powermate®, Dewalt®, MACTM and Honeywell®] brand names.
We believe that our leading market position is largely attributable to our strategy of providing a broad product line of high-quality, innovative and affordable products through our extensive and multi-layered distribution [removed: network.][added: network to whom we offer the most comprehensive support and programs from the factory.]
In addition, through recent acquisitions, we are also a leading provider of light [removed: towers and] [added: towers,] mobile [removed: generators,] [added: generators and flameless heaters,] as well as a supplier of industrial diesel generators ranging in sizes up to 3,250kW.
[removed: History][added: History]
Generac Holdings Inc. [added: (the Company)] is a Delaware corporation whose principal operating subsidiary is Generac Power Systems, Inc., [removed: or Generac Power Systems] (collectively Generac).
Generac [removed: Power Systems] was founded in 1959 to market a line of affordable portable generators that offered superior performance and features.
Through innovation and focus, we have grown to be a leading provider of power generation equipment to the residential, [added: light] commercial, industrial, [added: oil & gas] and construction markets.
| [removed: \-] | [added: ● |] In 1980, we expanded beyond portable generators into the industrial market with the introduction of our first stationary generators that provided up to 200 kW of power output. |
| [removed: \-] | [added: ● |] We introduced our first residential standby generator in 1989, and expanded our [added: industrial] product development and global distribution system in the 1990s, forming a series of alliances that tripled our higher output generator sales. |
| [removed: \-] | [added: ● |] In 1998, we sold our Generac® portable products business (which included portable generator and pressure washer product lines) to a private equity firm who eventually sold this business to another company. |
| [removed: \-] | [added: ● |] Our growth accelerated in 2000 as we expanded our residential automatic standby generator product offering, implemented our multi-layered distribution philosophy, and introduced our quiet-running QT Series generators in 2005, accelerating our penetration in the commercial market. |
| [removed: \-] | [added: ● |] In 2006, the founder of Generac Power Systems sold the company to affiliates of CCMP Capital Advisors, LLC [removed: or CCMP,] [added: (CCMP),] together with certain other investors and members of our management (CCMP Transaction). |
| [removed: \-] | [added: ● |] In 2008, we successfully expanded our position in the portable generator market after the expiration of our non-compete agreement that was entered into when we sold our Generac® portable products business in 1998. |
| [removed: \-] | [added: ● |] In February 2010, we completed our initial public offering (IPO) of 20.7 million primary shares of our common stock (including additional share [added: over] allotment). |
| [removed: \-] | [added: ● |] In early 2011, we re-entered the market for gasoline-powered pressure washers (or power washers), which we previously exited in 1998 with the sale of our Generac® portable products business. |
| [removed: \-] | [added: ● |] In August 2013, CCMP completed the last of a series of sale transactions that began in November 2012 by which it sold substantially all of the shares of common stock that it owned as of the initial public offering. |
Today, we [added: design and] manufacture a full line of power [added: generation equipment and other engine powered] products for a wide variety of applications and markets.
[removed: Products][added: Products]
We design and manufacture stationary, portable and mobile generators with single-engine outputs ranging between 800W and [removed: up to] 3,250kW, with the ability to expand the power range for certain stationary generator solutions to much larger multi-megawatt systems through our Modular Power [removed: Systems,] [added: Systems (MPS),] an integrated paralleling configuration.
Other engine powered products that we design and manufacture include light towers, [added: mobile heaters,] power washers and pumps.
We classify our products into three [removed: classes] [added: categories] based on similar range of power output geared for varying end customer uses: Residential [removed: power] products, Commercial & Industrial [removed: power products;] [added: (C&I) products] and Other products.
[removed: Residential power products][added: _Residential Products_]
Our residential automatic standby generators range in output from 6kW to 60kW, with manufacturer's suggested retail [removed: prices, or MSRPs,] [added: prices (MSRPs)] from approximately [removed: $1,900] [added: $1,799] to [removed: $16,700.][added: $16,199.]
Air-cooled engine residential standby generators range in outputs from 6kW to [removed: 20kW,] [added: 22kW,] are available in steel and aluminum enclosures and serve as an emergency backup for small to medium-sized homes.
[removed: Also during 2013, we introduced] [added: We also provide] a [removed: new cellular] [added: cellular-based] remote monitoring system for home standby generators called [removed: Mobile Link™,] [added: _Mobile_ _Link_™,] which allows our customers to check the status of their generator conveniently from a desktop PC, tablet computer or [removed: mobile phone] [added: smartphone] and also provides the capability to receive maintenance or service alerts.
We provide [added: a broad product line of] portable generators that are fueled predominantly by [removed: gasoline that] [added: gasoline, with certain models running on propane, which] range in size from 800W to 17,500W.
These products serve as an emergency home backup [added: source of electricity] and are also used for construction and recreational purposes.
We also provide a broad product line of engine driven power washers, which are [removed: also] fueled by gasoline, that range in PSI from 2,000 to [removed: 4,000] [added: 4,200] that are used for residential and commercial use.
Residential power products comprised [removed: 56.8%, 60.0%] [added: 49.5%, 56.8%] and [removed: 62.0%,] [added: 60.0%,] respectively, of total net sales in [removed: 2013, 2012] [added: 2014, 2013] and [removed: 2011.][added: 2012.]
[removed: Commercial] [added: _Commercial] & Industrial [removed: power products][added: Products_]
We offer a full line of [removed: commercial & industrial] [added: C&I] generators fueled by diesel, natural gas, liquid propane and Bi-Fuel™.
Ranging from [removed: 22kW] [added: 10kW] up to 3,250kW, we believe we have one of the broadest product offerings in the industry.
Our light-commercial standby generators include a full range of affordable systems from 22kW to 150kW and related transfer switches, providing three-phase power sufficient for most small and mid-sized businesses including grocery stores, convenience stores, restaurants, gas stations, pharmacies, retail [removed: banks and] [added: banks,] small health care [removed: facilities.][added: facilities and other small-footprint retail applications.]
Our light-commercial generators run on natural [removed: gas and] [added: gas,] liquid [removed: propane,] [added: propane] and [removed: in late 2013 we introduced a product line of compact, diesel-fueled generators called Protector® Series.][added: diesel fuel.]
We also manufacture a broad line of standard and configured [added: stationary] standby generators and related transfer switches for industrial applications.
Our single-engine industrial generators range in output from 10kW up to [removed: 3,250kW] [added: 3,250kW,] with our [removed: Modular Power System (MPS)] [added: MPS] technology extending our product range up to much larger multi-megawatt systems through an integrated paralleling configuration.
| --- | --- | --- |
Additionally, over the past several years, we have executed a number of acquisitions that support our strategic plan.
A summary of these acquisitions can be found in Note 1, “Description of Business,” to the consolidated financial statements in Item 8 of this Annual Report on Form 10-K.
In 2014, we introduced a new 22kW air-cooled engine standby generator which provides the highest output for an air-cooled generator currently available in the marketplace.
Another new product introduction during 2014 was the Guardian Synergy, the industry’s first variable-speed residential standby generator and is a best-in-class, much quieter, more fuel-efficient generator with exceptionally clean power output.
Also during 2014, we launched the industry’s most cost-effective automatic home standby generator called the PowerPact, which combines all the benefits of automatic operation with many of the features found in Generac’s market-leading Guardian series, with the 7kW unit starting at an affordable $1,899 at retail.
Our portable generators are targeted at homeowners, with price points ranging between the consumer value end of the market through the premium homeowner market, at professional contractors, starting at the value end through the premium contractor segment, as well as inverter generators targeted for the recreational market.
Our portable generators are offered under the Generac®, Powermate®, Dewalt® and Honeywell® brand names
We recently introduced a product line of water pumps built to meet the water removal needs of homeowners, farmers, construction crews and other end-user applications.
We introduced several new commercial and industrial products in 2014.
We further expanded our broad line up of natural gas generators with the introduction of a new 400kW power node at an industry leading price point.
In addition to new stationary products, we also introduced a new vertical-mast light tower called the MLT6S, which provides the most compact footprint in the industry, improved ease of use, transportation, run time and serviceability.
_Other_ _P__roducts_
Our industrial network consists of a combination of primary distributors as well as a support network of dealers serving the U.S. and Canada.
The placement of our products at retail locations drives significant awareness for our brands and the automatic home standby product category.
Business Strategy
We are now a more balanced company relative to our residential product sales as compared to only four years ago, as revenues for our C&I products have expanded from 31.0% of total net sales in 2010 to 44.6% in 2014.
This is targeted to be accomplished through both organic growth and potential acquisitions, and by establishing and developing additional distribution globally and building the Generac brand internationally.
Intellectual Property
Also includes other regional packagers that serve local markets throughout the world.
_Mobile_ _h__eaters_ - Wacker, Briggs & Stratton (Allmand), Flagro and Frost Fighter
Segment Information
Executive Officers
Dolan began serving as our Executive Vice President, Mobile Products in September 2014.
Minick began serving as our Executive Vice President, North America in September 2014.
| --- | --- |
| --- | --- |
| --- | --- |
| --- | --- |
| --- | --- |
| --- | --- |
| --- | --- |
| --- | --- |
| \- | In October 2011, we purchased substantially all the assets of the Magnum Products business (Magnum or Magnum Products) which is the number one light tower manufacturer in the U.S. and has a growing share of the mobile generator market. |
| --- | --- |
| \- | In December 2012, we purchased all of the equity of Ottomotores UK Limited and its affiliates (Ottomotores) which is one of the largest manufacturers of industrial generators in Mexico. |
| --- | --- |
| \- | In August 2013, we purchased all of the equity of Tower Light Srl and its wholly-owned subsidiaries (Tower Light) which is a leading developer and supplier of mobile light towers throughout Europe, the Middle East and Africa. |
| --- | --- |
| --- | --- |
| \- | In November 2013, we purchased substantially all the assets of the generator division of Baldor Electric Company, a wholly-owned subsidiary of ABB Group (Baldor Generators), which offers a complete line of standby and prime rated products ranging from 3kW up to 2,500kW throughout the US. And Canada. |
| --- | --- |
We have experienced organic revenue growth of nearly 20% during the past 10 years on a compounded annual basis.
Liquid-cooled brands include the Guardian® Series and the premium Quietsource® Series, which have a quiet, low-speed engine and a standard aluminum enclosure.
In late 2013, we introduced a line of compact diesel generators developed specifically for residential and light-commercial users called Protector® Series, which offers the industry’s smallest and most compact footprint at price points well below those of larger, more traditional diesel generator sets in the marketplace.
We currently have five portable product lines: the GP series, targeted at homeowners, ranging from 1,800W to 17,500W; the LP series, that runs on propane and is also targeted at homeowners, ranging from 3,250W to 5,500W; the XG series, targeted at the premium homeowner markets, ranging from 4,000 to 10,000W; the XP series, targeted at the professional contractor market, ranging from 3,600 to 10,000W; and the iX series, targeted at the recreational market, ranging from 800W to 2,000W.
For larger industrial applications, our MPS products offer customers an efficient, affordable way to scale their standby power needs.
The acquisition of Tower Light in August 2013 provides us an expanded product offering of light towers to support additional geographic markets, allowing us to participate in the growing rental market outside the U.S.
Other power products
Additionally, we sell certain engines directly to OEM manufacturers and after-market dealers for use in the lawn, garden and rental markets.
Business strategy
Growing the residential standby generator market.
Gaining commercial and industrial market share.
With our scale in these smaller commercial products, our distribution capabilities, and our national account customer focus, we believe we have an opportunity to penetrate these markets by using a targeted marketing approach and funneling opportunities to our distribution partners.
In recent years, we have worked hard to diversify Generac's end markets with new products and services.
Expanding into new geographies.
See “Item 7.
Research and development is conducted at each of our manufacturing facilities and additionally at our technical center in Suzhou, China with dedicated teams for each product line.
Intellectual property
There are a number of other standby generator manufacturers and packagers located outside North America, but most supply their products mainly to their respective regional markets.
Segment information
Executive officers
| Robert Stoppek | | 42 | | Senior Vice President, Global Operations |
Minick began serving as our Executive Vice President, Residential Products in October 2011, with this title being expanded in January 2014 to Executive Vice President, Global Residential Products.
Robert Stoppek has served as our Senior Vice President of Global Operations since March 2013 when he joined Generac.
An excerpt. Shown here: 40 of 142 rewritten, all 25 added and 40 of 42 removed. The counts are complete. For every sentence, read Item 1. Business in the FY2014 filing and the FY2013 filing.
Item 3. Legal Proceedings
1 rewritten, 0 added, 0 removed, 1 unchanged
Read the full itemFY2014 item · filed February 27, 2015FY2013 item · filed March 3, 2014
As of December 31, [removed: 2013,] [added: 2014,] we believe that there is no litigation pending that would have a material effect on our results of operations or financial condition.
Cover and table of contents
72 rewritten, 31 added, 19 removed, 29 unchanged
Read the full itemFY2014 item · filed February 27, 2015FY2013 item · filed March 3, 2014
[removed: SECURITIES] [added: UNITED STATES SECURITIES] AND EXCHANGE [removed: COMMISSION][added: COMMISSION]
[removed: WASHINGTON,] [added: WASHINGTON,] D.C. [removed: 20549][added: 20549]
[removed: FORM 10-K][added: FORM 10-K]
| [removed: (Mark One)] [added: (Mark One)] | |
| [removed: x] [added: ☒] | [removed: ANNUAL] [added: ANNUAL] REPORT PURSUANT TO SECTION 13 OR 15(d) OF THE SECURITIES EXCHANGE ACT OF [removed: 1934] [added: 1934] |
| [removed: For] [added: For] the fiscal year ended December 31, [removed: 2013 Or] [added: 2014 Or] | |
| [removed: o] [added: ☐] | [removed: TRANSITION] [added: TRANSITION] REPORT PURSUANT TO SECTION 13 OR 15(d) OF THE SECURITIES EXCHANGE ACT OF [removed: 1934] [added: 1934] |
| [removed: For] [added: For] the transition period from [removed: to] [added: to] | |
[removed: Commission] [added: Commission] File Number [removed: 001-34627][added: 001-34627]
[removed: GENERAC] [added: GENERAC] HOLDINGS [removed: INC.][added: INC.]
| [removed: DELAWARE (State] [added: DELAWARE (State] or other jurisdiction of incorporation or organization) | [removed: 20-5654756 (IRS] [added: 20-5654756 (IRS] Employer Identification No.) |
| [removed: S45] [added: S45] W29290 Hwy. 59, Waukesha, WI [removed: (Address] [added: (Address] of principal executive offices) | [removed: 53189 (Zip] [added: 53189 (Zip] Code) |
| [removed: (262)] [added: (262)] 544-4811 [removed: (Registrant’s] [added: (Registrant’s] telephone number, including area code) | |
| [removed: Common] [added: Common] Stock, $0.01 par value [removed: (Title] [added: (Title] of class) | [removed: New] [added: New] York Stock Exchange [removed: (Name] [added: (Name] of exchange on which registered) |
| SECURITIES REGISTERED PURSUANT TO SECTION 12(G) OF THE ACT: [removed: None] [added: None] | |
Yes [removed: x] [added: ☒] No [removed: o][added: ☐]
Yes [removed: o] [added: ☐] No [removed: x][added: ☒]
Yes [removed: x] [added: ☒] No [removed: o][added: ☐]
Yes [removed: x] [added: ☒] No [removed: o][added: ☐]
Indicate by check mark if disclosure of delinquent filers pursuant to Item 405 of Regulation S-K (§ 229.405 of this chapter) is not contained herein, and will not be contained, to the best of registrant’s knowledge, in definitive proxy or information statements incorporated by reference in Part III of this Form 10-K or any amendment to this Form 10-K. [removed: o]
| Large accelerated filer [removed: x] [added: ☒] | Accelerated filer [removed: o] [added: ☐] | Non-accelerated filer [removed: o] [added: ☐] (Do not check if a smaller reporting company) | Smaller reporting company [removed: o] [added: ☐] |
Yes [removed: o] [added: ☐] No [removed: x][added: ☒]
The aggregate market value of the voting common equity held by non-affiliates of the registrant on June [removed: 28, 2013,] [added: 30, 2014,] the last business day of the registrant’s most recently completed second fiscal quarter, was approximately [removed: $2,175,882,000] [added: $3,302,158,395] based upon the closing price reported for such date on the New York Stock Exchange.
As of February [removed: 24, 2014, 68,779,944] [added: 20, 2015, 69,093,775] shares of registrant's common stock were outstanding.
[removed: DOCUMENTS] [added: DOCUMENTS] INCORPORATED BY [removed: REFERENCE][added: REFERENCE]
Portions of the registrant’s Proxy Statement for the [removed: 2014] [added: 2015] Annual Meeting of Stockholders (the [removed: “2014] [added: “2015] Proxy Statement”), which will be filed by the registrant on or prior to 120 days following the end of the registrant’s fiscal year ended December 31, [removed: 2013,] [added: 2014,] are incorporated by reference into Part III of this Form 10-K.
[removed: 2013 FORM] [added: 2014 FORM] 10-K ANNUAL [removed: REPORT][added: REPORT]
[removed: TABLE OF CONTENTS][added: TABLE OF CONTENTS]
| | | [removed: Page] [added: Page] |
| [removed: PART I] [added: PART I] | | |
| [removed: [Item 1.](#item1new)] [added: Item 1.] | [removed: [Business](#item1new)] [added: [Business](#BKMK340)] | [removed: [2](#item1new)] [added: 1] |
| [removed: [Item 1A.](#item1a)] [added: Item 1A.] | [Risk [removed: Factors](#item1a)] [added: Factors](#BKMK341)] | [removed: [8](#item1a)] [added: 9] |
| [removed: [Item 1B.](#item1b)] [added: Item 1B.] | [Unresolved Staff [removed: Comments](#item1b)] [added: Comments](#BKMK342)] | [removed: [14](#item1b)] [added: 16] |
| [removed: [Item 2.](#item2)] [added: Item 2.] | [removed: [Properties](#item2)] [added: [Properties](#BKMK343)] | [removed: [15](#item2)] [added: 16] |
| [removed: [Item 3.](#item3)] [added: Item 3.] | [Legal [removed: Proceedings](#item3)] [added: Proceedings](#BKMK344)] | [removed: [15](#item3)] [added: 17] |
| [removed: [Item 4.](#item4)] [added: Item 4.] | [Mine Safety [removed: Disclosures](#item4)] [added: Disclosures](#BKMK345)] | [removed: [15](#item4)] [added: 17] |
| [removed: PART II] [added: PART II] | | |
| [removed: [Item 5.](#item5)] [added: Item 5.] | [Market for Registrant’s Common Equity, Related Stockholder Matters and Issuer Purchases of Equity [removed: Securities](#item5)] [added: Securities](#BKMK346)] | [removed: [15](#item5)] [added: 17] |
| [removed: [Item 6.](#item6)] [added: Item 6.] | [Selected Financial [removed: Data](#item6)] [added: Data](#BKMK347)] | [removed: [17](#item6)] [added: 19] |
| [removed: [Item 7.](#item7)] [added: Item 7.] | [Management’s Discussion and Analysis of Financial Condition and Results of [removed: Operations](#item7)] [added: Operations](#BKMK348)] | [removed: [23](#item7)] [added: 24] |
10-K 1 gnrc20141231_10k.htm FORM 10-K [Table Of Contents](#TOC)
| | |
| | |
| | |
| | |
| | |
| | |
| | |
| | |
Portions of the registrant’s Annual Report to Shareholders for the year ended December 31, 2014 furnished to the Securities and Exchange Commission are incorporated by reference into Part II of this Form 10-K.
| | | |
| | | |
| | | |
| | | |
| --- | --- | --- |
| --- | --- | --- |
| --- | --- | --- |
| --- | --- | --- |
| --- | --- | --- |
| --- | --- | --- |
| | ● | the impact on our results of possible fluctuations in interest rates and foreign currency exchange rates; |
| --- | --- | --- |
| --- | --- | --- |
| --- | --- | --- |
| --- | --- | --- |
| --- | --- | --- |
| --- | --- | --- |
| --- | --- | --- |
| --- | --- | --- |
| --- | --- | --- |
| --- | --- | --- |
10-K 1 form10k.htm GENERAC FORM 10-K 12-31-2013
UNITED STATES
| --- | --- |
| --- | --- |
| --- | --- |
| --- | --- |
| --- | --- |
| --- | --- |
| --- | --- |
| --- | --- |
| · | the impact on our results of the substantial increases in our outstanding indebtedness and related interest expense due to the dividend recapitalization transactions completed in May 2012 and 2013; |
| --- | --- |
| --- | --- |
| --- | --- |
| --- | --- |
| --- | --- |
| --- | --- |
| --- | --- |
| --- | --- |
An excerpt. Shown here: 40 of 72 rewritten, all 31 added and all 19 removed. The counts are complete. For every sentence, read Cover and table of contents in the FY2014 filing and the FY2013 filing.
Item 2. Properties
17 rewritten, 8 added, 2 removed, 3 unchanged
Read the full itemFY2014 item · filed February 27, 2015FY2013 item · filed March 3, 2014
We own, operate or lease manufacturing and distribution facilities located principally in [removed: Wisconsin (USA),] [added: the United States,] Mexico, Italy and Brazil totaling over [removed: 3] [added: 3.5] million square feet.
| [removed: Location] [added: Location] | [removed: Owned / Leased] | [removed: Square Footage] [added: Owned/ Leased] | [removed: Activities] | [added: Square Footage | | | Activities |]
| Waukesha, WI | [added: |] Owned | [added: |] 307,000 | [added: | |] Corporate headquarters, manufacturing, storage, research and development, service parts distribution |
| Eagle, WI | [added: |] Owned | [added: |] 242,000 | [added: | |] Manufacturing, office, training |
| Whitewater, WI | [added: |] Owned | [added: |] 491,000 | [added: | |] Manufacturing, office, distribution |
| Oshkosh, WI | [added: |] Owned | [added: |] 255,000 | [added: | |] Manufacturing, storage, research and development |
| Berlin, WI | [added: |] Owned | [added: |] 129,000 | [added: | |] Manufacturing, office |
| Fort Atkinson, WI | [added: |] Leased | [removed: 237,000] | [added: 85,000 | | |] Storage |
| Edgerton, WI | [added: |] Leased | [removed: 575,000] | [added: 235,000 | | |] Storage |
| Maquoketa, IA | [added: |] Owned | [added: |] 137,000 | [added: | |] Storage, rental property |
| Jefferson, WI | [added: |] Owned | [added: |] 253,000 | [added: | |] Manufacturing, distribution |
| Jefferson, WI | [added: |] Leased | [removed: 441,000] | [removed: Recently leased, soon-to-be-storage] [added: 556,000] | [added: | | Storage |]
| Mexico City, Mexico | [added: |] Owned | [removed: 161,000] | [added: 180,000 | | |] Manufacturing, sales, distribution, storage, office |
| Curitiba, Brazil | [added: |] Leased | [added: |] 26,000 | [added: | |] Manufacturing, sales, distribution, storage, office |
| Milan, Italy | [added: |] Leased | [removed: 118,000] | [added: 91,000 | | |] Manufacturing, sales, distribution, storage, office |
| Milton Keynes, England | [added: |] Leased | [added: |] 9,000 | [added: | |] Sales, distribution, storage, office |
As of December 31, [removed: 2013,] [added: 2014,] substantially all of our owned properties are subject to collateral provisions under our senior secured credit facilities.
| --- | --- | --- | --- | --- | --- | --- | --- |
| | | | | | | | |
| Berlin, WI | | Leased | | 192,500 | | | Storage |
| Bismarck, ND | | Owned | | 50,000 | | | Manufacturing and office |
| Glenburn, ND | | Owned | | 20,000 | | | Manufacturing and office |
| Marietta, GA | | Leased | | 49,000 | | | Office, distribution and warehouse |
| Kearney, NE | | Leased | | 160,000 | | | Manufacturing, office, distribution, warehouse |
| Mexico City, Mexico | | Leased | | 71,000 | | | Storage and warehouse |
| --- | --- | --- | --- |
| Berlin, WI | Leased | 123,000 | Manufacturing, storage, research and development |
Item 4. Mine Safety Disclosures
1 rewritten, 0 added, 0 removed, 1 unchanged
Read the full itemFY2014 item · filed February 27, 2015FY2013 item · filed March 3, 2014
[removed: PART II][added: PART II]
Item 5. Market for Registrant’s Common Equity, Related Stockholder Matters and Issuer Purchases of Equity Securities
20 rewritten, 19 added, 21 removed, 14 unchanged
Read the full itemFY2014 item · filed February 27, 2015FY2013 item · filed March 3, 2014
[removed: Price] [added: Price] Range of Common [removed: Stock][added: Stock]
Shares of our common stock are traded on the New York Stock Exchange (NYSE) under the symbol “GNRC.” The following table sets forth the high and low sales prices reported on the NYSE for our common stock by fiscal quarter during [removed: 2013] [added: 2014] and [removed: 2012,] [added: 2013,] respectively.
| [added: 2014] | | [removed: High] [added: High] | | | | [removed: Low] [added: Low] | | |
| [added: 2013] | | [removed: High] [added: High] | | | | [removed: Low] [added: Low] | | |
The following table summarizes the stock repurchase activity for the [removed: twelve] [added: three] months ended December 31, [removed: 2013,] [added: 2014,] which consisted of the withholding of shares upon the vesting of restricted stock awards to pay withholding taxes:
| [removed: (in thousands, except share and per share data)] | | [removed: Total Number of Shares Purchased] | | [removed: | | Average Price Paid per Share | |] [added: Total Number of Shares Purchased] | | [removed: Total Number Of Shares Purchased As Part Of Publicly Announced Plans Or Programs] | | [added: Average Price Paid per Share] | | [removed: Approximate Dollar Value Of Shares That May Yet Be Purchased Under The Plans Or Programs] | [added: Total Number Of Shares Purchased As Part Of Publicly Announced Plans Or Programs] | [added: Approximate Dollar Value Of Shares That May Yet Be Purchased Under The Plans Or Programs] |
For equity compensation plan information, please refer to [removed: note 10] [added: Note 15, “Share Plans,” to the consolidated financial statements included] in Item 8 [removed: in Part II] of this [added: Annual Report on Form] 10-K.
[removed: Stock] [added: Stock] Performance [removed: Graph][added: Graph]
The line graph below compares the cumulative total stockholder return on our common stock with the cumulative total return of the Standard & Poor’s S&P 500 [removed: Index and] [added: Index, the] S&P 500 Industrials Index [added: and the Russell 2000 Index] for the [removed: year] [added: approximate five-year period] ended December 31, [removed: 2013.][added: 2014.]
The graph and table assume that $100 was invested on February 11, 2010 (first day of trading) in each of our common stock, the S&P 500 Index, [added: the] S&P 500 Industrials Index, [added: the Russell 2000 Index,] and that all dividends were reinvested.
Cumulative total stockholder returns for our common stock, the S&P 500 Index, [removed: and] the S&P 500 Industrials Index [added: and the Russell 2000 Index] are based on our fiscal year.
[removed: 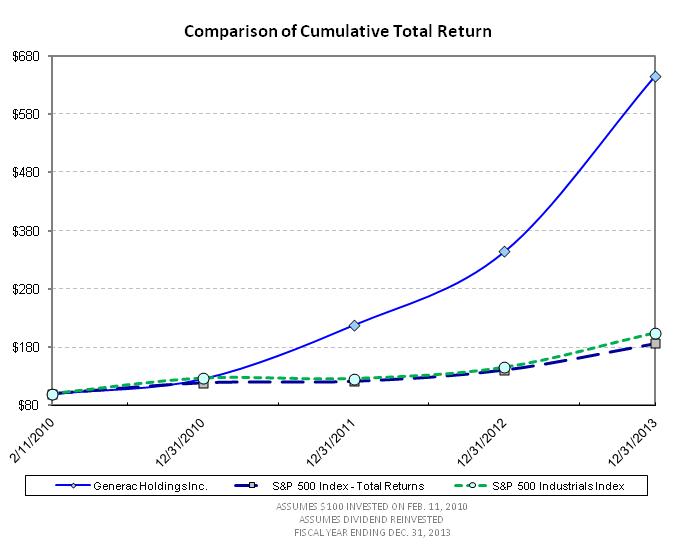][added: 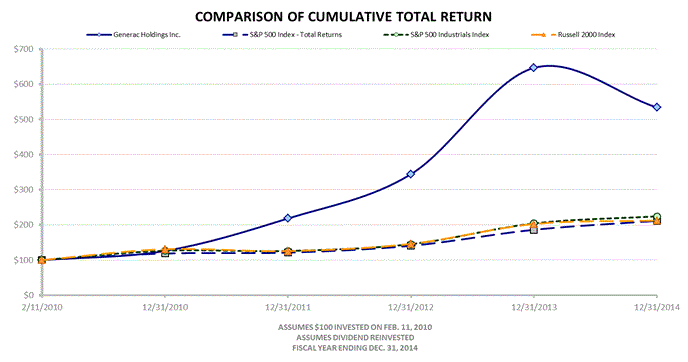]
[removed: Holders][added: Holders]
As of February [removed: 24, 2014,] [added: 20, 2015,] there were approximately [removed: 139] [added: 169] registered holders of record of Generac’s common stock.
[removed: Dividends][added: Dividends]
On June 21, 2013, the Company used a portion of the proceeds from the May 31, 2013 debt refinancing (see [removed: footnote #6 – Credit Agreements] [added: Note 11, “Credit Agreements,” to the consolidated financial statements included] in Item 8 of this Annual Report on Form 10-K) to pay a special cash dividend of $5.00 per share on its common stock, resulting in payments totaling $340.8 million to stockholders.
We currently do not have plans to pay [removed: any further] dividends on our common stock in the [removed: near term.][added: foreseeable future.]
[removed: Securities] [added: Securities] Authorized for Issuance Under Equity Compensation [removed: Plans][added: Plans]
[removed: Recent] [added: Recent] Sales of Unregistered [removed: Securities][added: Securities]
[removed: Use] [added: Use] of Proceeds from Registered [removed: Securities][added: Securities]
| Fourth Quarter | | $ | 48.00 | | | $ | 38.85 | |
| Third Quarter | | $ | 48.02 | | | $ | 40.54 | |
| Second Quarter | | $ | 60.36 | | | $ | 46.27 | |
| First Quarter | | $ | 61.17 | | | $ | 45.72 | |
| --- | --- | --- | --- | --- | --- | --- | --- | --- | --- | --- | --- | --- |
| | | | | | | | | | | | | |
| 10/01/14 | \- | 10/31/14 | | | 615 | | | $ | 44.25 | | N/A | N/A |
| 11/01/14 | \- | 11/30/14 | | | 6,185 | | | $ | 41.52 | | N/A | N/A |
| 12/01/14 | \- | 12/31/14 | | | 122 | | | $ | 41.93 | | N/A | N/A |
| Total | | | | | 6,922 | | | $ | 41.77 | | | |
| Company / Market / Peer Group | | 2/11/2010 | | | | 12/31/2010 | | | | 12/31/2011 | | | | 12/31/2012 | | | | 12/31/2013 | | | | 12/31/2014 | | |
| --- | --- | --- | --- | --- | --- | --- | --- | --- | --- | --- | --- | --- | --- | --- | --- | --- | --- | --- | --- | --- | --- | --- | --- | --- |
| | | | | | | | | | | | | | | | | | | | | | | | | |
| Generac Holdings Inc. | | $ | 100.00 | | | $ | 125.93 | | | $ | 218.30 | | | $ | 344.40 | | | $ | 646.54 | | | $ | 533.76 | |
| S&P 500 Index - Total Returns | | | 100.00 | | | | 118.71 | | | | 121.22 | | | | 140.62 | | | | 186.16 | | | | 211.65 | |
| S&P 500 Industrials Index | | | 100.00 | | | | 126.65 | | | | 125.90 | | | | 145.23 | | | | 204.30 | | | | 224.38 | |
| Russell 2000 Index | | | 100.00 | | | | 130.86 | | | | 125.40 | | | | 145.94 | | | | 202.61 | | | | 212.53 | |
On June 29, 2012, the Company used a portion of the proceeds from the May 30, 2012 debt refinancing (see Note 11, “Credit Agreements,” to the consolidated financial statements in Item 8 of this Annual Report on Form 10-K) together with cash on its balance sheet to pay a special cash dividend of $6.00 per share on its common stock, resulting in payments totaling $404.3 million to stockholders.
For information on securities authorized for issuance under our equity compensation plans, see “Item 12 - Security Ownership of Certain Beneficial Owners and Management and Related Stockholder Matters,” which is incorporated herein by reference.
| | | 2013 | | | | | | |
| | | 2012 | | | | | | |
| Fourth Quarter | | $ | 39.18 | | | $ | 24.43 | |
| Third Quarter | | $ | 25.33 | | | $ | 18.35 | |
| Second Quarter | | $ | 30.61 | | | $ | 22.40 | |
| First Quarter | | $ | 30.50 | | | $ | 24.27 | |
| --- | --- | --- | --- | --- | --- | --- | --- | --- | --- | --- | --- | --- | --- | --- | --- | --- |
| 01/01/13 - 01/31/13 | | | \- | | | $ | \- | | | | N/A | | | | N/A | |
| 02/01/13 - 02/28/13 | | | 162,819 | | | $ | 40.18 | | | | N/A | | | | N/A | |
| 03/01/13 - 03/31/13 | | | \- | | | $ | \- | | | | N/A | | | | N/A | |
| 04/01/13 - 04/30/13 | | | \- | | | $ | \- | | | | N/A | | | | N/A | |
| 05/01/13 - 05/31/13 | | | \- | | | $ | \- | | | | N/A | | | | N/A | |
| 06/01/13 - 06/30/13 | | | \- | | | $ | \- | | | | N/A | | | | N/A | |
| 07/01/13 - 07/31/13 | | | \- | | | $ | \- | | | | N/A | | | | N/A | |
| 08/01/13 - 08/31/13 | | | 227 | | | $ | 42.09 | | | | N/A | | | | N/A | |
| 09/01/13 - 09/30/13 | | | \- | | | $ | \- | | | | N/A | | | | N/A | |
| 10/01/13 - 10/31/13 | | | \- | | | $ | \- | | | | N/A | | | | N/A | |
| 11/01/13 - 11/30/13 | | | 412 | | | $ | 46.42 | | | | N/A | | | | N/A | |
| 12/01/13 - 12/31/13 | | | \- | | | $ | \- | | | | N/A | | | | N/A | |
| Total | | | 163,458 | | | $ | 40.20 | | | | | | | | | |
The information required by this item will be included in our 2014 Proxy Statement and is incorporated herein by reference.
Item 6. Selected Financial Data
115 rewritten, 44 added, 18 removed, 40 unchanged
Read the full itemFY2014 item · filed February 27, 2015FY2013 item · filed March 3, 2014
The selected historical consolidated financial data for the years ended December 31, [removed: 2013, 2012] [added: 2014, 2013] and [removed: 2011] [added: 2012] are derived from our audited consolidated financial statements included elsewhere in this annual report.
The selected historical consolidated financial data for the years ended December 31, [removed: 2010] [added: 2011] and [removed: December 31, 2009 are] [added: 2010 is] derived from our audited historical consolidated financial statements not included in this annual report.
[removed: You] [added: This information] should [added: be] read [removed: this information] together with “Item 7—Management's Discussion and Analysis of Financial Condition and Results of Operations” and our consolidated financial statements and related notes [added: thereto] included in Item 8 of this Annual Report on Form 10-K.
| [removed: (Dollars] [added: (Dollars] in thousands, except per share [removed: data)] [added: data)] | | [removed: Year ended December 31, 2013] [added: Year Ended December 31, 2014] | | | | [removed: Year ended December 31, 2012] [added: Year Ended December 31, 2013] | | | | [removed: Year ended December 31, 2011] [added: Year Ended December 31, 2012] | | | | [removed: Year ended December 31, 2010] [added: Year Ended December 31, 2011] | | | | [removed: Year ended December 31, 2009] [added: Year Ended December 31, 2010] | | |
| [removed: Statement] [added: Statement] of [removed: operations data:] [added: Operations Data:] | | | | | | | | | | | | | | | | | | | | |
| Net sales | | $ | [removed: 1,485,765] [added: 1,460,919] | | | $ | [removed: 1,176,306] [added: 1,485,765] | | | $ | [removed: 791,976] [added: 1,176,306] | | | $ | [removed: 592,880] [added: 791,976] | | | $ | [removed: 588,248] [added: 592,880] | |
| Costs of goods sold | | | [removed: 916,205] [added: 944,700] | | | | [removed: 735,906] [added: 916,205] | | | | [removed: 497,322] [added: 735,906] | | | | [removed: 355,523] [added: 497,322] | | | | [removed: 352,398] [added: 355,523] | |
| Gross profit | | | [removed: 569,560] [added: 516,219] | | | | [removed: 440,400] [added: 569,560] | | | | [removed: 294,654] [added: 440,400] | | | | [removed: 237,357] [added: 294,654] | | | | [removed: 235,850] [added: 237,357] | |
| Selling and service | | | [removed: 107,515] [added: 120,408] | | | | [removed: 101,448] [added: 107,515] | | | | [removed: 77,776] [added: 101,448] | | | | [removed: 57,954] [added: 77,776] | | | | [removed: 59,823] [added: 57,954] | |
| Research and development | | | [removed: 29,271] [added: 31,494] | | | | [removed: 23,499] [added: 29,271] | | | | [removed: 16,476] [added: 23,499] | | | | [removed: 14,700] [added: 16,476] | | | | [removed: 10,842] [added: 14,700] | |
| General and administrative | | | [removed: 55,490] [added: 54,795] | | | | [removed: 46,031] [added: 55,490] | | | | [removed: 30,012] [added: 46,031] | | | | [removed: 22,599] [added: 30,012] | | | | [removed: 14,713] [added: 22,599] | |
| Amortization of intangibles (1) | | | [removed: 25,819] [added: 21,024] | | | | [removed: 45,867] [added: 25,819] | | | | [removed: 48,020] [added: 45,867] | | | | [removed: 51,808] [added: 48,020] | | | | [removed: 51,960] [added: 51,808] | |
| Trade name write-down (2) | | | [removed: —] [added: \-] | | | | [removed: —] [added: \-] | | | | [removed: 9,389] [added: \-] | | | | [removed: —] [added: 9,389] | | | | [removed: —] [added: \-] | |
| Total operating expenses | | | [removed: 218,095] [added: 222,844] | | | | [removed: 216,845] [added: 218,095] | | | | [removed: 181,673] [added: 216,845] | | | | [removed: 147,061] [added: 181,673] | | | | [removed: 137,338] [added: 147,061] | |
| Income from operations | | | [removed: 351,465] [added: 293,375] | | | | [removed: 223,555] [added: 351,465] | | | | [removed: 112,981] [added: 223,555] | | | | [removed: 90,296] [added: 112,981] | | | | [removed: 98,512] [added: 90,296] | |
| Interest expense | | | [removed: (54,435] [added: (47,215] | ) | | | [removed: (49,114] [added: (54,435] | ) | | | [removed: (23,718] [added: (49,114] | ) | | | [removed: (27,397] [added: (23,718] | ) | | | [removed: (70,862] [added: (27,397] | ) |
| [removed: (Loss) gain] [added: Loss] on extinguishment of debt [removed: (3)] [added: (4)] | | | [removed: (15,336] [added: (2,084] | ) | | | [removed: (14,308] [added: (15,336] | ) | | | [removed: (377] [added: (14,308] | ) | | | [removed: (4,809] [added: (377] | ) | | | [removed: 14,745] [added: (4,809] | [added: )] |
| Investment income | | | [removed: 91] [added: 130] | | | | [removed: 79] [added: 91] | | | | [removed: 110] [added: 79] | | | | [removed: 235] [added: 110] | | | | [removed: 2,205] [added: 235] | |
| Costs related to acquisition | | | [removed: (1,086] [added: (396] | ) | | | [removed: (1,062] [added: (1,086] | ) | | | [removed: (875] [added: (1,062] | ) | | | [removed: —] [added: (875] | [added: )] | | | [removed: —] [added: \-] | |
| Other, net | | | [removed: (1,983] [added: (1,462] | ) | | | [removed: (2,798] [added: (1,983] | ) | | | [removed: (1,155] [added: (2,798] | ) | | | [removed: (1,105] [added: (1,155] | ) | | | [removed: (1,206] [added: (1,105] | ) |
| Total other expense, net | | | [removed: (72,749] [added: (35,013] | ) | | | [removed: (67,203] [added: (72,749] | ) | | | [removed: (26,015] [added: (67,203] | ) | | | [removed: (33,076] [added: (26,015] | ) | | | [removed: (55,118] [added: (33,076] | ) |
| Income before provision for income taxes | | | [removed: 278,716] [added: 258,362] | | | | [removed: 156,352] [added: 278,716] | | | | [removed: 86,966] [added: 156,352] | | | | [removed: 57,220] [added: 86,966] | | | | [removed: 43,394] [added: 57,220] | |
| Provision (benefit) for income taxes [removed: (4)] [added: (5)] | | | [added: 83,749 | | | |] 104,177 | | | | 63,129 | | | | (237,677 | ) | | | 307 | | [removed: | | 339 | |]
| Net income | | $ | [removed: 174,539] [added: 174,613] | | | $ | [removed: 93,223] [added: 174,539] | | | $ | [removed: 324,643] [added: 93,223] | | | $ | [removed: 56,913] [added: 324,643] | | | $ | [removed: 43,055] [added: 56,913] | |
| Income [added: (loss)] per share - diluted: | | | | | | | | | | | | | | | | | | | | |
| Common Stock (formerly Class A non-voting common stock) [removed: (5)] [added: (6)] | | [added: $] | [removed: 2.51] [added: 2.49] | | | [added: $] | [removed: 1.35] [added: 2.51] | | | [added: $] | [removed: 4.79] [added: 1.35] | | | [added: $] | [removed: (1.65] [added: 4.79] | [removed: )] | | [added: $] | [removed: (41,111] [added: (1.65] | ) |
| Class B Common Stock [removed: (5) |] [added: (6)] | | n/a | | | | n/a | | | | n/a | | | | [removed: 505] [added: n/a] | | | | [removed: 4,171] | [added: 505.00] | [added: |]
| [removed: Statement] [added: Statement] of [removed: cash flows data:] [added: Cash Flows data:] | | | | | | | | | | | | | | | | | | | | |
| Depreciation | | [added: $] | [removed: 10,955] [added: 13,706] | | | [added: $] | [removed: 8,293] [added: 10,955] | | | [added: $] | [removed: 8,103] [added: 8,293] | | | [added: $] | [removed: 7,632] [added: 8,103] | | | [added: $] | [removed: 7,715] [added: 7,632] | |
| Amortization [added: of intangible assets] | | | [removed: 25,819] [added: 21,024] | | | | [removed: 45,867] [added: 25,819] | | | | [removed: 48,020] [added: 45,867] | | | | [removed: 51,808] [added: 48,020] | | | | [removed: 51,960] [added: 51,808] | |
| Expenditures for property and equipment | | | [removed: (30,770] [added: (34,689] | ) | | | [removed: (22,392] [added: (30,770] | ) | | | [removed: (12,060] [added: (22,392] | ) | | | [removed: (9,631] [added: (12,060] | ) | | | [removed: (4,525] [added: (9,631] | ) |
| [removed: Other financial data:] [added: Other Financial Data:] | | | | | | | | | | | | | | | | | | | | |
| Adjusted EBITDA [removed: (6)] [added: (7)] | | [added: $] | [removed: 402,613] [added: 337,283] | | | [added: $] | [removed: 289,809] [added: 402,613] | | | [added: $] | [removed: 188,476] [added: 289,809] | | | [added: $] | [removed: 156,249] [added: 188,476] | | | [added: $] | [removed: 159,087] [added: 156,249] | |
| Adjusted Net Income [removed: (7)] [added: (8)] | | | [removed: 301,664] [added: 234,165] | | | | [removed: 220,792] [added: 301,664] | | | | [removed: 147,176] [added: 220,792] | | | | [removed: 115,954] [added: 147,176] | | | | [removed: 83,643] [added: 115,954] | |
| [removed: (Dollars] [added: (Dollars] in [removed: thousands)] [added: thousands)] | | [removed: As] [added: As] of [removed: December 31, 2013] [added: December 31, 2014] | | | | [removed: As] [added: As] of [removed: December 31, 2012] [added: December 31, 2013] | | | | [removed: As] [added: As] of [removed: December 31, 2011] [added: December 31, 2012] | | | | [removed: As] [added: As] of [removed: December 31, 2010] [added: December 31, 2011] | | | | [removed: As] [added: As] of [removed: December 31, 2009] [added: December 31, 2010] | | |
| [removed: Balance sheet data:] [added: Balance Sheet Data:] | | | | | | | | | | | | | | | | | | | | |
| Current assets | | $ | [removed: 654,179] [added: 730,478] | | | $ | [removed: 522,553] [added: 654,179] | | | $ | [removed: 383,265] [added: 522,553] | | | $ | [removed: 272,519] [added: 383,265] | | | $ | [removed: 345,017] [added: 272,519] | |
| Property, plant and equipment, net | | | [removed: 146,390] [added: 168,821] | | | | [removed: 104,718] [added: 146,390] | | | | [removed: 84,384] [added: 104,718] | | | | [removed: 75,287] [added: 84,384] | | | | [removed: 73,374] [added: 75,287] | |
| Goodwill | | | [removed: 608,287] [added: 635,565] | | | | [removed: 552,943] [added: 608,287] | | | | [removed: 547,473] [added: 552,943] | | | | [removed: 527,148] [added: 547,473] | | | | [removed: 525,875] [added: 527,148] | |
| Other intangibles and other assets | | | [removed: 389,349] [added: 347,678] | | | | [removed: 423,633] [added: 389,349] | | | | [removed: 537,671] [added: 423,633] | | | | [removed: 334,929] [added: 537,671] | | | | [removed: 392,977] [added: 334,929] | |
| Gain on remeasurement of contingent consideration (3) | | | (4,877 | ) | | | \- | | | | \- | | | | \- | | | | \- | |
| Gain on change in contractual interest rate (4) | | | 16,014 | | | | \- | | | | \- | | | | \- | | | | \- | |
(3) During the second quarter of 2014, we recorded a gain of $4.9 million related to an adjustment to a certain earn-out obligation in connection with a recent acquisition.
(4) For the years ended December 31, 2014, 2013 and 2012, represents the losses on extinguishment of debt and gain on change in contractual interest rate as described in Note 11, “Credit Agreements,” to the consolidated financial statements in Item 8 of this Annual Report on Form 10-K.
Refer to Note 13, “Income Taxes,” to the consolidated financial statements in Item 8 of this Annual Report on Form 10-K for additional details on the tax provision for the years ended December 31, 2014, 2013 and 2012.
| --- | --- | --- |
| --- | --- | --- |
| --- | --- | --- |
| --- | --- | --- |
| --- | --- | --- |
| --- | --- | --- |
| --- | --- | --- |
| --- | --- | --- |
| --- | --- | --- |
| --- | --- | --- |
| --- | --- | --- |
| --- | --- | --- |
| --- | --- | --- |
| --- | --- | --- |
| --- | --- | --- |
| --- | --- | --- |
| --- | --- | --- |
| --- | --- | --- |
| Gain on change in contractual interest rate (c) | | | (16,014 | ) | | | \- | | | | \- | | | | \- | | | | \- | |
| | ● | for the year ended December 31, 2014, primarily $4.9 million adjustment to a certain earn-out obligation in connection with a recent acquisition. Also includes loss on disposal of assets and unrealized mark-to-market adjustments on commodity contracts; |
| --- | --- | --- |
| --- | --- | --- |
| --- | --- | --- |
| --- | --- | --- |
| --- | --- | --- |
| --- | --- | --- |
| --- | --- | --- |
(c) For the years ended December 31, 2014, 2013 and 2012, represents the losses on extinguishment of debt and gain on change in contractual interest rate as described in Note 11, “Credit Agreements,” to the consolidated financial statements included in Item 8 of this Annual Report on Form 10-K.
| --- | --- | --- |
| --- | --- | --- |
| --- | --- | --- |
| --- | --- | --- |
| --- | --- | --- |
| --- | --- | --- |
| --- | --- | --- |
| | | | | | | | | | | | | | | | | | | | | |
| Redeemable stock (8) | | | — | | | | — | | | | — | | | | — | | | | 878,205 | |
(3) During 2013, the Company wrote-off a portion of deferred financing costs and original issue discount as a result of accelerated debt repayments in February and May 2013.
Additionally, the Company recorded a loss on extinguishment of debt during 2013 as a result of the refinancing transaction that occurred on May 31, 2013.
During 2012, the Company recorded a loss on extinguishment of debt related to the refinancing transactions that occurred on February 9, 2012 and May 30, 2012.
During 2009, affiliates of CCMP acquired $9.9 million principal amount of first lien term loans and $20.0 million principal amount of second lien term loans for approximately $14.8 million.
CCMP's affiliates exchanged this debt for 1,475.4596 shares of Series A Preferred Stock.
The fair value of the shares exchanged was $14.8 million.
We recorded this transaction as additional Series A Preferred Stock of $14.8 million based on the fair value of the debt contributed by CCMP's affiliates, which approximated the fair value of shares exchanged.
The debt was held in treasury at face value.
Consequently, we recorded a gain on extinguishment of debt of $14.7 million, which includes a write-off of deferred financing fees and other closing costs, in the consolidated statement of operations for the year ended December 31, 2009.
See Note 8 – Income Taxes in Item 8 of this Annual Report on Form 10-K for additional details.
We believe it is useful to adjust net income for these items because the charges do not represent a cash outlay in the period in which the charge is incurred, although Adjusted EBITDA must always be used together with our U.S. GAAP statements of income and cash flows to capture the full effect of these contracts on our operating performance;
(c) Represents the loss (gain) on extinguishment of debt from:
- for the year ended December 31, 2012, represents the loss on extinguishment of debt related to the refinancing transactions that occurred on February 9, 2012 and May 30, 2012;
- for the years ended December 31, 2011 and 2010, represents the write-off of a portion of deferred financing costs related to accelerated repayments of debt;
- for the year ended December 31, 2009, represents non-cash gains on the extinguishment of debt repurchased by affiliates of CCMP, as described in note (3) above, which we do not expect to recur;
(8) Includes our Series A Preferred Stock and Class B Common Stock.
An excerpt. Shown here: 40 of 115 rewritten, 40 of 44 added and all 18 removed. The counts are complete. For every sentence, read Item 6. Selected Financial Data in the FY2014 filing and the FY2013 filing.
Item 8. Financial Statements and Supplementary Data
627 rewritten, 210 added, 236 removed, 318 unchanged
Read the full itemFY2014 item · filed February 27, 2015FY2013 item · filed March 3, 2014
[removed: Report] [added: Report] of Independent Registered Public Accounting [removed: Firm][added: Firm]
We have audited Generac Holdings Inc.’s internal control over financial reporting as of December 31, [removed: 2013,] [added: 2014,] based on criteria established in Internal Control—Integrated Framework issued by the Committee of Sponsoring Organizations of the Treadway Commission [removed: (1992] [added: (2013] Framework) (the COSO criteria).
As indicated in the accompanying Management’s Report on Internal Control Over Financial Reporting, management’s assessment of and conclusion on the effectiveness of internal control over financial reporting did not include the internal controls of the [removed: Tower Light or Baldor Generators] [added: Powermate and MAC] businesses, which are included in the December 31, [removed: 2013] [added: 2014] consolidated financial statements of Generac Holdings [removed: Inc.] [added: Inc.,] and constituted [removed: 4.2%] [added: 2.2%] and [removed: 15.1%] [added: 0.1%] of total and net assets, respectively, as of December 31, [removed: 2013] [added: 2014] and [removed: 2.8%] [added: 1.6%] and [removed: 1.0%] [added: 0.4%] of revenues and net income, respectively, for the year then ended.
Our audit of internal control over financial reporting of Generac Holdings Inc. also did not include an evaluation of the internal control over financial reporting of [removed: Tower Light or Baldor Generators.][added: Powermate and MAC.]
In our opinion, Generac Holdings Inc. maintained, in all material respects, effective internal control over financial reporting as of December 31, [removed: 2013,] [added: 2014,] based on the COSO criteria.
We also have audited, in accordance with the standards of the Public Company Accounting Oversight Board (United States), the consolidated balance sheets as of December 31, [removed: 2013] [added: 2014] and [removed: 2012,] [added: 2013,] and related consolidated statements of comprehensive income, stockholders' equity and cash flows for each of the three years in the period ended December 31, [removed: 2013] [added: 2014] of Generac Holdings Inc. and our report dated [removed: March 3, 2014] [added: February 27, 2015] expressed an unqualified opinion thereon.
[removed: Report] [added: Report] of Independent Registered Public Accounting [removed: Firm][added: Firm]
We have audited the accompanying consolidated balance sheets of Generac Holdings Inc. (the Company) as of December 31, [removed: 2013] [added: 2014] and [removed: 2012,] [added: 2013,] and the related consolidated statements of comprehensive income, stockholders’ equity and cash flows for each of the three years in the period ended December 31, [removed: 2013.][added: 2014.]
In our opinion, the financial statements referred to above present fairly, in all material respects, the consolidated financial position of Generac Holdings Inc. at December 31, [removed: 2013] [added: 2014] and [removed: 2012,] [added: 2013,] and the consolidated results of its operations and its cash flows for each of the three years in the period ended December 31, [removed: 2013,] [added: 2014,] in conformity with U.S. generally accepted accounting principles.
We also have audited, in accordance with the standards of the Public Company Accounting Oversight Board (United States), Generac Holdings Inc.’s internal control over financial reporting as of December 31, [removed: 2013,] [added: 2014,] based on criteria established in Internal Control-Integrated Framework issued by the Committee of Sponsoring Organizations of the Treadway Commission [removed: (1992] [added: (2013] Framework) and our report dated [removed: March 3, 2014] [added: February 27, 2015] expressed an unqualified opinion thereon.
[removed: |] Generac Holdings Inc. [removed: | | | | | | | | |]
[removed: |] Consolidated Balance Sheets [removed: | | | | | | | | |]
[removed: | (Dollars] [added: _(Dollars] in Thousands, Except Share and Per Share [removed: Data) | | | | | | | | |][added: Data)_]
| | | [removed: December 31,] [added: December 31,] | | | | | | |
| | | [removed: 2013] [added: 2014] | | | | [removed: 2012] [added: 2013] | | | [added: | 2012 | | |]
| [removed: Assets] [added: Assets] | | | | | | | | |
| Cash and cash equivalents [added: at beginning of period] | | [removed: $] | 150,147 | | | [removed: $] | 108,023 | | [added: | | 93,126 | |]
| Restricted cash | | | [removed: 6,645] [added: \-] | | | | [removed: –] [added: 6,645] | |
| Accounts receivable, less allowance for doubtful accounts of [removed: $2,658] [added: $2,275] at December 31, [removed: 2013] [added: 2014] and [removed: $1,166] [added: $2,658] at December 31, [removed: 2012] [added: 2013] | | | [removed: 164,907] [added: 189,107] | | | | [removed: 134,978] [added: 164,907] | |
| Inventories | | | [removed: 300,253] [added: 319,385] | | | | [removed: 225,817] [added: 300,253] | |
| Deferred income taxes | | | [removed: 26,869] [added: 22,841] | | | | [removed: 48,687] [added: 26,869] | |
| Prepaid expenses and other assets | | | [removed: 5,358] [added: 9,384] | | | | [removed: 5,048] [added: 5,358] | |
| Total current assets | | | [removed: 654,179] [added: 730,478] | | | | [removed: 522,553] [added: 654,179] | |
| Property and equipment, net | | | [removed: 146,390] [added: 168,821] | | | | [removed: 104,718] [added: 146,390] | |
| Customer lists, net | | | [removed: 42,764] [added: 41,002] | | | | [removed: 37,823] [added: 42,764] | |
| Patents, net | | | [removed: 62,418] [added: 56,894] | | | | [removed: 70,302] [added: 62,418] | |
| Other intangible assets, net | | | [removed: 4,447] [added: 4,298] | | | | [removed: 5,783] [added: 4,447] | |
| Deferred financing costs, net | | | [removed: 20,051] [added: 16,243] | | | | [removed: 13,987] [added: 20,051] | |
| Trade names, net | | | [removed: 173,196] [added: 182,684] | | | | [removed: 158,831] [added: 173,196] | |
| Goodwill | | | [removed: 608,287] [added: 635,565] | | | | [removed: 552,943] [added: 608,287] | |
| Deferred income taxes | | | [removed: 85,104] [added: 46,509] | | | | [removed: 136,754] [added: 85,104] | |
| Other assets | | | [removed: 1,369] [added: 48] | | | | [removed: 153] [added: 1,369] | |
| Total assets | | $ | [removed: 1,798,205] [added: 1,882,542] | | | $ | [removed: 1,603,847] [added: 1,798,205] | |
| [removed: Liabilities] [added: Liabilities] and stockholders’ [removed: equity] [added: equity] | | | | | | | | |
| Short-term borrowings | | $ | [removed: 9,575] [added: 5,359] | | | $ | [removed: 12,550] [added: 9,575] | |
| Accounts payable | | | [removed: 109,238] [added: 132,248] | | | | [removed: 94,543] [added: 109,238] | |
| Accrued wages and employee benefits | | | [removed: 26,564] [added: 17,544] | | | | [removed: 19,435] [added: 26,564] | |
| Other accrued liabilities | | | [removed: 92,997] [added: 84,814] | | | | [removed: 86,081] [added: 92,997] | |
| Current portion of long-term borrowings and capital lease obligations | | | [removed: 12,471] [added: 557] | | | | [removed: 82,250] [added: 12,471] | |
| Total current liabilities | | | [removed: 250,845] [added: 240,522] | | | | [removed: 294,859] [added: 250,845] | |
February 27, 2015
February 27, 2015
| | | 2014 | | | | 2013 | | |
| Gain on remeasurement of contingent consideration | | | (4,877 | ) | | | \- | | | | \- | |
| Gain on change in contractual interest rate | | | 16,014 | | | | \- | | | | \- | |
| | | | | | | | | | | | | | | | | | | | | | | | | | | | | | | | | | | | | |
| --- | --- | --- | --- | --- | --- | --- | --- | --- | --- | --- | --- | --- | --- | --- | --- | --- | --- | --- | --- | --- | --- | --- | --- | --- | --- | --- | --- | --- | --- | --- | --- | --- | --- | --- | --- | --- |
| | | | | | | | | | | | | | | | | | | | | | | | | | | | | | | | | | | | | |
| | | | | | | | | | | | | | | | | | | | | | | | | | | | | | | | | | | | | |
| | | | | | | | | | | | | | | | | | | | | | | | | | | | | | | | | | | | | |
| Treasury stock purchases | | | \- | | | | \- | | | | \- | | | | (34,854 | ) | | | (1,770 | ) | | | \- | | | | \- | | | | \- | | | | (1,770 | ) |
| Dividends declared | | | \- | | | | \- | | | | 28 | | | | \- | | | | \- | | | | \- | | | | \- | | | | \- | | | | 28 | |
| Net income | | | \- | | | | \- | | | | \- | | | | \- | | | | \- | | | | \- | | | | 174,613 | | | | \- | | | | 174,613 | |
| | | | | | | | | | | | | | | | | | | | | | | | | | | | | | | | | | | | | |
| Balance at December 31, 2014 | | | 69,122,271 | | | $ | 691 | | | $ | 434,906 | | | | (198,312 | ) | | $ | (8,341 | ) | | $ | (202,116 | ) | | $ | 280,426 | | | $ | (15,767 | ) | | $ | 489,799 | |
| Gain on change in contractual interest rate | | | (16,014 | ) | | | \- | | | | \- | |
| Gain on remeasurement of contingent consideration | | | (4,877 | ) | | | \- | | | | \- | |
Generac’s power products are available globally through a broad network of independent dealers, distributors, retailers, wholesalers and equipment rental companies, as well as sold direct to certain end user customers.
Over the past several years, we have executed a number of acquisitions that support our strategic plan.
A summary of these acquisitions include the following:
| | ● | On October 3, 2011, we acquired substantially all the assets of Magnum Products (Magnum), a supplier of generator powered light towers and mobile generators for a variety of industries and specialties. The Magnum business is a strategic fit for us as it provides diversification, with the introduction of new engine powered products, distribution channels and end markets. |
| --- | --- | --- |
| | ● | On December 8, 2012, we acquired the equity of Ottomotores UK and its affiliates (Ottomotores), with operations in Mexico City, Mexico and Curitiba, Brazil. Ottomotores is a leading manufacturer in the Mexican market for industrial diesel gensets and is a market participant throughout all of Latin America. |
| | ● | On August 1, 2013, we acquired the equity of Tower Light SRL and its wholly-owned subsidiaries (Tower Light). Headquartered outside Milan, Italy, Tower Light is a leading developer and supplier of mobile light towers throughout Europe, the Middle East and Africa. |
| | ● | On November 1, 2013, we purchased the assets of Baldor Electric Company’s generator division (Baldor Generators). Baldor Generators offers a complete line of power generation equipment throughout North America with power output up to 2.5MW. |
| | ● | On September 2, 2014, we acquired the equity of Pramac America LLC (Powermate), resulting in the ownership of the Powermate trade name and the right to license the DeWalt brand name for certain residential engine powered tools. The transaction also included working capital associated with these products. This acquisition helps to expand the Generac brand portfolio across its residential product platform and increases its product offering in the portable generator category. |
| | ● | On October 1, 2014, we acquired MAC, Inc. and its related entities (MAC). MAC is a leading manufacturer of premium-grade commercial and industrial mobile heaters within the United States and Canada. The acquisition expands the Company’s portfolio of mobile power products and provides increased access to the oil & gas market. |
Excluding the impact of any future long-term debt issuances or prepayments, estimated amortization expense for the next five years is as follows: 2015, $7,012; 2016, $7,302; 2017, $7,550; 2018, $7,505; 2019, $7,534.
In May 2014, the FASB issued ASU No 2014-09, _Revenue from Contracts with Customers_.
This guidance is the culmination of the FASB’s joint project with the International Accounting Standards Board to clarify the principles for recognizing revenue.
The core principal of the guidance is that an entity should recognize revenue to depict the transfer of promised goods or services to customers in an amount that reflects the consideration to which the entity expects to be entitled in exchange for those goods or services.
The guidance provides a five-step process that entities should follow in order to achieve that core principal.
The guidance is effective for the Company in 2017.
The guidance can be applied either on a full retrospective basis or on a retrospective basis in which the cumulative effect of initially applying the standard is recognized at the date of initial application.
_Acquisition of MAC_
On October 1, 2014, a subsidiary of the Company acquired MAC for a purchase price, net of cash acquired of $55,690.
Headquartered in Bismarck, North Dakota, MAC is a leading manufacturer of premium-grade commercial and industrial mobile heaters within the United States and Canada.
The acquisition expands the Company’s portfolio of mobile power products and provides increased access to the oil & gas market.
The accompanying consolidated financial statements include the results of MAC from October 1, 2014 through December 31, 2014.
The earn-out payment of $7,641 was finalized during the second quarter of 2014, resulting in a gain of $4,877, which was recorded in the consolidated statement of comprehensive income for the year ended December 31, 2014.
March 3, 2014
March 3, 2014
| --- | --- | --- | --- | --- | --- | --- | --- | --- | --- | --- | --- | --- |
| Trade name write-down | | | – | | | | – | | | | 9,389 | |
| --- | --- | --- | --- | --- | --- | --- | --- | --- | --- | --- | --- | --- | --- | --- | --- | --- | --- | --- | --- | --- | --- | --- | --- | --- | --- | --- | --- | --- | --- | --- |
| | | | | | | | | | | | | | | | | | | | | | | | | | | | | | | |
| | | | | | | | | | | | | | | | | | | | Excess Purchase | | | Retained | | | Accumulated | | | | | |
| | | | | | | | | | | Additional | | | | | | | | | Price Over | | | Earnings | | | Other | | | Total | | |
| Balance at December 31, 2010 | | | | | 67,524,596 | | $ | 675 | | $ | 1,133,918 | | | – | | $ | – | | $ | (202,116 | ) | $ | (481,658 | ) | $ | (9,752 | ) | $ | 441,067 | |
| | | | | | | | | | | | | | | | | | | | | | | | | | | | | | | |
| | | | | | | | | | | | | | | | | | | | | | | | | | | | | | | |
| | | | | | | | | | | | | | | | | | | | | | | | | | | | | | | |
| | | | | | | | | | | | | | | | | | | | | | | | | | | | | | | |
| --- | --- | --- | --- | --- | --- | --- | --- | --- | --- | --- | --- | --- | --- |
| | | | | | | | | | | | | | |
| | | | | | | | | | | | | | |
| | | | | | | | | | | | | | |
| Trade name write-down | | | | – | | | | – | | | | 9,389 | |
| | | | | | | | | | | | | | |
| | | | | | | | | | | | | | |
| | | | | | | | | | | | | | |
| | | | | | | | | | | | | | |
| | | | | | | | | | | | | | |
| | | | | | | | | | | | | | |
1.
2.
Certain prior period amounts in the consolidated financial statements and notes thereto have been reclassified to conform to the current period’s presentation.
| --- | --- |
| --- | --- | --- | --- | --- | --- | --- | --- |
| | | | | | | | |
During the fourth quarter of 2011, the Company wrote down a certain trade name indefinite-lived intangible asset.
See the Goodwill and Other Indefinite-Lived Intangible Assets section for further discussion.
Estimated amortization expense each year for the five years subsequent to December 31, 2013 is as follows: 2014, $21,058; 2015, $19,718; 2016, $17,892; 2017, $14,581; 2018, $10,228.
Estimated amortization expense each year for the five years subsequent to December 31, 2013 is as follows: 2014, $4,919; 2015, $5,033; 2016, $5,165; 2017, $5,273; 2018, $5,143.
There can be no assurance that future goodwill impairment tests will not result in a charge to earnings.
| Acquisition of business, net | | 56,605 | | — | | 56,605 | | 5,470 | | — | | 5,470 |
The Company acquired two businesses during fiscal 2013 for a combined purchase price of $122,391, net of cash acquired, which resulted in additional goodwill of $57,044.
Separately, the Ottomotores purchase price allocation was finalized during the second quarter of 2013, which resulted in an adjustment to goodwill of $(439).
The Company acquired two businesses during fiscal 2012 for a combined purchase price of $47,044, net of cash acquired, which resulted in additional goodwill of $5,545.
Separately, the Magnum purchase price allocation was finalized during the third quarter of 2012, which resulted in an adjustment to goodwill of $(75).
An excerpt. Shown here: 40 of 627 rewritten, 40 of 210 added and 40 of 236 removed. The counts are complete. For every sentence, read Item 8. Financial Statements and Supplementary Data in the FY2014 filing and the FY2013 filing.
Item 9A. Controls and Procedures
11 rewritten, 1 added, 1 removed, 8 unchanged
Read the full itemFY2014 item · filed February 27, 2015FY2013 item · filed March 3, 2014
[removed: Evaluation] [added: Evaluation] of Disclosure Controls and [removed: Procedures][added: Procedures]
Disclosure controls and procedures are controls and other procedures that are designed to ensure that information required to be disclosed by us in reports we file or submit under the Securities Exchange Act of [removed: 1934, or the Exchange Act,] [added: 1934 (Exchange Act),] is recorded, processed, summarized and reported within the time periods specified in the Securities and Exchange Commission rules and forms.
[removed: Management’s] [added: Management’s] Report on Internal Control Over Financial [removed: Reporting][added: Reporting]
Our internal control over financial reporting is designed under the supervision of our Chief Executive Officer and Chief Financial Officer to provide reasonable assurance regarding the reliability of financial reporting and the preparation of the consolidated financial statements in accordance with U.S. [removed: generally accepted accounting principles.][added: GAAP.]
Internal control over financial reporting includes those policies and procedures that (i) pertain to the maintenance of records that, in reasonable detail, accurately and fairly reflect the transactions and dispositions of the assets of the Company; (ii) provide reasonable assurance that transactions are recorded as necessary to permit preparation of the financial statements in accordance with U.S. [removed: generally accepted accounting principles,] [added: GAAP,] and that receipts and expenditures of the Company are being made only in accordance with authorizations of management and directors of the Company; and (iii) provide reasonable assurance regarding prevention or timely detection of unauthorized acquisition, use, or disposition of the Company’s assets that could have a material effect on the Company’s financial statements.
Under the supervision and with the participation of our Chief Executive Officer and Chief Financial Officer, our management conducted an assessment of the effectiveness of internal control over financial reporting as of December 31, [removed: 2013] [added: 2014] based on the criteria established in the [removed: 1992 Internal] [added: 2013 _Internal] Control [removed: –] [added: -] Integrated [removed: Framework,] [added: Framework_,] issued by the Committee of Sponsoring Organizations of the Treadway Commission (COSO).
Based on this assessment, our management has concluded that our internal control over financial reporting was effective as of December 31, [removed: 2013.][added: 2014.]
Our independent registered public accounting firm has issued an attestation report on our internal control over financial reporting as of December 31, [removed: 2013.][added: 2014.]
Its report appears in the consolidated financial statements included in this Annual Report on Form 10-K on page [removed: 36.][added: 39.]
[removed: Changes] [added: Changes] in Internal Control Over Financial [removed: Reporting][added: Reporting]
There have been no changes in our internal control over financial reporting that occurred during the three months ended December 31, [removed: 2013] [added: 2014] that have materially affected, or are reasonably likely to materially affect, our internal control over financial reporting.
In conducting this assessment, our management excluded the Powermate and MAC businesses because they were not acquired until the third and fourth quarters of 2014, respectively.
In conducting this assessment, our management excluded the Tower Light and Baldor Generators businesses because they were acquired during 2013 and constituted 4.2% and 15.1% of total and net assets, respectively, as of December 31, 2013 and 2.8% and 1.0% of revenues and net income, respectively, for the year then ended.
Item 9B. Other Information
1 rewritten, 1 added, 1 removed, 0 unchanged
Read the full itemFY2014 item · filed February 27, 2015FY2013 item · filed March 3, 2014
[removed: PART III][added: PART III]
None.
None
Item 10. Directors, Executive Officers and Corporate Governance
1 rewritten, 0 added, 0 removed, 0 unchanged
Read the full itemFY2014 item · filed February 27, 2015FY2013 item · filed March 3, 2014
The information required by Item 10 not already provided herein under “Item 1 [removed: –] [added: -] Business [removed: –] [added: -] Executive Officers”, will be included in our [removed: 2014] [added: 2015] Proxy Statement, and is incorporated by reference herein.
Item 11. Executive Compensation
1 rewritten, 0 added, 0 removed, 0 unchanged
Read the full itemFY2014 item · filed February 27, 2015FY2013 item · filed March 3, 2014
The information required by this item will be included in our [removed: 2014] [added: 2015] Proxy Statement and is incorporated herein by reference.
Item 12. Security Ownership of Certain Beneficial Owners and Management and Related Stockholder Matters
1 rewritten, 0 added, 0 removed, 0 unchanged
Read the full itemFY2014 item · filed February 27, 2015FY2013 item · filed March 3, 2014
The information required by this [removed: item] [added: item, including under the heading “Securities Authorized for Issuance Under Equity Compensation Plans,”] will be included in our [removed: 2014] [added: 2015] Proxy Statement and is incorporated herein by reference.
Item 13. Certain Relationships and Related Transactions, and Director Independence
1 rewritten, 0 added, 0 removed, 0 unchanged
Read the full itemFY2014 item · filed February 27, 2015FY2013 item · filed March 3, 2014
The information required by this item will be included in our [removed: 2014] [added: 2015] Proxy Statement and is incorporated herein by reference.
Item 14. Principal Accountant Fees and Services
2 rewritten, 0 added, 0 removed, 0 unchanged
Read the full itemFY2014 item · filed February 27, 2015FY2013 item · filed March 3, 2014
The information required by this item will be included in our [removed: 2014] [added: 2015] Proxy Statement and is incorporated herein by reference.
[removed: PART IV][added: PART IV]
Item 15. Exhibits and Financial Statement Schedules
39 rewritten, 65 added, 9 removed, 39 unchanged
Read the full itemFY2014 item · filed February 27, 2015FY2013 item · filed March 3, 2014
[removed: (a)(1)] [added: (a)(1)] Financial [removed: Statements][added: Statements]
| | [removed: Page] [added: Page] |
| Report of Independent Registered Public Accounting Firm | [removed: 36] [added: 39] |
| Consolidated balance sheets as of December 31, [removed: 2013] [added: 2014] and [removed: 2012] [added: 2013] | [removed: 38] [added: 41] |
| Consolidated statements of comprehensive income for years ended December 31, [removed: 2013, 2012] [added: 2014, 2013] and [removed: 2011] [added: 2012] | [removed: 39] [added: 42] |
| Consolidated statements of stockholders’ equity for years ended December 31, [removed: 2013, 2012] [added: 2014, 2013] and [removed: 2011] [added: 2012] | [removed: 40] [added: 43] |
| Consolidated statements of cash flows for the years ended December 31, [removed: 2013, 2012] [added: 2014, 2013] and [removed: 2011] [added: 2012] | [removed: 41] [added: 44] |
| Notes to consolidated financial statements | [removed: 42] [added: 45] |
[removed: (a)(2)] [added: (a)(2)] Financial Statement [removed: Schedules][added: Schedules]
[removed: (a)(3) Exhibits][added: (a)(3) Exhibits]
[removed: SIGNATURES][added: SIGNATURES]
| | | [removed: President] [added: _President] and Chief Executive [removed: Officer] [added: Officer_] |
| [removed: Signature] [added: Signature] | | | [removed: Title] [added: Title] | | | | [removed: Date] [added: Date] | | | |
| [removed: /s/] Aaron Jagdfeld [removed: Aaron Jagdfeld] | | | President, Chief Executive Officer and Director | | | | [removed: March 3, 2014] [added: February 27, 2015] | | | |
| [removed: /s/] York A. Ragen [removed: York A. Ragen] | | | Chief Financial Officer and Chief Accounting Officer | | | | [removed: March 3, 2014] [added: February 27, 2015] | | | |
| [removed: /s/ TODD A. ADAMS] Todd A. Adams | | | Director | | | | [removed: March 3, 2014] [added: February 27, 2015] | | | |
| [removed: /s/ john d. bowlin] John D. Bowlin | | | Director | | | | [removed: March 3, 2014] [added: February 27, 2015] | | | |
| [removed: /s/ robert d. dixon] Robert D. Dixon | | | Director | | | | [removed: March 3, 2014] [added: February 27, 2015] | | | |
| [removed: /s/] Barry J. Goldstein [removed: Barry J. Goldstein] | | | Director | | | | [removed: March 3, 2014] [added: February 27, 2015] | | | |
| [removed: /s/ bennett morgan] Bennett Morgan | | | Director | | | | [removed: March 3, 2014] [added: February 27, 2015] | | | |
| [removed: /s/ david ramon] David Ramon | | | Director | | | | [removed: March 3, 2014] [added: February 27, 2015] | | | |
| [removed: /s/ timothy walsh] Timothy Walsh | | | Director | | | | [removed: March 3, 2014] [added: February 27, 2015] | | | |
[removed: EXHIBIT INDEX][added: EXHIBIT INDEX]
| [removed: Exhibits Number] [added: Exhibits Number] | | [removed: Description] [added: Description] |
| 10.7 | | Amendment No. 1 dated as of May 31, 2013 to the Credit Agreement, dated as of May 30, 2012, among Generac Power Systems, Inc., its Domestic Subsidiaries listed as Borrowers on the signature pages thereto, Generac Acquisition Corp., the lenders party thereto, Bank of America, N.A. as Administrative Agent, JPMorgan Chase Bank, N.A. and Goldman Sachs Bank USA, as syndication agents, and Wells Fargo Bank, National Association, as Documentation Agent (incorporated by reference to Exhibit 10.4 to the Company’s Current Report on Form 8-K filed with the SEC on June 4, [removed: 2013).] [added: 2013)] |
| 10.22 | | Form of Generac Holdings Inc. Director Indemnification Agreement for Barry Goldstein, John D. Bowlin, Robert Dixon, David Ramon, Timothy W. Sullivan, Bennett [removed: Morgan and] [added: Morgan,] Todd A. [removed: Adams] [added: Adams, Andrew G. Lampereur and Ralph W. Castner] (incorporated by reference to Exhibit 10.51 of the Registration Statement on Form S-1 filed with the SEC on January 11, 2010). | [added: |]
| 10.23 | | Form of Generac Holdings Inc. Officer Indemnification Agreement (incorporated by reference to Exhibit 10.52 of the Registration Statement on Form S-1 filed with the SEC on January 11, 2010). | [added: |]
| 10.24 | | Form of Generac Power Systems, Inc. Director Indemnification Agreement for Stephen Murray and Timothy Walsh (incorporated by reference to Exhibit 10.53 of the Registration Statement on Form S-1 filed with the SEC on January 25, 2010). | [added: |]
| [removed: 10.26+] [added: 10.25+] | | [removed: Amended] Form of [removed: Nonqualified Stock Option] [added: Performance Share] Award Agreement [removed: pursuant to the 2010 Equity Incentive Plan] (incorporated by reference to Exhibit 10.1 of the [added: Quarterly Report on] Form 10-Q filed with the SEC on May [removed: 7, 2013).] [added: 5, 2014).] | [added: |]
| 21.1* | | List of Subsidiaries of Generac Holdings Inc. | [added: |]
| 23.1* | | Consent of Ernst & Young, Independent Registered Public Accounting Firm. | [added: |]
| 31.1* | | Certification of Chief Executive Officer pursuant to Securities Exchange Act Rules 13a-14(a) and 15d-14(a), pursuant to Section 302 of the Sarbanes-Oxley Act of 2002. | [added: |]
| 31.2* | | Certification of Chief Financial Officer pursuant to Securities Exchange Act Rules 13a-14(a) and 15d-14(a), pursuant to Section 302 of the Sarbanes-Oxley Act of 2002. | [added: |]
| 32.1 | | Certification of Chief Executive Officer pursuant to 18 U.S.C. Section 1350, as adopted by Section 906 of the Sarbanes-Oxley Act of 2002. | [added: |]
| 32.2 | | Certification of Chief Financial Officer pursuant to 18 U.S.C. Section 1350, as adopted by Section 906 of the Sarbanes-Oxley Act of 2002. | [added: |]
| 101* | | The following financial information from the Company’s Annual Report on Form 10-K for the fiscal year ended December 31, [removed: 2013,] [added: 2014,] filed with the SEC on [removed: March 3, 2014,] [added: February 27, 2015,] formatted in eXtensible Business Reporting Language (XBRL): (i) Consolidated Balance Sheets at December 31, [removed: 2013] [added: 2014] and December 31, [removed: 2012;] [added: 2013;] (ii) Consolidated Statements of Comprehensive Income for the Fiscal Years Ended December 31, [removed: 2013,] [added: 2014,] December 31, [removed: 2012] [added: 2013] and December 31, [removed: 2011;] [added: 2012;] (iii) Consolidated Statements of Stockholders' Equity (Deficit) for the Fiscal Years Ended December 31, [removed: 2013,] [added: 2014,] December 31, [removed: 2012] [added: 2013] and December 31, [removed: 2011;] [added: 2012;] (iv) Consolidated Statements of Cash Flows for the Fiscal Years Ended December 31, [removed: 2013,] [added: 2014,] December 31, [removed: 2012] [added: 2013] and December 31, [removed: 2011;] [added: 2012;] (v) Notes to Consolidated Financial Statements. | [added: |]
| [added: |] * | Filed herewith. | [added: |]
| [added: |] | Furnished herewith. | [added: |]
| [added: |] + | Indicates management contract or compensatory plan or arrangement. | [added: |]
| | |
Dated: February 27, 2015
| | | | | | | | | | | |
| /s/ Aaron Jagdfeld | | | | | | | | | | |
| /s/ York A. Ragen | | | | | | | | | | |
| /s/ Todd A. Adams | | | | | | | | | | |
| | | | | | | | | | | |
| /s/ John D. Bowlin | | | | | | | | | | |
| | | | | | | | | | | |
| /s/ Ralph W. Castner | | | | | | | | | | |
| Ralph W. Castner | | | Director | | | | February 27, 2015 | | | |
| | | | | | | | | | | |
| /s/ Robert D. Dixon | | | | | | | | | | |
| | | | | | | | | | | |
| /s/ Barry J. Goldstein | | | | | | | | | | |
| | | | | | | | | | | |
| /s/ Andrew G. Lampereur | | | | | | | | | | |
| Andrew G. Lampereur | | | Director | | | | February 27, 2015 | | | |
| | | | | | | | | | | |
| /s/ Bennett Morgan | | | | | | | | | | |
| | | | | | | | | | | |
| /s/ David Ramon | | | | | | | | | | |
| | | | | | | | | | | |
| /s/ Timothy Walsh | | | | | | | | | | |
| | | |
| | | |
| | | |
| | | |
| | | |
| | | |
| | | |
| | | |
| | | |
| | | |
| Exhibits Number | | Description |
| --- | --- | --- |
| | | |
| | | |
| | | |
| | | |
| --- | --- |
Dated: March 3, 2014
| /s/ stephen murray Stephen Murray | | | Director | | | | March 3, 2014 | | | |
| 10.25 | | Form of Generac Power Systems, Inc. Indemnification Agreement for Barry Goldstein, John D. Bowlin, Aaron Jagdfeld, David Ramon, York A. Ragen, Dawn Tabat, Allen Gillette, Roger Schaus, Jr., Roger Pascavis, Russell S. Minick, Robert Stoppek and Clement Feng (incorporated by reference to Exhibit 10.54 of the Registration Statement on Form S-1 filed with the SEC on January 25, 2010). |
| 10.27+ | | Amended Form of Restricted Stock Award Agreement with accelerated vesting pursuant to the 2010 Equity Incentive Plan (incorporated by reference to Exhibit 10.2 of the Form 10-Q filed with the SEC on May 7, 2013). |
| 10.28+ | | Cash award agreement to non-executive chairman (incorporated by reference to Exhibit 10.3 of the Form 10-Q filed with the SEC on May 7, 2013). |
| 10.29+ | | Cash award agreement to non-executive chairman (incorporated by reference to Exhibit 10.6 of the Form 10-Q filed with the SEC on August 7, 2013). |
| --- | --- |
| --- | --- |
An excerpt. Shown here: all 39 rewritten, 40 of 65 added and all 9 removed. The counts are complete. For every sentence, read Item 15. Exhibits and Financial Statement Schedules in the FY2014 filing and the FY2013 filing.