 filings.tools
Generac Holdings (GNRC) 10-K risk factor changes: FY2016 vs FY2015
The 2016-12-31 10-K against the 2015-12-31 one, compared heading by heading and sentence by sentence. One of these filings carries no fiscal year tag, so its year is the calendar year of the period end.
Item 1A13 rewritten3 added6 removed272 unchanged
All filing items910 rewritten641 added341 removed1,321 unchanged
Summary
counted, not written
- Item 1A lists 27 risk factor headings: 0 new, 3 reworded and 24 unchanged since FY2015. 0 headings from FY2015 no longer appear.
- Sentence by sentence, 641 added, 341 removed, 910 rewritten and 1,321 unchanged across 18 items that differ.
New Item 1A headings (0)
No risk factor heading in this filing is absent from FY2015.
Removed Item 1A headings (0)
Every FY2015 risk factor heading is still here, word for word or reworded.
Reworded Item 1A headings (3)
- _As a U.S. corporation that conducts business
[removed: in a][added: in_ _a] variety of foreign[removed: countries including, but not limited to, Mexico__, Italy_ _and Brazil,][added: countries__,] we are subject to the Foreign Corrupt Practice__s Act and a variety of anti-corruption laws worldwide. A determination that we violated any of these laws may affect our business and operations adversely._ - _We may encounter difficulties in implementing or operating a new enterprise resource planning (ERP)
[removed: system,][added: system across our subsidiaries,] which may adversely affect our operations and financial reportin__g._ [removed: _We_ _currently_ _do][added: _We do] not_[removed: _have plans][added: _have_ _plans] to pay_ _dividends on our common stock in the foreseeable future._
A heading is new when no FY2015 heading matches it after ignoring case and punctuation, and reworded when it shares at least 60 percent of its words with one that went away. All current risk factor headings.
Sentences by item
19 items, with every count and a link to each item that changed
Underlined words on a shaded ground are new in FY2016; struck-through words were in FY2015. Sentences that are wholly new or wholly gone are labelled rather than marked.
Item 1A. Risk Factors
13 rewritten, 3 added, 6 removed, 272 unchanged
Risk factors [removed: related] [added: related] to our business and industry
_Demand [removed: for the] [added: for_ _the] majority [removed: of our] [added: of_ _our] products is [removed: significantly] [added: significantl__y] affected by [removed: unpredictable power-outage activity that] [added: unpredictable_ _power-outage_ _activity_ _that] can lead to substantial variations in, and uncertainties regarding, our financial results from period to period._
_Demand for our products is significantly affected by durable goods spending by consumers and [removed: businesses, and] [added: businesses__,_ _and] other macroeconomic conditions._
For further information, see “Item [removed: 1—Business—Competition.”][added: 1—Business—Competition”.]
_As a U.S. corporation that conducts business [removed: in a] [added: in_ _a] variety of foreign [removed: countries including, but not limited to, Mexico__, Italy_ _and Brazil,] [added: countries__,] we are subject to the Foreign Corrupt Practice__s Act and a variety of anti-corruption laws worldwide.
Indefinite-lived intangibles are comprised of certain [removed: trade names.][added: tradenames.]
At December 31, [removed: 2015,] [added: 2016,] goodwill and other indefinite-lived intangibles totaled [removed: $798.0] [added: $833.0] million.
As a result, we [removed: will] [added: may] be required to devote significant management attention and resources to integrating the business practices and operations of any acquired businesses with ours.
_We may encounter difficulties in implementing or operating a new enterprise resource planning (ERP) [removed: system,] [added: system across our subsidiaries,] which may adversely affect our operations and financial reportin__g._
In [removed: January] 2016, we implemented a new ERP system for a majority of our business as part of our ongoing efforts to improve and strengthen our operational and financial processes and our reporting [removed: systems.][added: systems, and we will be implementing the new ERP system at our other locations in future years.]
The ERP system may not provide the benefits anticipated, could add costs and complications to ongoing operations, and may impact our ability to process transactions [removed: accurately and] efficiently, all of which may have a material adverse effect on the Company’s business and results of operations.
[removed: _We_ _currently_ _do] [added: _We do] not_ [removed: _have plans] [added: _have_ _plans] to pay_ _dividends on our common stock in the foreseeable future._
As of December 31, [removed: 2015,] [added: 2016,] we had total indebtedness of [removed: $1,059.3] [added: $1,052.9] million.
For further information, see “Item 1—Business—Distribution Channels and Customers”.
| | ● | complying with newly applicable foreign regulations; |
| --- | --- | --- |
Goodwill and identifiable intangible assets are recorded at fair value on the date of acquisition.
In accordance with the Financial Accounting Standards Board (FASB) Accounting Standards Codification (ASC) Topic 350-20, _Intangibles – Goodwill and Other_, goodwill and indefinite lived intangibles are reviewed at least annually for impairment and finite-lived intangible assets are reviewed for impairment whenever events or changes in circumstances indicate that their carrying value may not be recoverable.
The amount of any impairment is recorded as a charge to the statement of operations.
We may never realize the full value of our intangible assets.
Any future determination requiring the write-off of a significant portion of intangible assets would have an adverse effect on our financial condition and results of operations.
See “Item 7—Management's Discussion and Analysis of Financial Condition and Results of Operations,” Note 2, “Significant Accounting Policies,” and Note 8, “Goodwill and Intangible Assets,” to the consolidated financial statements in Item 8 of this Annual Report on Form 10-K for further information on the Company’s impairment tests and the impairment of certain tradenames as a result of a new brand strategy and the impairment of the goodwill of the Ottomotores reporting unit both recorded in the fourth quarter of 2015.
Item 7. Management’s Discussion and Analysis of Financial Condition and Results of Operations
111 rewritten, 115 added, 77 removed, 205 unchanged
We are a leading designer and manufacturer of a wide range of power generation equipment and other engine powered products serving the residential, light [removed: commercial, industrial, oil & gas,] [added: commercial] and [removed: construction] [added: industrial] markets.
As the only significant market participant focused predominantly on these products, we [removed: are a] [added: have one of the leading] market [removed: leader] [added: positions] in the power equipment market in North America and [removed: have] an expanding presence internationally.
We believe we have one of the widest [removed: range] [added: ranges] of products in the marketplace, including residential, commercial and industrial standby generators, as well as portable and mobile generators used in a variety of applications.
Business Drivers and Operational [removed: Factors][added: Factors]
[removed: _Business Drivers] [added: _Business_ _Drivers] and [removed: Trends_][added: T__rends_]
We estimate that penetration rates for home standby generators are only approximately [removed: 3.5%] [added: 4.0%] of U.S. single-family detached, owner-occupied households with a home value of over $100,000, as defined by the U.S. Census Bureau's [removed: 2013] [added: 2015] American Housing Survey for the United States.
In addition, the [removed: importance] [added: installed base] of backup power for telecommunications infrastructure is increasing due to the growing importance for uninterrupted voice and data services.
_Effect of large scale_ _and baseline_ _power disruptions._ Power disruptions are an important driver of customer awareness and have historically influenced demand for [removed: generators.][added: generators, both in the United States and internationally.]
Increased frequency and duration of major power outage events, that have a broader impact beyond a localized level, increases product awareness and may drive consumers to accelerate their purchase of a [removed: standby or] portable [added: or standby] generator during the immediate and subsequent period, which we believe may last for [removed: six] [added: nine] to twelve months following a major power outage event for standby generators.
[removed: _Impact of business capital investment cycle._ The market for our commercial and industrial products is affected by the overall capital investment cycle, including] [added: These markets include] non-residential building construction, durable goods and infrastructure spending as well as investments in the exploration and production of oil & gas, as businesses or organizations either add new locations or make investments to upgrade existing locations or equipment.
The market for these products is also affected by general economic [removed: conditions] and [added: geopolitical conditions as well as] credit availability in the geographic regions that we serve.
In addition, we believe demand for our mobile power products [removed: will continue to] benefit [added: over the long term] from a secular shift towards renting versus buying this type of equipment.
_Effect of commodity, currency and component price fluctuations._ Industry-wide price fluctuations of key commodities, such as steel, copper and [removed: aluminum and] [added: aluminum, along with] other components we use in our products, [removed: together with foreign currency fluctuations,] can have a material impact on our results of operations.
[removed: _Seasonalit__y__._] [added: _Seasonality._] Although there is demand for our products throughout the year, in each of the past [removed: three] [added: five] years approximately 23% to 27% of our net sales occurred in the first quarter, [removed: 22%] [added: 20%] to 25% in the second quarter, 24% to 27% in the third quarter and 25% to [removed: 28%] [added: 29%] in the fourth quarter, with different seasonality depending on the [removed: presence,] [added: occurrence,] timing and severity of major power outage activity in each year.
[removed: As a result, the] [added: The] seasonality experienced during [removed: this time period,] [added: a major power outage,] and for the subsequent quarters following the [removed: time period, varied] [added: event, will vary] relative to other periods where no major outage events occurred.
_Factors influencing interest expense_ _and cash interest expense__._ Interest expense can be impacted by a variety of factors, including market fluctuations in LIBOR, interest rate election periods, interest rate swap agreements, credit [removed: agreement] [added: facility] pricing grids, and repayments or borrowings of indebtedness.
_Factors influencing provision for income taxes and [removed: cash income taxes] [added: cash_ _income_ _taxes] paid._ We had approximately [removed: $715] [added: $592] million of tax-deductible goodwill and intangible asset amortization remaining as of December 31, [removed: 2015] [added: 2016] related to our acquisition by CCMP in 2006 that we expect to generate aggregate cash tax savings of approximately [removed: $279] [added: $231] million through 2021, assuming continued profitability and a 39% tax rate.
As a result of the asset acquisition of the Magnum business in the fourth quarter of 2011, we had approximately [removed: $42.0] [added: $38.0] million of incremental tax deductible goodwill and intangible assets remaining as of December 31, [removed: 2015.][added: 2016.]
We expect these assets to generate aggregate cash tax savings of [removed: $16.4] [added: $14.9] million through 2026 assuming continued profitability and a 39% tax rate.
Substantially all of our net sales are generated through the sale of our power generator equipment and other engine powered products to the residential, light [removed: commercial, industrial, oil & gas,] [added: commercial] and [removed: construction] [added: industrial] markets.
We are not dependent on any one channel or customer for our net sales, with no single customer representing more than 7% of our sales, and our top ten customers representing less than [removed: 25%] [added: 22%] of our total sales for the year ended December 31, [removed: 2015.][added: 2016.]
Component parts and raw materials comprised approximately [removed: 84%] [added: 78%] of costs of goods sold for the year ended December 31, [removed: 2015.][added: 2016.]
We design and manufacture air-cooled engines for certain of our generators up to [removed: 22kW.][added: 22kW, along with certain liquid-cooled engines.]
Our marketing expenses include direct mail costs, printed material costs, product display costs, market research expenses, trade show expenses, media [removed: advertising] [added: advertising, promotional expenses] and co-op advertising costs.
_Research [removed: and development._] [added: and_ _development._] Our research and development expenses support numerous projects covering all of our product lines.
We [removed: currently] operate engineering facilities at [removed: eight] [added: many] locations globally and employ over [removed: 250] [added: 300] personnel with focus on new product development, existing product improvement and cost containment.
[removed: _Costs related to acquisitions._] In 2015, the other expenses include [removed: transaction-related] [added: transaction] expenses related to the acquisitions of CHP and Pramac.
In 2014, the other expenses include [removed: transaction-related] [added: transaction] expenses related to the acquisitions of Powermate and MAC.
[added: _Costs related to acquisition__s__._] In [removed: 2013,] [added: 2016, the] other expenses include [removed: transaction-related] [added: transaction] expenses related to the acquisitions of [removed: Tower Light] [added: Pramac] and [removed: Baldor.][added: Motortech.]
[removed: See] [added: Refer to] Note 3, “Acquisitions” and Note [removed: 20,] [added: 19,] “Subsequent Events” to the consolidated financial statements in Item 8 of this Annual Report on Form 10-K for additional information on the Company’s recent [removed: acquisitions and the announced acquisition of Pramac.][added: acquisitions.]
_Year ended December 31, 201__5_ _compared_ _to year ended December 31, [removed: 2014_][added: 201__4_]
| | | [removed: Year] [added: Year] Ended December [removed: 31,] [added: 31,] | | | | | | | [added: | | | | | | | |]
| (U.S. Dollars in thousands) | | [removed: 2015] [added: 2015] | | | | [removed: 2014] [added: 2014] | | | [added: | $ Change | | | | % Change | | |]
| Net sales | | $ | 1,317,299 | | | $ | 1,460,919 | | [added: | | (143,620 | ) | | | \-9.8 | % |]
| [removed: Costs] [added: Cost] of goods sold | | | 857,349 | | | | 944,700 | | [added: | | (87,351 | ) | | | \-9.2 | % |]
| Gross profit | | | 459,950 | | | | 516,219 | | [added: | | (56,269 | ) | | | \-10.9 | % |]
| Operating expenses: | | | | | | | | | [added: | | | | | | | |]
| Selling and service | | | 130,242 | | | | 120,408 | | [added: | | 9,834 | | | | 8.2 | % |]
| Research and development | | | 32,922 | | | | 31,494 | | [added: | | 1,428 | | | | 4.5 | % |]
| General and administrative | | | 52,947 | | | | 54,795 | | [added: | | (1,848 | ) | | | \-3.4 | % |]
_Impact of business capital investment cycle__s__._ The global market for our commercial and industrial products is affected by different capital investment cycles, which can vary across the numerous regions around the world in which we participate.
Also, with the Pramac acquisition in 2016, we have further expanded our commercial and operational presence outside of the United States.
This acquisition, along with our existing international presence, exposes us to fluctuations in foreign currency exchange rates that can have a material impact on our results of operations.
Cash interest expense increased during 2016 compared to 2015, primarily due additional debt assumed in recent acquisitions, increased borrowings at other foreign subsidiaries and an increase in the LIBOR rate.
| (U.S. Dollars in thousands) | | 2016 | | | | 2015 | | | | $ Change | | | | % Change | | |
| Net sales | | $ | 1,444,453 | | | $ | 1,317,299 | | | | 127,154 | | | | 9.7 | % |
| Cost of goods sold | | | 930,347 | | | | 857,349 | | | | 72,998 | | | | 8.5 | % |
| Gross profit | | | 514,106 | | | | 459,950 | | | | 54,156 | | | | 11.8 | % |
| Selling and service | | | 164,607 | | | | 130,242 | | | | 34,365 | | | | 26.4 | % |
| Research and development | | | 37,229 | | | | 32,922 | | | | 4,307 | | | | 13.1 | % |
| General and administrative | | | 74,700 | | | | 52,947 | | | | 21,753 | | | | 41.1 | % |
| Amortization of intangible assets | | | 32,953 | | | | 23,591 | | | | 9,362 | | | | 39.7 | % |
| Tradename and goodwill impairment | | | \- | | | | 40,687 | | | | (40,687 | ) | | | \-100.0 | % |
| Total operating expenses | | | 309,489 | | | | 280,389 | | | | 29,100 | | | | 10.4 | % |
| Income from operations | | | 204,617 | | | | 179,561 | | | | 25,056 | | | | 14.0 | % |
| Income before provision for income taxes | | | 156,382 | | | | 122,983 | | | | 33,399 | | | | 27.2 | % |
| Provision for income taxes | | | 57,570 | | | | 45,236 | | | | 12,334 | | | | 27.3 | % |
| Net income | | | 98,812 | | | | 77,747 | | | | 21,065 | | | | 27.1 | % |
| Net income attributable to noncontrolling interests | | | 24 | | | | \- | | | | 24 | | | | N/A | |
| Net income attributable to Generac Holdings Inc. | | $ | 98,788 | | | $ | 77,747 | | | | 21,041 | | | | 27.1 | % |
The following sets forth our reportable segment information for the periods indicated:
| | | Net Sales | | | | | | | | | | | | | | |
| (U.S. Dollars in thousands) | | 2016 | | | | 2015 | | | | $ Change | | | | % Change | | |
| Domestic | | $ | 1,173,559 | | | $ | 1,204,589 | | | | (31,030 | ) | | | \-2.6 | % |
| International | | | 270,894 | | | | 112,710 | | | | 158,184 | | | | 140.3 | % |
| Total net sales | | $ | 1,444,453 | | | $ | 1,317,299 | | | | 127,154 | | | | 9.7 | % |
| | | Adjusted EBITDA | | | | | | | | | | | | | | |
| --- | --- | --- | --- | --- | --- | --- | --- | --- | --- | --- | --- | --- | --- | --- | --- | --- |
| | | 2016 | | | | 2015 | | | | $ Change | | | | % Change | | |
| Domestic | | $ | 261,428 | | | $ | 254,882 | | | | 6,546 | | | | 2.6 | % |
| International | | | 16,959 | | | | 15,934 | | | | 1,025 | | | | 6.4 | % |
| Total Adjusted EBITDA | | $ | 278,387 | | | $ | 270,816 | | | | 7,571 | | | | 2.8 | % |
The following table sets forth our product class information for the periods indicated:
| --- | --- | --- | --- | --- | --- | --- | --- | --- | --- | --- | --- | --- | --- | --- | --- | --- |
| (U.S. Dollars in thousands) | | 2016 | | | | 2015 | | | | $ Change | | | | % Change | | |
| Residential products | | $ | 772,436 | | | $ | 673,764 | | | | 98,672 | | | | 14.6 | % |
| Commercial & industrial products | | | 557,532 | | | | 548,440 | | | | 9,092 | | | | 1.7 | % |
| Other | | | 114,485 | | | | 95,095 | | | | 19,390 | | | | 20.4 | % |
| Total net sales | | $ | 1,444,453 | | | $ | 1,317,299 | | | | 127,154 | | | | 9.7 | % |
_Net sales__._ The decrease in Domestic sales for the year ended December 31, 2016 was primarily due to significant declines in shipments of mobile products into oil & gas and general rental markets.
Also, in recent years, a more stringent regulatory environment around the flaring of natural gas at oil & gas drilling and production sites has been a catalyst for increased demand for natural gas fueled generators, including mobile solutions.
For example, the multiple major outage events that occurred during the second half of both 2011 and 2012 drove strong demand for portable and home standby generators, and the increased awareness of these products contributed to substantial organic revenue growth in 2012 with strong growth continuing during 2013.
For example, there were multiple major power outage events that occurred during the second half of both 2011 and 2012, which were significant in terms of severity.
Cash interest expense decreased during 2015 compared to 2014, primarily due to voluntary prepayments of Term Loan principal and the lower interest rate on our Amended ABL Facility borrowings.
During 2015, our net sales were affected primarily by the U.S. market as sales outside of the United States represented approximately 15% of total net sales.
| --- | --- | --- | --- | --- | --- | --- | --- | --- |
| Amortization of intangibles | | | 23,591 | | | | 21,024 | |
| | | | | | | | | |
_Net sales._ Net sales decreased $143.6 million, or 9.8%, to $1,317.3 million for the year ended December 31, 2015 from $1,460.9 million for the year ended December 31, 2014.
Residential product sales decreased 6.7% to $673.8 million in 2015 from $722.2 million for the comparable period in 2014, primarily due to lower demand of home standby generators as a result of the significant decline in the power outage severity environment during 2015, partially offset by the contribution from recent acquisitions.
C&I product sales decreased 15.9% to $548.4 million in 2015 from $652.2 million for the comparable period in 2014, primarily due to a significant reduction in shipments into oil & gas and general rental markets and, to a lesser extent, reduced shipments to telecom national account customers and the negative impact of foreign currency, partially offset by the contribution from recent acquisitions.
Gross profit margin for the year ended December 31, 2015 decreased to 34.9% from 35.3% for the year ended December 31, 2014.
_Operating expenses._ Operating expenses increased $57.6 million to $280.4 million for the year ended December 31, 2015 from $222.8 million for the year ended December 31, 2014.
_Other expense._ Other expense increased $21.6 million, or 61.6%, to $56.6 million for the year ended December 31, 2015 from $35.0 million for the year ended December 31, 2014.
_Income tax expense._ Income tax expense decreased $38.5 million to $45.2 million for the year ended December 31, 2015 from $83.7 million for the year ended December 31, 2014.
_Adjusted EBITDA._ Adjusted EBITDA, as defined and reconciled in Item 6, “Selected Financial Data,” decreased to $270.8 million in 2015 as compared to $337.3 million in 2014, due to the factors discussed above.
| Net sales | | $ | 1,460,919 | | | $ | 1,485,765 | |
| Costs of goods sold | | | 944,700 | | | | 916,205 | |
| Gross profit | | | 516,219 | | | | 569,560 | |
| Selling and service | | | 120,408 | | | | 107,515 | |
| Research and development | | | 31,494 | | | | 29,271 | |
| General and administrative | | | 54,795 | | | | 55,490 | |
| Amortization of intangibles | | | 21,024 | | | | 25,819 | |
| Gain on remeasurement of contingent consideration | | | (4,877 | ) | | | \- | |
| Total operating expenses | | | 222,844 | | | | 218,095 | |
| Income from operations | | | 293,375 | | | | 351,465 | |
| Income before provision for income taxes | | | 258,362 | | | | 278,716 | |
| Provision for income taxes | | | 83,749 | | | | 104,177 | |
| Net income | | $ | 174,613 | | | $ | 174,539 | |
| Residential products | | $ | 722,206 | | | $ | 843,727 | |
| Commercial & Industrial products | | | 652,216 | | | | 569,890 | |
| Other | | | 86,497 | | | | 72,148 | |
_Net sales._ Net sales decreased $24.9 million, or 1.7%, to $1,460.9 million for the year ended December 31, 2014 from $1,485.8 million for the year ended December 31, 2013.
Residential product sales decreased 14.4% to $722.2 million from $843.7 million for the comparable period in 2013.
Residential product sales declined on a year-over-year basis as 2013 benefited from approximately $140 million in incremental shipments as a result of satisfying the extended lead times that resulted from Superstorm Sandy in October 2012, which did not repeat in 2014.
Excluding this benefit in 2013, residential products increased approximately 3%.
C&I product sales increased 14.4% to $652.2 million from $569.9 million for the comparable period in 2013, primarily due to the contributions from recent acquisitions along with strength in the oil & gas markets, partially offset by reduced capital spending from certain telecom customers and overall softness within Latin America.
_Gross profit._ Gross profit decreased $53.4 million, or 9.4%, to $516.2 million for the year ended December 31, 2014 from $569.6 million for the year ended December 31, 2013.
Gross profit margin for the year ended December 31, 2014 decreased to 35.3% from 38.3% for the year ended December 31, 2013.
The decline in gross margin was driven by the combination of a higher mix of C&I product shipments, including the impact of recent acquisitions, an increase in promotional activities, and an overall increase in product costs, including a temporary increase in certain costs associated with the slowdown of activity in west coast ports as well as short-term increases in other overhead-related costs.
An excerpt. Shown here: 40 of 111 rewritten, 40 of 115 added and 40 of 77 removed. The counts are complete. For every sentence, read Item 7. Management’s Discussion and Analysis of Financial Condition and Results of Operations in the FY2016 filing and the FY2015 filing.
Item 7A. Quantitative and Qualitative Disclosures About Market Risk
18 rewritten, 9 added, 10 removed, 16 unchanged
We are exposed to foreign currency exchange risk as a result of [removed: purchasing from suppliers] [added: transactions denominated] in [removed: currency] [added: currencies] other than the U.S. [removed: Dollar] [added: Dollar,] as well as operating businesses in foreign countries.
Periodically, we utilize foreign currency forward purchase and sales contracts to manage the volatility associated with [added: certain] foreign currency purchases [added: and sales] in the normal course of business.
[removed: As] [added: The following is a summary] of [removed: December 31, 2015, we had] the [removed: following] foreign currency contracts outstanding [added: as of December 31, 2016] (in thousands):
| [removed: Currency Denomination] [added: Currency Denomination] | Trade [removed: Date] [added: Dates] | [added: | |] Effective [removed: Date] [added: Dates] | [removed: Notional Amount] | [removed: Exchange Rate (EUR:GBP)] | [added: | Notional Amount | | |] Expiration [removed: Date] [added: Dates] | [added: | |]
Periodically, we engage in certain commodity risk management activities to mitigate the impact of potential price fluctuations [removed: of these commodities] on our financial results.
As of December 31, [removed: 2015,] [added: 2016,] we had the following commodity forward contract outstanding (in thousands):
| [removed: Hedged Item] [added: Hedged Item] | Trade Date | Effective Date | [removed: Notional Amount] | [removed: Fixed Price] [added: Notional Amount] | [added: | | | Fixed Price (per LB) | | |] Expiration Date |
For additional information on the Company’s commodity forward contracts, including amounts charged to the statement of comprehensive income during [removed: 2015,] [added: 2016,] see Note 4, “Derivative Instruments and Hedging Activity,” to the consolidated financial statements in Item 8 of this Annual Report on Form 10-K.
As of December 31, [removed: 2015,] [added: 2016,] all of the outstanding debt under our Term Loan was subject to floating interest rate risk.
As of December 31, [removed: 2015,] [added: 2016,] we had the following interest rate swap contracts outstanding (in thousands):
| Hedged Item | Contract Date | Effective Date | [removed: Notional Amount] | [removed: Fixed LIBOR Rate] [added: Notional Amount] | [added: | | | Fixed LIBOR Rate | | |] Expiration Date |
| Interest rate | October 23, 2013 | July 1, 2014 | [removed: $100,000] | [removed: 1.7420%] [added: $] | [added: 100,000 | | | | 1.7420 | % |] July 1, 2018 |
| Interest rate | October 23, 2013 | July 1, 2014 | [removed: $100,000] | [removed: 1.7370%] [added: $] | [added: 100,000 | | | | 1.7370 | % |] July 1, 2018 |
| Interest rate | May 19, 2014 | July 1, 2014 | [removed: $100,000] | [removed: 1.6195%] [added: $] | [added: 100,000 | | | | 1.6195 | % |] July 1, 2018 |
At December 31, [removed: 2015,] [added: 2016,] the fair value of these interest rate swaps was a liability of [removed: $2.6] [added: $1.7] million.
For additional information on the Company’s interest rate swaps, including amounts charged to the statement of comprehensive income during [removed: 2015,] [added: 2016,] see Note 4, “Derivative Instruments and Hedging Activities,” and Note [removed: 6,] [added: 5,] “Accumulated Other Comprehensive Loss,” to our consolidated financial statements in Item 8 of this Annual Report on Form 10-K.
A hypothetical change in the LIBOR interest rate of 100 basis points would have changed annual cash interest expense by approximately [removed: $5.6] [added: $6.3] million (or, without the swaps in place, [removed: $8.2] [added: $9.3] million) in [removed: 2015.][added: 2016.]
The existence of a 0.75% LIBOR floor provision in our Term [removed: Loan, effective May 31, 2013,] [added: Loan] limits the impact of a hypothetical 100 basis point change in LIBOR at current December 31, [removed: 2015] [added: 2016] LIBOR rates.
| --- | --- | --- | --- | --- | --- | --- | --- | --- | --- | --- | --- | --- | --- |
| | | | | | | | | | | | | | |
| GBP | 9/28/16 | – | 12/20/16 | 9/28/16 | – | 1/9/17 | | | 5,850 | | 1/27/17 | – | 6/28/17 |
| USD | 9/26/16 | – | 12/19/16 | 9/26/16 | – | 12/19/16 | | | 7,950 | | 1/13/17 | – | 6/30/17 |
| --- | --- | --- | --- | --- | --- | --- | --- | --- | --- | --- | --- |
| | | | | | | | | | | | |
| Copper | October 19, 2016 | October 20, 2016 | | $ | 3,502 | | | $ | 2.118 | | December 31, 2017 |
| --- | --- | --- | --- | --- | --- | --- | --- | --- | --- | --- | --- |
| | | | | | | | | | | | |
| --- | --- | --- | --- | --- | --- |
| | | | | | |
| GBP | October 23, 2015 | December 15, 2015 | 1,000 | 0.7259 | March 29, 2016 |
| GBP | October 23, 2015 | October 23, 2015 | 1,000 | 0.7267 | April 22, 2016 |
| GBP | October 23, 2015 | February 1, 2016 | 1,000 | 0.7232 | May 26, 2016 |
| GBP | November 4, 2015 | January 18, 2016 | 1,000 | 0.7107 | May 26, 2016 |
| GBP | November 11, 2015 | January 4, 2016 | 1,000 | 0.7126 | June 28, 2016 |
| GBP | November 17, 2015 | June 30, 2016 | 500 | 0.7097 | July 5, 2016 |
With the purchase of the Ottomotores business in December 2012 and the Tower Light business in August 2013, a small portion of revenues and expenses are now denominated in Euros, Mexican Pesos, Brazilian Real and British Pounds.
| Copper | November 12, 2015 | December 1, 2015 | $968 | $2.196 per LB | March 31, 2016 |
Item 1. Business
56 rewritten, 27 added, 35 removed, 150 unchanged
We are a leading designer and manufacturer of a wide range of power generation equipment and other engine powered products serving the residential, light [removed: commercial, industrial, oil & gas,] [added: commercial] and [removed: construction] [added: industrial] markets.
As the only significant market participant focused predominantly on these products, we [removed: are a] [added: have one of the leading] market [removed: leader] [added: positions] in the power generation market in North America and [removed: have] an expanding presence internationally.
We believe we have one of the widest [removed: range] [added: ranges] of products in the marketplace, including residential, commercial and industrial standby [removed: generators,] [added: generators;] as well as portable and mobile generators used in a variety of applications.
[removed: Products] [added: Our products] are [removed: sold into these regions] [added: available globally] through a broad network of independent dealers, distributors, retailers, wholesalers and equipment rental companies under a variety of brand names.
We have a significant market share in the residential and light commercial markets for automatic standby generators, which we believe remain [removed: under-penetrated.][added: under-penetrated in the marketplace.]
In addition, [removed: through recent acquisitions,] we are [removed: also] a leading provider of light towers, mobile generators, flameless heaters, outdoor power equipment and industrial diesel generators ranging in sizes up to 3,250kW.
Through innovation and focus, we have grown to be a leading provider of power generation equipment [added: and other engine powered products] to the residential, [removed: light-commercial, industrial, oil & gas] [added: light-commercial] and [removed: construction] [added: industrial] markets.
| | ● | In 2006, the founder of Generac Power Systems sold the company to affiliates of CCMP Capital Advisors, LLC (CCMP), together with certain other investors and members of our [removed: management (CCMP Transaction).] [added: management.] |
| | ● | In February 2010, we completed our initial public offering [removed: (IPO)] of 20.7 million primary shares of our common stock (including additional share over allotment). |
Additionally, [removed: over the past several years,] we have executed a number of acquisitions that support our strategic plan.
Other engine powered products that we design and manufacture include light towers, mobile heaters, power washers and water pumps, along with a broad line of outdoor power [removed: equipment including trimmer & brush mowers, log splitters, lawn & leaf vacuums, and chipper shredders.][added: equipment.]
Our residential automatic standby generators range in output from 6kW to 60kW, with manufacturer's suggested retail prices (MSRPs) from approximately [removed: $1,799] [added: $1,899] to $16,199.
We also provide a cellular-based remote monitoring system for home standby generators called _Mobile_ _Link_™, which allows our customers to check the status of their generator conveniently from a desktop PC, tablet computer or [removed: smartphone] [added: smartphone,] and also provides the capability to receive maintenance and service alerts.
We [removed: also] provide a broad product line of engine driven power washers for residential and commercial use, fueled by gasoline, which range in pressure from 2,500 to 4,200 PSI.
[removed: The acquisition of Country Home Products (CHP) in August 2015 provides] [added: Further, we provide] a broad product line of [removed: chore-related specialty] outdoor power equipment that includes trimmer & brush mowers, log splitters, lawn & leaf vacuums, and chipper shredders for the property maintenance needs of larger-acreage residences, light commercial properties, municipalities and farms.
Residential products comprised [removed: 51.2%, 49.5%] [added: 53.5%, 51.2%] and [removed: 56.8%,] [added: 49.5%,] respectively, of total net sales in [removed: 2015, 2014] [added: 2016, 2015] and [removed: 2013.][added: 2014.]
[removed: _Commercial] [added: _Commercial] & [removed: Industrial Products_][added: Industrial_ _P__roducts_]
We [removed: also] manufacture a broad line of standard and configured stationary generators and related transfer switches for various industrial standby, continuous-duty and prime rated applications.
C&I products comprised [removed: 41.6%, 44.6%] [added: 38.6%, 41.6%] and [removed: 38.4%] [added: 44.6%] respectively, of total net sales in [removed: 2015, 2014] [added: 2016, 2015] and [removed: 2013.][added: 2014.]
[removed: _Other_ _P__roducts_][added: _Other_ _P__roducts_]
Our “Other Products” category includes aftermarket service parts to our [removed: dealers] [added: dealers, product accessories] and proprietary engines to third-party original equipment manufacturers (OEMs).
Other power products comprised [removed: 7.2%, 5.9%] [added: 7.9%, 7.2%] and [removed: 4.8%,] [added: 5.9%,] respectively, of total net sales in [removed: 2015, 2014] [added: 2016, 2015] and [removed: 2013.][added: 2014.]
We believe our distribution network is a competitive advantage that has strengthened over the [removed: last decade] [added: years] as a result of adding, expanding and developing the various distribution channels through which we sell our products.
Our network is well balanced with no customer providing more than 7% of our sales in [removed: 2015.][added: 2016.]
Our overall dealer [removed: network, which is] [added: network] located [removed: principally] in the United States, Canada and Latin America, is the industry's largest network of factory direct independent generator [removed: contractors.][added: contractors in North America.]
In recent years, we have been [removed: particularly focused on] expanding our dealer network [added: globally through the Ottomotores acquisition] in [removed: Latin America] [added: December 2012] and [removed: other regions of the world] [added: Pramac acquisition] in [added: March 2016, along with organic means, in] order to expand our international sales opportunities.
Our retail distribution network includes thousands of locations [added: across the globe] and includes a variety of regional and national home improvement chains, retailers, clubs, buying groups and farm supply stores.
In addition, our Tower Light [removed: business provides] [added: and Pramac businesses provide] access to numerous independent distributors in over [removed: 50] [added: 150] countries.
In addition, we intend to continue to focus on innovation in this [removed: emerging] [added: growing] product category and introduce new products into the marketplace.
With only approximately [removed: 3.5%] [added: 4.0%] penetration of the addressable market of homes in the United States (which we define as single-family detached, owner-occupied households with a home value of over $100,000, as defined by the U.S. Census Bureau's [removed: 2013] [added: 2015] American Housing Survey for the United States), we believe there are opportunities to further penetrate the residential standby generator market.
[removed: _Gaining] [added: _Gaining] commercial and industrial market [removed: share._] [added: share._] Our growth strategy for commercial and industrial power generation products is focused on incremental market share gains.
Specifically, we continue to pursue certain initiatives to expand our [removed: distributors] [added: distributors’] interactions with engineering firms and electrical contractors responsible for specifying and selecting our products within C&I power generation applications.
We are also committed to a number of [added: sales process] initiatives to improve the overall specification rates for our products which should increase quoting activity and close rates for our industrial distributors.
[removed: In addition, we] [added: _Lead with gas power generation products_. We] will attempt to gain incremental market share [added: within commercial and industrial markets] through our leading position in the growing market for cleaner burning, more cost effective natural gas fueled [removed: back-up] [added: standby] power solutions.
Research and development [added: (R&D)] is a core competency and includes a staff of over [removed: 250] [added: 300] engineers working on numerous projects.
Our sponsored research and development expense was [removed: $32.9] [added: $37.2] million, [removed: $31.5] [added: $32.9] million and [removed: $29.3] [added: $31.5] million for the years ended December 31, [removed: 2015, 2014] [added: 2016, 2015] and [removed: 2013,] [added: 2014,] respectively.
Research and development is conducted at [removed: each] [added: several] of our manufacturing facilities worldwide and is focused on developing new technologies and product enhancements as well as maintaining product competitiveness by improving manufacturing costs, safety characteristics, reliability and performance while ensuring compliance with regulatory standards.
We are the only significant market participant with a primary focus on power generation with a core emphasis on standby, portable and mobile generators with broad capabilities across the residential, [removed: light commercial, industrial, oil & gas,] [added: light-commercial] and [removed: construction generator] [added: industrial] markets.
We believe that our engineering capabilities and core focus on generators provide us with manufacturing flexibility and [removed: enable] [added: enables] us to maintain a first-mover advantage over our competition for product innovation.
[removed: _Residential products_ –] [added: _Residential_ _products_ _–_] Kohler, Briggs & Stratton, Cummins, Honda, Champion, Techtronics International, [removed: FNA Group, Mi-T-M, Karcher, Swisher, MTD, Husqvarna, Ariens] [added: Husqvarna] and [removed: Ardisam,] [added: Ariens,] along with a number of smaller domestic and foreign competitors; certain of which also have broad operations in other manufacturing businesses.
Reportable Segments
Effective in the second quarter of 2016, we changed our segment reporting from one reportable segment to two reportable segments – Domestic and International – as a result of the recent Pramac acquisition and the ongoing strategy to expand the business internationally.
The Domestic segment includes the legacy Generac business and the impact of acquisitions that are based in the United States, all of which have revenues that are substantially derived from the U.S. and Canada.
The International segment includes the Ottomotores, Tower Light and Pramac acquisitions, all of which have revenues that are substantially derived from outside the U.S. and Canada.
Both segments design and manufacture a wide range of power generation equipment and other engine powered products, which are discussed in further detail below in the context of our product classes.
Products
_Residential_ _P__roducts_
The acquisition of PR Industrial S.r.l.
(Pramac) in March 2016 added a broad product line of portable generators that are sold globally and used for numerous residential, light construction and recreational purposes.
The acquisition of Pramac in March 2016 added a broad product line of C&I stationary and mobile generators that are sold in over 150 countries through a broad distribution network.
We further expanded our dealer network on a global basis with the acquisition of Pramac in March 2016, particularly in Europe, the Middle East and Asia/Pacific regions.
We also intend to explore new gaseous generator related market opportunities, including increasing our product capabilities for continuous-duty and prime rated applications, by leveraging our deep technical capabilities for gaseous-fueled products, leading position for natural gas standby generators and growing market acceptance for these products.
_Expanding_ _global presence._ We have increased our revenues shipped outside the U.S. and Canada in recent years, with sales outside this region accounting for approximately 20% of our revenues during 2016, as compared to approximately 10% and 9% in 2015 and 2014, respectively.
This increase is largely the result of acquisitions made that comprise our International segment – Ottomotores, Tower Light and Pramac.
These businesses have significantly increased our global presence by adding product, manufacturing and distribution capabilities that serve local markets around the world, and have resulted in us becoming a leading global player in the markets for backup power and mobile power equipment.
As we look forward, we intend to leverage our increased international footprint attained from these acquisitions to serve the over $13 billion annual market for power generation equipment outside the U.S. and Canada.
We also intend to improve the profit margins of our International segment by executing on several revenue and cost synergies, and driving organic growth in existing markets with additional investment and focus, including the expanding opportunity for global gaseous-fueled products.
We will continue to evaluate other opportunities to expand into additional regions of the world through both organic initiatives and potential acquisitions.
We operate numerous manufacturing plants, distribution facilities and inventory warehouses located throughout the world.
See “Item 2 – Properties” for additional details regarding the locations and activities of our principal operations.
Regulation, including Environmental Matters
Executive Officers
| Russell S. Minick | | 56 | | Chief Marketing Officer |
Minick began serving as our Chief Marketing Officer in August 2016.
Mr. Wilde was Vice President and General Manager of the Mining Division for Komatsu America Corp. from 2013 until he joined Generac.
Prior to that role, he held leadership positions as Vice President of the ICT Business Division and Product Marketing back to 2005.
Mr. Wilde holds a Bachelor of Business Administration in Management from Boise State University and an M.B.A. from Keller Graduate School of Management.
Our products are available primarily across the United States and Canada, with an expanding presence internationally in Latin America, Europe, the Middle East, Africa and Asia/Pacific regions.
Products
_Residential Products_
Our portable generators are offered under the Generac®, Powermate®, Dewalt® and Honeywell® brand names.
In 2015, we introduced a new inverter generator called the iQ2000, which includes state-of-the-art sound mitigation technology coupled with advanced electronics that greatly reduces noise while also improving fuel consumption and ease of operation.
We introduced several new C&I products during 2015, including a number of stationary and mobile natural gas generators that further expand our broad natural gas product range.
We began shipping our new 400 kilowatt power node earlier in the year at an industry leading price point, and toward the end of the year we announced a new 500 kilowatt natural gas generator, the largest gas unit in our industrial generator line.
Both of these units are ideal for large standby power applications such as office buildings, mission-critical data centers and healthcare facilities.
Recently, we also introduced the new MGG450 mobile generator that operates on natural gas, wellhead gas or liquid propane, and offers superior power density making it ideal for powering large equipment under continuous operation in remote field locations.
_Diversifying end markets by expanding product offerings and services._ In recent years, we have diversified our end markets with new product and service platforms.
Much of this diversification has been achieved with our strategic acquisitions, which gave access to several new products, markets and customers.
As a result of these acquisitions, we now have access to a broad lineup of mobile power products, higher-output generators and other engine powered tools, including products that serve the oil & gas and other infrastructure power markets.
We are now a more balanced company relative to our residential product sales as compared to only five years ago, as revenues for our C&I products have expanded from 31.0% of total net sales in 2010 to 41.6% in 2015.
As we continue to build upon our recent diversification efforts, we intend to evaluate other products and services which we believe could further diversify our end markets, either through organic initiatives or additional acquisitions.
_Expanding into new geographies._ During 2015, approximately 10% of our revenues were shipped to regions outside the U.S. and Canada.
Given that the global market for power generation equipment is estimated to exceed $16 billion annually, we believe there are growth opportunities for Generac by expanding into new geographies.
Prior to the acquisitions of Ottomotores in 2012, located in Latin America, and Tower Light in 2013, located in Europe, these efforts had been mostly organic with the creation of a dedicated sales team and the addition of new distribution points around the globe, with a focus in Latin America.
The Ottomotores and Tower Light acquisitions provide us with an enhanced platform and increased scale for our international growth initiatives, and also accelerate our efforts to become a more global player in the markets for backup power and mobile power equipment.
As we look forward, we intend to leverage these acquisitions while also evaluating other opportunities to expand into other regions of the world.
This is targeted to be accomplished through both organic initiatives and potential acquisitions, and by establishing and developing additional distribution globally and building the Generac brand internationally.
We operate several manufacturing plants, distribution facilities and inventory warehouses located principally in the United States, Mexico, Italy and Brazil totaling over three million square feet.
In 2015, we sourced approximately 52% of our materials and components from outside the United States.
Regulation, including Environmental Matters
Segment Information
Executive Officers
| Allen D. Gillette | | 59 | | Executive Vice President, Global Engineering |
| Clement Feng | | 52 | | Senior Vice President, Marketing |
Allen D.
Gillette is our Executive Vice President of Global Engineering.
Mr. Gillette joined Generac in 1998 and has served in numerous engineering positions involving increasing levels of responsibilities and corresponding titles.
Prior to joining Generac, Mr. Gillette was Manager of Engineering at Transamerica Delaval Enterprise Division, Chief Engineer—High-Speed Engines at Ajax-Superior Division and Manager of Design & Development, Cooper-Bessemer Reciprocating Products Division.
Mr. Gillette holds an M.S. in Mechanical Engineering from Purdue University and a B.S. in Mechanical Engineering from Gonzaga University.
Clement Feng has served as our Senior Vice President of Marketing since August 2013 when he re-joined Generac after three years as Vice President – Global Marketing with the Fluke Corporation.
Mr. Feng served as our Senior Vice President of Marketing from 2007 until 2010.
Mr. Feng holds a B.S. in Chemical Engineering from Stanford University and an M.B.A. from the University of Chicago- Booth School of Business.
An excerpt. Shown here: 40 of 56 rewritten, all 27 added and all 35 removed. The counts are complete. For every sentence, read Item 1. Business in the FY2016 filing and the FY2015 filing.
Item 3. Legal Proceedings
1 rewritten, 1 added, 1 removed, 4 unchanged
As of December 31, [removed: 2015,] [added: 2016,] we believe that there is no litigation pending that would have a material effect on our results of operations or financial condition.
PART II
PART II
Cover and table of contents
35 rewritten, 4 added, 1 removed, 91 unchanged
| For the [removed: fiscal] [added: fiscal] year ended December 31, [removed: 2015] [added: 2016] Or | |
| [removed: DELAWARE (State] [added: DELAWARE (State] or other jurisdiction of incorporation or organization) | [removed: 20-5654756 (IRS] [added: 20-5654756 (IRS] Employer Identification No.) |
| S45 W29290 Hwy 59, Waukesha, [removed: WI (Address] [added: WI (Address] of principal executive offices) | [removed: 53189 (Zip] [added: 53189 (Zip] Code) |
| (262) [removed: 544-4811 (Registrant’s] [added: 544-4811 (Registrant’s] telephone number, including area code) | |
| Common Stock, $0.01 par [removed: value (Title] [added: value (Title] of class) | New York Stock [removed: Exchange (Name] [added: Exchange (Name] of exchange on which registered) |
The aggregate market value of the voting common equity held by non-affiliates of the registrant on June 30, [removed: 2015,] [added: 2016,] the last business day of the registrant’s most recently completed second fiscal quarter, was approximately [removed: $2,707,473,704] [added: $2,247,442,615] based upon the closing price reported for such date on the New York Stock Exchange.
As of February [removed: 19, 2016, 66,366,949] [added: 17, 2017, 62,735,597] shares of registrant's common stock were outstanding.
Portions of the registrant’s Annual Report to Stockholders for the year ended December 31, [removed: 2015] [added: 2016] furnished to the Securities and Exchange Commission are incorporated by reference into Part II of this Form 10-K.
Portions of the registrant’s Proxy Statement for the [removed: 2016] [added: 2017] Annual Meeting of Stockholders (the [removed: “2016] [added: “2017] Proxy Statement”), which will be filed by the registrant on or prior to 120 days following the end of the registrant’s fiscal year ended December 31, [removed: 2015,] [added: 2016,] are incorporated by reference into Part III of this Form 10-K.
[removed: 2015] [added: 2016] FORM 10-K ANNUAL REPORT
| [removed: PART I] [added: [PART I](<#PART I>)] | | |
| Item 1. | [removed: [Business](#BKMK6138)] [added: [Business](<#Item 1>)] | 1 |
| Item 1A. | [Risk [removed: Factors](#BKMK6139)] [added: Factors](<#Item 1A>)] | [removed: 9] [added: 8] |
| Item 1B. | [Unresolved Staff [removed: Comments](#BKMK6140)] [added: Comments](<#Item 1B>)] | [removed: 16] [added: 15] |
| Item 2. | [removed: [Properties](#BKMK6141)] [added: [Properties](<#Item 2>)] | [removed: 16] [added: 15] |
| Item 3. | [Legal [removed: Proceedings](#BKMK6142)] [added: Proceedings](<#Item 3>)] | [removed: 17] [added: 16] |
| Item 4. | [Mine Safety [removed: Disclosures](#BKMK6143)] [added: Disclosures](<#Item 4>)] | [removed: 17] [added: 16] |
| [removed: PART II] [added: [PART II](<#PART II>)] | | |
| Item 5. | [Market for Registrant’s Common Equity, Related Stockholder Matters and Issuer Purchases of Equity [removed: Securities](#BKMK6144)] [added: Securities](<#Item 5>)] | 17 |
| Item 6. | [Selected Financial [removed: Data](#BKMK6145)] [added: Data](<#Item 6>)] | 19 |
| Item 7. | [Management’s Discussion and Analysis of Financial Condition and Results of [removed: Operations](#BKMK6146)] [added: Operations](<#Item 7>)] | 24 |
| Item 7A. | [Quantitative and Qualitative Disclosures About Market [removed: Risk](#BKMK6147)] [added: Risk](<#Item 7A>)] | 36 |
| Item 8. | [Financial Statements and Supplementary [removed: Data](#BKMK6148)] [added: Data](<#Item 8>)] | 38 |
| Item 9. | [Changes in and Disagreements with Accountants on Accounting and Financial [removed: Disclosure](#BKMK6149)] [added: Disclosure](<#Item 9>)] | [removed: 66] [added: 70] |
| Item 9A. | [Controls and [removed: Procedures](#BKMK6150)] [added: Procedures](<#Item 9A>)] | [removed: 66] [added: 70] |
| Item 9B. | [Other [removed: Information](#BKMK6152)] [added: Information](<#Item 9B>)] | [removed: 67] [added: 71] |
| [removed: PART III] [added: [PART III](<#Part III>)] | | |
| Item 10. | [Directors, Executive Officers and Corporate [removed: Governance](#BKMK6153)] [added: Governance](<#Item 10>)] | [removed: 67] [added: 71] |
| Item 11. | [Executive [removed: Compensation](#BKMK6154)] [added: Compensation](<#Item 11>)] | [removed: 67] [added: 71] |
| Item 12. | [Security Ownership of Certain Beneficial Owners and Management and Related Stockholder [removed: Matters](#BKMK6155)] [added: Matters](<#Item 12>)] | [removed: 67] [added: 71] |
| Item 13. | [Certain Relationships and Related Transactions, and Director [removed: Independence](#BKMK6156)] [added: Independence](<#Item 13>)] | [removed: 67] [added: 71] |
| Item 14. | [Principal Accountant Fees and [removed: Services](#BKMK6157)] [added: Services](<#Item 14>)] | [removed: 67] [added: 71] |
| [removed: PART IV] [added: [PART IV](<#Part IV>)] | | |
| Item 15. | [Exhibits and Financial Statement [removed: Schedules](#BKMK6158)] [added: Schedules](<#Item 15>)] | [removed: 68] [added: 71] |
| | ● | our business, financial and operating [removed: results] [added: results,] and future economic performance; |
10-K 1 gnrc20161231_10k.htm FORM 10-K
| | |
| | |
| | | | |
10-K 1 gnrc20151231_10k.htm FORM 10-K [Table Of Contents](#TOC)
Item 1B. Unresolved Staff Comments
18 rewritten, 12 added, 6 removed, 4 unchanged
Item [removed: 2. Properties][added: 2.]
We own, operate or lease [removed: manufacturing and] [added: manufacturing,] distribution [removed: facilities located principally in the United States, Mexico, Italy, Brazil] and [removed: the United Kingdom] [added: office facilities globally] totaling over [removed: three] [added: four] million square feet.
We also have inventory warehouses [removed: in the United States] that accommodate material storage and rapid response requirements of our customers.
| Location | | Owned/ Leased | | [removed: Square Footage] [added: Activities] | | [removed: Activities] [added: Segment] |
| Waukesha, WI | | Owned | | [removed: 307,000 | |] Corporate headquarters, manufacturing, storage, [removed: research and development,] [added: R&D,] service parts distribution | [added: | Domestic |]
| Eagle, WI | | Owned | | [removed: 242,000 | |] Manufacturing, office, training | [added: | Domestic |]
| Whitewater, WI | | Owned | | [removed: 491,000 | |] Manufacturing, office, distribution | [added: | Domestic |]
| Berlin, WI | | Owned | | [removed: 129,000] [added: Manufacturing, office, storage, R&D] | | [removed: Manufacturing, office] [added: Domestic] |
| Jefferson, WI | | Owned | | [removed: 253,000] [added: Manufacturing, distribution, R&D] | | [removed: Manufacturing, distribution] [added: Domestic] |
| Maquoketa, IA | | Owned | | [removed: 137,000 | |] Storage, rental property | [added: | Domestic |]
| Vergennes, VT | | Leased | | [removed: 66,000] [added: Office] | | [removed: Office] [added: Domestic] |
| Winooski, VT | | Leased | | [removed: 104,000] [added: Manufacturing, R&D] | | [removed: Manufacturing] [added: Domestic] |
| Mexico City, Mexico | | Owned | | [removed: 180,000 | |] Manufacturing, sales, distribution, storage, [removed: office] [added: office, R&D] | [added: | International |]
| Mexico City, Mexico | | Leased | | [removed: 71,000 | |] Office, storage and warehouse | [added: | International |]
| Curitiba, Brazil | | Leased | | [removed: 24,000 | |] Manufacturing, sales, distribution, storage, office | [added: | International |]
| Milan, Italy | | Leased | | [removed: 91,000 | |] Manufacturing, sales, distribution, storage, [removed: office] [added: office, R&D] | [added: | International |]
| [removed: Milton Keynes,] [added: Crewe,] England | | Leased | | [removed: 9,000] [added: Sales, office, storage] | | [removed: Sales, distribution, storage, office] [added: International] |
As of December 31, [removed: 2015,] [added: 2016,] substantially all of our [removed: owned] [added: domestically-owned and a portion of our internationally-owned] properties are subject to collateral provisions under our senior secured credit facilities.
Properties
The following table provides information about our principal facilities exceeding 10,000 square feet:
| Oshkosh, WI | | Owned | | Manufacturing, office, storage, R&D | | Domestic |
| Various WI | | Leased | | Storage | | Domestic |
| Casole d’Elsa, Italy | | Leased | | Manufacturing, office, storage, R&D | | International |
| Balsicas, Spain | | Leased | | Manufacturing, office, storage, R&D | | International |
| Foshan, China | | Owned | | Manufacturing, office, storage, R&D | | International |
| Saint-Nizier-sous-Charlieu, France | | Leased | | Sales, office, storage | | International |
| Ribeirao Preto, Brazil | | Leased | | Manufacturing, office, storage | | International |
| Fellbach, Germany | | Leased | | Sales, office, storage | | International |
| Celle, Germany | | Owned | | Manufacturing, office, sales, R&D | | International |
| Charzyno, Poland | | Owned | | Manufacturing | | International |
The following table shows the location and activities of our principal operations:
| Oshkosh, WI | | Owned | | 240,000 | | Manufacturing, storage, research and development |
| Berlin, WI | | Leased | | 192,500 | | Manufacturing, storage, research and development |
| Edgerton, WI | | Leased | | 235,000 | | Storage |
| Jefferson, WI | | Leased | | 589,000 | | Storage |
| Bismarck, ND | | Owned | | 50,000 | | Manufacturing and office |
Item 5. Market for Registrant’s Common Equity, Related Stockholder Matters and Issuer Purchases of Equity Securities
11 rewritten, 18 added, 18 removed, 23 unchanged
Shares of our common stock are traded on the New York Stock Exchange (NYSE) under the symbol “GNRC.” The following table sets forth the high and low sales prices reported on the NYSE for our common stock by fiscal quarter during [removed: 2015] [added: 2016] and [removed: 2014,] [added: 2015,] respectively.
| [removed: 2015] [added: 2016] | [removed: High] | [removed: Low] [added: High] | [added: | | | Low | | |]
| [removed: 2014] [added: 2015] | [removed: High] | [removed: Low] [added: High] | [added: | | | Low | | |]
The following table summarizes the stock repurchase activity for the three months ended December 31, [removed: 2015,] [added: 2016,] which consisted of the withholding of shares upon the vesting of restricted stock awards to pay withholding taxes on behalf of the recipient and shares repurchased under the Company’s [removed: $200.0] [added: $250.0] million stock repurchase [removed: program:][added: program authorized in October 2016:]
| | | [removed: Total] [added: Total] Number [removed: of Shares Purchased] [added: of Shares Purchased] | | | | [removed: Average Price Paid] [added: Average Price Paid] per [removed: Share] [added: Share] | | | | [removed: Total] [added: Total] Number [removed: Of Shares Purchased As] [added: Of Shares Purchased As] Part Of [removed: Publicly Announced] [added: Publicly Announced] Plans [removed: Or Programs] [added: Or Programs] | | | | [removed: Approximate Dollar Value] [added: Approximate Dollar Value] Of [removed: Shares That] [added: Shares That] May Yet [removed: Be Purchased Under The] [added: Be Purchased Under The] Plans [removed: Or Programs] [added: Or Programs] | | |
The line graph below compares the cumulative total stockholder return on our common stock with the cumulative total return of the Standard & Poor’s S&P 500 Index, the S&P 500 Industrials Index and the Russell 2000 Index for the five-year period ended December 31, [removed: 2015.][added: 2016.]
The graph and table assume that $100 was invested on December 31, [removed: 2010] [added: 2011] in each of our common stock, the S&P 500 Index, the S&P 500 Industrials Index and the Russell 2000 Index, and that all dividends were reinvested.
[removed: 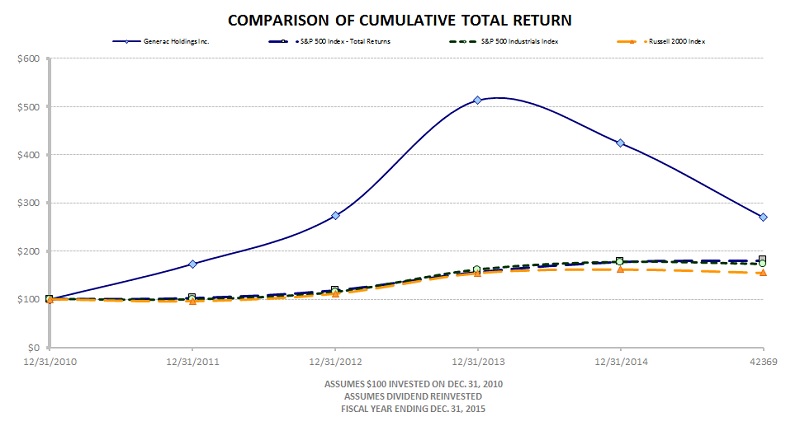][added: 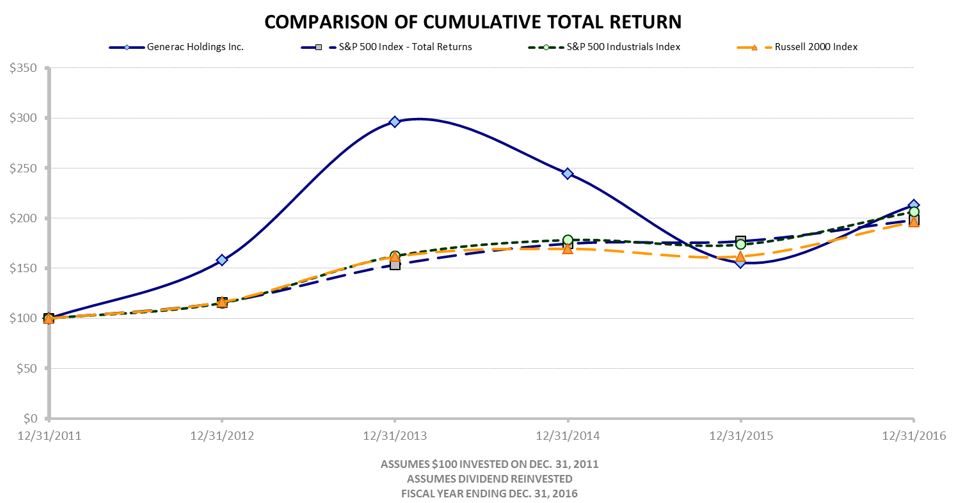]
| Company / Market / Peer Group | | [removed: 12/31/2010 | | | |] 12/31/2011 | | | | 12/31/2012 | | | | 12/31/2013 | | | | 12/31/2014 | | | | 12/31/2015 | | | [added: | 12/31/2016 | | |]
As of February [removed: 19, 2016,] [added: 17, 2017,] there were approximately [removed: 222] [added: 199] registered holders of record of Generac’s common stock.
We [removed: currently] do not have plans to pay dividends on our common stock in the foreseeable future.
| --- | --- | --- | --- | --- | --- | --- | --- | --- |
| Fourth Quarter | | $ | 43.49 | | | $ | 35.74 | |
| Third Quarter | | $ | 38.00 | | | $ | 33.13 | |
| Second Quarter | | $ | 39.25 | | | $ | 33.86 | |
| First Quarter | | $ | 38.51 | | | $ | 27.26 | |
| --- | --- | --- | --- | --- | --- | --- | --- | --- |
| Fourth Quarter | | $ | 32.53 | | | $ | 26.88 | |
| Third Quarter | | $ | 39.78 | | | $ | 27.16 | |
| Second Quarter | | $ | 49.35 | | | $ | 39.62 | |
| First Quarter | | $ | 50.41 | | | $ | 43.74 | |
| 10/01/16 - 10/31/16 | | | 38,699 | | | $ | 38.58 | | | | 38,500 | | | $ | 248,639,009 | |
| 11/01/16 - 11/30/16 | | | 716,809 | | | | 39.66 | | | | 716,000 | | | | 220,244,705 | |
| 12/01/16 - 12/31/16 | | | 481,000 | | | | 41.84 | | | | 481,000 | | | | 200,120,516 | |
| Total | | | 1,236,508 | | | $ | 40.47 | | | | | | | | | |
| Generac Holdings Inc. | | $ | 100.00 | | | $ | 157.76 | | | $ | 296.17 | | | $ | 244.51 | | | $ | 155.67 | | | $ | 213.03 | |
| S&P 500 Index - Total Returns | | | 100.00 | | | | 116.00 | | | | 153.57 | | | | 174.60 | | | | 177.01 | | | | 198.18 | |
| S&P 500 Industrials Index | | | 100.00 | | | | 115.35 | | | | 162.27 | | | | 178.22 | | | | 173.70 | | | | 206.46 | |
| Russell 2000 Index | | | 100.00 | | | | 116.35 | | | | 161.52 | | | | 169.42 | | | | 161.95 | | | | 196.45 | |
| --- | --- | --- |
| Fourth Quarter | $32.53 | $26.88 |
| Third Quarter | $39.78 | $27.16 |
| Second Quarter | $49.35 | $39.62 |
| First Quarter | $50.41 | $43.74 |
| Fourth Quarter | $48.00 | $38.85 |
| Third Quarter | $48.02 | $40.54 |
| Second Quarter | $60.36 | $46.27 |
| First Quarter | $61.17 | $45.72 |
| 10/01/15 - 10/31/15 | | | 112 | | | $ | 31.57 | | | | \- | | | | 135,621,708 | |
| 11/01/15 - 11/30/15 | | | 681,148 | | | | 30.65 | | | | 680,000 | | | | 114,781,696 | |
| 12/01/15 - 12/31/15 | | | 473,500 | | | | 31.10 | | | | 473,500 | | | | 100,057,756 | |
| Total | | | 1,154,760 | | | $ | 30.83 | | | | | | | | | |
| Generac Holdings Inc. | | $ | 100.00 | | | $ | 173.35 | | | $ | 273.48 | | | $ | 513.40 | | | $ | 423.84 | | | $ | 269.84 | |
| S&P 500 Index - Total Returns | | | 100.00 | | | | 102.11 | | | | 118.45 | | | | 156.82 | | | | 178.28 | | | | 180.75 | |
| S&P 500 Industrials Index | | | 100.00 | | | | 99.41 | | | | 114.67 | | | | 161.31 | | | | 177.16 | | | | 172.67 | |
| Russell 2000 Index | | | 100.00 | | | | 95.82 | | | | 111.49 | | | | 154.78 | | | | 162.35 | | | | 155.18 | |
On June 21, 2013, the Company used a portion of the proceeds from the May 31, 2013 debt refinancing (see Note 10, “Credit Agreements,” to the consolidated financial statements in Item 8 of this Annual Report on Form 10-K) to pay a special cash dividend of $5.00 per share on its common stock, resulting in payments totaling $340.8 million to stockholders on that date.
Item 6. Selected Financial Data
89 rewritten, 32 added, 12 removed, 103 unchanged
The selected historical consolidated financial data for the years ended December 31, [removed: 2015, 2014] [added: 2016, 2015] and [removed: 2013] [added: 2014] are derived from our audited consolidated financial statements included elsewhere in this annual report.
The selected historical consolidated financial data for the years ended December 31, [removed: 2012] [added: 2013] and [removed: 2011] [added: 2012] is derived from our audited historical consolidated financial statements not included in this annual report.
| | | [removed: Year] [added: Year] Ended December [removed: 31,] [added: 31,] | | | | | | | | | | | | | | | | | | |
| (U.S. Dollars in thousands, except per share data) | | [removed: 2015] [added: 2016] | | | | [removed: 2014] [added: 2015] | | | | [removed: 2013] [added: 2014] | | | | [removed: 2012] [added: 2013] | | | | [removed: 2011] [added: 2012] | | |
| Net sales | | $ | [removed: 1,317,299] [added: 1,444,453] | | | $ | [removed: 1,460,919] [added: 1,317,299] | | | $ | [removed: 1,485,765] [added: 1,460,919] | | | $ | [removed: 1,176,306] [added: 1,485,765] | | | $ | [removed: 791,976] [added: 1,176,306] | |
| Costs of goods sold | | | [removed: 857,349] [added: 930,347] | | | | [removed: 944,700] [added: 857,349] | | | | [removed: 916,205] [added: 944,700] | | | | [removed: 735,906] [added: 916,205] | | | | [removed: 497,322] [added: 735,906] | |
| Gross profit | | | [removed: 459,950] [added: 514,106] | | | | [removed: 516,219] [added: 459,950] | | | | [removed: 569,560] [added: 516,219] | | | | [removed: 440,400] [added: 569,560] | | | | [removed: 294,654] [added: 440,400] | |
| Selling and service | | | [removed: 130,242] [added: 164,607] | | | | [removed: 120,408] [added: 130,242] | | | | [removed: 107,515] [added: 120,408] | | | | [removed: 101,448] [added: 107,515] | | | | [removed: 77,776] [added: 101,448] | |
| Research and development | | | [removed: 32,922] [added: 37,229] | | | | [removed: 31,494] [added: 32,922] | | | | [removed: 29,271] [added: 31,494] | | | | [removed: 23,499] [added: 29,271] | | | | [removed: 16,476] [added: 23,499] | |
| General and administrative | | | [removed: 52,947] [added: 74,700] | | | | [removed: 54,795] [added: 52,947] | | | | [removed: 55,490] [added: 54,795] | | | | [removed: 46,031] [added: 55,490] | | | | [removed: 30,012] [added: 46,031] | |
| Amortization of intangibles (1) | | | [removed: 23,591] [added: 32,953] | | | | [removed: 21,024] [added: 23,591] | | | | [removed: 25,819] [added: 21,024] | | | | [removed: 45,867] [added: 25,819] | | | | [removed: 48,020] [added: 45,867] | |
| Tradename and goodwill impairment (2) | | | [removed: 40,687] [added: \-] | | | | [removed: \-] [added: 40,687] | | | | \- | | | | \- | | | | [removed: 9,389] [added: \-] | |
| Gain on remeasurement of contingent consideration (3) | | | \- | | | | [removed: (4,877] [added: \-] | [removed: )] | | | [removed: \-] [added: (4,877] | [added: )] | | | \- | | | | \- | |
| Total operating expenses | | | [removed: 280,389] [added: 309,489] | | | | [removed: 222,844] [added: 280,389] | | | | [removed: 218,095] [added: 222,844] | | | | [removed: 216,845] [added: 218,095] | | | | [removed: 181,673] [added: 216,845] | |
| Income from operations | | | [removed: 179,561] [added: 204,617] | | | | [removed: 293,375] [added: 179,561] | | | | [removed: 351,465] [added: 293,375] | | | | [removed: 223,555] [added: 351,465] | | | | [removed: 112,981] [added: 223,555] | |
| Interest expense | | | [removed: (42,843] [added: (44,568] | ) | | | [removed: (47,215] [added: (42,843] | ) | | | [removed: (54,435] [added: (47,215] | ) | | | [removed: (49,114] [added: (54,435] | ) | | | [removed: (23,718] [added: (49,114] | ) |
| Investment income | | | [removed: 123] [added: 44] | | | | [removed: 130] [added: 123] | | | | [removed: 91] [added: 130] | | | | [removed: 79] [added: 91] | | | | [removed: 110] [added: 79] | |
| Loss on extinguishment of debt (4) | | | [removed: (4,795] [added: (574] | ) | | | [removed: (2,084] [added: (4,795] | ) | | | [removed: (15,336] [added: (2,084] | ) | | | [removed: (14,308] [added: (15,336] | ) | | | [removed: (377] [added: (14,308] | ) |
| Gain (loss) on change in contractual interest rate (5) | | | [removed: (2,381] [added: (2,957] | ) | | | [removed: 16,014] [added: (2,381] | [added: )] | | | [removed: \-] [added: 16,014] | | | | \- | | | | \- | |
| Costs related to acquisitions | | | [removed: (1,195] [added: (1,082] | ) | | | [removed: (396] [added: (1,195] | ) | | | [removed: (1,086] [added: (396] | ) | | | [removed: (1,062] [added: (1,086] | ) | | | [removed: (875] [added: (1,062] | ) |
| Other, net | | | [removed: (5,487] [added: 902] | [removed: )] | | | [removed: (1,462] [added: (5,487] | ) | | | [removed: (1,983] [added: (1,462] | ) | | | [removed: (2,798] [added: (1,983] | ) | | | [removed: (1,155] [added: (2,798] | ) |
| Total other expense, net | | | [removed: (56,578] [added: (48,235] | ) | | | [removed: (35,013] [added: (56,578] | ) | | | [removed: (72,749] [added: (35,013] | ) | | | [removed: (67,203] [added: (72,749] | ) | | | [removed: (26,015] [added: (67,203] | ) |
| Income before provision for income taxes | | | [removed: 122,983] [added: 156,382] | | | | [removed: 258,362] [added: 122,983] | | | | [removed: 278,716] [added: 258,362] | | | | [removed: 156,352] [added: 278,716] | | | | [removed: 86,966] [added: 156,352] | |
| Provision [removed: (benefit)] for income taxes [removed: (6)] | | | [removed: 45,236] [added: 57,570] | | | | [removed: 83,749] [added: 45,236] | | | | [removed: 104,177] [added: 83,749] | | | | [removed: 63,129] [added: 104,177] | | | | [removed: (237,677] [added: 63,129] | [removed: )] |
| Net income | | [removed: $] | [removed: 77,747] [added: 98,812] | | | [removed: $] | [removed: 174,613] [added: 77,747] | | | [removed: $] | [removed: 174,539] [added: 174,613] | | | [removed: $] | [removed: 93,223] [added: 174,539] | | | [removed: $] | [removed: 324,643] [added: 93,223] | |
| Depreciation | | $ | [removed: 16,742] [added: 21,465] | | | $ | [removed: 13,706] [added: 16,742] | | | $ | [removed: 10,955] [added: 13,706] | | | $ | [removed: 8,293] [added: 10,955] | | | $ | [removed: 8,103] [added: 8,293] | |
| Amortization of intangible assets | | | [removed: 23,591] [added: 32,953] | | | | [removed: 21,024] [added: 23,591] | | | | [removed: 25,819] [added: 21,024] | | | | [removed: 45,867] [added: 25,819] | | | | [removed: 48,020] [added: 45,867] | |
| Expenditures for property and equipment | | | [removed: (30,651] [added: (30,467] | ) | | | [removed: (34,689] [added: (30,651] | ) | | | [removed: (30,770] [added: (34,689] | ) | | | [removed: (22,392] [added: (30,770] | ) | | | [removed: (12,060] [added: (22,392] | ) |
| Adjusted EBITDA [removed: (7)] | | [removed: $] | [removed: 270,816] [added: 278,387] | | | [removed: $] | [removed: 337,283] [added: 270,816] | | | [removed: $] | [removed: 402,613] [added: 337,283] | | | [removed: $] | [removed: 289,809] [added: 402,613] | | | [removed: $] | [removed: 188,476] [added: 289,809] | |
| Adjusted [removed: Net Income (8)] [added: net income] | | | [removed: 198,436] [added: 200,476] | | | | [removed: 234,165] [added: 198,436] | | | | [removed: 301,664] [added: 234,165] | | | | [removed: 220,792] [added: 301,034] | | | | [removed: 147,176] [added: 220,792] | |
| (U.S. Dollars in thousands) | | As of [removed: December 31, 2015] [added: December 31, 2016] | | | | As of [removed: December 31, 2014] [added: December 31, 2015] | | | | As of [removed: December 31, 2013] [added: December 31, 2014] | | | | As of [removed: December 31, 2012] [added: December 31, 2013] | | | | As of [removed: December 31, 2011] [added: December 31, 2012] | | |
| Property, plant and equipment, net | | | [removed: 184,213] [added: 212,793] | | | | [removed: 168,821] [added: 184,213] | | | | [removed: 146,390] [added: 168,821] | | | | [removed: 104,718] [added: 146,390] | | | | [removed: 84,384] [added: 104,718] | |
| Goodwill | | | [removed: 669,719] [added: 704,640] | | | | [removed: 635,565] [added: 669,719] | | | | [removed: 608,287] [added: 635,565] | | | | [removed: 552,943] [added: 608,287] | | | | [removed: 547,473] [added: 552,943] | |
| Total current liabilities | | $ | [removed: 213,224] [added: 341,939] | | | $ | [removed: 240,522] [added: 213,224] | | | $ | [removed: 250,845] [added: 240,522] | | | $ | [removed: 294,859] [added: 250,845] | | | $ | [removed: 165,390] [added: 294,859] | |
| Stockholders' equity | | | [removed: 465,871] [added: 401,112] | | | | [removed: 489,799] [added: 465,871] | | | | [removed: 317,071] [added: 489,799] | | | | [removed: 463,628] [added: 317,071] | | | | [removed: 768,889] [added: 463,628] | |
Refer to Note 2, “Significant Accounting Policies – Goodwill and Other Indefinite-Lived Intangible Assets,” [removed: and Note 8, “Goodwill and Intangible Assets,”] to the consolidated financial statements in Item 8 of this Annual Report on Form 10-K for further information on the 2015 impairment charges.
(3) During the second quarter of 2014, we recorded a gain of $4.9 million related to an adjustment to a certain earn-out obligation in connection with [removed: a recent] [added: the Tower Light] acquisition.
(4) For the years ended December 31, [added: 2016,] 2015, 2014 and 2013, represents the non-cash write-off of original issue discount and [removed: capitalized debt issuances] [added: deferred financing] costs due to voluntary debt prepayments.
Additionally, for the year ended December 31, 2013, represents the loss on extinguishment of debt as a result of [removed: the] [added: a] refinancing transaction in May 2013.
[added: (e)] For the [removed: year] [added: years] ended December 31, [removed: 2011,] [added: 2016, 2015, 2014 and 2013,] represents the non-cash write-off of [removed: capitalized debt issuance] [added: original issue discount and deferred financing] costs due to voluntary debt prepayments.
| Net income attributable to noncontrolling interests | | | 24 | | | | \- | | | | \- | | | | \- | | | | \- | |
| Net income attributable to Generac Holdings Inc. | | $ | 98,788 | | | $ | 77,747 | | | $ | 174,613 | | | $ | 174,539 | | | $ | 93,223 | |
| Net income attributable to common shareholders per common share - diluted: | | $ | 1.50 | | | $ | 1.12 | | | $ | 2.49 | | | $ | 2.51 | | | $ | 1.35 | |
| Current assets | | $ | 683,509 | | | $ | 632,017 | | | $ | 707,637 | | | $ | 627,310 | | | $ | 473,866 | |
| Other intangibles and other assets | | | 260,742 | | | | 292,686 | | | | 352,396 | | | | 394,237 | | | | 459,470 | |
| Total assets | | $ | 1,861,684 | | | $ | 1,778,635 | | | $ | 1,864,419 | | | $ | 1,776,224 | | | $ | 1,590,997 | |
| | | | | | | | | | | | | | | | | | | | | |
| Long-term borrowings, less current portion | | | 1,006,758 | | | | 1,037,132 | | | | 1,065,858 | | | | 1,155,298 | | | | 785,031 | |
| Other long-term liabilities | | | 78,737 | | | | 62,408 | | | | 68,240 | | | | 53,010 | | | | 47,479 | |
| Redeemable noncontrolling interests | | | 33,138 | | | | \- | | | | \- | | | | \- | | | | \- | |
| Total liabilities and stockholders' equity | | $ | 1,861,684 | | | $ | 1,778,635 | | | $ | 1,864,419 | | | $ | 1,776,224 | | | $ | 1,590,997 | |
(5) For the year ended December 31, 2016, represents a non-cash loss in the third quarter relating to the continued 25 basis point increase in borrowing costs as a result of the credit agreement leverage ratio remaining above 3.0 times and expected to remain above 3.0 times based on current projections.
| Net income attributable to Generac Holdings Inc. | | $ | 98,788 | | | $ | 77,747 | | | $ | 174,613 | | | $ | 174,539 | | | $ | 93,223 | |
| Net income attributable to noncontrolling interests (a) | | | 24 | | | | \- | | | | \- | | | | \- | | | | \- | |
| Net income | | | 98,812 | | | | 77,747 | | | | 174,613 | | | | 174,539 | | | | 93,223 | |
| Adjusted EBITDA attributable to noncontrolling interests | | | 3,784 | | | | \- | | | | \- | | | | \- | | | | \- | |
| Adjusted EBITDA attributable to Generac Holdings Inc. | | $ | 274,603 | | | $ | 270,816 | | | $ | 337,283 | | | $ | 402,613 | | | $ | 289,809 | |
(a) For the year ended December 31, 2016, includes the noncontrolling interests’ share of expenses related to Pramac purchase accounting, including the step-up in value of inventories and intangible amortization of $8.0 million.
Additionally, for the year ended December 31, 2013, represents the loss on extinguishment of debt as a result of a refinancing transaction in May 2013.
(f) For the year ended December 31, 2016, represents a non-cash loss in the third quarter relating to the continued 25 basis point increase in borrowing costs as a result of the credit agreement leverage ratio remaining above 3.0 times and expected to remain above 3.0 times based on current projections.
For the year ended December 31, 2014, represents a non-cash gain relating to a 25 basis point reduction in borrowing costs as a result of the credit agreement leverage ratio falling below 3.0 times effective second quarter 2014 and expected to remain below 3.0 times based on projections at that time.
(h) For the year ended December 31, 2016, represents charges relating to business optimization and restructuring costs to address the significant and extended downturns for capital spending within the oil & gas industry.
| | | Year Ended December 31, | | | | | | | | | | | | | | | | | | |
| (U.S. Dollars in thousands) | | 2016 | | | | 2015 | | | | 2014 | | | | 2013 | | | | 2012 | | |
| Net income attributable to Generac Holdings Inc. | | $ | 98,788 | | | $ | 77,747 | | | $ | 174,613 | | | $ | 174,539 | | | $ | 93,223 | |
| Net income attributable to noncontrolling interests | | | 24 | | | | \- | | | | \- | | | | \- | | | | \- | |
| Net income | | | 98,812 | | | | 77,747 | | | | 174,613 | | | | 174,539 | | | | 93,223 | |
| Amortization of intangible assets | | | 32,953 | | | | 23,591 | | | | 21,024 | | | | 25,189 | | | | 45,867 | |
| Adjusted net income attributable to noncontrolling interests | | | 2,219 | | | | \- | | | | \- | | | | \- | | | | \- | |
| Adjusted net income attributable to Generac Holdings Inc. | | $ | 198,257 | | | $ | 198,436 | | | $ | 234,165 | | | $ | 301,034 | | | $ | 220,792 | |
(b) For the year ended December 31, 2016, amount is based on a cash income tax rate of 5.9%.
Cash income tax expense for 2016 is based on the projected taxable income and corresponding cash tax rate for the full year after considering the effects of current and deferred income tax items, and is calculated by applying the derived cash tax rate to the period’s pretax income.
| Income per share - diluted: | | | | | | | | | | | | | | | | | | | | |
| Common Stock | | $ | 1.12 | | | $ | 2.49 | | | $ | 2.51 | | | $ | 1.35 | | | $ | 4.79 | |
| Current assets | | $ | 661,372 | | | $ | 730,478 | | | $ | 654,179 | | | $ | 522,553 | | | $ | 383,265 | |
| Other intangibles and other assets | | | 277,512 | | | | 347,678 | | | | 389,349 | | | | 423,633 | | | | 537,671 | |
| Total assets | | $ | 1,792,816 | | | $ | 1,882,542 | | | $ | 1,798,205 | | | $ | 1,603,847 | | | $ | 1,552,793 | |
| Long-term borrowings, less current portion | | | 1,050,097 | | | | 1,082,101 | | | | 1,175,349 | | | | 799,018 | | | | 575,000 | |
| Other long-term liabilities | | | 63,624 | | | | 70,120 | | | | 54,940 | | | | 46,342 | | | | 43,514 | |
| Total liabilities and stockholders' equity | | $ | 1,792,816 | | | $ | 1,882,542 | | | $ | 1,798,205 | | | $ | 1,603,847 | | | $ | 1,552,793 | |
During the fourth quarter of 2011, we decided to strategically transition certain products to the Generac® tradename, which resulted in a $9.4 million non-cash charge which primarily related to the write-down of the impacted tradename to net realizable value.
(6) The 2011 net tax benefit of $237.7 million includes a tax benefit of $271.4 million recorded due to the reversal of valuation allowances recorded on our net deferred tax assets.
For the year ended December 31, 2011, represents the decision to strategically transition certain products to the Generac® tradename, which resulted in a $9.4 million non-cash charge which primarily related to the write-down of the impacted tradename to net realizable value.
(d) For the years ended December 31, 2015, 2014 and 2013, represents the non-cash write-off of original issue discount and capitalized debt issuance costs due to voluntary debt prepayments.
An excerpt. Shown here: 40 of 89 rewritten, all 32 added and all 12 removed. The counts are complete. For every sentence, read Item 6. Selected Financial Data in the FY2016 filing and the FY2015 filing.
Item 8. Financial Statements and Supplementary Data
485 rewritten, 359 added, 161 removed, 415 unchanged
We have audited [removed: Generac Holdings Inc.’s] [added: the] internal control over financial reporting [added: of Generac Holdings Inc. and its subsidiaries (the "Company")] as of December 31, [removed: 2015,] [added: 2016,] based on criteria established in Internal [removed: Control—Integrated] [added: Control — Integrated] Framework [added: (2013)] issued by the Committee of Sponsoring Organizations of the Treadway [removed: Commission (2013 Framework) (the COSO criteria).][added: Commission.]
[removed: Generac Holdings Inc.’s] [added: The Company's] management is responsible for maintaining effective internal control over financial [removed: reporting,] [added: reporting] and for its assessment of the effectiveness of internal control over financial [removed: reporting] [added: reporting,] included in the accompanying Management’s Report on Internal Control [removed: Over] [added: over] Financial Reporting.
A [removed: company’s] [added: company's] internal control over financial reporting is a process designed [added: by, or under the supervision of, the company's principal executive and principal financial officers, or persons performing similar functions, and effected by the company's board of directors, management, and other personnel] to provide reasonable assurance regarding the reliability of financial reporting and the preparation of financial statements for external purposes in accordance with generally accepted accounting principles.
Also, projections of any evaluation of [added: the] effectiveness [added: of the internal control over financial reporting] to future periods are subject to the risk that [added: the] controls may become inadequate because of changes in conditions, or that the degree of compliance with the policies or procedures may deteriorate.
[removed: Our] [added: Accordingly, our] audit [removed: of internal control over financial reporting of Generac Holdings Inc. also] did not include [removed: an evaluation of] the internal control over financial reporting [removed: of CHP.][added: at Pramac.]
In our opinion, [removed: Generac Holdings Inc.] [added: the Company] maintained, in all material respects, effective internal control over financial reporting as of December 31, [removed: 2015,] [added: 2016,] based on the [removed: COSO criteria.][added: criteria established in Internal Control — Integrated Framework (2013) issued by the Committee of Sponsoring Organizations of the Treadway Commission.]
We [removed: also] have [added: also] audited, in accordance with the standards of the Public Company Accounting Oversight Board (United States), the consolidated balance [removed: sheets] [added: sheet] as of December 31, [removed: 2015 and 2014,] [added: 2016] and [added: the] related consolidated [removed: statements] [added: statement] of comprehensive income, [removed: stockholders'] [added: stockholders’] equity and cash flows for [removed: each of] the [removed: three years in the period] [added: year] ended December 31, [removed: 2015] [added: 2016] of Generac Holdings Inc. and our report dated February [removed: 26, 2016] [added: 24, 2017] expressed an unqualified opinion [removed: thereon.][added: on those financial statements.]
Milwaukee, [removed: WI, USA][added: WI]
We have audited the accompanying consolidated balance [removed: sheets] [added: sheet] of Generac Holdings Inc. (the Company) as of December 31, [removed: 2015 and 2014,] [added: 2015,] and the related consolidated statements of comprehensive income, [removed: stockholders’] [added: stockholders'] equity and cash flows for each of the [removed: three] [added: two] years in the period ended December 31, 2015.
In our opinion, the financial statements referred to above present fairly, in all material respects, the consolidated financial position of Generac Holdings Inc. at December 31, [removed: 2015 and 2014,] [added: 2015,] and the consolidated results of its operations and its cash flows for each of the [removed: three] [added: two] years in the period ended December 31, 2015, in conformity with U.S. generally accepted accounting principles.
We also have audited, in accordance with the standards of the Public Company Accounting Oversight Board (United States), [removed: Generac Holdings Inc.’s] [added: the Company's] internal control over financial reporting as of December 31, [removed: 2015,] [added: 2016,] based on criteria established in Internal Control-Integrated Framework issued by the Committee of Sponsoring Organizations of the Treadway Commission [removed: (2013 Framework)] [added: (2013)] and our report dated February [removed: 26, 2016] [added: 24, 2017] expressed an unqualified opinion thereon.
[added: |] Generac Holdings Inc. [added: | | | |]
[added: |] Consolidated Balance Sheets [added: | | | |]
[removed: _(Dollars] [added: | _(U.S. Dollars] in Thousands, Except Share and Per Share Data)_ [added: | | | |]
| | | [removed: December 31,] [added: December 31,] | | | | | | |
| | | [removed: 2015] [added: 2016] | | | | [removed: 2014] [added: 2015] | | | [added: | 2014 | | |]
| Cash and cash equivalents [added: at end of period] | | $ | [added: 67,272 | | | $ |] 115,857 | | | $ | 189,761 | |
| Accounts receivable, less allowance for doubtful accounts of [added: $5,642 and] $2,494 at December 31, [removed: 2015] [added: 2016] and [removed: $2,275 at December 31, 2014] [added: 2015, respectively] | | | [removed: 182,185] [added: 241,857] | | | | [removed: 189,107] [added: 182,185] | |
| Inventories | | | [removed: 325,375] [added: 349,731] | | | | [removed: 319,385] [added: 325,375] | |
| Deferred income taxes | | | [removed: 29,355] [added: 3,337] | | | | [removed: 22,841] [added: 34,812] | |
| Prepaid expenses and other assets | | | [removed: 8,600] [added: 24,649] | | | | [removed: 9,384] [added: 8,600] | |
| Property and equipment, net | | | [removed: 184,213] [added: 212,793] | | | | [removed: 168,821] [added: 184,213] | |
| Customer lists, net | | | [removed: 39,313] [added: 45,312] | | | | [removed: 41,002] [added: 39,313] | |
| Patents, net | | | [removed: 53,772] [added: 48,061] | | | | [removed: 56,894] [added: 53,772] | |
| Other intangible assets, net | | | [removed: 2,768] [added: 2,925] | | | | [removed: 4,298] [added: 2,768] | |
| Tradenames, net | | | [removed: 161,057] [added: 158,874] | | | | [removed: 182,684] [added: 161,057] | |
| Goodwill | | | [removed: 669,719] [added: 704,640] | | | | [removed: 635,565] [added: 669,719] | |
| Deferred income taxes | | | [removed: 6,673] [added: 17,278] | | | | [removed: 46,509] [added: 4,950] | |
| Other assets | | | [removed: 964] [added: 2,233] | | | | [removed: 48] [added: 964] | |
| Short-term borrowings | | $ | [removed: 8,594] [added: 31,198] | | | $ | [removed: 5,359] [added: 8,594] | |
| Accounts payable | | | [removed: 108,332] [added: 181,519] | | | | [removed: 132,248] [added: 108,332] | |
| Accrued wages and employee benefits | | | [removed: 13,101] [added: 21,189] | | | | [removed: 17,544] [added: 13,101] | |
| Other accrued liabilities | | | [removed: 82,540] [added: 93,068] | | | | [removed: 84,814] [added: 82,540] | |
| Current portion of long-term borrowings and capital lease obligations | | | [removed: 657] [added: 14,965] | | | | [removed: 557] [added: 657] | |
| Total current liabilities | | | [removed: 213,224] [added: 341,939] | | | | [removed: 240,522] [added: 213,224] | |
| Long-term borrowings and capital lease obligations | | | [removed: 1,050,097] [added: 1,006,758] | | | | [removed: 1,082,101] [added: 1,037,132] | |
| Other long-term liabilities | | | [removed: 57,458] [added: 61,459] | | | | [removed: 56,671] [added: 57,458] | |
| Common stock, par value $0.01, 500,000,000 shares authorized, [removed: 69,582,669] [added: 70,261,481] and [removed: 69,122,271] [added: 69,582,669] shares issued at December 31, [removed: 2015] [added: 2016] and [removed: 2014,] [added: 2015,] respectively | | | [removed: 696] [added: 702] | | | | [removed: 691] [added: 696] | |
| Additional paid-in capital | | | [removed: 443,109] [added: 449,049] | | | | [removed: 434,906] [added: 443,109] | |
| Treasury stock, at cost, [removed: 3,567,575] [added: 7,564,874] and [removed: 198,312] [added: 3,567,575] shares at December 31, [removed: 2015] [added: 2016] and [removed: 2014,] [added: 2015,] respectively | | | [removed: (111,516] [added: (262,402] | ) | | | [removed: (8,341] [added: (111,516] | ) |
Waukesha, Wisconsin
We have audited the accompanying consolidated balance sheet of Generac Holdings Inc. and subsidiaries (the "Company") as of December 31, 2016, and the related consolidated statements of comprehensive income, stockholders' equity and cash flows for the year ended December 31, 2016.
These consolidated financial statements are the responsibility of the Company's management.
Our responsibility is to express an opinion on these consolidated financial statements based on our audit.
In our opinion, the consolidated financial statements referred to above present fairly, in all material respects, the consolidated financial position of Generac Holdings Inc. and subsidiaries as of December 31, 2016, and the consolidated results of their operations and their cash flows for the year ended December 31, 2016, in conformity accounting principles generally accepted in the United States of America.
/s/ Deloitte & Touche LLP
February 24, 2017
Waukesha, Wisconsin
Those standards require that we plan and perform the audit to obtain reasonable assurance about whether the financial statements are free of material misstatement.
An audit includes examining, on a test basis, evidence supporting the amounts and disclosures in the financial statements.
An audit also includes assessing the accounting principles used and significant estimates made by management, as well as evaluating the overall financial statement presentation.
Milwaukee, WI
February 26, 2016 (except for Note 6, _Segment Reporting_, and Note 2, _New Accounting Pronouncements_, as to which the date is February 24, 2017)
Report of Independent Registered Public Accounting Firm
To the Board of Directors and Stockholders of Generac Holdings Inc.
Waukesha, Wisconsin
As described in Management’s Report on Internal Control Over Financial Reporting, management excluded from its assessment the internal control over financial reporting at the PR Industrial business ("Pramac"), which was acquired on March 1, 2016 and whose financial statements constitute 22.5% and 11.1% of net and total assets, respectively, 12.6% of revenues, and 0.7% of net income of the total consolidated financial statement amounts as of and for the year ended December 31, 2016.
We conducted our audit in accordance with the standards of the Public Company Accounting Oversight Board (United States).
We believe that our audit provides a reasonable basis for our opinion.
Because of the inherent limitations of internal control over financial reporting, including the possibility of collusion or improper management override of controls, material misstatements due to error or fraud may not be prevented or detected on a timely basis.
/s/ Deloitte & Touche LLP
Milwaukee, WI
February 24, 2017
| --- | --- | --- | --- |
| | | 2016 | | | | 2015 | | |
| Total current assets | | | 683,509 | | | | 632,017 | |
| Total assets | | $ | 1,861,684 | | | $ | 1,778,635 | |
| Total liabilities | | | 1,427,434 | | | | 1,312,764 | |
| Redeemable noncontrolling interest | | | 33,138 | | | | – | |
| Stockholders’ equity attributable to Generac Holdings Inc. | | | 401,122 | | | | 465,871 | |
| Noncontrolling interests | | | (10 | ) | | | – | |
| Total liabilities and stockholders’ equity | | $ | 1,861,684 | | | $ | 1,778,635 | |
| --- | --- | --- | --- |
| Generac Holdings Inc. | | | | | |
| --- | --- | --- | --- | --- | --- |
| _(U.S. Dollars in Thousands, Except Share and Per Share Data)_ | | | | | |
| Net income attributable to noncontrolling interests | | | 24 | | | | \- | | | | \- | |
| Net income attributable to Generac Holdings Inc. | | $ | 98,788 | | | $ | 77,747 | | | $ | 174,613 | |
| Comprehensive loss attributable to noncontrolling interests | | | (973 | ) | | | – | | | | – | |
| Comprehensive income attributable to Generac Holdings Inc. | | $ | 82,097 | | | $ | 71,039 | | | $ | 161,261 | |
Because of its inherent limitations, internal control over financial reporting may not prevent or detect misstatements.
As indicated in the accompanying Management’s Report on Internal Control Over Financial Reporting, management’s assessment of and conclusion on the effectiveness of internal control over financial reporting did not include the internal controls of the Country Home Products (CHP) business, which is included in the December 31, 2015 consolidated financial statements of Generac Holdings Inc., and constituted 6.0% and 15.9% of total and net assets, respectively, as of December 31, 2015 and 2.0% and -0.7% of revenues and net income, respectively, for the year then ended.
As indicated in the Report of Management on Generac Holdings Inc.’s Internal Control Over Financial Reporting, the Company implemented a new accounting software system on January 4, 2016, which was subsequent to the date of management’s assessment of the effectiveness of internal control over financial reporting.
/s/ Ernst & Young LLP
February 26, 2016
| --- | --- | --- | --- | --- | --- | --- | --- | --- |
| Total current assets | | | 661,372 | | | | 730,478 | |
| | | | | | | | | |
| Deferred financing costs, net | | | 12,965 | | | | 16,243 | |
| Total assets | | $ | 1,792,816 | | | $ | 1,882,542 | |
| Deferred income taxes | | | 6,166 | | | | 13,449 | |
| Total liabilities | | | 1,326,945 | | | | 1,392,743 | |
| Total liabilities and stockholders’ equity | | $ | 1,792,816 | | | $ | 1,882,542 | |
| | | | | | | | | | | | | | | | | | | | | | | Excess | | | | | | | | | | | | | | |
| --- | --- | --- | --- | --- | --- | --- | --- | --- | --- | --- | --- | --- | --- | --- | --- | --- | --- | --- | --- | --- | --- | --- | --- | --- | --- | --- | --- | --- | --- | --- | --- | --- | --- | --- | --- | --- |
| | | | | | | | | | | | | | | | | | | | | | | Purchase | | | | | | | | | | | | | | |
| | | | | | | | | | | | | | | | | | | | | | | Price | | | | Retained | | | | Accumulated | | | | | | |
| | | | | | | | | | | Additional | | | | | | | | | | | | Over | | | | Earnings | | | | Other | | | | Total | | |
| Balance at December 31, 2012 | | | 68,295,960 | | | $ | 683 | | | $ | 743,349 | | | | – | | | | – | | | $ | (202,116 | ) | | $ | (63,792 | ) | | $ | (14,496 | ) | | $ | 463,628 | |
| Dividends declared | | | – | | | | – | | | | (337,011 | ) | | | – | | | | – | | | | – | | | | (4,934 | ) | | | – | | | | (341,945 | ) |
| | | | | | | | | | | | | | | | | | | | | | | | | | | | | | | | | | | | | |
| Unrealized loss on interest rate swaps, net of tax of $(860) | | | – | | | | – | | | | – | | | | – | | | | – | | | | – | | | | – | | | | (1,420 | ) | | | (1,420 | ) |
| Unrealized loss on interest rate swaps, net of tax of $(609) | | | – | | | | – | | | | – | | | | – | | | | – | | | | – | | | | – | | | | (965 | ) | | | (965 | ) |
| Dividends paid | | | – | | | | – | | | | 29 | | | | – | | | | – | | | | – | | | | – | | | | – | | | | 29 | |
| Amortization of original issue discount | | | 3,050 | | | | 3,599 | | | | 2,074 | |
| Amortization of deferred financing costs | | | 2,379 | | | | 3,016 | | | | 2,698 | |
| Amortization of unrealized loss on interest rate swaps | | | – | | | | – | | | | 2,381 | |
| Provision for losses on accounts receivable | | | 481 | | | | 672 | | | | 1,037 | |
| Loss on disposal of property and equipment | | | 59 | | | | 576 | | | | 370 | |
| Proceeds from sale of business, net | | | – | | | | – | | | | 2,254 | |
| Cash dividends paid | | | (1,436 | ) | | | (902 | ) | | | (343,429 | ) |
The consolidated financial statements include the accounts of the Company and its wholly owned subsidiaries.
Debt discounts incurred in connection with the issuance of long-term debt are deferred and recorded as a reduction of outstanding debt and amortized to interest expense using the effective interest method over the terms of the related credit agreements.
In August 2015, the FASB issued ASU 2015-14, which deferred the effective date of ASU 2014-09 for an additional year, making the guidance effective for the Company in 2018.
This guidance is a part of the FASB’s initiative to reduce complexity in accounting standards, and requires that debt issuance costs related to a recognized debt liability be presented in the balance sheet as a direct deduction from the carrying amount of the debt liability, consistent with debt discounts.
The Company expects that this guidance will only affect the classification of debt issuance costs on its balance sheets and will have no impact on its results of operations.
In September 2015, the FASB issued ASU 2015-16, _Business Combinations: Simplifying_ _the Accounting for Measurement_ _Period Adjustments_.
This guidance eliminates the requirement for an acquirer to recognize measurement period adjustments retrospectively; rather an acquirer will recognize a measurement period adjustment during the period in which it determines the amount of the adjustment.
The Company has early adopted this guidance in the current year; however, there is no impact on the Company’s results of operations for year ended December 31, 2015 as there were no material measurement period adjustments.
This guidance is a part of the FASB’s initiative to reduce complexity in accounting standards, and requires that deferred tax liabilities and assets be classified as noncurrent in the consolidated balance sheets.
An excerpt. Shown here: 40 of 485 rewritten, 40 of 359 added and 40 of 161 removed. The counts are complete. For every sentence, read Item 8. Financial Statements and Supplementary Data in the FY2016 filing and the FY2015 filing.
Item 9. Changes in and Disagreements with Accountants on Accounting and Financial Disclosure
0 rewritten, 2 added, 1 removed, 0 unchanged
In April 2016, the Company dismissed Ernst & Young LLP as its independent registered public accounting firm, and appointed Deloitte & Touche LLP as its new independent registered public accounting firm.
See the Company's 8-K filed as of April 20, 2016 for full disclosures related to the change in accountants.
There were no changes in, or disagreements with, accountants reportable herein.
Item 9A. Controls and Procedures
7 rewritten, 1 added, 1 removed, 15 unchanged
Under the supervision and with the participation of our Chief Executive Officer and Chief Financial Officer, our management conducted an assessment of the effectiveness of internal control over financial reporting as of December 31, [removed: 2015] [added: 2016] based on the criteria established in the 2013 _Internal Control – Integrated Framework_, issued by the Committee of Sponsoring Organizations of the Treadway Commission (COSO).
Based on this assessment, our management has concluded that our internal control over financial reporting was effective as of December 31, [removed: 2015.][added: 2016.]
In January 2016, we implemented a new global enterprise resource planning (ERP) system for a majority of our [removed: business.][added: business, with another subsidiary of the Company implementing in October 2016.]
In connection with this ERP system implementation, we [removed: are updating] [added: have updated] our internal controls over financial reporting, as necessary, to accommodate modifications to our business processes and accounting procedures.
Our independent registered public accounting firm has issued an attestation report on our internal control over financial reporting as of December 31, [removed: 2015.][added: 2016.]
Its report appears in the consolidated financial statements included in this Annual Report on Form 10-K on page [removed: 38.][added: 40.]
[removed: There] [added: Other than the assessment of controls for the ERP system implementation and Pramac acquisition noted above, there] have been no changes in our internal control over financial reporting that occurred during the year ended December 31, [removed: 2015] [added: 2016] that have materially affected, or are reasonably likely to materially affect, our internal control over financial reporting.
In conducting this assessment, our management excluded the Pramac business, which was acquired on March 1, 2016 and whose financial statements constitute 22.5% and 11.1% of net and total assets, respectively, 12.6% of revenues, and 0.7% of net income of the total consolidated financial statement amounts as of and for the year ended December 31, 2016.
In conducting this assessment, our management excluded the CHP business because it was not acquired until the third quarter of 2015.
Item 10. Directors, Executive Officers and Corporate Governance
1 rewritten, 0 added, 0 removed, 0 unchanged
The information required by Item 10 not already provided herein under “Item 1 – Business – Executive Officers”, will be included in our [removed: 2016] [added: 2017] Proxy [removed: Statement,] [added: Statement] and is incorporated herein by reference.
Item 11. Executive Compensation
1 rewritten, 0 added, 0 removed, 0 unchanged
The information required by this item will be included in our [removed: 2016] [added: 2017] Proxy Statement and is incorporated herein by reference.
Item 12. Security Ownership of Certain Beneficial Owners and Management and Related Stockholder Matters
1 rewritten, 0 added, 0 removed, 0 unchanged
The information required by this item, including under the heading “Securities Authorized for Issuance Under Equity Compensation Plans,” will be included in our [removed: 2016] [added: 2017] Proxy Statement and is incorporated herein by reference.
Item 13. Certain Relationships and Related Transactions, and Director Independence
1 rewritten, 0 added, 0 removed, 0 unchanged
The information required by this item will be included in our [removed: 2016] [added: 2017] Proxy Statement and is incorporated herein by reference.
Item 14. Principal Accountant Fees and Services
1 rewritten, 0 added, 0 removed, 1 unchanged
The information required by this item will be included in our [removed: 2016] [added: 2017] Proxy Statement and is incorporated herein by reference.
Item 15. Exhibits and Financial Statement Schedules
61 rewritten, 58 added, 12 removed, 20 unchanged
| [removed: Report] [added: Reports] of Independent Registered Public Accounting [removed: Firm] [added: Firms] | 38 |
| Consolidated balance sheets as of December 31, [removed: 2015] [added: 2016] and [removed: 2014] [added: 2015] | [removed: 40] [added: 41] |
| Consolidated statements of comprehensive income for years ended December 31, [removed: 2015, 2014] [added: 2016, 2015] and [removed: 2013] [added: 2014] | [removed: 41] [added: 42] |
| Consolidated statements of stockholders’ equity for years ended December 31, [removed: 2015, 2014] [added: 2016, 2015] and [removed: 2013] [added: 2014] | [removed: 42] [added: 43] |
| Consolidated statements of cash flows for the years ended December 31, [removed: 2015, 2014] [added: 2016, 2015] and [removed: 2013] [added: 2014] | [removed: 43] [added: 44] |
| Notes to consolidated financial statements | [removed: 44] [added: 45] |
Dated: February [removed: 26, 2016][added: 24, 2017]
| Signature | | | [added: |] Title | | | [added: |] Date | | [added: |]
| /s/ Aaron Jagdfeld | | | Chairman, President and Chief Executive [removed: Officer] | | | [added: |] February [removed: 26, 2016] [added: 24, 2017] | | [added: | |]
| Aaron Jagdfeld | | | [added: Officer] | | | | | [added: | | |]
| /s/ York A. Ragen | | | Chief Financial Officer and | | | [added: |] February [removed: 26, 2016] [added: 24, 2017] | | [added: | |]
| York A. Ragen | | | Chief Accounting Officer | | | | | [added: | | |]
| /s/ Todd A. Adams | | | Lead Director | | | [added: |] February [removed: 26, 2016] [added: 24, 2017] | | [added: | |]
| Todd A. Adams | | | | | | | | [added: | | |]
| /s/ John D. Bowlin | | | Director | | | [added: |] February [removed: 26, 2016] [added: 24, 2017] | | [added: | |]
| John D. Bowlin | | | | | | | | [added: | | |]
| /s/ Robert D. Dixon | | | Director | | | [added: |] February [removed: 26, 2016] [added: 24, 2017] | | [added: | |]
| Robert D. Dixon | | | | | | | | [added: | | |]
| /s/ Andrew G. Lampereur | | | Director | | | [added: |] February [removed: 26, 2016] [added: 24, 2017] | | [added: | |]
| Andrew G. Lampereur | | | | | | | | [added: | | |]
| /s/ Bennett Morgan | | | Director | | | [added: |] February [removed: 26, 2016] [added: 24, 2017] | | [added: | |]
| Bennett Morgan | | | | | | | | [added: | | |]
| /s/ David A. Ramon | | | Director | | | [added: |] February [removed: 26, 2016] [added: 24, 2017] | | [added: | |]
| David A. Ramon | | | | | | | | [added: | | |]
| Exhibits Number | | [added: |] Description |
| 3.1 | | [added: |] Third Amended and Restated Certificate of Incorporation of Generac Holdings Inc. (incorporated by reference to Exhibit 3.1 of the Company’s Annual Report on Form 10-K for the fiscal year ended December 31, 2010). |
| 3.2 | | [added: |] Amended and Restated Bylaws of Generac Holdings Inc. (incorporated by reference to Exhibit 3.1 of the Company’s Current Report on Form 8-K filed with the SEC on February 16, 2016). |
| 4.1 | | [added: |] Form of Common Stock Certificate (incorporated by reference to Exhibit 4.1 of the Registration Statement on Form S-1 filed with the SEC on January 25, 2010). |
| 10.1 | | [added: |] Restatement Agreement, dated as of May 31, 2013, to that certain Credit Agreement, dated as of February 9, 2012, as amended and restated as of May 31, 2012, among Generac Power Systems, Inc., Generac Acquisition Corp., the lenders party thereto, JPMorgan Chase Bank, N.A., as Administrative Agent, and Bank of America, N.A. and Goldman Sachs Bank USA, as syndication agents (incorporated by reference to Exhibit 10.1 to the Company’s Current Report on Form 8-K filed with the SEC on June 4, 2013). |
| 10.2 | | [added: |] Guarantee and Collateral Agreement, dated as of February 9, 2012, as amended and restated as of May 30, 2012, among Generac Holdings Inc., Generac Acquisition Corp., Generac Power Systems, Inc., certain subsidiaries of Generac Power Systems, Inc. and JPMorgan Chase Bank, N.A., as Administrative Agent (incorporated by reference to Exhibit 10.2 of the Company’s Current Report on Form 8-K filed with the SEC on May 31, 2012). |
| 10.3 | | [added: |] Credit Agreement, dated as of February 9, 2012, as amended and restated as of May 30, 2012, as further amended and restated as of May 31, 2013, among Generac Power Systems, Inc., Generac Acquisition Corp., the lenders party thereto, JPMorgan Chase Bank, N.A., as Administrative Agent and Bank of America, N.A. and Goldman Sachs Bank USA, as syndication agent (incorporated by reference to Exhibit 10.2 to the Company’s Current Report on Form 8-K filed with the SEC on June 4, 2013). |
| 10.4 | | [added: |] Guarantee and Collateral Agreement, dated as of May 30, 2012, among Generac Holdings Inc., Generac Acquisition Corp., Generac Power Systems, Inc., certain subsidiaries of Generac Power Systems, Inc. and Bank of America, N.A., as Administrative Agent (incorporated by reference to Exhibit 10.4 of the Company’s Current Report on Form 8-K filed with the SEC on May 31, 2012). |
| 10.5 | | [added: |] First Amendment to Guarantee and Collateral Agreement, dated as of May 31, 2013, to that certain Guarantee and Collateral Agreement, dated as of February 9, 2012, as amended and restated as of May 30, 2012, among Generac Holdings Inc., Generac Acquisition Corp., Generac Power Systems, Inc., certain subsidiaries of Generac Power Systems, Inc. and JPMorgan Chase Bank, N.A., as Administrative Agent (incorporated by reference to Exhibit 10.3 to the Company’s Current Report on Form 8-K filed with the SEC on June 4, 2013). |
| 10.6 | | [added: |] Credit Agreement, dated as of May 30, 2012, among Generac Power Systems, Inc., its Domestic Subsidiaries listed as Borrowers on the signature pages thereto, Generac Acquisition Corp., the lenders party thereto, Bank of America, N.A. as Administrative Agent, JPMorgan Chase Bank, N.A. and Goldman Sachs Bank USA, as syndication agents, and Wells Fargo Bank, National Association, as Documentation Agent (incorporated by reference to Exhibit 10.3 of the Company’s Current Report on Form 8-K filed with the SEC on May 31, 2012). |
| 10.7 | | [added: | | |] Amendment No. 1 dated as of May 31, 2013 to the Credit Agreement, dated as of May 30, 2012, among Generac Power Systems, Inc., its Domestic Subsidiaries listed as Borrowers on the signature pages thereto, Generac Acquisition Corp., the lenders party thereto, Bank of America, N.A. as Administrative Agent, JPMorgan Chase Bank, N.A. and Goldman Sachs Bank USA, as syndication agents, and Wells Fargo Bank, National Association, as Documentation Agent (incorporated by reference to Exhibit 10.4 to the Company’s Current Report on Form 8-K filed with the SEC on June 4, 2013) |
| 10.8 | | [added: | | |] First Amendment to the Guarantee and Collateral Agreement, dated as of May 31, 2013, to that certain Guarantee and Collateral Agreement, dated as of May 30, 2012, among Generac Holdings Inc., Generac Acquisition Corp., Generac Power Systems, Inc., certain subsidiaries of Generac Power Systems, Inc. and Bank of America, N.A., as Administrative Agent (incorporated by reference to Exhibit 10.5 to the Company’s Current Report on Form 8-K filed with the SEC on June 4, 2013). |
| 10.9 | | [added: | | |] Amendment No. 2 dated as of May 29, 2015 to the Credit Agreement, dated as of May 30, 2012, as amended by Amendment No. 1, dated as of May 31, 2013, among Generac Holdings, Inc., Generac Acquisition Corp., Generac Power Systems, Inc., certain subsidiaries of Generac Power Systems, Inc. and Bank of America, N.A., as Administrative Agent and the other agents named therein (incorporated by reference to Exhibit 10.1 of the Company’s Current Report on Form 8-K filed with the SEC on June 1, 2015). |
| [removed: 10.9+] [added: 10.11+] | | [added: | | |] 2009 Executive Management Incentive Compensation Program (incorporated by reference to Exhibit 10.46 of the Registration Statement on Form S-1 filed with the SEC on December 17, 2009). |
| [removed: 10.10+] [added: 10.12+] | | [added: | | |] Generac Holdings Inc. Amended and Restated 2010 Equity Incentive Plan (incorporated by reference to Appendix A to the Definitive Proxy Statement on Schedule 14A of the Company filed with the SEC on April 27, 2012) |
| [removed: 10.11+] [added: 10.13+] | | [added: | | |] Generac Holdings Inc. Annual Performance Bonus Plan (incorporated by reference to Exhibit 10.63 of the Registration Statement on Form S-1 filed with the SEC on January 25, 2010). |
| --- | --- | --- | --- | --- | --- | --- | --- | --- | --- | --- |
| | | | | | | | | | | |
| | | | | | | | | | | |
| | | | | | | | | | | |
| | | | | | | | | | | |
| | | | | | | | | | | |
| | | | | | | | | | | |
| | | | | | | | | | | |
| | | | | | | | | | | |
| | | | | | | | | | | |
| /s/ KATHRYN ROEDEL | | | Director | | | | February 24, 2017 | | | |
| Kathryn Roedel | | | | | | | | | | |
| | | | | | | | | | | |
| /s/ DOMINICK ZARCONE | | | Director | | | | February 24, 2017 | | | |
| Dominick Zarcone | | | | | | | | | | |
| | | | |
| | | | |
| | | | |
| | | | |
| | | | |
| | | | |
| | | | |
| | | | |
| | | | |
| Exhibits Number | | | | | Description |
| --- | --- | --- | --- | --- | --- |
| | | | | | |
| | | | | | |
| | | | | | |
| | | | | | |
| 10.10 | | | | | Replacement Term Loan Amendment dated as of November 2, 2016 to the Credit Agreement, dated as of February 9, 2012, as amended and restated as of May 30, 2012, as further amended and restated as of May 31, 2013, and as amended by the First Amendment dated as of May 18, 2015, among Generac Power Systems, Inc., Generac Acquisition Corp., the lenders party thereto, JPMorgan Chase Bank, N.A., as Administrative Agent and the other agents named therein. |
| | | | | | |
| | | | | | |
| | | | | | |
| | | | | | |
| | | | | | |
| | | | | | |
| | | | | | |
| | | | | | |
| | | | | | |
| --- | --- | --- |
| | | |
| --- | --- | --- | --- | --- | --- | --- | --- |
| | | | | | | | |
| /s/ Ralph W. Castner | | | Director | | | February 26, 2016 | |
| Ralph W. Castner | | | | | | | |
| /s/ Timothy Walsh | | | Director | | | February 26, 2016 | |
| Timothy Walsh | | | | | | | |
| 2.1 | | Agreement and Plan of Merger by and among Generac Power Systems, Inc., the representative named therein, GPS CCMP Acquisition Corp., and GPS CCMP Merger Corp., dated as of September 13, 2006 (incorporated by reference to Exhibit 2.1 of the Registration Statement on Form S-1 filed with the SEC on January 11, 2010). |
| 2.2 | | Amendment to Agreement and Plan of Merger by and among Generac Power Systems, Inc., the representative named therein, GPS CCMP Acquisition Corp., and GPS CCMP Merger Corp (incorporated by reference to Exhibit 2.1 of the Registration Statement on Form S-1 filed with the SEC on January 11, 2010). |
| 10.22 | | Form of Generac Holdings Inc. Director Indemnification Agreement for Barry Goldstein, John D. Bowlin, Robert Dixon, David Ramon, Timothy W. Sullivan, Bennett Morgan, Todd A. Adams, Andrew G. Lampereur and Ralph W. Castner (incorporated by reference to Exhibit 10.51 of the Registration Statement on Form S-1 filed with the SEC on January 11, 2010). |
| 10.24 | | Form of Generac Power Systems, Inc. Director Indemnification Agreement for Stephen Murray and Timothy Walsh (incorporated by reference to Exhibit 10.53 of the Registration Statement on Form S-1 filed with the SEC on January 25, 2010). |
An excerpt. Shown here: 40 of 61 rewritten, 40 of 58 added and all 12 removed. The counts are complete. For every sentence, read Item 15. Exhibits and Financial Statement Schedules in the FY2016 filing and the FY2015 filing.