 filings.tools
Item 5. . MARKET FOR REGISTRANT’S COMMON EQUITY, RELATED STOCKHOLDER MATTERS AND ISSUER PURCHASES OF EQUITY SECURITIES.
7K characters. Original on sec.gov · Markdown
Item 5. . MARKET FOR REGISTRANT’S COMMON EQUITY, RELATED STOCKHOLDER MATTERS AND ISSUER PURCHASES OF EQUITY SECURITIES.
Market Information Regarding Common Stock
Our common stock is traded on the New York Stock Exchange under the ticker symbol “GPC.”
Dividend Information
We have paid a cash dividend to shareholders every year since going public in 1948 and increased the annual dividend for 66 consecutive years through 2022. While we have historically paid dividends to holders of our common stock on a quarterly basis and expect to continue doing so going forward, the declaration and payment of future dividends will depend on many factors, including, but not limited to, our earnings, financial condition, business development needs and regulatory considerations, and are at the discretion of our Board of Directors.
Stock Performance Graph
Set forth below is a line graph comparing the yearly dollar change in the cumulative total shareholder return on our common stock against the cumulative total shareholder return of the Standard and Poor’s ("S&P") 500 Stock Index and a peer group composite index (“Peer Index”) structured by us as set forth below for the five year period that commenced December 31, 2017 and ended December 31, 2022. This graph assumes that $100 was invested on December 31, 2017 in Genuine Parts Company common stock, the S&P 500 Stock Index (we are a member of the S&P 500 Stock Index, and our cumulative total shareholder return went into calculating the S&P 500 Stock Index results set forth in the graph) and the peer group composite index as set forth below and assumes reinvestment of all dividends.
Comparison of five year cumulative total shareholder return
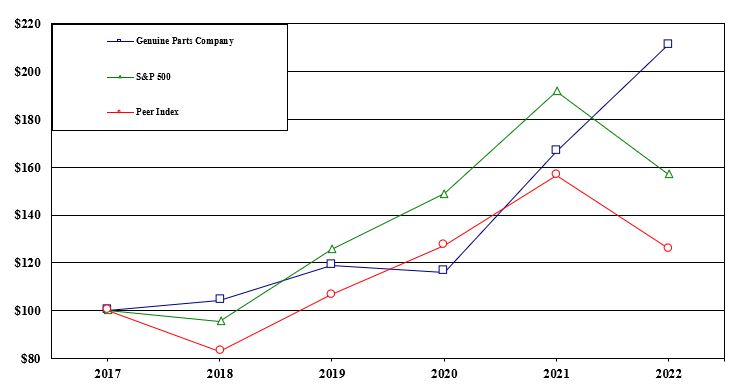
Genuine Parts Company, S&P 500 Stock Index and peer group composite index
| Cumulative Total Shareholder Return $ at Fiscal Year End | 2017 | 2018 | 2019 | 2020 | 2021 | 2022 | ||||||||||||||||||||||||||||||||
| Genuine Parts Company | $100.00 | $104.11 | $118.74 | $116.13 | $166.52 | $211.19 | ||||||||||||||||||||||||||||||||
| S&P 500 Stock Index | $100.00 | $95.62 | $125.73 | $148.87 | $191.60 | $156.90 | ||||||||||||||||||||||||||||||||
| Peer Index | $100.00 | $83.10 | $106.58 | $127.14 | $156.34 | $125.91 |
In constructing the Peer Index for use in the stock performance graph above, we used the shareholder returns of various publicly held companies (weighted in accordance with each company’s stock market capitalization at
December 31, 2017 and including reinvestment of dividends) that compete with us in our two industry segments: automotive parts and industrial parts (each group of companies included in the Peer Index as competing with us in a separate industry segment is hereinafter referred to as a “Peer Group”). Included in the automotive parts Peer Group are those companies making up the Dow Jones U.S. Auto Parts Index (we are a member of such industry group, and its individual shareholder return was included when calculating the Peer Index results set forth in the performance graph). Included in the industrial parts Peer Group are Applied Industrial Technologies, Inc., Fastenal Company, and W.W. Grainger, Inc. In determining the Peer Index, each Peer Group was weighted to reflect our annual net sales in each industry segment.
Holders
As of December 31, 2022, there were 6,892 holders of record of the company’s common stock. The number of holders of record does not include beneficial owners of the common stock whose shares are held in the names of various dealers, clearing agencies, banks, brokers and other fiduciaries.
Issuer Purchases of Equity Securities
The following table provides information about the purchases of shares of the company’s common stock during the three month period ended December 31, 2022:
| Period | Total Number of Shares Purchased(1) | Average Price Paid per Share | Total Number of Shares Purchased as Part of Publicly Announced Plans or Programs(2) | Maximum Number of Shares That May Yet be Purchased Under the Plans or Programs | ||||||||||||||||||||||
| October 1, 2022 through October 31, 2022 | 18,142 | $ | 173.00 | 124,004 | 10,458,662 | |||||||||||||||||||||
| November 1, 2022 through November 30, 2022 | 22,892 | $ | 178.92 | 109,115 | 10,349,547 | |||||||||||||||||||||
| December 1, 2022 through December 31, 2022 | 2,183 | $ | 171.00 | 56,549 | 10,292,998 | |||||||||||||||||||||
| Total | 43,217 | $ | 176.04 | 289,668 | 10,292,998 |
(1)Includes shares surrendered by employees to the company to satisfy tax withholding obligations in connection with the vesting of shares of restricted stock, the exercise of share appreciation rights and/or tax withholding obligations.
(2)On August 21, 2017, the Board of Directors announced that it had authorized the repurchase of 15 million shares. Under this program, shares may be repurchased in privately negotiated and/or open market transactions, including under plans complying with Rule 10b5-1 under the Exchange Act. The authorization for these repurchase plans continues until all such shares have been repurchased or the repurchase program is terminated by action of the Board of Directors. The program may be suspended at any time and does not have an expiration date. Approximately 10.3 million shares authorized remain available to be repurchased by the company. There were no other repurchase plans announced as of December 31, 2022.
Previous: Item 4. . MINE SAFETY DISCLOSURES. · Next: Item 6. . (RESERVED)