 filings.tools
Garmin 10-K 2018-12-29
Filed 2019-02-20. 21 sections, 402K characters. Original on sec.gov · Markdown · JSON
Cover and table of contents
10-K 1 s116041_10k.htm FORM 10K
UNITED STATES
SECURITIES AND EXCHANGE COMMISSION
Washington, D.C. 20549
FORM 10-K
| ☒ | ANNUAL REPORT PURSUANT TO SECTION 13 OR 15(d) OF THE SECURITIES EXCHANGE ACT OF 1934 |
|---|
For the fiscal year ended December 29, 2018
or
| ☐ | TRANSITION REPORT PURSUANT TO SECTION 13 OR 15(d) OF THE SECURITIES EXCHANGE ACT OF 1934 |
|---|
For the transition period from _______ to _______
Commission file number 0-31983
GARMIN LTD.
(Exact name of registrant as specified in its charter)

| Switzerland (State or other jurisdiction of incorporation or organization) | 98-0229227 (I.R.S. Employer Identification No.) |
|---|---|
| Mühlentalstrasse 2 8200 Schaffhausen Switzerland (Address of principal executive offices) | N/A (Zip Code) |
Registrant’s telephone number, including area code: +41 52 630 1600
Securities registered pursuant to Section 12(b) of the Act:
| Registered Shares, CHF 0.10 Per Share Par Value | The Nasdaq Stock Market, LLC |
|---|---|
| (Title of each class) | (Name of each exchange on which registered) |
Securities registered pursuant to Section 12(g) of the Act: None
Indicate by check mark if the registrant is a well-known seasoned issuer, as defined in Rule 405 of the Securities Act. YES ☑ NO ☐
Indicate by check mark if the registrant is not required to file reports pursuant to Section 13 or Section 15(d) of the Act. YES ☐ NO ☑
Indicate by check mark whether the registrant (1) has filed all reports required to be filed by Section 13 or 15(d) of the Securities Exchange Act of 1934 during the preceding 12 months (or for such shorter period that the registrant was required to file such reports), and (2) has been subject to such filing requirements for the past 90 days. YES ☑ NO ☐
Indicate by check mark whether the registrant has submitted electronically every Interactive Data File required to be submitted pursuant to Rule 405 of Regulations S-T (§ 232.405 of this chapter) during the preceding 12 months (or for such shorter period that the registrant was required to submit such files). YES ☑ NO ☐
Indicate by check mark if disclosure of delinquent filers pursuant to Item 405 of Regulation S-K (§ 229.405 of this chapter) is not contained herein, and will not be contained, to the best of registrant’s knowledge, in definitive proxy or information statements incorporated by reference in Part III of this Form 10-K or any amendment to this Form 10-K. ☐
Indicate by check mark whether the registrant is a large accelerated filer, an accelerated filer, a non-accelerated filer, smaller reporting company, or emerging growth company. See the definitions of “large accelerated filer”, “accelerated filer”, “smaller reporting company”, and “emerging growth company” in Rule 12b-2 of the Exchange Act.
| Large Accelerated Filer ☑ | Accelerated Filer ☐ | |
|---|---|---|
| Non-accelerated Filer ☐ | Smaller reporting company ☐ | |
| Emerging growth company ☐ |
If an emerging growth company, indicate by check mark if the registrant has elected not to use the extended transition period for complying with any new or revised financial accounting standards provided pursuant to Section 13(a) of the Exchange Act. ☐
Indicate by check mark whether the registrant is a shell company (as defined in Rule 12b-2 of the Exchange Act).
YES ☐ NO ☑
Aggregate market value of the common shares held by non-affiliates of the registrant as of June 30, 2018 (based on the closing price of the registrant’s common shares on the Nasdaq Stock Market for June 29, 2018) was $7,753,502,173.
Number of shares outstanding of the registrant’s common shares as of February 15, 2019:
Registered Shares, CHF 0.10 par value – 198,077,418 (including treasury shares)
Documents incorporated by reference:
Portions of the following document are incorporated herein by reference into Part III of the Form 10-K as indicated:
| Document | Part of Form 10-K into which Incorporated | |
|---|---|---|
| Company’s Definitive Proxy Statement for the 2019 Annual Meeting of Shareholders which will be filed no later than 120 days after December 29, 2018. | Part III |
Garmin Ltd.
2018 Form 10-K Annual Report
Table of Contents
CAUTIONARY STATEMENT WITH RESPECT TO FORWARD-LOOKING COMMENTS
The discussions set forth in this Annual Report on Form 10-K contain statements concerning potential future events. Such forward-looking statements are based upon assumptions by the Company’s management, as of the date of this Annual Report, including assumptions about risks and uncertainties faced by the Company. In addition, management may make forward-looking statements orally or in other writings, including, but not limited to, in press releases, in the annual report to shareholders and in the Company’s other filings with the Securities and Exchange Commission. Readers can identify these forward-looking statements by their use of such verbs as “expects,” “anticipates,” “believes” or similar verbs or conjugations of such verbs. Forward-looking statements include any discussion of the trends and other factors that drive our business and future results in “Item 7. Management’s Discussion and Analysis of Financial Conditions and Results of Operations.” Readers are cautioned not to place undue reliance on these forward-looking statements, which speak only as of their date. If any of management’s assumptions prove incorrect or should unanticipated circumstances arise, the Company’s actual results could materially
Showing the first 8K of 76K characters. Open the full section
Item 1A. Risk Factors
The risks described below are not the only ones facing our company. Additional risks and uncertainties not presently known to us or that we currently believe to be immaterial may also impair our business operations. If any of the following risks occur, our business, financial condition or operating results could be materially adversely affected.
Risks Related to the Company
If we are not successful in the continued development, timely manufacture, and introduction of new products or product categories, demand for our products could decrease to the extent that lost sales and profits from declining segments or product categories are not entirely offset.
We expect that a significant portion of our future revenue will continue to be derived from sales of newly introduced products. This is particularly important to replace sales and profits lost in declining segments or product categories. The market for our products is characterized by rapidly changing technology, evolving industry standards and changes in customer needs. If we fail to introduce new products, or to modify or improve our existing products, in response to changes in technology, industry standards or customer needs, our products could rapidly become less competitive or obsolete. We must continue to make significant investments in research and development in order to continue to develop new products, enhance existing products and achieve market acceptance for such products. However, there can be no assurance that development stage products will be successfully completed or, if developed, will achieve significant customer acceptance.
If we are unable to successfully develop and introduce competitive new products, and enhance our existing products, our future results of operations would be adversely affected. Our pursuit of necessary technology may require substantial time and expense. We may need to license new technologies to respond to technological change. These licenses may not be available to us on terms that we can accept or may materially change the gross profits that we are able to obtain on our products. We may not succeed in adapting our products to new technologies as they emerge. Development and manufacturing schedules for technology products are difficult to predict, and there can be no assurance that we will achieve timely initial customer shipments of new products. The timely availability of these products in volume and their acceptance by customers are important to our future success. Any future challenges related to new products, whether due to product development delays, manufacturing delays, lack of market acceptance, delays in regulatory approval, or otherwise, could have a material adverse effect on our results of operations.
If we are unable to compete effectively with existing or new competitors, our resulting loss of competitive position could result in price reductions, fewer customer orders, reduced margins and loss of market share.
The markets for many of our products are highly competitive, and we expect competition to increase in the future. Some of our competitors have significantly greater financial, technical and marketing resources than we do. These competitors may be able to respond more rapidly to new or emerging technologies or changes in customer requirements. They may also be able to devote greater resources to the development, promotion and sale of their products or secure better product positioning with retailers. Increased competition could result in price reductions, fewer customer orders, reduced margins and loss of market share. Our failure to compete successfully against current or future competitors could seriously harm our business, financial condition and results of operations.
Maturation or contraction of the market for wearable devices or categories of devices could adversely affect our revenue and profits.
We have experienced growth in sales and profits in our outdoor and fitness segments, which in recent years have benefited from increased sales of wearable devices. If the overall wearable device market declines, or categories of devices within the wearable device market decline significantly, our business, financial condition or operating results could be materially adversely affected.
Our annual and quarterly financial statements will reflect fluctuations in foreign currency translation.
The operation of our subsidiaries in international markets results in exposure to movements in currency exchange rates. We have experienced significant foreign currency gains and losses due to the strengthening and weakening of the U.S. Dollar relative to certain other currencies. The potential of volatile foreign exchange rate fluctuations in the future could have a significant effect on our results of operations. We have not historically hedged our foreign currency exchange rate risks.
The currencies that typically create a majority of our exchange rate exposure are the Taiwan Dollar, Euro, and British Pound Sterling. The Taiwan Dollar is the functional currency of Garmin Corporation, the U.S. Dollar is the functional currency of Garmin (Europe) Ltd., and the Euro is the functional currency of most of our other European subsidiaries, although some transactions and balances are denominated in British Pounds. Other legal entities primarily use the local currency as the functional currency. Due to the relative size of entities using a functional currency other than the Taiwan Dollar, Euro, and British Pound Sterling, fluctuations of other currencies are not expected to have a material impact on our financial statements.
We translate income and expense activity at the approximate rate of exchange at the transaction date, and all assets and liabilities at the rate of exchange in effect at the balance sheet date. Income and expense activity in a currency other than the U.S. Dollar can be impacted by exchange rate variations over time. The majority of our consolidated foreign currency gain or loss is typically driven by exchange rate impacts on the significant cash, receivables, and payables held in a currency other than the functional currency at a given legal entity. Such gain or loss will create variations in our earnings per share. However, because there is minimal cash impact caused by such exchange rate variations, management will continue to focus on our operating performance before the impact of foreign currency gains and losses.
Changes in applicable tax laws or resolutions of tax disputes could result in adverse tax consequences to the Company.
Our tax position could be adversely impacted by changes to tax laws, tax treaties, or tax regulations or the interpretation or enforcement thereof by any tax authority in which we file income tax returns. We cannot predict the outcome of any specific legislative proposals. Legislative proposals are being considered in Switzerland that could make significant changes in the corporate tax regime and increase the taxes applicable to us in Switzerland. Switzerland has agreed with the European Union (EU) to execute tax reform by 2019 in exchange for the EU’s waiver of counter-measures. A failure to accomplish tax reform in the agreed timeframe may result in the EU member states reasserting counter-measure provisions which could result in additional tax for the Company.
Moreover, international taxing standards continue to evolve as a result of the Organization for Economic Co-Operation and Development (OECD) recommendations aimed at preventing perceived base erosion and profit shifting by multinational corporations. While these recommendations are not changes to tax law, the countries where we operate may implement legislation or take unilateral actions which may result in adverse effects to our income tax provision and financial statements.
Significant judgment is required in determining our worldwide provision for income taxes. In the ordinary course of our business, the
Showing the first 8K of 63K characters. Open the full section
Item 1B. Unresolved Staff Comments
None.
Item 2. Properties
Garmin and its subsidiaries own a majority of their principal properties and lease certain other properties. Depending on location, the properties could be used for manufacturing, warehousing, research and development, office space, or a combination. Garmin’s principal properties are described below:
Garmin International, Inc. and Garmin USA, Inc. own and occupy facilities of approximately 1,990,000 square feet on approximately 107 acres in Olathe, Kansas, where the majority of product design and development work is conducted, the majority of aviation panel-mount products are manufactured, and products are warehoused, distributed, and supported for North, Central and South America.
Garmin International, Inc. leases 148,000 square feet of land at New Century Airport in Gardner, Kansas under a ground lease and occupies two aircraft hangars on this land, one of which is owned (47,000 square feet) and the other leased (53,000 square feet). Both properties serve as flight test and certification facilities that are used in development and certification of aviation products.
In October 2018, Garmin International, Inc. completed the construction of a new 775,000 square foot manufacturing and distribution center in Olathe, Kansas, which concluded the first phase of an expansion project that began in 2016. The second phase of the expansion will include renovation of the existing warehouse and manufacturing center into a research and development facility and supporting office space. In connection with the bond financings for the facility in Olathe and the expansions of that facility, the City of Olathe holds the legal title to the Olathe facility, which is leased to Garmin’s subsidiaries by the City. Upon the payment in full of the outstanding bonds, the City of Olathe is obligated to transfer title to Garmin’s subsidiaries for the aggregate sum of $200. Garmin International, Inc. has purchased all the outstanding bonds and expects to continue to hold the bonds until maturity in order to benefit from property tax abatement.
Garmin AT, Inc. leases approximately 18 acres of land in Salem, Oregon under a ground lease. This ground lease expires in 2030, but Garmin AT, Inc. has the option to extend the ground lease until 2050. Garmin AT, Inc. owns and occupies a 115,000 square foot facility for office, development and manufacturing use and a 33,000 square foot aircraft hangar, flight test and certification facility on this land. Garmin AT, Inc. also owns and occupies an additional 66,000 square foot facility on the same property for Garmin’s West Coast customer support call center and for research and development activities.
Garmin Corporation owns and occupies 247,000 and 185,000 square foot facilities in Xizhi Dist., New Taipei City, Taiwan, a 224,000 square foot facility in Jhongli, Tao-Yang County, Taiwan, and a 576,000 square foot facility in LinKou, Tao-Yang County, Taiwan. These facilities are used for the manufacturing and warehousing of most of Garmin’s consumer and portable aviation products, as well as some research and development activities and the marketing and support of products for Asia Pacific countries. Garmin China YangZhou Co., Ltd. also leases a 204,000 square foot manufacturing facility in Yangzhou, Jiangsu, People’s Republic of China.
Garmin (Europe) Ltd. owns and occupies a 155,000 square foot building located in Totton, Southampton, England, used as offices and a distribution facility.
Garmin also owns and leases other properties, both internationally and domestically, not described above, that are used for office space, retail, and warehousing.
Item 3. Legal Proceedings
PulseOn Oy v. Garmin (Europe) Ltd.
On November 11, 2016, PulseOn Oy filed suit in the Patents Court in London, England, against Garmin (Europe) Ltd. alleging infringement of alleged UK unregistered design rights and Registered European Community Design No. 002473769-0004 (the “0004 Design”) and Registered European Community Design No. 002473769-005 (the “0005 Design”) by certain Garmin products with wrist-worn heart rate monitors. A trial was held in November 2017. During the trial PulseOn abandoned its claim of infringement of alleged UK unregistered design rights. On January 18, 2018 the court issued a judgment holding that no accused Garmin products infringed either the 0004 Design or the 0005 Design. On February 21, 2018, PulseOn Oy filed an application with the Court of Appeal in England seeking leave to appeal the judgment of the Patent Court issued on January 18, 2018, holding that no accused Garmin products infringed either of the Registered Community Designs asserted by PulseOn Oy. Leave to appeal was granted and the hearing of PulseOn’s appeal before the Court of Appeal took place on January 30 and 31, 2019. On February 13, 2019, the Court of Appeal issued its judgment dismissing PulseOn’s appeal.
In the normal course of business, the Company and its subsidiaries are parties to various legal claims, actions, and complaints, including matters involving patent infringement, other intellectual property, product liability, customer claims and various other risks. It is not possible to predict with certainty whether or not the Company and its subsidiaries will ultimately be successful in any of these legal matters, or if not, what the impact might be. However, the Company’s management does not expect that the results in any of these legal proceedings will have a material adverse effect on the Company’s results of operations, financial position or cash flows.
The Company settled or resolved certain other matters during the fiscal year ended December 29, 2018 that did not individually or in the aggregate have a material impact on the Company’s financial condition or results of operations.
Item 4. Mine Safety Disclosure
None.
Executive Officers of the Registrant
Pursuant to General Instruction G(3) of Form 10-K and instruction 3 to paragraph (b) of Item 401 of Regulation S-K, the following list is included as an unnumbered Item in Part I of this Annual Report on Form 10-K in lieu of being included in the Company’s Definitive Proxy Statement in connection with its annual meeting of shareholders scheduled for June 7, 2019.
Dr. Min H. Kao, age 70, has served as Executive Chairman of Garmin Ltd. since January 2013 and was previously Chairman of Garmin Ltd. from August 2004 to December 2012 and Co-Chairman of Garmin Ltd. from August 2000 to August 2004. He served as Chief Executive Officer of Garmin Ltd. from August 2002 to December 2012 and previously served as Co-Chief Executive Officer from August 2000 to August 2002. Dr. Kao served as a director and officer of various subsidiaries of the Company from August 1990 until January 2013. Dr. Kao holds Ph.D. and MS degrees in Electrical Engineering from the University of Tennessee and a BS degree in Electrical Engineering from National Taiwan University.
Clifton A. Pemble, age 53, has served as a director of Garmin Ltd. since August 2004. He has served as President and Chief Executive Officer of Garmin Ltd. since January 2013. Previously, he served as President and Chief Operating Officer of Garmin Ltd. from October 2007 to December 2012, and is currently maintaining the role of principal operating officer. Previously, he was Vice President, Engineering of Garmin International, Inc. from 2005 to October 2007, Director of Engineering of Garmin International, Inc. from 2003 to 2005, and Software Engineering Manager of Garmin International, Inc. from 1995 to 2002 and a Software Engineer with Garmin International, Inc. from 1989 to 1995. Mr. Pemble has served as a director and officer of various Garmin subsidiaries since August 2003. Mr. Pemble holds BA degrees in Mathematics and Computer Science from MidAmerica Nazarene University.
Douglas G. Boessen, age 56, has served as Chief Financial Officer and Treasurer of Garmin Ltd. since July 2014. He previously served as Chief Financial Officer of EiKO Global, LLC from September 2013 to May 2014, as well as Collective Brands, Inc. from November 1997 to November 2012. Mr. Boessen has served as a director and officer of various Garmin subsidiaries since July 2014. Mr. Boessen is a certified public accountant and holds a BS degree in Business from the University of Central Missouri and is a graduate of the executive development program at Northwestern University’s Kellogg Graduate School of Management.
Andrew R. Etkind, age 63, has served as Vice President, General Counsel and Secretary of Garmin Ltd. since June 2009. He was previously General Counsel and Secretary of Garmin Ltd. from August 2000 to June 2009. He has been Vice President and General Counsel of Garmin International, Inc. since July 2007, General Counsel since February 1998, and Secretary since October 1998. Mr. Etkind has served as a director and officer of various Garmin subsidiaries since December 2001. Mr. Etkind holds BA, MA and LLM degrees from Cambridge University, England and a JD degree from the University of Michigan Law School.
All executive officers are elected by and serve at the discretion of the Company’s Board of Directors. None of the executive officers have an employment agreement with the Company. There are no arrangements or understandings between the executive officers and any other person pursuant to which he or she was or is to be selected as an officer. There is no family relationship among any of the executive officers. Dr. Min H. Kao is the brother of Ruey-Jeng Kao, who is a supervisor of Garmin Corporation, Garmin’s Taiwan subsidiary, who serves as an ex-officio member of Garmin Corporation’s Board of Directors.
PART II
Item 5. Market for the Company’s Common Shares, Related Shareholder Matters and Issuer Purchases of Equity Securities
Garmin’s shares have traded on The Nasdaq Stock Market, LLC under the symbol “GRMN” since its initial public offering on December 8, 2000 (the “IPO”). As of February 15, 2019, there were 180 shareholders of record.
The Board of Directors approved a share repurchase program on February 13, 2015, authorizing the Company to repurchase up to $300 million of the Company’s shares as market and business conditions warrant. The share repurchase authorization expired on December 31, 2017. The Company made no repurchases of shares during the year ended December 29, 2018. See Note 11 for additional information regarding the share repurchase plan.
We refer you to Item 12 of this report under the caption “Equity Compensation Plan Information” for certain equity plan information required to be disclosed by Item 201(d) of Regulation S-K.
Stock Performance Graph
This performance graph shall not be deemed ’‘filed’’ with the SEC or subject to Section 18 of the Securities Exchange Act of 1934, nor shall it be deemed incorporated by reference in any of our filings under the Securities Act of 1933, as amended.
The graph below matches Garmin Ltd.’s cumulative 5-Year total shareholder return on common stock with the cumulative total returns of the Nasdaq Composite index and the Nasdaq 100 index. The graph tracks the performance of a $100 investment in our common stock and in each index (with the reinvestment of all dividends) from 12/31/2013 to 12/31/2018.
| COMPARISON OF 5 YEAR CUMULATIVE TOTAL RETURN* Among Garmin Ltd., the NASDAQ Composite Index and the NASDAQ 100 Index | ||
|---|---|---|
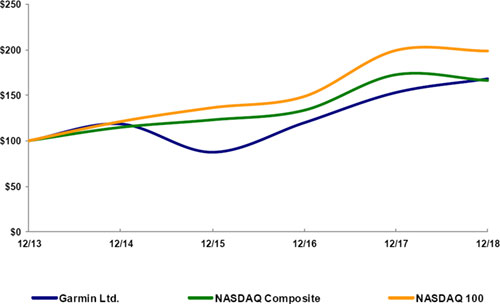 | ||
| *$100 invested on 12/31/13 in stock or index, including reinvestment of dividends. | ||
| Fiscal year ending December 31. |
| 12/13 | 12/14 | 12/15 | 12/16 | 12/17 | 12/18 | |||||||||||||||||||
|---|---|---|---|---|---|---|---|---|---|---|---|---|---|---|---|---|---|---|---|---|---|---|---|---|
| Garmin Ltd. | 100.00 | 118.40 | 87.53 | 119.57 | 152.55 | 167.55 | ||||||||||||||||||
| NASDAQ Composite | 100.00 | 114.62 | 122.81 | 133.19 | 172.11 | 165.84 | ||||||||||||||||||
| NASDAQ 100 | 100.00 | 120.99 | 136.23 | 148.44 | 198.95 | 198.30 |
The stock price performance included in this graph is not necessarily indicative of future stock price performance.
Item 6. Selected Financial Data
The following table sets forth selected consolidated financial data of the Company. The selected consolidated balance sheet data as of December 29, 2018 and December 30, 2017 and the selected consolidated statement of income data for the years ended December 29, 2018, December 30, 2017, and December 31, 2016 were derived from the Company’s audited consolidated financial statements and the related notes thereto which are included in Item 8 of this annual report on Form 10-K. The selected consolidated balance sheet data as of December 31, 2016, December 26, 2015, and December 27, 2014 and the selected consolidated statement of income data for the years ended December 26, 2015 and December 27, 2014 were derived from the Company’s audited consolidated financial statements, not included herein.
The information set forth below is not necessarily indicative of the results of future operations and should be read together with “Management’s Discussion and Analysis of Financial Condition and Results of Operations” and the consolidated financial statements and notes to those statements included in Items 7 and 8 in Part II of this Form 10-K.
The Company adopted the new accounting standard for revenue recognition, as discussed in Note 2 – Summary of Significant Accounting Policies of the Notes to Consolidated Financial Statements, effective beginning with the Company’s first quarter of 2018. Adoption of the new revenue recognition standard was applied using the full retrospective method, and information for prior periods within Items 6 and 7 in Part II of this Form 10-K have been restated accordingly.
In the table presented below, the consolidated statements of income and balance sheet data for the years ended December 30, 2017 and December 31, 2016 and the balance sheet data for the year ended December 26, 2015 have been restated in accordance with the Company’s adoption of the new revenue recognition standard.
| Years ended (1) | ||||||||||||||||||||
|---|---|---|---|---|---|---|---|---|---|---|---|---|---|---|---|---|---|---|---|---|
| Dec. 29, 2018 | Dec. 30, 2017 | Dec. 31, 2016 | Dec. 26, 2015 | Dec. 27, 2014 | ||||||||||||||||
| (in thousands, except per share data) | ||||||||||||||||||||
| Consolidated Statements of Income Data: | ||||||||||||||||||||
| Net sales | $ | 3,347,444 | $ | 3,121,560 | $ | 3,045,797 | $ | 2,820,270 | $ | 2,870,658 | ||||||||||
| Cost of goods sold | 1,367,725 | 1,323,619 | 1,357,272 | 1,281,566 | 1,266,246 | |||||||||||||||
| Gross profit | 1,979,719 | 1,797,941 | 1,688,525 | 1,538,704 | 1,604,412 | |||||||||||||||
| Operating expenses: | ||||||||||||||||||||
| Advertising expense | 155,394 | 164,693 | 177,143 | 167,166 | 146,633 | |||||||||||||||
| Selling, general and administrative | 478,177 | 437,977 | 410,558 | 394,914 | 372,032 | |||||||||||||||
| Research and development | 567,805 | 511,634 | 467,960 | 427,043 | 395,121 | |||||||||||||||
| Total operating expenses | 1,201,376 | 1,114,304 | 1,055,661 | 989,123 | 913,786 | |||||||||||||||
| Operating income | 778,343 | 683,637 | 632,864 | 549,581 | 690,626 | |||||||||||||||
| Other income, net (2)(3) | 44,904 | 13,434 | 5,761 | 17,606 | 33,119 | |||||||||||||||
| Income before income taxes | 823,247 | 697,071 | 638,625 | 567,187 | 723,745 | |||||||||||||||
| Income tax provision (benefit) (4) | 129,167 | (11,936 | ) | 120,901 | 110,960 | 359,534 | ||||||||||||||
| Net income | $ | 694,080 | $ | 709,007 | $ | 517,724 | $ | 456,227 | $ | 364,211 | ||||||||||
| Net income per share: | ||||||||||||||||||||
| Basic | $ | 3.68 | $ | 3.77 | $ | 2.74 | $ | 2.39 | $ | 1.89 | ||||||||||
| Diluted | $ | 3.66 | $ | 3.76 | $ | 2.73 | $ | 2.39 | $ | 1.88 | ||||||||||
| Weighted average common shares outstanding: | ||||||||||||||||||||
| Basic | 188,635 | 187,828 | 188,818 | 190,631 | 193,106 | |||||||||||||||
| Diluted | 189,734 | 188,732 | 189,343 | 191,107 | 194,165 | |||||||||||||||
| Dividends declared per share | $ | 2.12 | $ | 2.04 | $ | 2.04 | $ | 2.04 | $ | 1.92 | ||||||||||
| Balance Sheet Data (at end of Period): | ||||||||||||||||||||
| Cash and cash equivalents | $ | 1,201,732 | $ | 891,488 | $ | 846,883 | $ | 833,070 | $ | 1,196,268 | ||||||||||
| Marketable securities | 1,513,112 | 1,421,720 | 1,480,237 | 1,558,548 | 1,575,333 | |||||||||||||||
| Total assets | 5,382,858 | 4,948,289 | 4,484,549 | 4,478,529 | 4,693,303 | |||||||||||||||
| Total debt | — | — | — | — | — | |||||||||||||||
| Total stockholders’ equity | 4,162,974 | 3,852,419 | 3,453,259 | 3,373,734 | 3,403,367 |
| (1) | Our fiscal year-end is the last Saturday of the calendar year and does not always fall on December 31. All years presented contain 52 weeks excluding Fiscal 2016 which includes 53 weeks. |
|---|
| (2) | Other income, net mainly consists of gain (loss) on sale of marketable securities, interest income, and foreign currency gain (loss). |
|---|
| (3) | Includes $7.6 million, $22.6 million, $31.7 million, $23.5 million, and $4.3 million of foreign currency losses in 2018, 2017, 2016, 2015, and 2014, respectively. |
|---|
| (4) | 2017 – includes $180.0 million income tax benefit primarily related to the revaluation of certain Switzerland deferred tax assets resulting from the Company’s election to align Switzerland corproate tax positions with international tax initiatives, partially offset by $22.6 million of income tax expense due to the expiration of certain share-based awards; |
|---|
2014 – includes $307.6 million income tax expense associated with our inter-company restructuring partially offset by $72.9 million income tax reserve release due to expiration of certain statutes of limitations or completion of tax audits
Item 7. Management’s Discussion and Analysis of Financial Condition and Results of Operations
The following discussion and analysis of our financial condition and results of operations focuses on and is intended to clarify the results of our operations, certain changes in our financial position, liquidity, capital structure and business developments for the periods covered by the consolidated financial statements included in this Form 10-K. This discussion should be read in conjunction with, and is qualified by reference to, the other related information including, but not limited to, the audited consolidated financial statements (including the notes thereto), the description of our business, all as set forth in this Form 10-K, as well as the risk factors discussed above in Item 1A.
As previously noted, the discussion set forth below, as well as other portions of this Form 10-K, contain statements concerning potential future events. Readers can identify these forward-looking statements by their use of such verbs as “expects,” “anticipates,” “believes” or similar verbs or conjugations of such verbs. If any of our assumptions on which the statements are based prove incorrect or should unanticipated circumstances arise, our actual results could materially differ from those anticipated by such forward-looking statements. The differences could be caused by a number of factors or combination of factors including, but not limited to, those discussed above in Item 1A. Readers are strongly encouraged to consider those factors when evaluating any such forward-looking statement. Except as may be required by law, we do not undertake to update any forward-looking statements in this Form 10-K.
Garmin’s fiscal year is a 52-53 week period ending on the last Saturday of the calendar year. Fiscal years 2018 and 2017 contained 52 weeks compared to 53 weeks for 2016. Unless otherwise stated, all years and dates refer to the Company’s fiscal year and fiscal periods. Unless the context otherwise requires, references in this document to “we,” “us,” “our” and similar terms refer to Garmin Ltd. and its subsidiaries.
Unless otherwise indicated, dollar amounts set forth in the tables are in thousands, except per share data.
Overview
We are a leading worldwide provider of navigation, communications and information devices, most of which are enabled by Global Positioning System, or GPS, technology. We operate in five business segments, which serve the marine, outdoor, fitness, auto, and aviation markets. Our segments offer products through our network of subsidiary distributors and independent dealers and distributors. However, the nature of products and types of customers for the five segments can vary significantly. As such, the segments are managed separately.
Since our first products were delivered in 1991, we have generated positive income from operations each year and have funded our growth from these profits.
Critical Accounting Policies and Estimates
General
Garmin’s discussion and analysis of its financial condition and results of operations are based upon Garmin’s consolidated financial statements, which have been prepared in accordance with accounting principles generally accepted in the United States. The presentation of these financial statements requires Garmin to make estimates and judgments that affect the reported amounts of assets, liabilities, revenues and expenses, and related disclosure of contingent assets and liabilities. On an on-going basis, Garmin evaluates its estimates, including those related to customer sales programs and incentives, product returns, bad debts, inventories, investments, intangible assets, income taxes, warranty obligations, and contingencies and litigation. Garmin bases its estimates on historical experience and on various other assumptions that are believed to be reasonable under the circumstances, the results of which form the basis for making judgments about the carrying value of assets and liabilities that are not readily apparent from other sources. Actual results may differ from these estimates under different assumptions or conditions.
For information on each of the following critical accounting policies and/or estimates, refer to the discussion in the Notes to the Consolidated Financial Statements as indicated in the table below:
| Intangible Assets | Note 2 - Summary of Significant Accounting Policies |
|---|---|
| Revenue Recognition | Note 2 - Summary of Significant Accounting Policies & Note 13 - Revenue |
| Product Warranty | Note 2 - Summary of Significant Accounting Policies |
| Legal and Other Contingencies | Note 2 - Summary of Significant Accounting Policies & Note 4 - Commitments and Contingencies |
| Income Taxes | Note 2 - Summary of Significant Accounting Policies & Note 6 - Income Taxes |
Accounting Terms and Characteristics
Net Sales
Our net sales are primarily generated through sales to our retail partners, dealer and distributor network and to original equipment manufacturers. Refer to the Revenue Recognition discussion in Note 2 to the Consolidated Financial Statements. We aim to achieve a quick turnaround on orders we receive, and we typically ship most orders within 72 hours. Therefore, we believe that backlog information is not material to the understanding of our business.
Net sales are subject to seasonal fluctuation. Typically, sales of our consumer products are highest in the fourth quarter, due to increased demand during the holiday buying season, and in the second quarter, due to increased demand during the spring and summer season. Our aviation and auto OEM products do not experience much seasonal variation, but are more influenced by the timing of aircraft certifications and the release of new products when the initial demand is typically the strongest.
Cost of Sales/Gross Profit
Raw material costs are our most significant component of cost of goods sold. Our existing practice of performing the design and manufacture of our products in-house has enabled us to source components from different suppliers and, where possible, to redesign our products to leverage lower cost components. We believe that our flexible production model allows our Xizhi, Jhongli, and LinKou manufacturing plants in Taiwan; Yangzhou manufacturing plant in China; and our Olathe, Kansas, and Salem, Oregon manufacturing plants in the U.S. to experience relatively low costs of manufacturing. In general, products manufactured in Taiwan have been our highest volume products. Our manufacturing labor costs historically have been lower in Taiwan and China than in Olathe and Salem.
Sales price variability has had and can be expected to have an effect on our gross profit. Our gross profit is dependent on segment mix, and to a lesser extent, product mix within each segment.
Advertising Expense
Our advertising expenses consist of costs for media advertising, cooperative advertising with our retail partners, point of sale displays, and sponsorships.
Selling, General and Administrative Expenses
Our selling, general and administrative expenses consist primarily of:
| ● | salaries for sales, marketing and product support personnel; |
|---|
| ● | salaries and related costs for executives and administrative personnel; |
|---|
| ● | marketing, and other brand building costs; |
|---|
| ● | accounting and legal costs; |
|---|
| ● | information systems and infrastructure costs; |
|---|
| ● | travel and related costs; and |
|---|
| ● | occupancy and other overhead costs. |
|---|
Research and Development
The majority of our research and development costs represent salaries for our engineers and costs of test equipment and components used in product and prototype development.
We are committed to increasing the level of innovative design and development of new products as we strive for expanded ability to serve our existing consumer and aviation markets as well as new markets for active lifestyle products.
Income Taxes
We have experienced a relatively low effective corporate tax rate due to the proportion of our revenue generated by entities in tax jurisdictions with low statutory rates. In particular, the profit entitlement afforded our Swiss-based companies based on their intellectual property rights ownership of our consumer products have contributed to our relatively low effective corporate tax rate.
Results of Operations
The following table sets forth our results of operations as a percentage of net sales during the periods shown (the table may not foot due to rounding):
| 52-Weeks Ended | 52-Weeks Ended | 53-Weeks Ended | ||||||||||
|---|---|---|---|---|---|---|---|---|---|---|---|---|
| December 29, | December 30, | December 31, | ||||||||||
| 2018 | 2017 | 2016 | ||||||||||
| Net sales | 100 | % | 100 | % | 100 | % | ||||||
| Cost of goods sold | 41 | % | 42 | % | 45 | % | ||||||
| Gross profit | 59 | % | 58 | % | 55 | % | ||||||
| Operating expenses: | ||||||||||||
| Advertising | 5 | % | 5 | % | 6 | % | ||||||
| Selling, general and administrative | 14 | % | 14 | % | 13 | % | ||||||
| Research and development | 17 | % | 16 | % | 15 | % | ||||||
| Total operating expenses | 36 | % | 36 | % | 35 | % | ||||||
| Operating income | 23 | % | 22 | % | 21 | % | ||||||
| Other income, net | 1 | % | 0 | % | 0 | % | ||||||
| Income before income taxes | 25 | % | 22 | % | 21 | % | ||||||
| Provision (benefit) for income taxes | 4 | % | (0 | %) | 4 | % | ||||||
| Net income | 21 | % | 23 | % | 17 | % |
The following table sets forth our results of operations through operating income for each of our five segments during the period shown. The Company’s CODM uses operating income as the measure of profit or loss to assess segment performance and allocate resources. Operating income represents net sales less costs of goods sold and operating expenses. Net sales are directly attributed to each segment. Most costs of goods sold and the majority of operating expenses are also directly attributed to each segment, while certain other costs of goods sold and operating expenses are allocated to the segments in a manner appropriate to the specific facts and circumstances of the expenses being allocated. For each line item in the table, the total of the segments’ amounts equals the amount in the consolidated statements of income data included in Item 6.
| 52-weeks ended December 29, 2018 | Outdoor | Fitness | Marine | Auto | Aviation | |||||||||||||||
|---|---|---|---|---|---|---|---|---|---|---|---|---|---|---|---|---|---|---|---|---|
| Net sales | $ | 809,883 | $ | 858,329 | $ | 441,560 | $ | 634,213 | $ | 603,459 | ||||||||||
| Cost of goods sold | 281,629 | 386,565 | 182,804 | 363,420 | 153,307 | |||||||||||||||
| Gross profit | 528,254 | 471,764 | 258,756 | 270,793 | 450,152 | |||||||||||||||
| Advertising expense | 46,041 | 64,707 | 18,284 | 19,155 | 7,207 | |||||||||||||||
| Selling, general and administrative expenses | 120,588 | 135,096 | 97,682 | 88,672 | 36,139 | |||||||||||||||
| Research and development expense | 71,115 | 90,216 | 79,446 | 124,968 | 202,060 | |||||||||||||||
| Total operating expenses | 237,744 | 290,019 | 195,412 | 232,795 | 245,406 | |||||||||||||||
| Operating income | $ | 290,510 | $ | 181,745 | $ | 63,344 | $ | 37,998 | $ | 204,746 | ||||||||||
| 52-weeks ended December 30, 2017 | Outdoor | Fitness | Marine | Auto | Aviation | |||||||||||||||
| Net sales | $ | 698,867 | $ | 762,194 | $ | 374,001 | $ | 785,139 | $ | 501,359 | ||||||||||
| Cost of goods sold | 250,457 | 339,558 | 161,409 | 442,441 | 129,754 | |||||||||||||||
| Gross profit | 448,410 | 422,636 | 212,592 | 342,698 | 371,605 | |||||||||||||||
| Advertising expense | 41,113 | 75,660 | 16,101 | 25,639 | 6,180 | |||||||||||||||
| Selling, general and administrative expenses | 98,914 | 119,537 | 83,765 | 107,995 | 27,766 | |||||||||||||||
| Research and development expense | 58,516 | 80,674 | 62,398 | 126,320 | 183,726 | |||||||||||||||
| Total operating expenses | 198,543 | 275,871 | 162,264 | 259,954 | 217,672 | |||||||||||||||
| Operating income | $ | 249,867 | $ | 146,765 | $ | 50,328 | $ | 82,744 | $ | 153,933 | ||||||||||
| 53-weeks ended December 31, 2016 | Outdoor | Fitness | Marine | Auto | Aviation | |||||||||||||||
| Net sales | $ | 546,326 | $ | 818,486 | $ | 331,947 | $ | 909,690 | $ | 439,348 | ||||||||||
| Cost of goods sold | 205,822 | 381,281 | 148,238 | 511,988 | 109,943 | |||||||||||||||
| Gross profit | 340,504 | 437,205 | 183,709 | 397,702 | 329,405 | |||||||||||||||
| Advertising expense | 31,005 | 90,871 | 15,516 | 33,122 | 6,629 | |||||||||||||||
| Selling, general and administrative expenses | 77,016 | 118,753 | 60,061 | 127,618 | 27,110 | |||||||||||||||
| Research and development expense | 48,448 | 66,985 | 55,965 | 125,660 | 170,902 | |||||||||||||||
| Total operating expenses | 156,469 | 276,609 | 131,542 | 286,400 | 204,641 | |||||||||||||||
| Operating income | $ | 184,035 | $ | 160,596 | $ | 52,167 | $ | 111,302 | $ | 124,764 |
Comparison of 52-Weeks Ended December 29, 2018 and December 30, 2017
Net Sales
| 52-Weeks ended December 29, 2018 | 52-Weeks ended December 30, 2017 | Year over Year | |||||||||||||||||||||
|---|---|---|---|---|---|---|---|---|---|---|---|---|---|---|---|---|---|---|---|---|---|---|---|
| Net Sales | % of Revenue | Net Sales | % of Revenue | $ Change | % Change | ||||||||||||||||||
| Outdoor | $ | 809,883 | 24 | % | $ | 698,867 | 22 | % | $ | 111,016 | 16 | % | |||||||||||
| Fitness | 858,329 | 26 | % | 762,194 | 25 | % | 96,135 | 13 | % | ||||||||||||||
| Marine | 441,560 | 13 | % | 374,001 | 12 | % | 67,559 | 18 | % | ||||||||||||||
| Auto | 634,213 | 19 | % | 785,139 | 25 | % | (150,926 | ) | (19 | %) | |||||||||||||
| Aviation | 603,459 | 18 | % | 501,359 | 16 | % | 102,100 | 20 | % | ||||||||||||||
| Total | $ | 3,347,444 | 100 | % | $ | 3,121,560 | 100 | % | $ | 225,884 | 7 | % |
Net sales increased 7% in 2018 when compared to the year-ago period. All segments had an increase in revenue except for auto. Fitness revenue represented the largest portion of our revenue mix in 2018 at 26%, and auto revenue represented the largest portion of our revenue mix in 2017 at 25%.
Total unit sales decreased 3% to 14.9 million units in 2018 from 15.4 million units in 2017.
Outdoor, fitness, marine, and aviation revenues increased 16%, 13%, 18%, and 20%, respectively when compared to the year-ago period. The outdoor and fitness segment revenue increases were primarily driven by growth in wearables. Marine segment revenue increases were driven by sales growth across most product lines and sales from recent acquisitions. Aviation segment revenue increases were driven by sales growth across most product lines in both OEM and aftermarket categories. Auto segment revenue decreased 19% from the year-ago period, primarily due to the ongoing PND market contraction and lower year-over-year OEM sales driven by the timing of OEM programs.
Cost of Goods Sold
| 52-Weeks ended December 29, 2018 | 52-Weeks ended December 30, 2017 | Year over Year | |||||||||||||||||||||
|---|---|---|---|---|---|---|---|---|---|---|---|---|---|---|---|---|---|---|---|---|---|---|---|
| Cost of Goods | % of Revenue | Cost of Goods | % of Revenue | $ Change | % Change | ||||||||||||||||||
| Outdoor | $ | 281,629 | 35 | % | $ | 250,457 | 36 | % | $ | 31,172 | 12 | % | |||||||||||
| Fitness | 386,565 | 45 | % | 339,558 | 45 | % | 47,007 | 14 | % | ||||||||||||||
| Marine | 182,804 | 41 | % | 161,409 | 43 | % | 21,395 | 13 | % | ||||||||||||||
| Auto | 363,420 | 57 | % | 442,441 | 56 | % | (79,021 | ) | (18 | %) | |||||||||||||
| Aviation | 153,307 | 25 | % | 129,754 | 26 | % | 23,553 | 18 | % | ||||||||||||||
| Total | $ | 1,367,725 | 41 | % | $ | 1,323,619 | 42 | % | $ | 44,106 | 3 | % |
Cost of goods sold increased 3% in absolute dollars for fiscal year 2018 when compared to fiscal year 2017. The increase in revenue outpaced the increase in cost of goods sold, which resulted in a 150 basis point decrease in cost of goods sold as a percent of revenue compared to the prior fiscal year.
The marine segment decrease in cost of goods sold, as a percent of revenue, primarily resulted from the favorable impact of higher margin cartography sales on product mix. The outdoor segment decrease in cost of goods sold, as a percent of revenue, was primarily due to shifts in product mix. In the fitness and aviation segments, cost of goods sold as a percent of revenue was relatively flat compared to the prior year. The auto segment cost of goods decline was largely consistent with the segment revenue decline.
Gross Profit
| 52-Weeks ended December 29, 2018 | 52-Weeks ended December 30, 2017 | Year over Year | |||||||||||||||||||||
|---|---|---|---|---|---|---|---|---|---|---|---|---|---|---|---|---|---|---|---|---|---|---|---|
| Gross Profit | % of Revenue | Gross Profit | % of Revenue | $ Change | % Change | ||||||||||||||||||
| Outdoor | $ | 528,254 | 65 | % | $ | 448,410 | 64 | % | $ | 79,844 | 18 | % | |||||||||||
| Fitness | 471,764 | 55 | % | 422,636 | 55 | % | 49,128 | 12 | % | ||||||||||||||
| Marine | 258,756 | 59 | % | 212,592 | 57 | % | 46,164 | 22 | % | ||||||||||||||
| Auto | 270,793 | 43 | % | 342,698 | 44 | % | (71,905 | ) | (21 | %) | |||||||||||||
| Aviation | 450,152 | 75 | % | 371,605 | 74 | % | 78,547 | 21 | % | ||||||||||||||
| Total | $ | 1,979,719 | 59 | % | $ | 1,797,941 | 58 | % | $ | 181,778 | 10 | % |
Gross profit dollars in 2018 increased 10% while gross margin increased 150 basis points when compared to the prior year. Gross margin increased in the outdoor and marine segments as a result of the reasons discussed above. Gross margins remained relatively flat as a percent of revenue in the fitness, auto, and aviation segments.
Advertising Expenses
| 52-Weeks ended December 29, 2018 | 52-Weeks ended December 30, 2017 | ||||||||||||||||||||||
|---|---|---|---|---|---|---|---|---|---|---|---|---|---|---|---|---|---|---|---|---|---|---|---|
| Advertising | Advertising | Year over Year | |||||||||||||||||||||
| Expense | % of Revenue | Expense | % of Revenue | $ Change | % Change | ||||||||||||||||||
| Outdoor | $ | 46,041 | 6 | % | $ | 41,113 | 6 | % | $ | 4,928 | 12 | % | |||||||||||
| Fitness | 64,707 | 8 | % | 75,660 | 10 | % | (10,953 | ) | (14 | %) | |||||||||||||
| Marine | 18,284 | 4 | % | 16,101 | 4 | % | 2,183 | 14 | % | ||||||||||||||
| Auto | 19,155 | 3 | % | 25,639 | 3 | % | (6,484 | ) | (25 | %) | |||||||||||||
| Aviation | 7,207 | 1 | % | 6,180 | 1 | % | 1,027 | 17 | % | ||||||||||||||
| Total | $ | 155,394 | 5 | % | $ | 164,693 | 5 | % | $ | (9,299 | ) | (6 | %) |
Advertising expense decreased 6% in absolute dollars and was relatively flat as a percent of revenue in fiscal year 2018 compared to fiscal year 2017. The overall decrease in absolute dollars was primarily attributable to decreased media advertising in the fitness segment and decreased media and cooperative advertising in the auto segment, partially offset by increased media advertising in the outdoor segment and increased media and cooperative advertising in the marine segment.
Selling, General and Administrative Expenses
| 52-Weeks ended December 29, 2018 | 52-Weeks ended December 30, 2017 | ||||||||||||||||||||||
|---|---|---|---|---|---|---|---|---|---|---|---|---|---|---|---|---|---|---|---|---|---|---|---|
| Selling, General & | Selling, General & | Year over Year | |||||||||||||||||||||
| Admin. Expenses | % of Revenue | Admin. Expenses | % of Revenue | $ Change | % Change | ||||||||||||||||||
| Outdoor | $ | 120,588 | 15 | % | $ | 98,914 | 14 | % | $ | 21,674 | 22 | % | |||||||||||
| Fitness | 135,096 | 16 | % | 119,537 | 16 | % | 15,559 | 13 | % | ||||||||||||||
| Marine | 97,682 | 22 | % | 83,765 | 22 | % | 13,917 | 17 | % | ||||||||||||||
| Auto | 88,672 | 14 | % | 107,995 | 14 | % | (19,323 | ) | (18 | %) | |||||||||||||
| Aviation | 36,139 | 6 | % | 27,766 | 6 | % | 8,373 | 30 | % | ||||||||||||||
| Total | $ | 478,177 | 14 | % | $ | 437,977 | 14 | % | $ | 40,200 | 9 | % |
Selling, general and administrative expense increased 9% in absolute dollars and was relatively flat as a percent of revenue when compared to the year-ago period. The absolute dollar increase was primarily attributable to expenses from recent acquisitions and personnel costs, partially offset by a reduction in litigation settlement costs in the marine segment. All segments were relatively flat as a percent of revenue.
Research and Development Expense
| 52-Weeks ended December 29, 2018 | 52-Weeks ended December 30, 2017 | ||||||||||||||||||||||
|---|---|---|---|---|---|---|---|---|---|---|---|---|---|---|---|---|---|---|---|---|---|---|---|
| Research & | Research & | Year over Year | |||||||||||||||||||||
| Development | % of Revenue | Development | % of Revenue | $ Change | % Change | ||||||||||||||||||
| Outdoor | $ | 71,115 | 9 | % | $ | 58,516 | 8 | % | $ | 12,599 | 22 | % | |||||||||||
| Fitness | 90,216 | 11 | % | 80,674 | 11 | % | 9,542 | 12 | % | ||||||||||||||
| Marine | 79,446 | 18 | % | 62,398 | 17 | % | 17,048 | 27 | % | ||||||||||||||
| Auto | 124,968 | 20 | % | 126,320 | 16 | % | (1,352 | ) | (1 | %) | |||||||||||||
| Aviation | 202,060 | 33 | % | 183,726 | 37 | % | 18,334 | 10 | % | ||||||||||||||
| Total | $ | 567,805 | 17 | % | $ | 511,634 | 16 | % | $ | 56,171 | 11 | % |
Research and development expense increased 11% in absolute dollars when compared to the year-ago period and was relatively flat as a percent of revenue. The absolute dollar increase was primarily due to engineering personnel costs related to wearable and aviation product offerings and expenses resulting from recent acquisitions within the marine segment. Our research and development spending is focused on product development, improving existing software capabilities, and exploring new categories.
Operating Income
| 52-Weeks ended December 29, 2018 | 52-Weeks ended December 30, 2017 | Year over Year | |||||||||||||||||||||
|---|---|---|---|---|---|---|---|---|---|---|---|---|---|---|---|---|---|---|---|---|---|---|---|
| Operating Income | % of Revenue | Operating Income | % of Revenue | $ Change | % Change | ||||||||||||||||||
| Outdoor | $ | 290,510 | 36 | % | $ | 249,867 | 36 | % | $ | 40,643 | 16 | % | |||||||||||
| Fitness | 181,745 | 21 | % | 146,765 | 19 | % | 34,980 | 24 | % | ||||||||||||||
| Marine | 63,344 | 14 | % | 50,328 | 13 | % | 13,016 | 26 | % | ||||||||||||||
| Auto | 37,998 | 6 | % | 82,744 | 11 | % | (44,746 | ) | (54 | %) | |||||||||||||
| Aviation | 204,746 | 34 | % | 153,933 | 31 | % | 50,813 | 33 | % | ||||||||||||||
| Total | $ | 778,343 | 23 | % | $ | 683,637 | 22 | % | $ | 94,706 | 14 | % |
Operating income increased 14% in absolute dollars and increased 140 basis points as a percent of revenue when compared to fiscal year 2017. The growth in operating income on an absolute dollar basis and as a percent of revenue was the result of strong revenue growth and increased gross margins.
Other Income (Expense)
| 52-Weeks ended | 52-Weeks ended | |||||||
|---|---|---|---|---|---|---|---|---|
| December 29, 2018 | December 30, 2017 | |||||||
| Interest income | $ | 47,147 | $ | 36,925 | ||||
| Foreign currency (losses) | (7,616 | ) | (22,579 | ) | ||||
| Other | 5,373 | (912 | ) | |||||
| Total | $ | 44,904 | $ | 13,434 |
The average returns on cash and investments, including interest and capital gain/loss returns, during the 52-weeks ended December 29, 2018 and December 30, 2017 were 1.8% and 1.5%, respectively. Interest income increased primarily due to higher yields on fixed-income securities.
Foreign currency gains and losses for the Company are typically driven by movements in the Taiwan Dollar, Euro, and British Pound Sterling in relation to the U.S. Dollar. The Taiwan Dollar is the functional currency of Garmin Corporation, the U.S. Dollar is the functional currency of Garmin (Europe) Ltd., and the Euro is the functional currency of most of our other European subsidiaries, although some transactions and balances are denominated in British Pounds. The majority of the Company’s consolidated foreign currency gain or loss is typically driven by the significant cash and marketable securities, receivables, and payables held in a currency other than the functional currency at a given legal entity. Due to the relative size of the entities using a functional currency other than the Taiwan Dollar, Euro, and British Pound Sterling, currency fluctuations related to these entities are not expected to have a material impact on the Company’s financial statements.
The $7.6 million currency loss recognized in fiscal 2018 was primarily due to the strengthening of the U.S. Dollar against the Euro and the British Pound Sterling, offset by the U.S. Dollar strengthening against the Taiwan Dollar. During fiscal 2018, the U.S. Dollar strengthened 4.7% against the Euro and 6.0% against the British Pound Sterling, resulting in losses of $10.0 million and $1.7 million, respectively, while the U.S. Dollar strengthened 3.0% against the Taiwan Dollar, resulting in a gain of $15.1 million. The remaining net currency loss of $11.0 million was related to timing of transactions and impacts of other currencies, each of which was individually immaterial.
The $22.6 million currency loss recognized in fiscal 2017 was primarily due to the weakening of the U.S. Dollar against the Taiwan Dollar, partially offset by the U.S. Dollar weakening against the Euro and the British Pound Sterling. During fiscal 2017, the U.S. Dollar weakened 9.4% against the Taiwan Dollar, resulting in a loss of $55.9 million, while the U.S. Dollar weakened 14.1% against the Euro and 9.5% against the British Pound Sterling, resulting in gains of $27.2 million and $3.1 million, respectively. The remaining net currency gain of $3.0 million was related to timing of transactions and impacts of other currencies, each of which was individually immaterial.
Income Tax Provision
Our income tax expense for the fiscal year ended December 29, 2018 was $129.2 million compared to income tax benefit of $11.9 million for the fiscal year ended December 30, 2017, resulting in a net change of $141.1 million. Contributing to the increase in tax expense was:
| ● | Income tax benefit of $180.0 million recorded in fiscal 2017 primarily related to the revaluation of certain Switzerland deferred tax assets resulting from the Company’s election in the first quarter of 2017 to align certain Switzerland corporate tax positions with international tax initiatives with no comparable item in the fiscal year ended December 29, 2018, |
|---|
Partially offset by:
| ● | Income tax benefit of $2.7 million related to share based compensation in the fiscal year ended December 29, 2018, as compared to income tax expense of $19.9 million in the fiscal year ended December 30, 2017, and |
|---|
| ● | Income tax benefit of $13.7 million related to the Company’s net change in uncertain tax positions in the fiscal year ended December 29, 2018, as compared to income tax expense of $5.4 million in the fiscal year ended December 30, 2017. |
|---|
Net Income
As a result of the various factors noted above, income before taxes increased 18% to $823.2 million from $697.1 million in the prior year, while net income decreased 2% to $694.1 million from $709.0 million in the prior year.
Comparison of 52-Weeks Ended December 30, 2017 and 53-Weeks Ended December 31, 2016
Net Sales
| 52-Weeks ended December 30, 2017 | 53-Weeks ended December 31, 2016 | Year over Year | |||||||||||||||||||||
|---|---|---|---|---|---|---|---|---|---|---|---|---|---|---|---|---|---|---|---|---|---|---|---|
| Net Sales | % of Revenue | Net Sales | % of Revenue | $ Change | % Change | ||||||||||||||||||
| Outdoor | $ | 698,867 | 22 | % | $ | 546,326 | 18 | % | $ | 152,541 | 28 | % | |||||||||||
| Fitness | 762,194 | 25 | % | 818,486 | 27 | % | (56,292 | ) | (7 | %) | |||||||||||||
| Marine | 374,001 | 12 | % | 331,947 | 11 | % | 42,054 | 13 | % | ||||||||||||||
| Auto | 785,139 | 25 | % | 909,690 | 30 | % | (124,551 | ) | (14 | %) | |||||||||||||
| Aviation | 501,359 | 16 | % | 439,348 | 14 | % | 62,011 | 14 | % | ||||||||||||||
| Total | $ | 3,121,560 | 100 | % | $ | 3,045,797 | 100 | % | $ | 75,763 | 2 | % |
Net sales increased 2% in 2017 when compared to the year-ago period. Outdoor, marine, and aviation segments had an increase in revenue, while fitness and auto segments had a decrease in revenue. Auto revenue represented the largest portion of our revenue mix in 2017 at 25%, which was a decline from 30% in 2016.
Total unit sales decreased 8% to 15.4 million units in the 52-weeks ended 2017 from 16.8 million units in the 53-weeks ended 2016.
Outdoor, marine, and aviation revenues increased 28%, 13%, and 14%, respectively when compared to the year-ago period. Growth in outdoor was driven by growth in our wearables and subscriptions categories. Our marine segment revenue increased primarily due to growth in chartplotters, fishfinders, and entertainment systems, and the newly acquired Navionics. Aviation revenues increased due to growth in both OEM and aftermarket sales. Fitness segment revenue decreased 7% from the year-ago period, primary driven by the general decline of the basic activity tracker market. Auto segment revenue decreased 14% from the year-ago period, primarily due to the ongoing PND market contraction.
Cost of Goods Sold
| 52-Weeks ended December 30, 2017 | 53-Weeks ended December 31, 2016 | Year over Year | |||||||||||||||||||||
|---|---|---|---|---|---|---|---|---|---|---|---|---|---|---|---|---|---|---|---|---|---|---|---|
| Cost of Goods | % of Revenue | Cost of Goods | % of Revenue | $ Change | % Change | ||||||||||||||||||
| Outdoor | $ | 250,457 | 36 | % | $ | 205,822 | 38 | % | $ | 44,635 | 22 | % | |||||||||||
| Fitness | 339,558 | 45 | % | 381,281 | 47 | % | (41,723 | ) | (11 | %) | |||||||||||||
| Marine | 161,409 | 43 | % | 148,238 | 45 | % | 13,171 | 9 | % | ||||||||||||||
| Auto | 442,441 | 56 | % | 511,988 | 56 | % | (69,547 | ) | (14 | %) | |||||||||||||
| Aviation | 129,754 | 26 | % | 109,943 | 25 | % | 19,811 | 18 | % | ||||||||||||||
| Total | $ | 1,323,619 | 42 | % | $ | 1,357,272 | 45 | % | $ | (33,653 | ) | (2 | %) |
Cost of goods sold decreased 2% in absolute dollars for the 52-weeks ended December 30, 2017 when compared to the 53-weeks ended December 31, 2016.
In the outdoor, fitness, and marine segments, the decrease in cost of goods sold as a percent of revenues was a result of a shift in product mix toward higher margin products. The aviation segment increase in cost of goods sold was generally consistent with the segment revenue increase. The auto segment cost of goods decline was largely consistent with the segment revenue decline.
Gross Profit
| 52-Weeks ended December 30, 2017 | 53-Weeks ended December 31, 2016 | Year over Year | |||||||||||||||||||||
|---|---|---|---|---|---|---|---|---|---|---|---|---|---|---|---|---|---|---|---|---|---|---|---|
| Gross Profit | % of Revenue | Gross Profit | % of Revenue | $ Change | % Change | ||||||||||||||||||
| Outdoor | $ | 448,410 | 64 | % | $ | 340,504 | 62 | % | $ | 107,906 | 32 | % | |||||||||||
| Fitness | 422,636 | 55 | % | 437,205 | 53 | % | (14,569 | ) | (3 | %) | |||||||||||||
| Marine | 212,592 | 57 | % | 183,709 | 55 | % | 28,883 | 16 | % | ||||||||||||||
| Auto | 342,698 | 44 | % | 397,702 | 44 | % | (55,004 | ) | (14 | %) | |||||||||||||
| Aviation | 371,605 | 74 | % | 329,405 | 75 | % | 42,200 | 13 | % | ||||||||||||||
| Total | $ | 1,797,941 | 58 | % | $ | 1,688,525 | 55 | % | $ | 109,416 | 6 | % |
Gross profit dollars in the 52-weeks ended December 30, 2017 increased 6% while gross profit margin increased 220 basis points compared to the 53-weeks ended December 31, 2016. Growth in sales of higher margin segments contributed to the increase in gross profit dollars and gross margin percentage. Outdoor, fitness, and marine segment increases to gross profit margin were primarily due to product mix within those segments. Auto and aviation segment gross margin rates were relatively consistent between fiscal periods.
Advertising Expenses
| 52-Weeks ended December 30, 2017 | 53-Weeks ended December 31, 2016 | Year over Year | |||||||||||||||||||||
|---|---|---|---|---|---|---|---|---|---|---|---|---|---|---|---|---|---|---|---|---|---|---|---|
| Advertising Expense | % of Revenue | Advertising Expense | % of Revenue | $ Change | % Change | ||||||||||||||||||
| Outdoor | $ | 41,113 | 6 | % | $ | 31,005 | 6 | % | $ | 10,108 | 33 | % | |||||||||||
| Fitness | 75,660 | 10 | % | 90,871 | 11 | % | (15,211 | ) | (17 | %) | |||||||||||||
| Marine | 16,101 | 4 | % | 15,516 | 5 | % | 585 | 4 | % | ||||||||||||||
| Auto | 25,639 | 3 | % | 33,122 | 4 | % | (7,483 | ) | (23 | %) | |||||||||||||
| Aviation | 6,180 | 1 | % | 6,629 | 2 | % | (449 | ) | (7 | %) | |||||||||||||
| Total | $ | 164,693 | 5 | % | $ | 177,143 | 6 | % | $ | (12,450 | ) | (7 | %) |
Advertising expense decreased 7% in absolute dollars and was relatively flat as a percent of revenues in the 52-weeks ended December 30, 2017 compared to the 53-weeks ended December 31, 2016. The decrease in absolute dollars is primarily attributable to decreases in spend on media advertising.
Selling, General and Administrative Expenses
| 52-Weeks ended December 30, 2017 | 53-Weeks ended December 31, 2016 | Year over Year | ||||||||||||||||||||
|---|---|---|---|---|---|---|---|---|---|---|---|---|---|---|---|---|---|---|---|---|---|---|
| Selling, General & Admin. Expenses | % of Revenue | Selling, General & Admin. Expenses | % of Revenue | $ Change | % Change | |||||||||||||||||
| Outdoor | $ | 98,914 | 14 | % | $ | 77,016 | 14 | % | $ | 21,898 | 28 | % | ||||||||||
| Fitness | 119,537 | 16 | % | 118,753 | 15 | % | 784 | 1 | % | |||||||||||||
| Marine | 83,765 | 22 | % | 60,061 | 18 | % | 23,704 | 39 | % | |||||||||||||
| Auto | 107,995 | 14 | % | 127,618 | 14 | % | (19,623 | ) | (15 | %) | ||||||||||||
| Aviation | 27,766 | 6 | % | 27,110 | 6 | % | 656 | 2 | % | |||||||||||||
| Total | $ | 437,977 | 14 | % | $ | 410,558 | 13 | % | $ | 27,419 | 7 | % |
Selling, general and administrative expense increased 7% in absolute dollars and was relatively flat as a percent of revenues in the 52-weeks ended December 30, 2017 compared to the 53-weeks ended December 31, 2016. The absolute dollar increase is primarily attributable to legal-related costs and information technology costs. As a percent of revenues, selling, general, and administrative expenses in all segments except marine were relatively consistent on a year over year basis. The increase in the marine segment, as a percent of revenue, was primarily related to a litigation settlement.
Research and Development Expense
| 52-Weeks ended December 30, 2017 | 53-Weeks ended December 31, 2016 | Year over Year | ||||||||||||||||||||
|---|---|---|---|---|---|---|---|---|---|---|---|---|---|---|---|---|---|---|---|---|---|---|
| Research & Development | % of Revenue | Research & Development | % of Revenue | $ Change | % Change | |||||||||||||||||
| Outdoor | $ | 58,516 | 8 | % | $ | 48,448 | 9 | % | $ | 10,068 | 21 | % | ||||||||||
| Fitness | 80,674 | 11 | % | 66,985 | 8 | % | 13,689 | 20 | % | |||||||||||||
| Marine | 62,398 | 17 | % | 55,965 | 17 | % | 6,433 | 11 | % | |||||||||||||
| Auto | 126,320 | 16 | % | 125,660 | 14 | % | 660 | 1 | % | |||||||||||||
| Aviation | 183,726 | 37 | % | 170,902 | 39 | % | 12,824 | 8 | % | |||||||||||||
| Total | $ | 511,634 | 16 | % | $ | 467,960 | 15 | % | $ | 43,674 | 9 | % |
Research and development expense increased 9% due to ongoing development activities for new products and the addition of engineering personnel throughout the 52-weeks ended December 30, 2017. In absolute dollars, research and development costs increased $43.7 million when compared with the 53-weeks ended December 31, 2016, and increased 100 basis points as a percent of revenue. Our research and development spending is focused on product development, improving existing software capabilities, and exploring new categories.
Operating Income
| 52-Weeks ended December 30, 2017 | 53-Weeks ended December 31, 2016 | Year over Year | ||||||||||||||||||||
|---|---|---|---|---|---|---|---|---|---|---|---|---|---|---|---|---|---|---|---|---|---|---|
| Operating Income | % of Revenue | Operating Income | % of Revenue | $ Change | % Change | |||||||||||||||||
| Outdoor | $ | 249,867 | 36 | % | $ | 184,035 | 34 | % | $ | 65,832 | 36 | % | ||||||||||
| Fitness | 146,765 | 19 | % | 160,596 | 20 | % | (13,831 | ) | (9 | %) | ||||||||||||
| Marine | 50,328 | 13 | % | 52,167 | 16 | % | (1,839 | ) | (4 | %) | ||||||||||||
| Auto | 82,744 | 11 | % | 111,302 | 12 | % | (28,558 | ) | (26 | %) | ||||||||||||
| Aviation | 153,933 | 31 | % | 124,764 | 28 | % | 29,169 | 23 | % | |||||||||||||
| Total | $ | 683,637 | 22 | % | $ | 632,864 | 21 | % | $ | 50,773 | 8 | % |
As a result of the above, operating income increased 8% in absolute dollars and 110 basis points as a percent of revenue when compared to the 53-weeks ended December 31, 2016. The growth in operating income, both in absolute dollars and as a percent of revenue, was primarily due to an increase in revenue growth and increase in gross margin percentage, which were partially offset by increased operating expenses, as discussed above.
Other Income (Expense)
| 52-Weeks ended | 53-Weeks ended | |||||||
|---|---|---|---|---|---|---|---|---|
| December 30, 2017 | December 31, 2016 | |||||||
| Interest income | $ | 36,925 | $ | 33,406 | ||||
| Foreign currency (losses) | (22,579 | ) | (31,651 | ) | ||||
| Other | (912 | ) | 4,006 | |||||
| Total | $ | 13,434 | $ | 5,761 |
The average returns on cash and investments, including interest and capital gain/loss returns, during the 52-weeks ended December 30, 2017 and the 53- weeks ended December 31, 2016 were 1.5% for both periods. Interest income increased in fiscal 2017 primarily due to slightly higher yields on fixed-income securities, while other income decreased in fiscal 2017 primarily due to higher net capital gains realized in fiscal 2016.
Foreign currency gains and losses for the Company are typically driven by movements in the Taiwan Dollar, Euro, and British Pound Sterling in relation to the U.S. Dollar. The Taiwan Dollar is the functional currency of Garmin Corporation, the U.S. Dollar is the functional currency of Garmin (Europe) Ltd., and the Euro is the functional currency of most of our other European subsidiaries, although some transactions and balances are denominated in British Pounds. The majority of the Company’s consolidated foreign currency gain or loss is typically driven by the significant cash and marketable securities, receivables, and payables held in a currency other than the functional currency at a given legal entity. Due to the relative size of the entities using a functional currency other than the Taiwan Dollar, Euro, and British Pound Sterling, currency fluctuations related to these entities are not expected to have a material impact on the Company’s financial statements.
The $22.6 million currency loss recognized in fiscal 2017 was primarily due to the weakening of the U.S. Dollar against the Taiwan Dollar, partially offset by the U.S. Dollar weakening against the Euro and the British Pound Sterling. During fiscal 2017, the U.S. Dollar weakened 9.4% against the Taiwan Dollar, resulting in a loss of $55.9 million, while the U.S. Dollar weakened 14.1% against the Euro and 9.5% against the British Pound Sterling, resulting in gains of $27.2 million and $3.1 million, respectively. The remaining net currency gain of $3.0 million was related to timing of transactions and impacts of other currencies, each of which was individually immaterial.
The $31.7 million currency loss recognized in fiscal 2016 was primarily due to the weakening of the U.S. Dollar against the Taiwan Dollar and the strengthening of the U.S. Dollar against the Euro and British Pound Sterling. During fiscal 2016, the U.S. Dollar weakened 1.7% against the Taiwan Dollar, resulting in a loss of $9.2 million, while the U.S. Dollar strengthened 4.2% against the Euro and 16.8% against the British Pound Sterling, resulting in losses of $13.0 million and $5.1 million, respectively. The remaining net currency loss of $4.4 million was related to timing of transactions and impacts of other currencies, each of which was individually immaterial.
Income Tax Provision
Our income tax benefit for the 52-weeks ended December 30, 2017 was $11.9 million compared to income tax expense of $120.9 million for the 53-weeks ended December 31, 2016, resulting in a net change of $132.8 million. Contributing to the decrease in tax expense was:
| ● | Income tax benefit of $180.0 million recorded in fiscal 2017 primarily related to the revaluation of certain Switzerland deferred tax assets resulting from the Company’s election in the first quarter of 2017 to align certain Switzerland corporate tax positions with international tax initiatives, with no comparable item in the 53-weeks ended December 31, 2016, |
|---|
Partially offset by:
| ● | Income tax expense of $19.9 million related to share based compensation in the 52-weeks ended December 30, 2017 in accordance with new accounting standard Topic 718, Compensation–Stock Compensation, and |
|---|
| ● | Increased income tax expense of $21.0 million related to the Company’s election to align certain Switzerland corporate tax positions in the 52-weeks ended December 30, 2017. |
|---|
On December 22, 2017, the Tax Cuts and Jobs Act was passed by United States Congress, reducing the United States federal corporate income tax rate from 35% to 21%. The effects of U.S. tax reform, including revaluation of deferred tax assets and liabilities, had an immaterial impact on the 2017 income tax benefit, on a provisional basis, as discussed in Note 6.
Net Income
As a result of the various factors noted above, net income increased 37% to $709.0 million for the 52-weeks ended December 30, 2017 compared to $517.7 million for the 53-weeks ended December 31, 2016.
Liquidity and Capital Resources
As of December 29, 2018, we had $2,714.8 million of cash and cash equivalents and marketable securities. We primarily use cash flow from operations, and expect that future cash requirements may be used, to fund our capital expenditures, support our working capital requirements, pay dividends, and fund strategic acquisitions. We believe that our existing cash balances and cash flow from operations will be sufficient to meet our long-term projected capital expenditures, working capital and other cash requirements.
It is management’s goal to invest the on-hand cash in accordance with the investment policy, which has been approved by the Board of Directors of each applicable Garmin entity holding the cash. The investment policy’s primary purpose is to preserve capital, maintain an acceptable degree of liquidity, and maximize yield within the constraint of low credit risk. Garmin’s average interest income returns on cash and investments during fiscal 2018, 2017, and 2016 were approximately 1.9%, 1.6%, and 1.5%, respectively. The fair value of our securities varies from period to period due to changes in interest rates, in the performance of the underlying collateral and in the credit performance of the underlying issuer, among other factors. See Note 3 for additional information regarding marketable securities.
Operating Activities
| 52-Weeks Ended | 52-Weeks Ended | 53-Weeks Ended | ||||||||||
|---|---|---|---|---|---|---|---|---|---|---|---|---|
| December 29, | December 30, | December 31, | ||||||||||
| (In thousands) | 2018 | 2017 | 2016 | |||||||||
| Net cash provided by operating activities | $ | 919,520 | $ | 660,842 | $ | 705,682 |
The $258.7 million increase in cash provided by operating activities in fiscal year 2018 compared to fiscal year 2017 was due to the increase in cash provided by working capital of $82.8 million (which included an increase of $46.4 million in net receipts of accounts receivable, an increase of $57.9 million in accounts payable, partially offset by an increase of $50.2 million in cash paid for inventory), and income taxes payable of $48.6 million. Additionally, the year over year decrease in net income of $14.9 million was offset by other non-cash adjustments to net income of $142.3 million, including an income tax benefit of $180.0 million related to the revaluation of certain Switzerland deferred tax assets.
The $44.8 million decrease in cash provided by operating activities in fiscal year 2017 compared to fiscal year 2016 was primarily due to a decrease of cash provided by working capital of $133.2 million (which included increases of $52.2 million in accounts receivable and $31.5 million in cash paid for inventory) and income taxes payable of $16.5 million. The decrease was partially offset by an increase in net income of $184.1 million, reduced by other non-cash adjustments to net income of $79.3 million, including an income tax benefit of $180.0 million related to the revaluation of certain Switzerland deferred tax assets.
Investing Activities
| 52-Weeks Ended | 52-Weeks Ended | 53-Weeks Ended | ||||||||||
| December 29, | December 30, | December 31, | ||||||||||
| (In thousands) | 2018 | 2017 | 2016 | |||||||||
| Net cash used in investing activities | $ | (307,503 | ) | $ | (194,383 | ) | $ | (121,683 | ) |
The $113.1 million increase in cash used in investing activities in fiscal year 2018 compared to fiscal year 2017 was primarily due to increased net purchases of marketable securities of $167.2 million and increased cash payments for net purchases of property and equipment of $14.8 million, partially offset by a decrease in net cash paid for acquisitions of $61.3 million.
The $72.7 million increase in cash used in investing activities in fiscal year 2017 compared to fiscal year 2016 was primarily due to increased cash payments for net purchases of property and equipment of $49.1 million and net cash paid for acquisitions of $12.5 million.
Financing Activities
| 52-Weeks Ended | 52-Weeks Ended | 53-Weeks Ended | ||||||||||
|---|---|---|---|---|---|---|---|---|---|---|---|---|
| December 29, | December 30, | December 31, | ||||||||||
| (In thousands) | 2018 | 2017 | 2016 | |||||||||
| Net cash used in financing activities | $ | (286,161 | ) | $ | (448,412 | ) | $ | (561,676 | ) |
The $162.3 million decrease in cash used in financing activities in fiscal year 2018 compared to fiscal year 2017 was primarily due to a decrease in dividend payments of $86.8 million associated with the timing of dividend payments that resulted in one less dividend payment in 2018 compared to 2017, and also due to a decrease of purchases of treasury stock of $74.5 million under our share repurchase authorization, which expired on December 31, 2017.
The $113.3 million decrease in cash used in financing activities in fiscal year 2017 compared to fiscal year 2016 was primarily due to decreased dividend payments of $98.5 million associated with the timing of dividend payments that resulted in an additional payment made in the 53-week fiscal year 2016, and also due to a decrease of purchases of treasury stock of $18.7 million under our share repurchase authorization.
Our declared dividend has increased from $0.51 per share for the twelve calendar quarters beginning in June 2015 to $0.53 per share for the four calendar quarters beginning June 2018.
Contractual Obligations and Commercial Commitments
As of December 29, 2018, operating leases comprise the substance of the Company’s commercial commitments with long-term scheduled payments, as summarized below:
| Payments due by period | ||||||||||||||||||||
|---|---|---|---|---|---|---|---|---|---|---|---|---|---|---|---|---|---|---|---|---|
| Contractual Obligations | Total | Less than 1 year | 1-3 years | 3-5 years | More than 5 years | |||||||||||||||
| Operating Leases | $ | 69,838 | $ | 17,170 | $ | 24,520 | $ | 14,237 | $ | 13,910 |
The Company is party to certain other commitments, which include purchases of raw materials, advertising expenditures, and other indirect purchases in connection with conducting our business. The aggregate amount of purchase orders and other commitments open as of December 29, 2018 was approximately $354.6 million. We cannot determine the aggregate amount of such purchase orders that represent contractual obligations because purchase orders may represent authorizations to purchase rather than binding agreements. Our purchase orders are based on our current needs and are typically fulfilled within short periods of time.
We may be required to make significant cash outlays related to unrecognized tax benefits. However, due to the uncertainty of the timing of future cash flows associated with our unrecognized tax benefits, we are unable to make reasonably reliable estimates of the period of cash settlement, if any, with the respective taxing authorities. Accordingly, unrecognized tax benefits of $118.3 million as of December 29, 2018, have been excluded from the contractual obligations table above. For further information related to unrecognized tax benefits, see Note 2, “Income Taxes”, and Note 6 to the consolidated financial statements included in this Report.
Off-Balance Sheet Arrangements
We do not have any off-balance sheet arrangements.
Item 7A. Quantitative and Qualitative Disclosures About Market Risk
Market Sensitivity
We have market risk primarily in connection with the pricing of our products and services and the purchase of raw materials. Product pricing and raw materials costs are both significantly influenced by semiconductor market conditions. Historically, during cyclical industry downturns, we have been able to offset pricing declines for our products through a combination of improved product mix and success in obtaining price reductions in raw materials costs.
Inflation
We do not believe that inflation has had a material effect on our business, financial condition or results of operations. If our costs were to become subject to significant inflationary pressures, we may not be able to fully offset such higher costs through price increases. Our inability or failure to do so could adversely affect our business, financial condition and results of operations.
Foreign Currency Exchange Rate Risk
The operation of Garmin’s subsidiaries in international markets results in exposure to movements in currency exchange rates. We have experienced significant foreign currency gains and losses due to the strengthening and weakening of the U.S. dollar. The potential of volatile foreign exchange rate fluctuations in the future could have a significant effect on our results of operations. The Company has not historically hedged its foreign currency exchange rate risks.
The currencies that create a majority of the Company’s exchange rate exposure are the Taiwan Dollar, Euro, and British Pound Sterling. Garmin Corporation, headquartered in Xizhi, Taiwan, uses the local currency as the functional currency. The Company translates all assets and liabilities at year-end exchange rates and income and expense accounts at average rates during the year. In order to minimize the effect of the currency exchange fluctuations on our net assets, we have elected to retain most of our Taiwan subsidiary’s cash and investments in accounts denominated in U.S. Dollars.
Most European subsidiaries use the Euro as the functional currency. However, the functional currency of our largest European subsidiary, Garmin (Europe) Ltd., is the U.S. Dollar, and as some transactions have occurred in British Pounds Sterling or Euros, foreign currency gains or losses have been realized historically related to the movements of those currencies relative to the U.S. Dollar. The Company believes that gains and losses will become more material in the future as our European presence grows.
During fiscal year 2018, the Company incurred a net foreign currency loss of $7.6 million. The strengthening of the U.S. Dollar against the Euro and the British Pound Sterling was offset by the U.S. Dollar strengthening against the Taiwan Dollar. During fiscal 2018, the U.S. Dollar strengthened 4.7% against the Euro and 6.0% against the British Pound Sterling, resulting in losses of $10.0 million and $1.7 million, respectively, while the U.S. Dollar strengthened 3.0% against the Taiwan Dollar, resulting in a gain of $15.1 million. The remaining net currency loss of $11.0 million was related to timing of transactions and impacts of other currencies, each of which was individually immaterial. These and other currency moves during fiscal year 2018 also resulted in a currency translation adjustment of $32.0 million within accumulated other comprehensive income.
We assessed the Company’s exposure to movements in currency exchange rates by performing a sensitivity analysis of adverse changes in exchange rates and the corresponding impact to our results of operations. Based on monetary assets and liabilities denominated in currencies other than respective functional currencies as of December 29, 2018 and December 30, 2017, hypothetical and reasonably possible adverse changes of 10% for the Taiwan Dollar, Euro, and British Pound Sterling would have resulted in an adverse impact on income before income taxes of approximately $109 million and $96 million at December 29, 2018 and December 30, 2017, respectively.
Interest Rate Risk
We have no outstanding long-term debt as of December 29, 2018. We, therefore, have no meaningful debt-related interest rate risk.
We are exposed to interest rate risk in connection with our investments in marketable securities. As interest rates change, the unrealized gains and losses associated with those securities will fluctuate accordingly.
The Company’s investment policy targets low risk investments with the objective of minimizing the potential risk of principal loss. The Company does not intend to sell securities in an unrealized loss position and it is not more likely than not that the Company will be required to sell such investments before recovery of their amortized costs bases, which may be maturity. During 2018 and 2017, the Company did not record any material impairment charges on its outstanding securities.
We assessed the Company’s exposure to interest rate risk by performing a sensitivity analysis of a parallel shift in the yield curve and the corresponding impact to the Company’s portfolio of marketable securities. Based on balance sheet positions as of December 29, 2018 and December 30, 2017, the hypothetical and reasonably possible 100 basis point increases in interest rates across all securities would have resulted in declines in portfolio fair market value of approximately $38 million and $42 million at December 29, 2018 and December 30, 2017, respectively. Such losses would only be realized if the Company sold the investments prior to maturity.
Item 8. Financial Statements and Supplementary Data
CONSOLIDATED FINANCIAL STATEMENTS
Garmin Ltd. and Subsidiaries
Years Ended December 29, 2018, December 30, 2017, and December 31, 2016
Contents
Report of Independent Registered Public Accounting Firm
To the Stockholders and the Board of Directors of Garmin Ltd. and Subsidiaries
Opinion on the Financial Statements
We have audited the accompanying consolidated balance sheets of Garmin Ltd. and Subsidiaries (the Company) as of December 29, 2018 and December 30, 2017, the related consolidated statements of income, comprehensive income, stockholders’ equity and cash flows for each of the three years in the period ended December 29, 2018 and the related notes and financial statement schedule listed in the Index at Item 15(a) (collectively referred to as the “consolidated financial statements”). In our opinion, the consolidated financial statements present fairly, in all material respects, the financial position of the Company at December 29, 2018 and December 30, 2017, and the results of its operations and its cash flows for each of the three years in the period ended December 29, 2018, in conformity with U.S. generally accepted accounting principles.
We also have audited, in accordance with the standards of the Public Company Accounting Oversight Board (United States) (PCAOB), the Company’s internal control over financial reporting as of December 29, 2018, based on criteria established in Internal Control-Integrated Framework issued by the Committee of Sponsoring Organizations of the Treadway Commission (2013 framework) and our report dated February 20, 2019, expressed an unqualified opinion thereon.
Adoption of New Accounting Standard
As discussed in Note 2 to the consolidated financial statements, the Company changed its method of accounting for revenue in 2018 due to the adoption of Accounting Standards Update (ASU) No. 2014-09, Revenue from Contracts with Customers (Topic 606), and the related amendments.
Basis for Opinion
These financial statements are the responsibility of the Company’s management. Our responsibility is to express an opinion on the Company’s financial statements based on our audits. We are a public accounting firm registered with the PCAOB and are required to be independent with respect to the Company in accordance with the U.S. federal securities laws and the applicable rules and regulations of the Securities and Exchange Commission and the PCAOB.
We conducted our audits in accordance with the standards of the PCAOB. Those standards require that we plan and perform the audit to obtain reasonable assurance about whether the financial statements are free of material misstatement, whether due to error or fraud. Our audits included performing procedures to assess the risks of material misstatement of the financial statements, whether due to error or fraud and performing procedures that respond to those risks. Such procedures included examining, on a test basis, evidence regarding the amounts and disclosures in the financial statements. Our audits also included evaluating the accounting principles used and significant estimates made by management, as well as evaluating the overall presentation of the financial statements. We believe that our audits provide a reasonable basis for our opinion.
/s/ Ernst & Young LLP
We have served as the Company’s auditor since 1990.
Kansas City, Missouri
February 20, 2019
Garmin Ltd. And Subsidiaries
Consolidated Balance Sheets
(In thousands, except per share information)
| December 29, 2018 | December 30, 2017 | |||||||
|---|---|---|---|---|---|---|---|---|
| Assets | ||||||||
| Current assets: | ||||||||
| Cash and cash equivalents | $ | 1,201,732 | $ | 891,488 | ||||
| Marketable securities (Note 3) | 182,989 | 161,687 | ||||||
| Accounts receivable, less allowance for doubtful accounts of $5,487 in 2018 and $4,168 in 2017 | 569,833 | 590,882 | ||||||
| Inventories | 561,840 | 517,644 | ||||||
| Deferred costs | 28,462 | 30,525 | ||||||
| Prepaid expenses and other current assets | 120,512 | 153,912 | ||||||
| Total current assets | 2,665,368 | 2,346,138 | ||||||
| Property and equipment, net | ||||||||
| Land and improvements | 131,689 | 114,701 | ||||||
| Building and improvements | 539,177 | 482,794 | ||||||
| Office furniture and equipment | 264,818 | 246,107 | ||||||
| Manufacturing equipment | 162,077 | 156,119 | ||||||
| Engineering equipment | 154,742 | 141,321 | ||||||
| Vehicles | 20,991 | 21,115 | ||||||
| 1,273,494 | 1,162,157 | |||||||
| Accumulated depreciation | (609,967 | ) | (566,473 | ) | ||||
| 663,527 | 595,684 | |||||||
| Restricted cash (Note 4) | 73 | 271 | ||||||
| Marketable securities (Note 3) | 1,330,123 | 1,260,033 | ||||||
| Deferred income taxes (Note 6) | 176,959 | 195,981 | ||||||
| Noncurrent deferred costs | 29,473 | 33,029 | ||||||
| Intangible assets, net | 417,080 | 409,801 | ||||||
| Other assets | 100,255 | 107,352 | ||||||
| Total assets | $ | 5,382,858 | $ | 4,948,289 | ||||
| Liabilities and Stockholders’ Equity | ||||||||
| Current liabilities: | ||||||||
| Accounts payable | $ | 204,985 | $ | 169,640 | ||||
| Salaries and benefits payable | 113,087 | 102,802 | ||||||
| Accrued warranty costs | 38,276 | 36,827 | ||||||
| Accrued sales program costs | 90,388 | 93,250 | ||||||
| Deferred revenue | 96,372 | 103,140 | ||||||
| Accrued royalty costs | 24,646 | 32,204 | ||||||
| Accrued advertising expense | 31,657 | 30,987 | ||||||
| Other accrued expenses | 69,777 | 93,652 | ||||||
| Income taxes payable | 51,642 | 33,638 | ||||||
| Dividend payable | 200,483 | 95,975 | ||||||
| Total current liabilities | 921,313 | 792,115 | ||||||
| Deferred income taxes (Note 6) | 92,944 | 76,612 | ||||||
| Noncurrent income taxes | 127,211 | 138,295 | ||||||
| Noncurrent deferred revenue | 76,566 | 87,060 | ||||||
| Other liabilities | 1,850 | 1,788 | ||||||
| Stockholders’ equity: | ||||||||
| Shares, CHF 0.10 par value, 198,077 shares authorized and issued, 189,461 shares outstanding at December 29, 2018; and 188,189 shares outstanding at December 30, 2017; (Notes 9, 10, and 11): | 17,979 | 17,979 | ||||||
| Additional paid-in capital | 1,823,638 | 1,828,386 | ||||||
| Treasury stock | (397,692 | ) | (468,818 | ) | ||||
| Retained earnings | 2,710,619 | 2,418,444 | ||||||
| Accumulated other comprehensive income | 8,430 | 56,428 | ||||||
| Total stockholders’ equity | 4,162, |
Showing the first 8K of 128K characters. Open the full section
Item 9. Changes in and Disagreements with Accountants on Accounting and Financial Disclosure
None.
Item 9A. Controls and Procedures
(a) Conclusion Regarding the Effectiveness of Disclosure Controls and Procedures
Under the supervision and with the participation of our management, including the Chief Executive Officer and Chief Financial Officer, we have evaluated the effectiveness of the design and operation of our disclosure controls and procedures pursuant to Exchange Act Rule 13a-15(b) as of the end of the period covered by this report. Based on the evaluation, the Chief Executive Officer and Chief Financial Officer have concluded that these disclosure controls and procedures are effective.
(b) Management’s Report on Internal Control over Financial Reporting
Management of the Company is responsible for establishing and maintaining adequate internal control over financial reporting for the Company. The Company’s internal control over financial reporting is a process designed to provide reasonable assurance regarding the reliability of financial reporting and the preparation of financial statements for external purposes in accordance with generally accepted accounting principles.
Because of its inherent limitations, internal control over financial reporting may not prevent or detect misstatements. Also, projections of any evaluation of effectiveness to future periods are subject to the risk that controls may become inadequate because of changes in conditions, or that the degree of compliance with the policies or procedures may deteriorate.
Management of the Company assessed the effectiveness of the Company’s internal control over financial reporting as of December 29, 2018. In making this assessment, management used the criteria set forth by the Committee of Sponsoring Organizations of the Treadway Commission (COSO) in “Internal Control-Integrated Framework” (2013 framework).
Based on such assessment and those criteria, management believes that the Company maintained effective internal control over financial reporting as of December 29, 2018.
Ernst & Young LLP, the independent registered public accounting firm that audited the Company’s consolidated financial statements, issued an attestation report on management’s effectiveness of the Company’s internal control over financial reporting as of December 29, 2018, as stated in their report which is included herein. That attestation report appears below.
(c) Attestation Report of the Independent Registered Public Accounting Firm
Report of Independent Registered Public Accounting Firm
To the Stockholders and the Board of Directors of Garmin Ltd. and Subsidiaries
Opinion on Internal Control over Financial Reporting
We have audited Garmin Ltd. and Subsidiaries’ internal control over financial reporting as of December 29, 2018, based on criteria established in Internal Control-Integrated Framework issued by the Committee of Sponsoring Organizations of the Treadway Commission (2013 framework), (the COSO criteria). In our opinion, Garmin Ltd. and Subsidiaries (the Company) maintained, in all material respects, effective internal control over financial reporting as of December 29, 2018, based on the COSO criteria.
We also have audited, in accordance with the standards of the Public Company Accounting Oversight Board (United States), the consolidated balance sheets of Garmin Ltd. and Subsidiaries as of December 29, 2018 and December 30, 2017, the related consolidated statements of income, comprehensive income, stockholders’ equity and cash flows for each of the three years in the period ended December 29, 2018, and the related notes and financial statement schedule listed in the Index at Item 15(a) (collectively referred to as the “consolidated financial statements”) of the Company and our report dated February 20, 2019 expressed an unqualified opinion thereon.
Basis for Opinion
The Company’s management is responsible for maintaining effective internal control over financial reporting and for its assessment of the effectiveness of internal control over financial reporting included in the accompanying Management’s Report on Internal Control over Financial Reporting. Our responsibility is to express an opinion on the Company’s internal control over financial reporting based on our audit. We are a public accounting firm registered with the PCAOB and are required to be independent with respect to the Company in accordance with the U.S. federal securities laws and the applicable rules and regulations of the Securities and Exchange Commission and the PCAOB.
We conducted our audit in accordance with the standards of the PCAOB. Those standards require that we plan and perform the audit to obtain reasonable assurance about whether effective internal control over financial reporting was maintained in all material respects.
Our audit included obtaining an understanding of internal control over financial reporting, assessing the risk that a material weakness exists, testing and evaluating the design and operating effectiveness of internal control based on the assessed risk, and performing such other procedures as we considered necessary in the circumstances. We believe that our audit provides a reasonable basis for our opinion.
Definition and Limitations of Internal Control Over Financial Reporting
A company’s internal control over financial reporting is a process designed to provide reasonable assurance regarding the reliability of financial reporting and the preparation of financial statements for external purposes in accordance with generally accepted accounting principles. A company’s internal control over financial reporting includes those policies and procedures that (1) pertain to the maintenance of records that, in reasonable detail, accurately and fairly reflect the transactions and dispositions of the assets of the company; (2) provide reasonable assurance that transactions are recorded as necessary to permit preparation of financial statements in accordance with generally accepted accounting principles, and that receipts and expenditures of the company are being made only in accordance with authorizations of management and directors of the company; and (3) provide reasonable assurance regarding prevention or timely detection of unauthorized acquisition, use, or disposition of the company’s assets that could have a material effect on the financial statements.
Because of its inherent limitations, internal control over financial reporting may not prevent or detect misstatements. Also, projections of any evaluation of effectiveness to future periods are subject to the risk that controls may become inadequate because of changes in conditions, or that the degree of compliance with the policies or procedures may deteriorate.
/s/ Ernst & Young LLP
Kansas City, Missouri
February 20, 2019
(d) Changes in Internal Control over Financial Reporting
There were no changes in our internal control over financial reporting during the quarter ended December 29, 2018 that have materially affected, or are reasonably likely to materially affect, our internal control over financial reporting.
Item 9B. Other Information
Not applicable.
PART III
Item 10. Directors, Executive Officers and Corporate Governance
Garmin has incorporated by reference certain information in response or partial response to the Items under this Part III of this Annual Report on Form 10-K pursuant to General Instruction G(3) of this Form 10-K and Rule 12b-23 under the Exchange Act. Garmin’s definitive proxy statement in connection with its annual meeting of shareholders scheduled for June 7, 2019 (the “Proxy Statement”) will be filed with the Securities and Exchange Commission no later than 120 days after December 29, 2018.
| (a) | Directors of the Company |
|---|
The information set forth in response to Item 401 of Regulation S-K under the headings “Proposal 5 – Re-election of five directors and election of one new director” in the Proxy Statement is hereby incorporated herein by reference in partial response to this Item 10.
| (b) | Executive Officers of the Company |
|---|
The information set forth in response to Item 401 of Regulation S-K under the heading “Executive Officers of the Registrant” in Part I of this Form 10-K is incorporated herein by reference in partial response to this Item 10.
| (c) | Compliance with Section 16(a) of the Exchange Act |
|---|
The information set forth in response to Item 405 of Regulation S-K under the heading “Section 16(a) Beneficial Ownership Reporting Compliance” in the Proxy Statement is hereby incorporated herein by reference in partial response to this Item 10.
| (d) | Audit Committee and Audit Committee Financial Expert |
|---|
The information set forth in response to Item 402 of Regulation S-K under the heading “Board Meetings and Standing Committee Meetings - Audit Committee” in the Proxy Statement is hereby incorporated herein by reference in partial response to this Item 10.
The Audit Committee consists of Joseph J. Hartnett, Charles W. Peffer and Rebecca R. Tilden. Mr. Peffer serves as the Chairman of the Audit Committee. All members of the Audit Committee are “independent” within the meaning of the rules of the SEC and the Nasdaq Marketplace Rules. Garmin’s Board of Directors has determined that Mr. Hartnett and Mr. Peffer are “audit committee financial experts” as defined by the SEC regulations implementing Section 407 of the Sarbanes-Oxley Act of 2002.
| (e) | Code of Ethics |
|---|
Garmin’s Board of Directors has adopted the Code of Conduct of Garmin Ltd. and Subsidiaries (the “Code”). The Code is applicable to all Garmin employees including the President and Chief Executive Officer, the Chief Financial Officer, the Controller and other officers. A copy of the Code is available on Garmin’s website at: https://www8.garmin.com/aboutGarmin/invRelations/documents/Code_of_Conduct.pdf. If any amendments to the Code are made, or any waivers with respect to the Code are granted to the President and Chief Executive Officer, the Chief Financial Officer or Controller, or any person performing a similar function, such amendment or waiver will be disclosed on Garmin’s website at: https://www8.garmin.com/aboutGarmin/invRelations/documents/Code_of_Conduct.pdf.
Item 11. Executive Compensation
The information set forth in response to Item 402 of Regulation S-K under the headings “Executive Compensation Matters” and “Proposal 5 - Re-election of five directors and election of one new director – Non-Management Director Compensation” in the Proxy Statement is hereby incorporated herein by reference in partial response to this Item 11.
The information set forth in response to Item 407(e)(4) of Regulation S-K under the heading “Proposal 5 -Re-election of five directors and election of one new director – Compensation Committee Interlocks and Insider Participation; Certain Relationships” in the Proxy Statement is hereby incorporated herein by reference in partial response to this Item 11.
The information set forth in response to Item 407(e)(5) of Regulation S-K under the heading “Executive Compensation Matters – Compensation Committee Report” in the Proxy Statement is hereby incorporated herein by reference in partial response to this Item 11.
Item 12. Security Ownership of Certain Beneficial Owners and Management and Related Stockholder Matters
The information set forth in response to Item 403 of Regulation S-K under the heading “Stock Ownership of Certain Beneficial Owners and Management” in the Proxy Statement is hereby incorporated herein by reference in partial response to this Item 12.
Equity Compensation Plan Information
The following table gives information as of December 29, 2018 about the Garmin common shares that may be issued under all of the Company’s existing equity compensation plans, as adjusted for stock splits.
| A | B | C | ||||||||||
| Number of securities | ||||||||||||
| remaining available for | ||||||||||||
| future issuance under | ||||||||||||
| Number of securities to be | Weighted-average | equity compensation | ||||||||||
| issued upon exercise of | exercise price of | plans (excluding | ||||||||||
| outstanding options, | outstanding options, | securities reflected in | ||||||||||
| Plan Category | warrants and rights | warrants and rights | column A) | |||||||||
| Equity compensation plans approved by shareholders | 2,184,857 | $ | 50.92 | 4,875,785 | ||||||||
| Equity compensation plans not approved by shareholders | — | — | — | |||||||||
| Total | 2,184,857 | $ | 50.92 | 4,875,785 |
Table consists of the Garmin Ltd. 2005 Equity Incentive Plan (as Amended and Restated Effective June 5, 2010), the Garmin Ltd. 2000 Equity Incentive Plan, the Garmin Ltd. Amended and Restated 2000 Non-Employee Directors’ Option Plan, effective June 5, 2010, the Garmin Ltd. Amended and Restated Employee Stock Purchase Plan, effective January 1, 2010 and the Garmin Ltd. 2011 Non-Employee Directors Equity Incentive Plan, effective June 3, 2011. The weighted-average exercise price does not reflect the shares that will be issued upon the payment of outstanding awards of RSUs.
The Company has no knowledge of any arrangement, the operation of which may at a subsequent date result in a change in control of the Company.
Item 13. Certain Relationships and Related Transactions, and Director Independence
The information set forth in response to Item 404 of Regulation S-K under the heading “Proposal 5 – Re-election of five directors and election of one new director - Compensation Committee Interlocks and Insider Participation; Certain Relationships” in the Proxy Statement is incorporated herein by reference in partial response to this Item 13.
The information set forth in response to Item 407(a) of Regulation S-K under the headings “Proposal 5 – Re-election of five directors and election of one new director” in the Proxy Statement is hereby incorporated herein by reference in partial response to this Item 13.
Item 14. Principal Accounting Fees and Services
The information set forth under the headings “Audit Matters -- Independent Registered Public Accounting Firm Fees” and “Pre-Approval of Services Provided by the Independent Auditor” in the Proxy Statement is hereby incorporated by reference in response to this Item 14.
PART IV
Item 15. Exhibits, and Financial Statement Schedules
| (a) | List of Documents filed as part of this Report |
|---|
| (1) | Consolidated Financial Statements |
|---|
The consolidated financial statements and related notes, together with the reports of Ernst & Young LLP, appear in Part II, Item 8 “Financial Statements and Supplementary Data” of this Form 10-K.
| (2) | Schedule II Valuation and Qualifying Accounts |
|---|
All other schedules have been omitted because they are not applicable, are insignificant or the required information is shown in the consolidated financial statements or notes thereto.
| (3) | Exhibits -- The following exhibits are filed as part of, or incorporated by reference into, this Annual Report on Form 10-K: |
|---|
| Exhibit 101.INS | XBRL Instance Document | |
|---|---|---|
| Exhibit 101.SCH | XBRL Taxonomy Extension Schema | |
| Exhibit 101.CAL | XBRL Taxonomy Extension Calculation Linkbase | |
| Exhibit 101.LAB | XBRL Taxonomy Extension Label Linkbase | |
| Exhibit 101.PRE | XBRL Taxonomy Extension Presentation Linkbase | |
| Exhibit 101.DEF | XBRL Taxonomy Extension Definition Linkbase |
| (b) | Exhibits. |
|---|
The exhibits listed on the accompanying Exhibit Index in Item 15(a)(3) are filed as part of, or are incorporated by reference into, this Annual Report on Form 10-K.
| (c) | Financial Statement Schedules. |
|---|
Reference is made to Item 15(a)(2) above.
Item 16. Form 10-K Summary
None.
SCHEDULE II - VALUATION AND QUALIFYING ACCOUNTS
Garmin Ltd. and Subsidiaries
(In thousands)
| Additions | ||||||||||||||||||||
|---|---|---|---|---|---|---|---|---|---|---|---|---|---|---|---|---|---|---|---|---|
| Balance at | Charged to | Charged to | Balance at | |||||||||||||||||
| Beginning of | Costs and | Other | End of | |||||||||||||||||
| Description | Period | Expenses | Accounts | Deductions | Period | |||||||||||||||
| Year Ended December 29, 2018: | ||||||||||||||||||||
| Deducted from asset accounts | ||||||||||||||||||||
| Allowance for doubtful accounts | $ | 4,168 | $ | 2,123 | $ | — | $ | (804 | ) | $ | 5,487 | |||||||||
| Valuation allowance - Deferred Tax Asset | 7,267 | 1,186 | — | (3,885 | ) | 4,568 | ||||||||||||||
| Total | $ | 11,435 | $ | 3,309 | $ | — | $ | (4,689 | ) | $ | 10,055 | |||||||||
| Year Ended December 31, 2017: | ||||||||||||||||||||
| Deducted from asset accounts | ||||||||||||||||||||
| Allowance for doubtful accounts(1) | $ | 14,669 | $ | 1,021 | $ | — | $ | (11,522 | ) | $ | 4,168 | |||||||||
| Valuation allowance - Deferred Tax Asset | 4,622 | 3,077 | — | (432 | ) | 7,267 | ||||||||||||||
| Total | $ | 19,291 | $ | 4,098 | $ | — | $ | (11,954 | ) | $ | 11,435 | |||||||||
| Year Ended December 31, 2016: | ||||||||||||||||||||
| Deducted from asset accounts | ||||||||||||||||||||
| Allowance for doubtful accounts | $ | 13,805 | $ | 4,137 | $ | — | $ | (3,273 | ) | $ | 14,669 | |||||||||
| Valuation allowance - Deferred Tax Asset | 2,781 | 1,966 | — | (125 | ) | 4,622 | ||||||||||||||
| Total | $ | 16,586 | $ | 6,103 | $ | — | $ | (3,398 | ) | $ | 19,291 |
| (1) | The $11.5 million deduction from the allowance for doubtful accounts during the fiscal year ended December 30, 2017 was a result of the write-off of uncollectable accounts that had previously been fully reserved. |
|---|
SIGNATURES
Pursuant to the requirements of Section 13 or 15(d) of the Securities Exchange Act of 1934, the registrant has duly caused this report to be signed on its behalf by the undersigned, thereunto duly authorized.
| GARMIN LTD. | ||
|---|---|---|
| By | /s/ Clifton A. Pemble | |
| Clifton A. Pemble | ||
| President and Chief Executive Officer |
Dated: February 20, 2019
POWER OF ATTORNEY
Know all persons by these presents, that each person whose signature appears below constitutes and appoints Clifton A. Pemble and Douglas G. Boessen and Andrew R. Etkind, and each of them, as his attorney-in-fact, with the power of substitution, for him in any and all capacities, to sign any amendments to this Annual Report on Form 10-K, and to file the same, with exhibits thereto and other documents in connection therewith, with the Securities and Exchange Commission, hereby ratifying and confirming all that said attorney-in-fact, or his substitute or substitutes, may do or cause to be done by virtue hereof.
Pursuant to the requirements of the Securities Exchange Act of 1934, this report on Form 10-K has been signed below by the following persons on behalf of the registrant and in the capacities indicated on February 20, 2019.
| /s/ Clifton A. Pemble | ||
|---|---|---|
| Clifton A Pemble | ||
| Director, President and Chief Executive Officer | ||
| (Principal Executive Officer) | ||
| /s/ Douglas G. Boessen | ||
| Douglas G. Boessen | ||
| Chief Financial Officer and Treasurer | ||
| (Principal Financial Officer and Principal Accounting Officer) | ||
| /s/ Min H. Kao | /s/ Joseph J. Hartnett | |
| Min H. Kao | Joseph J. Hartnett | |
| Executive Chairman | Director | |
| /s/ Jonathan C. Burrell | /s/ Rebecca R. Tilden | |
| Jonathan C. Burrell | Rebecca R. Tilden | |
| Director | Director | |
| /s/ Charles W. Peffer | ||
| Charles W. Peffer | ||
| Director |
Garmin Ltd.
2018 Form 10-K Annual Report
Exhibit Index
The following exhibits are attached hereto. See Part IV of this Annual Report on Form 10-K for a complete list of exhibits.