 filings.tools
Garmin 10-K 2022-12-31
Filed 2023-02-22. 23 sections, 330K characters. Original on sec.gov · Markdown · JSON
Cover and table of contents
UNITED STATES
SECURITIES AND EXCHANGE COMMISSION
Washington, D.C. 20549
FORM 10-K
| [☒] | ANNUAL REPORT PURSUANT TO SECTION 13 OR 15(d) OF THE SECURITIES EXCHANGE ACT OF 1934 |
For the fiscal year ended December 31, 2022
or
| [☐] | TRANSITION REPORT PURSUANT TO SECTION 13 OR 15(d) OF THE SECURITIES EXCHANGE ACT OF 1934 |
For the transition period from to
Commission file number 001-41118
GARMIN LTD**.**
(Exact name of registrant as specified in its charter)

| Switzerland (State or other jurisdiction of incorporation or organization) | 98-0229227 (I.R.S. Employer Identification No.) |
| Mühlentalstrasse 2 8200 Schaffhausen Switzerland (Address of principal executive offices) | N/A (Zip Code) |
Registrant’s telephone number, including area code: **+**41 52 630 1600
Securities registered pursuant to Section 12(b) of the Act:
| Registered Shares, CHF 0.10 Per Share Par Value | GRMN | New York Stock Exchange | ||
| (Title of each class) | (Trading Symbol) | (Name of each exchange on which registered) |
Securities registered pursuant to Section 12(g) of the Act: None
Indicate by check mark if the registrant is a well-known seasoned issuer, as defined in Rule 405 of the Securities Act. Yes [☑] NO [☐]
Indicate by check mark if the registrant is not required to file reports pursuant to Section 13 or Section 15(d) of the Act. YES [☐] No [☑]
Indicate by check mark whether the registrant (1) has filed all reports required to be filed by Section 13 or 15(d) of the Securities Exchange Act of 1934 during the preceding 12 months (or for such shorter period that the registrant was required to file such reports), and (2) has been subject to such filing requirements for the past 90 days. Yes [☑] NO [☐]
Indicate by check mark whether the registrant has submitted electronically every Interactive Data File required to be submitted pursuant to Rule 405 of Regulations S-T (§ 232.405 of this chapter) during the preceding 12 months (or for such shorter period that the registrant was required to submit such files). Yes [☑] NO [☐]
Indicate by check mark whether the registrant is a large accelerated filer, an accelerated filer, a non-accelerated filer, a smaller reporting company, or an emerging growth company. See the definitions of “large accelerated filer”, “accelerated filer”, “smaller reporting company”, and “emerging growth company” in Rule 12b-2 of the Exchange Act.
| Large Accelerated Filer | [☑] | Accelerated Filer | [☐] |
| Non-accelerated Filer | [☐] | Smaller reporting company | [☐] |
| Emerging growth company | [☐] |
If an emerging growth company, indicate by check mark if the registrant has elected not to use the extended transition period for complying with any new or revised financial accounting standards provided pursuant to Section 13(a) of the Exchange Act.☐
Indicate by check mark whether the registrant has filed a report on and attestation to its management’s assessment of the effectiveness of its internal control over financial reporting under Section 404(b) of the Sarbanes-Oxley Act (15 U.S.C. 7262(b)) by the registered public accounting firm that prepared or issued its audit report. ☑
If securities are registered pursuant to Section 12(b) of the Act, indicate by check mark whether the financial statements of the registrant included in the filing reflect the correction of an error to previously issued financial statements. ☐
Indicate by check mark whether any of those error corrections are restatements that required a recovery analysis of incentive-based compensation received by any of the registrant’s executive officers during the relevant recovery period pursuant to §240.10D-1(b). ☐
Indicate by check mark whether the registrant is a shell company (as defined in Rule 12b-2 of the Exchange Act). YES [☐] NO [☑]
Aggregate market value of the common shares held by non-affiliates of the registrant as of June 25, 2022 (based on the closing price of the registrant's common shares on the New York Stock Exchange for June 24, 2022) was approximately $15,461,000,000.
Number of shares outstanding of the registrant’s common shares as of February 17, 2023:
Registered Shares, CHF 0.10 par value – 191,359,482 (excluding treasury shares)
Documents incorporated by reference:
Portions of the following document are incorporated herein by reference into Part III of the Form 10-K as indicated:
| Document | Part of Form 10‑K into which Incorporated |
| Company's Definitive Proxy Statement for the 2022 Annual Meeting of Shareholders which will be filed no later than 120 days after December 31, 2022. | Part III |
Garmin Ltd.
2022 Form 10-K Annual Report
Table of Contents
CAUTIONARY STATEMENT WITH RESPE****CT TO FORWARD-LOOKING COMMENTS
The discussions set forth in this Annual Report on Form 10-K contain statements concerning potential future events. Such forward-looking statements are based upon assumptions by the Company’s management, as of the date of this Annual Report, including assumptions about risks and uncertainties faced by the Company. In addition, management may make forward-looking statements orally or in other writings, including, but not limited to, in press releases, in the annual report to shareholders and in the Company’s other filings with the Securities and Exchange Commission. Readers can identify these forward-looking statements by their use of such verbs as “expects,” “anticipates,” “believes” or similar verbs or conjugations of such verbs. Forward-looking statements include any discussion of the trends and other factors that drive our business and future results in “Item 7. Management’s Discussion and Analysis of Financial Conditions and Results of Operations.” Readers are cautioned not to place undue reliance on these forward-looking statements, which speak only as of their date. If any of management’s assumptions prove incorrect or should unanticipated circumstances arise, the Company’s actual results could materially differ from those anticipated by such forward-looking statements. The differences could be caused by a number of factors or combination of factors including, but not limited to, those factors identified under Item 1A “Risk Factors.” Readers are strongly encouraged to consider those factors when evaluating any forward-looking statements concerning the Company. Except as may be required by law, the Company does not undertake to update any forward-looking statements in this Annual Report to reflect future events or developments.
Part I
Item 1. Business
Company Overview
For more than 30 years, Garmin Ltd. and subsidiaries (collectively, the “Company” or “Garmin”) have pioneered new wireless devices, many of which feature location technology such as Global Positioning System (GPS), and applications that are designed for people who live an active lifestyle. Garmin serves five primary markets: fitness, outdoor, aviation, marine, and auto. We design, develop, manufacture, market, and distribute a diverse family of hand-held, wearable, portable, and fixed-mount GPS-enabled products and other navigation, communications, sensor-based and information products for these markets. Since the inception of its business, Garmin has delivered over 266 million products, which included more than 15 million products delivered during fiscal 2022.
Available Information
Garmin’s annual report on Form 10-K, quarterly reports on Form 10-Q, current reports on Form 8-K, proxy statement and Forms 3, 4 and 5 filed by Garmin’s directors and executive officers and all amendments to those reports will be made available free of charge through the Investor Relations section of Garmin’s website (http://www.garmin.com) as soon as reasonably practicable after such material is electronically filed with, or furnished to, the Securities and Exchange Commission (the “SEC”). The SEC maintains a website (http://www.sec.gov) that contains reports, proxy and information statements, and other information regarding issuers that file electronically with the SEC. The reference to Garmin’s website address does not constitute incorporation by reference of the information contained on this website, and such information should not be considered part of this report on Form 10-K or in any other report or document we file with the SEC, and any references to our website are intended to be inactive textual references only.
This discussion of Garmin should be read in conjunction with, and is qualified by reference to, “Management's Discussion and Analysis of Financial Condition and Results of Operations” under Item 7 herein and the information set forth in response to Item 101 of Regulation S-K in such Item 7 is incorporated herein by reference in partial response to this Item 1.
Products
Garmin offers a broad range of solutions across its reported segments as outlined below. In general, Garmin believes that its products are known for their value, high performance, ease of use, innovation, and ergonomics.
Many of the Company’s products utilize Global Positioning System (GPS) and other global navigation satellite systems (GNSS) receivers to support product features such as navigation, global positioning, and tracking. GPS is a United States owned satellite network constellation that supports global positioning, communication, and navigation, providing precise geographic location and related data to both commercial and government GPS receivers. Access to and use of the GPS systems commercial signal bands is provided free of charge.
In addition to GPS, Garmin products utilize other global navigation satellite systems (GNSS) including the Russian Global Navigation Satellite System (GLONASS), the European Union Galileo system (Galileo), and the Chinese BeiDou Navigation Satellite System (BDS), and satellite based augmentation systems (SBAS) including the U.S. Wide Area Augmentation System (WAAS), the Japanese MTSAT-based Satellite Augmentation System (MSAS) and Quasi-Zenith Satellite System (QZSS), and the European Geostationary Navigation Overlay Service (EGNOS) aviation Safety of Life (SoL) service.
Some of Garmin’s products utilize a combination of global navigation satellite systems to improve navigational fix, which results in improved accuracy.
On a subscription basis, certain Garmin products offer access to private satellite networks such as the Iridium satellite network, a synchronized constellation of 66 low Earth orbit (LEO) satellites offering global data communication coverage. Iridium’s use of this constellation gives it the ability to span the entire globe, offering 100 percent coverage worldwide to enable reliable satellite-based communication.
Fitness
Garmin offers a broad range of products designed for use in health, wellness, and fitness activities. Garmin currently offers the following product categories within the Fitness segment to consumers around the world:
Running and Multi-sport Watches: Garmin running and multi-sport watches are offered under the Forerunner® product series. The Forerunner series offers GPS-enabled watches with features unique to each model. Depending on the model, features include wrist-based heart rate monitoring, wrist-based pulse oximeter, music storage capabilities, mapping capabilities, LTE Connectivity, solar charging, and Garmin Pay™ contactless payment.
Cycling Products: Garmin cycling products include cycling computers (with solar charging on the latest models), power meters, bike radars, cameras, and smart lights. Additionally, Garmin offers Tacx® indoor training equipment including smart and basic trainers, and a smart bike.
Activity Tracking and Smartwatch Devices: Garmin offers a wide range of activity tracking devices and smartwatch devices. The Garmin product offerings include activity tracking fitness bands, GPS-enabled smartwatches, and fashion-forward hybrid smartwatches with analog style displays. The activity tracking and smartwatch devices offered by Garmin are the vívomove® series, vívoactive® series, vívosmart® series, vívofit® series, Venu® series, Lily® series, and Bounce™ series. Each series of activity tracking and smartwatch devices offered has unique features, all to enhance and promote healthy and active lifestyles. Features of the activity tracking and smartwatch devices, depending on the series and model, include Garmin Pay, music storage capabilities, LTE connectivity, and 24/7 health monitoring.
Fitness and Cycling Accessories: Garmin offers a wide range of fitness and cycling accessories including chest strap heart rate monitors, blood pressure monitors, cycling speed and cadence sensors, and smart scales.
Garmin Connect and Garmin Connect Mobile: Garmin Connect™ and Garmin Connect™ Mobile are web and mobile platforms where users can track and analyze their fitness, activities and workouts, and wellness data. In addition, users can share their accomplishments, create training groups and group challenges, and get feedback and encouragement from the Connect community.
Connect IQ: The Connect IQ™ application development platform enables third parties to create a variety of applications that run on a wide assortment of Garmin devices. Connect IQ provides developers with an easy-to-use software development kit (SDK) to facilitate development efforts in creating watch faces, applications, widgets, and data fields. These third-party applications are available for download by Garmin users via their mobile phone or computer and run on their compatible Garmin wearable, bike computer, golf device, or outdoor handheld.
Outdoor
Garmin offers a broad range of products designed for use in outdoor activities. Garmin currently offers the following product categories within the Outdoor segment to consumers around the world:
Adventure Watches: Garmin adventure watches include the fēnix® series, Epix™ series, Instinct® series, tactix® series, the Enduro™ series, the Descent™ series, and the MARQ® collection. The fēnix and Epix series offer premium multisport smartwatches with features such as wrist-based biometrics, music storage capabilities, preloaded full-color purpose-built adventure mapping of topography, ski resorts, and golf courses, as well as Garmin Pay™. The fēnix series also offers solar charging depending on model, while the Epix series features a vivid, always-on AMOLED display. The Instinct series offers a rugged and reliable outdoor GPS smartwatch with built-in sports apps, heart rate sensor, smart connectivity, wellness data, as well as analog movement and solar charging, depending on model. The tactix series provides preloaded full-color topographical maps and tactical-inspired features, and solar charging, depending on model. The Enduro series offers additional battery and solar charging enhancements to extend battery life, along with advanced training features and competition modes for extreme endurance athletes. The Descent series are watch style dive computers that offer divers GPS navigation, multiple dive modes, support for up to six gasses, integrated air pressure monitoring, and solar charging, depending on model. The MARQ series is a collection of luxury smart tool watches with premium materials and features unique to each watch.
Outdoor Handhelds: Garmin offers outdoor handhelds under the Rino®, Montana®, eTrex®, GPSMAP®, Foretrex®, and inReach® product lines. Handhelds range from basic waypoints navigation capabilities to advanced color touchscreen devices offering barometric altimeter, 3-axis compass, camera, preloaded maps, wi-fi and smartphone connectivity, two-way satellite communication and other features. Each series of products is designed to serve unique niche markets. Handhelds with inReach include global satellite technology which, when combined with an active service plan, offers 2-way text messaging, weather forecasts, and S.O.S. capabilities while anywhere in the world. These S.O.S. capabilities are supported 24/7 by our professionally trained associates at Garmin Response, our global emergency response coordination center.
Golf Devices and Mobile App: Garmin golf devices are offered under the Approach® product line. The Approach series includes handhelds, wearables, club sensors, launch monitors, golf simulators, and laser ranging devices. Over 43,000 preloaded worldwide golf courses are available to be utilized on certain Garmin devices. Handheld and wearable golf devices provide yardage distances to the front, back, and middle of the green. In addition to course maps, the Approach R10 portable launch monitor provides swing metrics including estimated carry and roll, club head speed, ball speed, smash factor, and swing tempo, as well as the ability to play a simulated round of any of our 43,000 worldwide mapped courses when paired with the Garmin Golf™ mobile app. The mobile app also offers scoring, shot tracking, and performance tracking features, in addition to the Home Tee Hero virtual round simulator for subscribers.
Dog Tracking and Training Devices: Garmin offers a variety of dog tracking and training devices, including those under the Alpha®, PRO, BarkLimiter™, and Delta® product lines.
Aviation
Garmin designs, manufactures, and markets a wide range of innovative aircraft avionics solutions to the broad and diverse aviation sector. Avionics are sold directly into aircraft original equipment manufacturer (OEM) applications as well as through Garmin’s worldwide dealer network for retrofit installations on existing aircraft.
Garmin has developed growth-minded products and technologies serving general aviation, business aviation, rotorcraft, and experimental/light sport markets. Our solutions are available for all aircraft categories and classes; from small piston and electric-powered general aviation aircraft, to large business jet aircraft, as well as a wide-ranging variety of helicopters serving critical public service as well as oil and gas missions, to name a few.
Garmin also provides innovative products and software-as-a-service solutions to other growth markets such as commercial air-carrier, military and defense, electric aircraft, and the rapidly evolving Advanced Air Mobility / eVTOL space. By offering products such as Commercial Off-The-Shelf (COTS) and mission-optimized solutions to military and defense contractors/customers, and products tested and optimized for high duty cycle commercial aviation operations, Garmin is emerging as a strong competitor in these business arenas.
Garmin currently offers the following products, systems, and services to the global aviation market:
Integrated Flight Decks: Known for defining the integrated flight deck (IFD) space in general aviation and light business aviation applications, Garmin offers OEM and retrofit IFD systems scaled for any size aircraft and rotorcraft, featuring communication and navigation, weather information, terrain and traffic awareness and avoidance, aircraft performance, and automated safety solutions.
Electronic Flight Displays and Instrumentation: Garmin flight display and instrument solutions can serve as primary or back-up systems, which also provide a wealth of valuable information in the cockpit, dramatically increasing situational awareness and capability.
Navigation and Communication Products: Garmin offers a wide range of integrated and stand-alone GPS navigation and very high frequency (VHF) radio communication products, with a variety of capabilities, available for all market segments.
Automatic Flight Control Systems and Safety-Enhancing Technologies: Garmin offers scalable flight control systems with unique integrated safety features for aircraft and rotorcraft. Our Autopilots, and Autonomí™ safety-enhancing solutions cover a wide spectrum of aircraft, from large-cabin business jets and helicopters, to light general aviation aircraft. Garmin’s award-winning Autoland system will autonomously land the aircraft in the event the pilot is not able to do so, and Smart Glide™ will assist a pilot to get to the nearest airport in the event of the loss of engine power. We also offer an innovative smart rudder bias system that can help the pilot maintain control of a twin-engine aircraft in the event of an engine failure.
Audio Control Systems: Garmin produces a broad array of cutting-edge audio systems, including panel-mount and remote-mounted units, incorporating features such as Bluetooth connectivity, voice command technology, and integrated intercoms.
Engine Indication Systems: Garmin offers a variety of advanced engine indication systems for piston and turbine-powered aircraft with comprehensive data-logging capabilities as well as wireless data offloading, cloud storage and analysis capability through our flyGarmin.com online services portal.
Traffic Awareness and Avoidance Solutions: Garmin offers an array of traffic advisory and collision avoidance systems, including TAS and TCAS / ACAS solutions, with applications in all types of aircraft.
ADS-B and Transponders: Garmin offers a full lineup of ADS-B and transponder solutions, including ADS-B “Out” compliant solutions as well as ADS-B “In” and Bluetooth capable units that allow pilots to connect to their mobile device to display ADS-B traffic and weather.
Weather Information and Avoidance Solutions: Garmin offers multiple weather solutions, including onboard Doppler digital radar products, along with satellite-based SiriusXM, ground-based ADS-B, as well as Garmin Connext® global satellite weather options.
Datalink and Connectivity: Garmin datalink and connectivity solutions allow pilots to download global weather data, communication via text/voice, as well as select mobile apps to transfer flight plans, manage database subscriptions, and stream weather and traffic data from installed avionics solutions.
Portable GPS Navigators and Wearables: Garmin offers portable GPS navigators, smartwatches for pilots, satellite communicators, and portable traffic and weather solutions, providing pilots tools they can take with them from aircraft to aircraft.
Services: Garmin offers a variety of services products to the aviation market. Web and mobile app-based products offered via FltPlan.com and our Garmin Pilot™ electronic flight bag application, help pilots plan, file, fly, and log flights and offer a wealth of information across all phases of flight. Business and commercial aviation customers also benefit from our safety management system, runway analysis and performance data, weight and balance, obstacle clearance, load planning, and navigation database solutions. Garmin continues to provide industry-leading product support, and offers a wide selection of databases, training products, extended warranties, and subscription services for all aviation segments.
Marine
Garmin is a leading manufacturer of recreational marine electronics and offers a broad range of products. Garmin currently offers the following product categories within the Marine segment to consumers around the world:
Chartplotters and Multi-Function Displays (MFDs): Garmin offers numerous chartplotters/MFDs under the GPSMAP® and ECHOMAP™ product lines. The offerings range from 4-inch portable and fix-mounted products to 24-inch fully integrated Glass Helm offerings and include wireless connectivity to the ActiveCaptain® mobile app.
Cartography: Garmin is a premier supplier of cartography for the recreational marine market. Including the Garmin-owned Navionics® branded charting products, Garmin is a leading supplier of recreational marine content for most major chartplotters and MFDs on the market. Garmin’s cartography features the patented Auto Guidance+™ routing technology.
Fishfinders: Garmin offers an advanced line of fishfinders, the Striker™ series, which incorporates GPS technology enabling Garmin Quickdraw™ Contours, and wireless features through the ActiveCaptain and StrikerCast mobile apps.
SONAR: Garmin also offers the Panoptix™ all seeing sonar smart transducer line. Panoptix LiveScope™ provides real-time, high-resolution images that can be seen in downward, perspective, and forward-looking views for locating the fish and seeing what is coming before you get there. The Panoptix line also offers detailed 3D underwater views of fish and structure under your boat. Garmin’s CHIRP “black-box” sounders and “smart transducers” interface with Garmin MFDs to enhance their utility by providing the deep-water sounders and fishfinder functions in a remote mounted package.
Autopilot Systems: Garmin offers full-featured marine autopilot systems designed for sailboats and powerboats. The systems incorporate such features as Garmin’s patented Shadow Drive™ technology, which automatically disengages the autopilot if the helm is turned, remote steering and speed control. Garmin has also introduced steer-by-wire autopilot capabilities for various types and manufacturers’ steering systems.
RADAR: Garmin offers high-tech solid state Fantom™ radar with MotionScope™ Doppler technology, lowering system power consumption and increasing reliability, while greatly improving situational awareness of the captain. Fantom radars are available in both radome and open array radar products with compatibility to any network-compatible Garmin chartplotter. Garmin also offers a full line of magnetron radars up to 25kW of transmit power.
Instruments: Garmin offers NMEA 2000 and NMEA 0183 compliant instrument displays and sensors that show data from multiple remote sources on one screen.
VHF Communication Radios: Garmin offers a full line-up of marine VHF radios and Automatic Identification System (AIS) transceivers with the latest feature sets including integrated GPS receivers for the communication needs of all types of mariners. Garmin radios are NMEA 2000 compatible and offer multi-station support, and monitor all AIS channels.
Handhelds and Wearable Devices: Garmin offers the quatix® series wearable, GPS-enabled smartwatches designed for mariners, which include marine features for navigation, sailing, stereo control, autopilot functions, and solar charging, depending on model. Garmin also offers floating marine GPS handhelds with wireless data transfer between compatible units and preloaded cartography. Some handhelds contain built-in InReach® satellite communication and support Connect IQ™ applications.
Sailing: Garmin has integrated many basic and advanced sailing features into our MFD and instrument systems. These Garmin SailAssist™ features include enhanced wind rose with true and apparent wind data, POLAR tables, pre-race guidance, synchronized race timer, virtual starting line, time to burn and lay line data fields.
Entertainment: Garmin’s entertainment brand, Fusion®, consists of marine audio head units, speakers and amplifiers. These products are designed specifically for the marine or RV environments, offering premium sound quality and supporting many connectivity options for integrating with MFDs, smartphones, and Garmin wearables.
Digital Switching: Garmin offers digital switching products under the EmpirBus™ product line. The Garmin EmpirBus products provide power distribution and control solutions for marine and RV applications which enable advanced logic controls and smart electrical systems to enhance features in a boat or RV. The system features fully customizable graphics and user interface that can be controlled through Garmin’s marine multi-function displays and RV OEM products.
Trolling Motors: Garmin offers the Force® Trolling Motor, a powerful, efficient scissor-lift style trolling motor with built-in CHIRP and Ultra High-Definition ClearVü™ and SideVü™ sonar. The Force product line also connects wirelessly to Garmin chartplotters/MFDs to provide navigation, autopilot, and anchor lock integration.
Auto
Garmin designs and develops products for use in the auto market that are offered to customers around the world.
Consumer Auto
Personal Navigation Devices (PNDs): Garmin is a leading manufacturer of PNDs, which include specialized features dedicated to the following vehicle and driver needs:
Auto: The Drive series offers traditional PNDs for a wide range of consumers.
Motorcycle: The zūmo® series offers motorcycle-specific features.
Truck: The dēzl™ series offers over-the-road trucking features.
RV: The RV series offers features specific to the RV enthusiast.
Offroad: Tread® is a line of rugged, all-terrain navigators with mapping specific for off-road guidance for overlanding, off-roading, and Baja racing.
Motorsports: The Garmin Catalyst™ is an industry-first racing coach and driving performance optimizer.
Camera: The Garmin Dash Cam™ series offers GPS-enabled dash cams that provide high-quality video recording, automatic saving of video footage with G-sensor incident detection, and forward collision and lane departure warnings. The Garmin Dash Cam Live product also offers LTE connectivity, enabling anytime access to live view and videos saved to Garmin Vault cloud storage through the Garmin Drive™ mobile app. Dash cams are offered as compact, standalone cameras that can be mounted to a car windshield or are integrated into various navigators. Garmin also offers wireless backup cameras that can be utilized with compatible PNDs to display camera footage behind the vehicle.
Auto OEM
Original Equipment Manufacturer (OEM) Solutions: Garmin has cultivated key relationships with leading automobile manufacturers to be the provider of a variety of hardware and software solutions for their vehicles. These range from embedded domain controllers and infotainment units that provide a broad range of functionality, to integrated cameras, in cabin monitoring and gaming solutions. These support not only the infotainment system in the vehicle, but also key advanced driver-assistance systems (ADAS) functionality as well.
Sales and Marketing
Garmin’s distribution strategy is to support a broad and diverse network of sales channels for our products while maintaining high quality standards to ensure end-user satisfaction. Our products are sold through a variety of indirect distribution channels, including a large worldwide network of independent retailers, dealers, distributors, installation and repair shops, as well as original equipment manufacturers (OEMs). We also sell our products and services directly through our online webshop (garmin.com), subscriptions for connected services, and our own retail stores. During 2022, the Company’s net sales through its direct distribution channels accounted for greater than 10% of total net sales. Marketing support is provided geographically from Garmin’s offices around the world.
Competition
We operate in highly competitive markets, though competitive conditions vary among our diverse target markets and geographies. Garmin believes the principal competitive factors impacting the market for its products are design, functionality, quality and reliability, customer service, brand, price, time-to-market and availability. Garmin believes that it generally competes favorably in each of these areas and as such, is generally a significant competitor in each of our major markets.
Garmin believes that its principal competitors for fitness products are Amazon, Apple, Bryton, Coros, Elite, Fitbit (Google), Huawei, Polar, Samsung, SRAM, Suunto, Wahoo Fitness, Whoop, Xiaomi, Zepp Health, and Zwift. Garmin believes that its principal competitors for outdoor product lines are Casio, Coros, Dogtra, Globalstar, Shearwater Research, SportDOG, Suunto, TAG Heuer, Tissot, Trackman, Vista Outdoor, and Zoleo. Garmin considers its principal avionics competitors to be Aspen Avionics, CMC Electronics, Dynon Avionics, ForeFlight, Genesys Aerosystems, Honeywell Aerospace & Defense, Innovative Solutions and Support Inc., Jeppesen (Boeing), L-3 Avionics Systems, Collins Aerospace (Raytheon), Safran, Thales, and Universal Avionics Systems Corporation. For marine products, Garmin believes that its principal competitors are Furuno, Johnson Outdoors, Navico (Brunswick), and Raymarine (Teledyne). Garmin believes that its principal competitors for consumer automotive products are Rand McNally and TomTom. Garmin believes that its principal competitors for auto OEM infotainment solutions are Alpine Electronics, Aptiv, Bosch, Continental, Harman (Samsung), Mitsubishi, and Panasonic.
Research and Development
Garmin’s product innovations are driven by its strong emphasis on research and development and the close partnership between Garmin’s engineering and manufacturing teams. Garmin’s products are created by its engineering and development staff. Garmin’s manufacturing staff includes manufacturing process engineers who work closely with Garmin’s design engineers to ensure manufacturability and manufacturing cost control for its products. Garmin’s development staff includes industrial designers, as well as software engineers, electrical engineers, mechanical engineers, and cartographic engineers. Garmin believes the industrial design of its products has played an important role in Garmin’s success.
Manufacturing and Operations
Garmin believes one of its core competencies and strengths is its vertically integrated manufacturing capabilities at its Taiwan facilities in Xizhi, Jhongli, LinKou, and Xinshi, its China facility in Yangzhou, its Netherlands facility in Oegstgeest, its Poland facility in Wroclaw, and at its U.S. facilities in Olathe, Kansas and Salem, Oregon. Garmin believes that its operation of its own manufacturing facilities and distribution networks provides significant capability and flexibility to address the breadth and depth of resources necessary to serve its diverse products and markets.
Specifically, Garmin believes that the vertical integration of its manufacturing capabilities provides advantages to product cost, quality, and time to market.
Cost: Garmin’s manufacturing resources rapidly and iteratively prototype designs, concepts, products and processes, achieving higher efficiency and resulting in lower cost. Garmin’s vertical integration approach enables leveraging of manufacturing resources across high, mid, and low volume products. Sharing of these resources across product lines favorably affects Garmin’s costs to produce its range of products, with lower volume products realizing the economies of scale of higher volume products. The ownership and integration of its resources allows Garmin to optimize the design for manufacturing of its products, yielding improved cost.
Quality: Garmin’s automation and advanced production processes provide in-service robustness and consistent reliability standards that enable Garmin to maintain strict process and quality control of the products manufactured, thereby improving the overall quality of our products. Additionally, the immediate feedback throughout the manufacturing processes is shared with the development teams, providing integrated continuous improvement throughout design and supply chain.
Garmin’s design, manufacturing, distribution, and service functions in its U.S., Taiwan, China, and U.K. facilities are certified to ISO 9001, an international quality standard developed by the International Organization for Standardization (ISO). Garmin’s automotive operations in Taiwan, China, U.K., and Olathe have achieved IATF 16949 certification, a quality standard for automotive suppliers. Garmin’s Olathe, Kansas and Salem, Oregon aviation operations in the U.S. have achieved certification to AS9100, a quality standard for the aviation industry. Garmin has also implemented multiple health and safety management systems and achieved certification to the ISO 45001 standard for Health and Safety Management at facilities in the U.S., Taiwan, Poland, and China.
Time to Market: Garmin uses multi-disciplinary teams of design engineers, process engineers, and supply chain specialists to develop products, allowing them to quickly move from concept to manufacturing. This integrated ownership provides inherent flexibility to enable faster time to market.
Materials
Garmin purchases components from a large number of qualified suppliers. Although many components essential to Garmin’s business are generally available from multiple sources, certain key components are currently obtained by the Company from single or limited sources, which subjects Garmin to supply and pricing risks. For these components, we have limited near-term flexibility to use other suppliers if a current vendor becomes unavailable or is unable to meet our requirements. While extended disruptions at these suppliers could impact our ability to meet customer demand due to component shortages or increased lead times, or cause us to incur higher product costs, we believe these potential disruptions would not disproportionately disadvantage us relative to our competitors.
Seasonality
Our net sales are subject to seasonal fluctuation. Sales of our fitness and outdoor products are generally higher in the fourth quarter due to increased demand during the holiday buying season, and, to a lesser extent, the second quarter due to increased demand during the spring and summer season. Sales of our marine and consumer auto products are generally higher in the second quarter. Sales in these segments are also influenced by the timing of the release of new products. Our aviation and auto OEM products do not experience much seasonal variation, but are more influenced by the timing of aircraft certifications, regulatory mandates, auto program manufacturing, and the release of new products when the initial demand is typically the strongest.
Intellectual Property
Our success and ability to compete is dependent in part on our proprietary technology. We rely on a combination of patent, copyright, trademark and trade secret laws, as well as confidentiality agreements, to establish and protect our proprietary rights. In addition, Garmin often relies on licenses of intellectual property for use in its business.
As of January 5, 2023, Garmin has been issued over 1,800 patents throughout the world and holds more than 1,080 trademark registrations. The duration of patents varies in accordance with the provisions of applicable local law. We believe that our continued success depends on the intellectual skills of our employees and their ability to continue to innovate. Garmin will continue to file and prosecute patent applications when appropriate to attempt to protect Garmin’s rights in its proprietary technologies.
There is no assurance that our current patents, or patents which we may later acquire, may successfully withstand any challenge, in whole or in part. It is also possible that any patent issued to us may not provide us with any competitive advantages, or that the patents of others will preclude us from manufacturing and marketing certain products. Despite our efforts to protect our proprietary rights, unauthorized parties may attempt to copy aspects of our products or to obtain and use information that we regard as proprietary. Litigation may be necessary in the future to enforce our intellectual property rights, to protect our trade secrets, to determine the validity and scope of the proprietary rights of others or to defend against claims of infringement or invalidity.
Environmental Matters
Garmin’s operations are subject to various environmental laws, including laws addressing air and water pollution and management of hazardous substances and wastes. Substantial noncompliance with applicable environmental laws could have a material adverse effect on our business. Capital expenditures for environmental controls are included in our normal capital budget. Historically, capital expenditures associated with environmental controls have not been material and compliance with environmental laws has not had a material impact on the Company’s competitive position.
Many of Garmin's products are subject to laws relating to the chemical and material composition of our products and their energy efficiency. Garmin is also subject to extended producer responsibility laws and regulations requiring manufacturers to be responsible for collection, recovery, and recycling of wastes from certain electronic products. Historically, compliance with environmental laws has not had a material impact on our profitability. We have processes to monitor environmental law changes and to evaluate the potential impact of such laws to our business, but the impact of future enactment of environmental laws cannot yet be fully determined and could be substantial.
Garmin has a global environmental policy and is committed to working to protect the environment throughout various aspects of our business. Garmin has implemented multiple environmental management systems and achieved certification to the ISO 14001 standard for Environmental Management at facilities in the U.S., U.K., Taiwan, Poland, and China.
Garmin strives to reduce our environmental impact by increasing our environmental sustainability efforts. Garmin is committed to reducing greenhouse gas emissions through direct carbon emissions reduction and elimination strategies. Garmin has several locations that utilize renewable electricity, including facilities in Olathe, Kansas. Garmin also has made efforts to reduce waste and increase recycling and composting.
Human Capital
Successful execution of our strategy is dependent on attracting, developing, and retaining key employees and members of our management team. To facilitate talent attraction and retention, we strive to provide opportunities for our employees to grow and develop in their careers, supported by generous compensation and benefits, and through programs that build connections between our employees and their communities.
As of December 31, 2022, the Company had approximately 19,700 full and part-time employees worldwide, of whom approximately 6,600 were in the Americas region, 10,500 were in APAC (Asia Pacific and Australian Continent), and 2,600 were in EMEA (Europe, the Middle East, and Africa). Garmin’s vertical integration model enables us to provide a variety of opportunities across many different professions including engineering, human resources, information technology, marketing, sales, and operations. The Company’s products are created by its engineering and development staff, which numbered approximately 5,500 people worldwide as of December 31, 2022. Garmin’s manufacturing staff, which numbered approximately 8,900 people worldwide as of December 31, 2022, includes manufacturing process engineers who work closely with Garmin’s design engineers to ensure manufacturability and manufacturing cost control for its products.
Garmin respects the right of all employees to form and join an association to represent their interests as employees, to organize, and to bargain collectively or individually. We also respect any employee’s choice to refrain from joining a union. Except for some of Garmin’s employees in Sweden, none of Garmin’s employees are represented by a labor union and none of Garmin's North American or Taiwan employees are covered by a collective bargaining agreement. We believe our efforts in managing our workforce have been effective, as evidenced by a strong company culture and positive relations between the Company and our employees.
We offer a range of generous benefits to our employees that enable us to attract and retain leading talent. In addition to salaries, these programs (which vary by country/region) include stock compensation, savings plans, healthcare and insurance benefits, health savings and flexible spending accounts, paid time off, family leave, and an Employee Stock Purchase Plan, which provides employees an opportunity to acquire company ownership for a discounted price. We also invest significant resources in our talent development programs to provide employees with the training and education they need to help achieve their career goals, build relevant skills, and lead their organizations. Employee Resource Groups provide opportunities for employees to connect, network, and become involved in community engagement initiatives.
We support local community engagement initiatives where we have a business presence, and we provide opportunities for employees to give back to those communities. One such initiative is through active engagement in Science, Technology, Engineering, and Math (“STEM”) community outreach programs. Our strategic aim in these educational programs is to educate and encourage local students to pursue careers in the engineering field, especially students in underrepresented groups, which we believe benefits not only our company but the overall industry.
Item 1A. Risk Factors
The risks described below are not the only ones facing our company. Additional risks and uncertainties not presently known to us or that we currently believe to be immaterial may also impair our business operations. If any of the following risks occur, our business, financial condition or operating results could be materially adversely affected.
Risks Related to the Company
If we are not successful in the continued development, timely manufacture, and introduction of new products or product categories, overall demand for our products could decrease to the extent that lost sales and profits are not entirely offset.
We expect that a significant portion of our future revenue will continue to be derived from sales of newly introduced products. The market for our products is characterized by rapidly changing technology, evolving industry standards and changes in customer needs. If we fail to introduce new products, or to modify or improve our existing products, in response to changes in technology, industry standards or customer needs, our products could rapidly become less competitive or obsolete. We must continue to make significant investments in research and development in order to continue to develop new products, enhance existing products and achieve market acceptance for such products. However, there can be no assurance that development stage products will be successfully completed or, if developed, will achieve significant customer acceptance.
If we are unable to successfully develop and introduce competitive new products, and enhance our existing products, our future results of operations would be materially adversely affected. Our pursuit of necessary technology may require substantial time and expense. We may need to license new technologies to respond to technological change. These licenses may not be available to us on terms that we can accept or may materially change the gross profits that we are able to obtain on our products. We may not succeed in adapting our products to new technologies as they emerge. Development and manufacturing schedules for technology products are difficult to predict, and there can be no assurance that we will achieve timely initial customer shipments of new products. The timely availability of these products in volume and their acceptance by customers are important to our future success. Any future challenges related to new products, whether due to product development delays, manufacturing delays, supply chain constraints, lack of market acceptance, delays in regulatory approval, or otherwise, could have a material adverse effect on our results of operations.
If we are unable to compete effectively with existing or new competitors, the associated loss of competitive position could result in price reductions, fewer customer orders, reduced margins and loss of market share.
The markets for many of our products and services are highly competitive, and we expect competition to increase in the future. Some of our competitors have significantly greater financial, technical and marketing resources than we do. These competitors may be able to replicate certain features offered by our products and services or respond more rapidly to emerging technologies or changes in customer requirements. They may also be able to devote greater resources to the development, promotion and sale of their products or secure better product positioning with retailers. Increased competition could result in price reductions, fewer customer orders, reduced margins and loss of market share. Our failure to compete successfully against current or future competitors could seriously harm our business, financial condition and results of operations.
Maturation or contraction of the market for wearable devices or categories of these devices could adversely affect our revenue and profits.
We have experienced periods of annual growth in sales and profits in our outdoor and fitness segments, which have benefited from increased sales of wearable devices. However, we have recently experienced declines in sales and profits in our fitness segment. If the overall wearable device market declines, or categories of devices within the wearable device market decline significantly, our business, financial condition or operating results could be materially adversely affected.
We have made and expect to continue making significant investments in the auto OEM operating segment, which will continue to negatively impact total Company profits and may negatively impact shareholder value if the operating segment fails to become profitable.
We have been awarded several tier-one and tier-two auto OEM supplier contracts. To fulfill the associated program commitments, we have invested significantly in facilities, research and development, and other operating expenses and expect to continue doing so. Operating margins associated with these auto OEM programs will negatively impact consolidated operating margin as auto OEM revenue increases as a percentage of consolidated revenue. If we are not successful in winning additional contracts and substantially leveraging our past and future investments, operating losses in the auto OEM segment will continue to negatively impact total Company profits and may negatively impact shareholder value. We may incur substantial restructuring costs if we are unable to generate profits from auto OEM contracts.
We depend on third party suppliers and licensors, some of which are sole source, for technology and components used in our products. Our production and business would be seriously harmed if these suppliers or licensors are not able to meet our demand and alternative sources are not available, or if the costs of components rise.
We are dependent on third party suppliers for various components used in our current products. Some of the components that we procure from third party suppliers include semiconductors and electroluminescent panels, liquid crystal displays, memory chips, batteries and microprocessors. The availability of high-quality components at reasonable cost is essential to the successful production and sale of our products. Some components we use are from sole source suppliers.
We have and may continue to experience shortages of certain components as well as delays in procuring certain components. In addition, a shortage in supply of components may result in an increase of the costs of procuring these components. If suppliers are unable to meet our demand for components on a timely basis or if we are unable to obtain components from an alternative source, or if the price of alternative components is prohibitive, our ability to maintain timely and cost-effective production of our products would be seriously harmed.
Our products are also dependent on certain licensed technology and content. If we are unable to continue sourcing such technology and content from our licensors and are unable to obtain an alternative source, or if our relationships with our licensors change detrimentally, our ability to provide certain features in our products would be seriously harmed.
Public health emergencies or outbreaks of epidemics, pandemics, or contagious diseases have had and will likely continue to have significant impacts on our business.
Widespread public health emergencies or outbreaks of epidemics, pandemics, or contagious diseases, such as the COVID-19 pandemic, have had, and could continue to have, significant impacts on our business. The COVID-19 pandemic continues to evolve, creating disruption and uncertainty around the world, which has resulted in, and we expect will continue to result in, a change in overall demand for certain of our products and other operational impacts. There are unknown factors, such as the duration and severity of the pandemic, evolving variants of the virus that causes COVID-19 and the efficacy of vaccines against those variants, the nature and length of actions ta
Showing the first 8K of 62K characters. Open the full section
Item 1B. Unresolved Staff Comments
None.
Item 2. Properties
Garmin and its subsidiaries own a majority of their principal properties and lease certain other properties. Depending on location, the properties could be used for manufacturing, warehousing, research and development, office space, or a combination of activities. Garmin’s principal properties are described below:
Garmin International, Inc. owns and occupies facilities of approximately 1,990,000 square feet on approximately 107 acres at 1200 East 151st Street, Olathe, Kansas, U.S. where the majority of product design and development work is conducted, the majority of aviation panel-mount products are manufactured, and products are warehoused and supported for North, Central and South America. The 1,990,000 square feet includes a 775,000 square foot manufacturing and distribution center. In connection with the bond financings for the facility in Olathe and the expansions of that facility, the City of Olathe holds the legal title to the Olathe facilities, which are leased to Garmin’s subsidiaries by the City. Upon the payment in full of the outstanding bonds, the City of Olathe is obligated to transfer title to Garmin’s subsidiaries for a nominal sum. Garmin International, Inc. has purchased all the outstanding bonds and expects to continue to hold the bonds until maturity in order to benefit from property tax abatement.
Garmin International, Inc. leases 148,000 square feet of land at New Century Airport at 1 New Century Pkwy, Gardner, Kansas, U.S. under a ground lease and occupies two aircraft hangars on this land, one of which is owned (47,000 square feet) and the other leased (53,000 square feet). Both properties serve as flight test and certification facilities that are used in development and certification of aviation products.
Garmin International, Inc. also owns approximately 367 acres of additional land in Olathe, Kansas that could accommodate future property development.
Garmin AT, Inc. leases approximately 18 acres of land at 2345 Turner Road SE, Salem, Oregon, U.S. under a ground lease. The current term of this ground lease ends in 2030, but Garmin AT, Inc. has the option to extend the ground lease until 2050. Garmin AT, Inc. owns and occupies a 115,000 square foot facility for office and manufacturing use and a 33,000 square foot aircraft hangar that serves as a flight test and certification facility on this land. Garmin AT, Inc. also owns and occupies an additional 66,000 square foot facility on the same property for customer support and research and development activities.
Garmin Corporation owns and occupies a 247,000 square foot facility at No. 68, Zhangshu 2nd Road, Xizhi Dist., New Taipei City, Taiwan, a 185,000 square foot facility at No.97, Sec. 1, Xintai 5th Rd., Xizhi Dist., New Taipei City, Taiwan, a 224,000 square foot facility at No. 24 Beiyuan Road, Jhongli, Tao-Yang County, Taiwan, a 576,000 square foot facility at No. 270 Huaya 2nd Road, LinKou, Tao-Yang County, Taiwan, and a 615,000 square foot facility at No. 3, Titanggang Rd., Xinshi Dist., Tainan City, Taiwan. Garmin China YangZhou Co., Ltd. leases a 204,000 square foot manufacturing facility at No. 122, Jinshan Road, Bali Town, Yangzhou, Jiangsu, People’s Republic of China. These facilities are used for the manufacturing and warehousing of most of Garmin’s fitness, outdoor, marine, and consumer auto products, as well as portable aviation products. These facilities are also used for research and development activities and marketing and support of products for Asia Pacific countries.
Garmin (Europe) Ltd. owns and occupies a 155,000 square foot building located at Liberty House, Hounsdown Business Park, Southampton, U.K., and leases a 100,000 square foot facility at 4 Parham Dr, Boyatt Wood, Eastleigh, U.K., both used for warehousing, distribution, and office space.
Tacx B.V. owns and occupies a 291,000 square foot facility located at De Boeg 2, 2343 MA Oegstgeest, Netherlands. This facility is used for design and development, manufacturing, and warehousing of indoor training products.
Garmin Wroclaw sp. z o.o leases a 319,000 square foot facility located at Ul. Ryszarda Chomicza 2, 55-040 Biskupice Podgórne, Poland. This facility is used for the manufacturing of certain auto OEM products, as well as distribution of other Garmin products in the region.
Garmin also owns and leases other properties around the world that are not described above and are used for office space, warehousing, and retail.
Item 3. Legal Proceedings
In the normal course of business, the Company and its subsidiaries are parties to various legal claims, actions, and complaints, including matters involving patent infringement, other intellectual property, product liability, customer claims and various other risks. It is not possible to predict with certainty whether or not the Company and its subsidiaries will ultimately be successful in any of these legal matters, or if not, what the impact might be. However, the Company’s management does not expect that the results in any of these legal proceedings will have a material adverse effect on the Company’s results of operations, financial position or cash flows.
The Company settled or resolved certain matters during the fiscal year ended December 31, 2022 that did not individually or in the aggregate have a material impact on the Company’s financial condition or results of operations.
Item 4. Mine Safety Disclosure
None.
Information about our Executive Officers
Pursuant to General Instruction G(3) of Form 10-K and instruction 3 to paragraph (b) of Item 401 of Regulation S-K, the following list is included as an unnumbered Item in Part I of this Annual Report on Form 10-K in lieu of being included in the Company’s Definitive Proxy Statement in connection with its annual meeting of shareholders scheduled for June 9, 2023.
Dr. Min H. Kao, age 74, has served as Executive Chairman of Garmin Ltd. since January 2013 and was previously Chairman of Garmin Ltd. from August 2004 to December 2012 and Co-Chairman of Garmin Ltd. from August 2000 to August 2004. He served as Chief Executive Officer of Garmin Ltd. from August 2002 to December 2012 and previously served as Co-Chief Executive Officer from August 2000 to August 2002. Dr. Kao served as a director and officer of various subsidiaries of the Company from August 1990 until January 2013. Dr. Kao holds Ph.D. and MS degrees in Electrical Engineering from the University of Tennessee and a BS degree in Electrical Engineering from National Taiwan University.
Clifton A. Pemble, age 57, has served as a director of Garmin Ltd. since August 2004. He has served as President and Chief Executive Officer of Garmin Ltd. since January 2013. Previously, he served as President and Chief Operating Officer of Garmin Ltd. from October 2007 to December 2012. Previously, he was Vice President, Engineering of Garmin International, Inc. from 2005 to October 2007, Director of Engineering of Garmin International, Inc. from 2003 to 2005, Software Engineering Manager of Garmin International, Inc. from 1995 to 2002, and a Software Engineer with Garmin International, Inc. from 1989 to 1995. Mr. Pemble has served as a director and officer of various Garmin subsidiaries since August 2003. Mr. Pemble holds BA degrees in Mathematics and Computer Science from MidAmerica Nazarene University.
Douglas G. Boessen, age 60, has served as Chief Financial Officer and Treasurer of Garmin Ltd. since July 2014. He previously served as Chief Financial Officer of EiKO Global, LLC from September 2013 to May 2014, as well as Collective Brands, Inc. from November 1997 to November 2012. Mr. Boessen has served as a director and officer of various Garmin subsidiaries since July 2014. Mr. Boessen is a certified public accountant and holds a BS degree in Business from the University of Central Missouri and is a graduate of the executive development program at Northwestern University’s Kellogg Graduate School of Management.
Andrew R. Etkind, age 67, has served as Vice President, General Counsel and Secretary of Garmin Ltd. since June 2009. He was previously General Counsel and Secretary of Garmin Ltd. from August 2000 to June 2009. He has been Vice President and General Counsel of Garmin International, Inc. since July 2007, General Counsel since February 1998, and Secretary since October 1998. Mr. Etkind has served as a director and officer of various Garmin subsidiaries since December 2001. Mr. Etkind holds BA, MA and LLM degrees from Cambridge University, England and a JD degree from the University of Michigan Law School.
All executive officers are elected by and serve at the discretion of the Company’s Board of Directors. None of the executive officers have an employment agreement with the Company. There are no arrangements or understandings between the executive officers and any other person pursuant to which he or she was or is to be selected as an officer. There is no family relationship among any of the executive officers.
PART II
Item 5. Market for the Company’s Common Shares, Related Shareholder Matters and Issuer Purchases of Equity Securities
Since December 7, 2021, Garmin’s shares have traded on the New York Stock Exchange under the symbol "GRMN". Prior to December 7, 2021, Garmin's share were traded on The Nasdaq Stock Market, LLC under the symbol “GRMN” since its initial public offering on December 8, 2000 (the “IPO”). As of January 31, 2023, there were 288 shareholders of record.
We refer you to Item 12 of this report under the caption “Equity Compensation Plan Information” for certain equity plan information required to be disclosed by Item 201(d) of Regulation S-K.
Issuer Purchases of Equity Securities
Share repurchase activity during the 14-week period ended December 31, 2022, summarized on a trade-date basis, was as follows (in thousands, except per share amounts):
| Period | Total Number of Shares Purchased (1) | Average Price Paid Per Share (2) | Total Number of Shares Purchased as Part of Publicly Announced Plans or Programs | Approximate Dollar Value of Shares That May Yet Be Purchased Under the Program | ||||||||||||
| September 25, 2022 - October 22, 2022 | 516 | $ | 81.61 | 516 | $ | 144,161 | ||||||||||
| October 23, 2022 - November 19, 2022 | 161 | $ | 88.18 | 161 | $ | 129,992 | ||||||||||
| November 20, 2022 - December 31, 2022 | 395 | $ | 92.30 | 395 | $ | 93,477 | ||||||||||
| Total | 1,072 | 1,072 |
(1) The Board of Directors approved a share repurchase program on April 22, 2022 (the "Program"), authorizing the Company to purchase up to $300 million of its common shares as determined by management at its discretion. Share repurchases may be made in the open market or in privately negotiated transactions, including under plans complying with the provisions of Rule 10b5-1 and Rule 10b-18 of the Securities Exchange Act of 1934, as amended. The timing and volume of share repurchases are subject to market conditions, business conditions and applicable laws, and are at management’s discretion. The Program does not require the purchase of any minimum number of shares and may be suspended or discontinued at any time. The share repurchase authorization expires on December 29, 2023. See Note 8 in Part II, Item 8 of this Annual Report for additional information related to share repurchases.
(2) Average price paid per share includes costs associated with the repurchases.
Stock Performance Graph
This performance graph shall not be deemed ‘‘filed’’ with the SEC or subject to Section 18 of the Securities Exchange Act of 1934, nor shall it be deemed incorporated by reference in any of our filings under the Securities Act of 1933, as amended.
The graph below matches Garmin Ltd.'s cumulative 5-Year total shareholder return on common stock with the cumulative total returns of the NASDAQ Composite Index and the S&P 500 Index. The graph tracks the performance of a $100 investment in our common stock and in each index (with the reinvestment of all dividends) from December 30, 2017 (“12/30/17”) to December 31, 2022 (“12/31/22”).
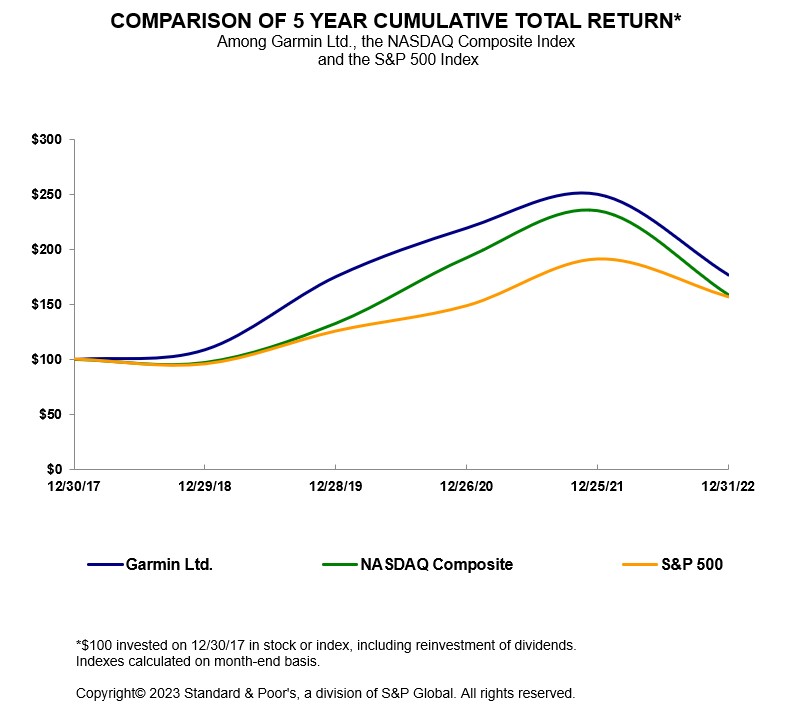
| 12/30/17 | 12/29/18 | 12/28/19 | 12/26/20 | 12/25/21 | 12/31/22 | |||||||||||||||||||
| Garmin Ltd. | 100.00 | 108.96 | 175.38 | 219.47 | 250.08 | 176.81 | ||||||||||||||||||
| NASDAQ Composite | 100.00 | 97.16 | 132.81 | 192.47 | 235.15 | 158.65 | ||||||||||||||||||
| S&P 500 | 100.00 | 95.62 | 125.72 | 148.85 | 191.58 | 156.89 |
The stock price performance included in this graph is not necessarily indicative of future stock price performance.
Item 6. [Reserved]
Item 7. Management’s Discussion and Analysis of Financial Condition and Results of Operations
The following discussion and analysis of our financial condition and results of operations focuses on and is intended to clarify the results of our operations, certain changes in our financial position, liquidity, capital structure and business developments for the periods covered by the consolidated financial statements included in this Form 10-K. This discussion should be read in conjunction with, and is qualified by reference to, the other related information including, but not limited to, the audited consolidated financial statements (including the notes thereto), the description of our business, all as set forth in this Form 10-K, as well as the risk factors discussed above in Item 1A.
This section provides discussion and a year-to-year comparison for the fiscal years ended December 31, 2022 and December 25, 2021. Discussion regarding our results of operations for the fiscal year ended December 26, 2020 and a year-to-year comparison between the fiscal years ended December 25, 2021 and December 26, 2020 can be found in Item 7 of our Annual Report on Form 10-K for the fiscal year ended December 25, 2021.
As previously noted, the discussion set forth below, as well as other portions of this Form 10-K, contain statements concerning potential future events. Readers can identify these forward-looking statements by their use of such verbs as “expects,” “anticipates,” “believes”, or similar verbs or conjugations of such verbs. If any of our assumptions on which the statements are based prove incorrect or should unanticipated circumstances arise, our actual results could materially differ from those anticipated by such forward-looking statements. The differences could be caused by a number of factors or combination of factors including, but not limited to, those discussed above in Item 1A. Readers are strongly encouraged to consider those factors when evaluating any such forward-looking statement. Except as may be required by law, we do not undertake to update any forward-looking statements in this Form 10-K.
Garmin’s fiscal year is a 52-53 week period ending on the last Saturday of the calendar year. Fiscal year 2022 contained 53 weeks and fiscal years 2021 and 2020 contained 52 weeks. Unless otherwise stated, all years and dates refer to the Company’s fiscal year and fiscal periods. Unless the context otherwise requires, references in this document to "we", "us", "our" and similar terms refer to Garmin Ltd. and its subsidiaries.
Unless otherwise indicated, dollar amounts set forth in the tables are in thousands, except per share data.
Overview
The Company is a leading worldwide provider of wireless devices, many of which feature Global Positioning System (GPS) navigation, and applications that are designed for people who live an active lifestyle. During 2022, 2021, and 2020, Garmin was organized in the six operating segments of fitness, outdoor, aviation, marine, consumer auto, and auto OEM. The Company’s Chief Executive Officer, who has been identified as the Chief Operating Decision Maker (CODM), allocates resources and assesses performance of each operating segment individually. The fitness, outdoor, aviation, and marine operating segments represented reportable segments during 2022, 2021, and 2020. The consumer auto and auto OEM operating segments, which serve the auto market, did not meet the quantitative thresholds to separately qualify as reportable segments, and they are therefore reported together in an “all other” category captioned as auto. Fitness, outdoor, aviation, marine, and auto are collectively referred to as our reported segments.
Business Environment Update
A number of headwinds including high inflation, rising interest rates, and the strengthening of the U.S. Dollar relative to other major currencies affected the economic environment and consumer behaviors in 2022. Additionally, while our global supply chain is routinely subject to component shortages, increased lead times, cost fluctuations, and logistics constraints, these factors have been further amplified by the current environment, including Russia’s invasion of Ukraine and the lingering impacts of the COVID-19 pandemic. We expect certain of these challenges to persist into 2023.
While Russia’s invasion of Ukraine has not had a material direct impact on our business, and our related direct exposure is limited, the nature and degree of the effects of that conflict, as well as the other effects of the current business environment over time remain uncertain. Refer to Part I, Item 1A, “Risk Factors” of this Annual Report for further discussion of the risks and uncertainties facing our Company.
Critical Accounting Estimates
General
Our discussion and analysis of financial condition and results of operations are based upon the Company’s consolidated financial statements, which have been prepared in accordance with accounting principles generally accepted in the United States. The presentation of these financial statements requires management to make estimates and judgments that affect the reported amounts of assets, liabilities, revenues and expenses, and related disclosure of contingent assets and liabilities. On an on-going basis, we evaluate our estimates, including those related to customer sales programs and incentives, product returns, bad debts, inventories, investments, intangible assets, income taxes, warranty obligations, and contingencies and litigation. We base our estimates on historical experience and various other assumptions that are believed to be reasonable under the circumstances, the results of which form the basis for making judgments about the carrying value of assets and liabilities that are not readily apparent from other sources. Actual results may differ from these estimates under different assumptions or conditions. Refer to Note 1 in the Notes to the Consolidated Financial Statements for our significant accounting policies related to our critical accounting estimates.
Goodwill
We allocate goodwill to reporting units in proportion to the expected benefit from each business combination. Each of the Company’s operating segments represent a distinct reporting unit. Goodwill is tested for impairment at the reporting unit level on an annual basis and between annual tests if an event occurs or circumstances change that would more likely than not reduce the fair value of a reporting unit below its carrying value. These events or circumstances could include a significant change in the operating performance indicators, competition, or expectations about future market or economic conditions.
Application of the goodwill impairment test requires significant judgment, including the identification of reporting units, assignment of assets and liabilities to reporting units, assignment of goodwill to reporting units, and determination of the fair value of each reporting unit. The fair value of each reporting unit is estimated through the use of a discounted cash flow methodology. This analysis requires significant assumptions, including discount rate, projected future revenues, projected future operating margins, and terminal growth rates. The estimates used to calculate the fair value of a reporting unit change from year to year based on operating results, market conditions, and other factors. Changes in these estimates and assumptions could materially affect the determination of fair value and goodwill impairment for each reporting unit.
Unrecognized Income Tax Benefits
We recognize liabilities associated with uncertain income tax positions, including those related to transfer pricing, based on our estimate of whether, and the extent to which, additional taxes will be due. We recognize the tax benefits from an uncertain tax position only if payment of these amounts ultimately proves to be not required or it is more likely than not that the tax position will be sustained upon examination by the taxing authorities, based on the technical merits of the position. The tax benefits recognized in the financial statements from such positions are measured based on the largest amount of benefit that is more likely than not to be realized upon ultimate settlement.
Assessing uncertain tax positions requires significant judgment, including the evaluation of unique facts and circumstances and the interpretation of laws and regulations, especially the assessment of pricing analyses that may produce various ranges of outcomes. Variations in the actual outcome of these future tax consequences could materially impact our consolidated financial statements.
Accounting Terms and Characteristics
Net Sales
Our net sales are primarily generated through sales to our retail partners, dealer and distributor network, installation and repair shops, original equipment manufacturers (OEMs), our online webshop (garmin.com), subscriptions for connected services, and our own retail stores. Refer to the Revenue Recognition discussion in Note 1 of the Notes to Consolidated Financial Statements. We aim to achieve a quick turnaround on orders we receive from our retail, dealer, and distributor customers. Certain arrangements with OEM customers are entered into at the beginning of an aircraft, boat, or vehicle life cycle with the intent to fulfill customer purchasing requirements for the entire production life, although there are generally no firm volume commitments, and sales are therefore generated on an order-by-order basis. As a result, we do not believe backlog information is material to the understanding of our business.
Net sales are subject to seasonal fluctuation. Typically, sales of our consumer products are highest in the fourth quarter due to increased demand during the holiday buying season, and in the second quarter due to increased demand during the spring and summer season. Our aviation and auto OEM products do not experience much seasonal variation but are more influenced by the timing of aircraft certifications, regulatory mandates, auto program manufacturing, and the release of new products when the initial demand is typically the strongest.
Cost of Goods Sold and Gross Profit
Raw material costs are our most significant component of cost of goods sold. Our existing practice of performing the design and manufacture of our products in-house has enabled us to source components from different suppliers and, where possible, to redesign our products to leverage lower-cost or more readily available components.
We believe that our flexible production model allows our factories to experience relatively low costs of manufacturing. In general, products manufactured in Taiwan have been our highest volume products. Our manufacturing labor costs historically have been lower in Taiwan and China than in other locations.
Shipping and handling costs associated with the transportation and delivery of our products are included in cost of goods sold. Such costs fluctuate due to a number of factors, including market pricing and the mix of modes of transportation we utilize.
Sales price variability, including that which is associated with foreign currency fluctuations, has had and can be expected to have an effect on our gross profit. Our consolidated gross margin, representing gross profit as a percentage of net sales, is dependent on segment mix, and to a lesser extent, product mix within each segment.
Advertising Expense
Our advertising expenses consist primarily of costs for media advertising, cooperative advertising with our retail partners, point of sale displays, and sponsorships.
Selling, General and Administrative Expenses
Our selling, general and administrative expenses consist primarily of:
information systems and infrastructure costs;
salaries for sales, marketing and product support personnel;
salaries and related costs for executives and administrative personnel;
marketing, and other brand building costs;
finance and legal costs;
human resource costs;
travel and related costs; and
occupancy and other overhead costs.
Research and Development
The majority of our research and development costs represent engineering personnel costs, costs of test equipment and components used in product and prototype development, and outside product development costs.
We are committed to increasing the level of innovative design and development of new products as we strive for expanded ability to serve our existing consumer and aviation markets as well as new auto OEM programs and new markets for active lifestyle products.
Results of Operations
In the first quarter of fiscal 2022 the Company refined the methodology used in classifying certain indirect costs as research and development expense, which we believe provides a more meaningful representation of costs incurred to support research and development activities.
Additionally, in the first quarter of fiscal 2022 the methodology used to allocate certain selling, general, and administrative expenses to the segments was refined to allocate these expenses in a more direct manner to provide the Company’s CODM with a more meaningful representation of segment profit or loss. The Company’s composition of operating segments and reportable segments did not change at that time.
These changes in classification and allocation had no effect on the Company’s consolidated operating or net income. The amounts presented below for selling, general, and administrative expense, research and development expense, segment operating expense, and segment operating income for the 52-week periods ended December 25, 2021 and December 26, 2020 have been recast to conform with the current period presentation.
The following table sets forth our results of operations as a percentage of net sales during the periods shown (the table may not foot due to rounding):
| 53-Weeks Ended | 52-Weeks Ended | 52-Weeks Ended | ||||||||||
| December 31, 2022 | December 25, 2021 | December 26, 2020 | ||||||||||
| Net sales | 100 | % | 100 | % | 100 | % | ||||||
| Cost of goods sold | 42 | % | 42 | % | 41 | % | ||||||
| Gross profit | 58 | % | 58 | % | 59 | % | ||||||
| Operating expenses: | ||||||||||||
| Advertising | 3 | % | 3 | % | 4 | % | ||||||
| Selling, general and administrative | 16 | % | 14 | % | 15 | % | ||||||
| Research and development | 17 | % | 16 | % | 16 | % | ||||||
| Total operating expenses | 37 | % | 34 | % | 34 | % | ||||||
| Operating income | 21 | % | 24 | % | 25 | % | ||||||
| Other income (expense), net | 1 | % | —% | 1 | % | |||||||
| Income before income taxes | 22 | % | 24 | % | 26 | % | ||||||
| Provision for income taxes | 2 | % | 3 | % | 2 | % | ||||||
| Net income | 20 | % | 22 | % | 24 | % |
The table below sets forth our results of operations through operating income for each of our five reported segments and supplemental information for the consumer auto and auto OEM operating segments that management believes is useful. The Company’s CODM uses operating income as the measure of profit or loss, combined with other measures, to assess segment performance and allocate resources. Operating income represents net sales less costs of goods sold and operating expenses. Net sales are directly attributed to each segment. Most costs of goods sold and the majority of operating expenses are also directly attributed to each segment, while certain other costs of goods sold and operating expenses are allocated to the segments in a reasonable manner considering the specific facts and circumstances of the expenses being allocated. For each line item in the table below, the total of the reported segments’ amounts equals the amount in the consolidated statements of income.
| Auto | ||||||||||||||||||||||||||||
| 53-Weeks Ended December 31, 2022 | Fitness | Outdoor | Aviation | Marine | Total Auto | Consumer Auto | Auto OEM | |||||||||||||||||||||
| Net sales | $ | 1,109,419 | $ | 1,495,167 | $ | 792,799 | $ | 903,983 | $ | 558,918 | $ | 275,108 | $ | 283,810 | ||||||||||||||
| Cost of goods sold | 557,002 | 525,357 | 219,736 | 412,526 | 338,890 | 145,510 | 193,380 | |||||||||||||||||||||
| Gross profit | 552,417 | 969,810 | 573,063 | 491,457 | 220,028 | 129,598 | 90,430 | |||||||||||||||||||||
| Total operating expenses | 447,679 | 413,362 | 359,877 | 276,153 | 281,859 | 112,765 | 169,094 | |||||||||||||||||||||
| Operating income (loss) | $ | 104,738 | $ | 556,448 | $ | 213,186 | $ | 215,304 | $ | (61,831 | ) | $ | 16,833 | $ | (78,664 | ) | ||||||||||||
| 52-Weeks Ended December 25, 2021 | Fitness | Outdoor | Aviation | Marine | Total Auto | Consumer Auto | Auto OEM | |||||||||||||||||||||
| Net sales | $ | 1,533,788 | $ | 1,281,933 | $ | 712,468 | $ | 875,151 | $ | 579,455 | $ | 324,731 | $ | 254,724 | ||||||||||||||
| Cost of goods sold | 720,463 | 447,096 | 192,647 | 379,841 | 352,289 | 170,906 | 181,383 | |||||||||||||||||||||
| Gross profit | 813,325 | 834,837 | 519,821 | 495,310 | 227,166 | 153,825 | 73,341 | |||||||||||||||||||||
| Total operating expenses | 454,124 | 358,715 | 326,633 | 245,529 | 286,838 | 105,478 | 181,360 | |||||||||||||||||||||
| Operating income (loss) | $ | 359,201 | $ | 476,122 | $ | 193,188 | $ | 249,781 | $ | (59,672 | ) | $ | 48,347 | $ | (108,019 | ) | ||||||||||||
| 52-Weeks Ended December 26, 2020 | Fitness | Outdoor | Aviation | Marine | Total Auto | Consumer Auto | Auto OEM | |||||||||||||||||||||
| Net sales | $ | 1,317,498 | $ | 1,128,081 | $ | 622,820 | $ | 657,848 | $ | 460,326 | $ | 275,493 | $ | 184,833 | ||||||||||||||
| Cost of goods sold | 619,959 | 388,304 | 169,812 | 273,398 | 253,764 | 135,629 | 118,135 | |||||||||||||||||||||
| Gross profit | 697,539 | 739,777 | 453,008 | 384,450 | 206,562 | 139,864 | 66,698 | |||||||||||||||||||||
| Total operating expenses | 392,256 | 301,580 | 306,400 | 207,266 | 219,594 | 94,831 | 124,763 | |||||||||||||||||||||
| Operating income (loss) | $ | 305,283 | $ | 438,197 | $ | 146,608 | $ | 177,184 | $ | (13,032 | ) | $ | 45,033 | $ | (58,065 | ) |
Net Sales
| Net Sales | 53-Weeks Ended December 31, 2022 | Year-over-Year Change | 52-Weeks Ended December 25, 2021 | Year-over-Year Change | 52-Weeks Ended December 26, 2020 | |||||||||||||||
| Fitness | $ | 1,109,419 | (28 | %) | $ | 1,533,788 | 16 | % | $ | 1,317,498 | ||||||||||
| Percentage of Total Net Sales | 23 | % | 31 | % | 31 | % | ||||||||||||||
| Outdoor | 1,495,167 | 17 | % | 1,281,933 | 14 | % | 1,128,081 | |||||||||||||
| Percentage of Total Net Sales | 31 | % | 26 | % | 27 | % | ||||||||||||||
| Aviation | 792,799 | 11 | % | 712,468 | 14 | % | 622,820 | |||||||||||||
| Percentage of Total Net Sales | 16 | % | 14 | % | 15 | % | ||||||||||||||
| Marine | 903,983 | 3 | % | 875,151 | 33 | % | 657,848 | |||||||||||||
| Percentage of Total Net Sales | 19 | % | 17 | % | 16 | % | ||||||||||||||
| Auto | 558,918 | (4 | %) | 579,455 | 26 | % | 460,326 | |||||||||||||
| Percentage of Total Net Sales | 11 | % | 12 | % | 11 | % | ||||||||||||||
| Consumer Auto | 275,108 | (15 | %) | 324,731 | 18 | % | 275,493 | |||||||||||||
| Percentage of Total Net Sales | 6 | % | 7 | % | 7 | % | ||||||||||||||
| Auto OEM | 283,810 | 11 | % | 254,724 | 38 | % | 184,833 | |||||||||||||
| Percentage of Total Net Sales | 6 | % | 5 | % | 4 | % | ||||||||||||||
| Total | $ | 4,860,286 | (2 | %) | $ | 4,982,795 | 19 | % | $ | 4,186,573 |
Net sales decreased 2% in fiscal year 2022 when compared to the year-ago period primarily due to the strengthening of the U.S. Dollar relative to other major currencies. Total unit sales decreased approximately 9% to 15.0 million units in 2022 from 16.6 million units in 2021, which differs from the percent change in revenue primarily due to shifts in segment and product mix. Outdoor revenue represented the largest portion of our revenue mix at 31% in 2022, compared to Fitness at 31% in 2021.
The increase in outdoor revenue was driven by sales growth across multiple product categories, led by adventure watches. Aviation revenue increased due to contributions from both aftermarket and OEM categories. The increase in marine revenue was driven by sales growth in multiple categories, led by strong demand for our sonar products. Fitness revenue decreased due to declines across all product categories. Auto revenue decreased as a sales decline in our consumer auto products more than offset the growth from auto OEM program model launches.
Gross Profit
| Gross Profit | 53-Weeks Ended December 31, 2022 | Year-over-Year Change | 52-Weeks Ended December 25, 2021 | Year-over-Year Change | 52-Weeks Ended December 26, 2020 | |||||||||||||||
| Fitness | $ | 552,417 | (32 | %) | $ | 813,325 | 17 | % | $ | 697,539 | ||||||||||
| Percentage of Segment Net Sales | 50 | % | 53 | % | 53 | % | ||||||||||||||
| Outdoor | 969,810 | 16 | % | 834,837 | 13 | % | 739,777 | |||||||||||||
| Percentage of Segment Net Sales | 65 | % | 65 | % | 66 | % | ||||||||||||||
| Aviation | 573,063 | 10 | % | 519,821 | 15 | % | 453,008 | |||||||||||||
| Percentage of Segment Net Sales | 72 | % | 73 | % | 73 | % | ||||||||||||||
| Marine | 491,457 | (1 | %) | 495,310 | 29 | % | 384,450 | |||||||||||||
| Percentage of Segment Net Sales | 54 | % | 57 | % | 58 | % | ||||||||||||||
| Auto | 220,028 | (3 | %) | 227,166 | 10 | % | 206,562 | |||||||||||||
| Percentage of Segment Net Sales | 39 | % | 39 | % | 45 | % | ||||||||||||||
| Consumer Auto | 129,598 | (16 | %) | 153,825 | 10 | % | 139,864 | |||||||||||||
| Percentage of Segment Net Sales | 47 | % | 47 | % | 51 | % | ||||||||||||||
| Auto OEM | 90,430 | 23 | % | 73,341 | 10 | % | 66,698 | |||||||||||||
| Percentage of Segment Net Sales | 32 | % | 29 | % | 36 | % | ||||||||||||||
| Total | $ | 2,806,775 | (3 | %) | $ | 2,890,459 | 16 | % | $ | 2,481,336 | ||||||||||
| Percentage of Total Net Sales | 58 | % | 58 | % | 59 | % |
Gross profit dollars in fiscal year 2022 decreased 3%, primarily due to the decrease in net sales compared to the year-ago period as described above. Consolidated gross margin was relatively flat when compared to the year-ago period.
Gross margin remained relatively flat within the outdoor, aviation, and consumer auto segments. The auto OEM gross margin increase of 310 basis points was primarily attributable to favorable product mix. The fitness gross margin decrease of 320 basis points was primarily due to a stronger U.S. Dollar relative to other major currencies in fiscal 2022 when compared to fiscal 2021. The marine gross margin decrease of 220 basis points was primarily due to sales mix.
Operating Expense
| Operating Expense | 53-Weeks Ended December 31, 2022 | Year-over-Year Change | 52-Weeks Ended December 25, 2021 | Year-over-Year Change | 52-Weeks Ended December 26, 2020 | |||||||||||||||
| Advertising Expense | $ | 168,040 | (2 | %) | $ | 171,829 | 14 | % | $ | 151,166 | ||||||||||
| Percentage of Total Net Sales | 3 | % | 3 | % | 4 | % | ||||||||||||||
| Selling, general, and administrative expenses | 775,963 | 8 | % | 721,260 | 16 | % | 623,588 | |||||||||||||
| Percentage of Total Net Sales | 16 | % | 14 | % | 15 | % | ||||||||||||||
| Research and development expense | 834,927 | 7 | % | 778,750 | 19 | % | 652,342 | |||||||||||||
| Percentage of Total Net Sales | 17 | % | 16 | % | 16 | % | ||||||||||||||
| Total | $ | 1,778,930 | 6 | % | $ | 1,671,839 | 17 | % | $ | 1,427,096 | ||||||||||
| Percentage of Total Net Sales | 37 | % | 34 | % | 34 | % |
Total operating expense as a percent of revenue increased 310 basis points due to an increase of 6% in absolute dollars in fiscal year 2022 compared to fiscal year 2021, while revenue declined, as discussed above.
Advertising expense as a percent of revenue was relatively flat and decreased 2% in absolute dollars when compared to the prior year. The total absolute dollar decrease was primarily attributable to decreased cooperative spend in the fitness segment.
Selling, general and administrative expense as a percent of revenue increased 150 basis points and 8% in absolute dollars when compared to the prior year. The absolute dollar increase was primarily attributable to personnel related expenses and information technology costs.
Research and development expense as a percent of revenue increased 160 basis points and 7% in absolute dollars when compared to the year-ago period. The absolute dollar increase was primarily due to higher engineering personnel costs.
Operating Income
| Operating Income (Loss) | 53-Weeks Ended December 31, 2022 | Year-over-Year Change | 52-Weeks Ended December 25, 2021 | Year-over-Year Change | 52-Weeks Ended December 26, 2020 | |||||||||||||||
| Fitness | $ | 104,738 | (71 | %) | $ | 359,201 | 18 | % | $ | 305,283 | ||||||||||
| Percentage of Segment Net Sales | 9 | % | 23 | % | 23 | % | ||||||||||||||
| Outdoor | 556,448 | 17 | % | 476,122 | 9 | % | 438,197 | |||||||||||||
| Percentage of Segment Net Sales | 37 | % | 37 | % | 39 | % | ||||||||||||||
| Aviation | 213,186 | 10 | % | 193,188 | 32 | % | 146,608 | |||||||||||||
| Percentage of Segment Net Sales | 27 | % | 27 | % | 24 | % | ||||||||||||||
| Marine | 215,304 | (14 | %) | 249,781 | 41 | % | 177,184 | |||||||||||||
| Percentage of Segment Net Sales | 24 | % | 29 | % | 27 | % | ||||||||||||||
| Auto | (61,831 | ) | 4 | % | (59,672 | ) | 358 | % | (13,032 | ) | ||||||||||
| Percentage of Segment Net Sales | (11 | %) | (10 | %) | -3 | % | ||||||||||||||
| Consumer Auto | 16,833 | (65 | %) | 48,347 | 7 | % | 45,033 | |||||||||||||
| Percentage of Segment Net Sales | 6 | % | 15 | % | 16 | % | ||||||||||||||
| Auto OEM | (78,664 | ) | (27 | %) | (108,019 | ) | 86 | % | (58,065 | ) | ||||||||||
| Percentage of Segment Net Sales | (28 | %) | (42 | %) | (31 | %) | ||||||||||||||
| Total | $ | 1,027,845 | (16 | %) | $ | 1,218,620 | 16 | % | $ | 1,054,240 | ||||||||||
| Percentage of Total Net Sales | 21 | % | 24 | % | 25 | % |
Total operating income decreased 16% in absolute dollars and 330 basis points as a percent of revenue when compared to fiscal year 2021. The decrease as a percent of revenue was primarily due to higher operating expenses, while net sales declined, as described above. Decreases in operating income in fitness, marine, and consumer auto were partially offset by improved performance in outdoor, aviation and auto OEM. Auto OEM experienced an operating loss in fiscal year 2022 driven by investments in auto OEM programs, and we expect auto OEM to experience an operating loss in 2023.
Other Income (Expense)
| Other Income (Expense) | 53-Weeks Ended December 31, 2022 | 52-Weeks Ended December 25, 2021 | 52-Weeks Ended December 26, 2020 | |||||||||
| Interest income | $ | 40,826 | $ | 28,573 | $ | 37,002 | ||||||
| Foreign currency (losses) gains | (11,274 | ) | (45,263 | ) | 2,825 | |||||||
| Other income | 7,577 | 4,866 | 9,343 | |||||||||
| Total | $ | 37,129 | $ | (11,824 | ) | $ | 49,170 |
The average interest rate returns on cash and investments during the 53-weeks ended December 31, 2022 and 52-weeks ended December 25, 2021 were 1.4% and 1.0%, respectively. Interest income increased primarily due to higher yields on fixed-income securities.
Foreign currency gains and losses for the Company are driven by movements of a number of currencies in relation to the U.S. Dollar. The Taiwan Dollar is the functional currency of Garmin Corporation, the Euro is the functional currency of several subsidiaries, and the U.S. Dollar is the functional currency of Garmin (Europe) Ltd., although some transactions and balances are denominated in British Pounds. Other notable currency exposures include the Australian Dollar, Chinese Yuan, Japanese Yen, Polish Zloty, and Swiss Franc. The majority of the Company’s consolidated foreign currency gain or loss is typically driven by the significant cash and marketable securities, receivables and payables held in a currency other than the functional currency at a given legal entity.
The $11.3 million currency loss recognized in fiscal 2022 was primarily due to the U.S. Dollar strengthening against the Australian Dollar, Polish Zloty, Chinese Yuan, Euro, Japanese Yen, and British Pound Sterling, partially offset by the U.S. Dollar strengthening against the Taiwan Dollar. During this period, the U.S. Dollar strengthened 6.4% against the Australian Dollar, 7.1% against the Polish Zloty, 8.5% against the Chinese Yuan, 5.4% against the Euro, 12.7% against the Japanese Yen, and 9.6% against the British Pound Sterling, resulting in losses of $8.9 million, $6.0 million, $5.8 million, $5.1 million, $3.7 million, and $1.9 million, respectively, partially offset by the U.S. Dollar strengthening 9.7% against the Taiwan Dollar, resulting in a gain of $28.0 million. The remaining net currency loss of $7.9 million was related to the impacts of other currencies, each of which was individually immaterial.
The $45.3 million currency gain recognized in fiscal 2021 was primarily due to the U.S. Dollar strengthening against the Euro, Polish Zloty, Japanese Yen, Swiss Franc, and Australian Dollar, while the U.S. Dollar weakened against the Taiwan Dollar. During fiscal 2021, the U.S. Dollar strengthened 7.3% against the Euro, 9.6% against the Polish Zloty, 9.6% against the Japanese Yen, 3.0% against the Swiss Franc, and 4.7% against the Australian Dollar, resulting in losses of $20.0 million, $6.6 million, $2.6 million, $2.5 million, and $2.4 million, respectively, while the U.S. Dollar weakened 1.6% against the Taiwan Dollar, resulting in a loss of $6.2 million. The remaining net currency loss of $5.0 million was related to the impacts of other currencies, each of which was individually immaterial.
Income Tax Provision
Income tax expense for the fiscal year ended December 31, 2022 was $91.4 million compared to income tax expense of $124.6 million for the fiscal year ended December 25, 2021, representing a net decrease of $33.2 million. The decrease was primarily due to income mix by jurisdiction and an increase in U.S. tax deductions and credits in the fiscal year ended December 31, 2022 compared to the fiscal year ended December 25, 2021.
Certain Switzerland tax assets related to the October 2019 enactment of Switzerland federal and Schaffhausen cantonal tax reform and related transitional measures were revalued in the fourth quarter of 2022 resulting in $7.2 million income tax expense. In connection with these transitional measures included in Switzerland tax reform, a reduced income tax rate will be utilized on certain Switzerland taxable income for up to five years. Excluding the aforementioned $7.2 million income tax expense in fiscal 2022, income tax expense for fiscal year 2022 was $84.2 million.
In February 2020 the Company initiated a transaction between wholly-owned subsidiaries to migrate ownership of certain intellectual property from Switzerland to the United States, the primary location of research, development, and executive management. The migration, which includes a multi-year intercompany license of intellectual property, has resulted in a favorable shift of income mix by jurisdiction and a reduction in expense related to uncertain tax positions. The Company is pursuing an advance pricing agreement between relevant jurisdictions related to this transaction. However, we are unable to predict the outcome of the final advanced pricing agreement and related negotiations, which could have a material adverse impact on our income tax provision, net income and cash flows for periods during negotiation and upon finalization. At the end of the license agreement, a higher percentage of income will be recognized in the United States.
Numerous countries have signed the OECD global minimum tax initiative, including Switzerland, the U.S., and the U.K. Recently, Switzerland’s Federal Council proposed legislation which would implement a minimum tax of 15% in 2024. The passage of a minimum tax in Switzerland or other jurisdictions where we operate would result in an increase in the tax paid by the Company which could have a material adverse impact on our income tax provision and financial statements.
Net Income
As a result of the various factors noted above net income decreased 10% to $973.6 million from $1,082.2 million in the prior year.
Liquidity and Capital Resources
We primarily use cash flow from operations, and expect that future cash requirements may be used, to fund our capital expenditures, support our working capital requirements, pay dividends, fund share repurchases, and fund strategic acquisitions. We believe that our existing cash balances and cash flow from operations will be sufficient to meet our short- and long-term projected working capital needs, capital expenditures, and other cash requirements.
Cash, Cash Equivalents, and Marketable Securities
As of December 31, 2022, we had approximately $2.7 billion of cash, cash equivalents and marketable securities. Management invests idle or surplus cash in accordance with the investment policy, which has been approved by the Company’s Board of Directors. The investment policy’s primary objectives are to preserve capital, maintain an acceptable degree of liquidity, and maximize yield within the constraint of low credit risk. Garmin’s average interest rate returns on cash and investments during fiscal 2022 and 2021 were 1.4% and 1.0%, respectively. The fair value of our securities varies from period to period due to changes in interest rates, in the performance of the underlying collateral, and in the credit performance of the underlying issuer, among other factors. See Note 4 for additional information regarding marketable securities.
Cash Flows
Cash provided by operating activities totaled $788.3 million for fiscal 2022, compared to $1,012.4 million for fiscal 2021. The decrease was primarily due to a higher use of cash on purchases of inventory, principally associated with the Company's strategy to optimize shipping methods and mitigate increased lead times for raw materials. Additionally, the Company used more cash for income taxes and operating expenses in fiscal 2022 compared to fiscal 2021. These factors were partially offset by more timely cash collections of net sales in fiscal 2022 when compared to fiscal 2021.
Cash used in investing activities totaled $145.1 million for fiscal 2022, compared to $475.4 million for fiscal 2021. The decrease was primarily due to net redemptions of marketable securities in fiscal 2022 to fund financing activities described below, compared to the net purchases of marketable securities in fiscal 2021, as well as a decrease in purchases of property and equipment in fiscal 2022 compared to fiscal 2021.
Cash used in financing activities totaled $840.6 million for fiscal 2022, compared to $486.7 million for fiscal 2021. This increase was primarily due to the purchase of treasury stock under the share repurchase plan, and higher cash dividend payments in fiscal 2022. Fiscal 2022 included five dividend payments compared to four dividend payments in fiscal 2021 due to the timing of dividend dates and our fiscal period end dates, and our declared dividend increased from $0.61 per share for the four calendar quarters beginning in June 2020 to $0.67 per share for the four calendar quarters beginning in June 2021, and to $0.73 per share for the four calendar quarters beginning in June 2022.
Uses of Cash
Operating Leases
The Company has lease arrangements for certain real estate properties, vehicles, and equipment. Leased properties are typically used for office space, distribution, and retail. As of December 31, 2022, the Company had fixed lease payment obligations of $161.3 million, with $30.7 million payable within 12 months.
Inventory Purchase Obligations
The Company obtains various raw materials and components for its products from a variety of third party suppliers. The Company’s inventory purchase obligations are primarily noncancelable. As of December 31, 2022, the Company had inventory purchase obligations of $760.0 million, with $520.7 million payable within 12 months.
Other Purchase Obligations
The Company’s other purchase obligations primarily consist of noncancelable commitments for capital expenditures and other indirect purchases in connection with conducting our business. As of December 31, 2022, the Company had other purchase obligations of $395.8 million, with $173.3 million payable within 12 months.
Other Uses of Cash
The 2017 United States Tax Cuts and Jobs Act (the “2017 Act”) included provisions, which became effective during 2022 tax year, related to the capitalization of certain research and development costs for tax purposes. The provisions require us to capitalize certain research and development costs and amortize those capitalized costs on our U.S. tax returns over a period of five or fifteen years, depending on where the associated costs were incurred. While these provisions did not have a material impact on our fiscal 2022 effective tax rate, and we do not expect a material impact on our fiscal 2023 effective tax rate, this capitalization rule did increase our cash paid for taxes in fiscal 2022, and we expect it to continue to cause an increased level of cash paid for taxes in fiscal 2023. Cash paid for taxes will also increase in 2023 as compared to 2022 due to the payment of taxes in arrears related to the intercompany transaction to migrate ownership of certain intellectual property from Switzerland to the United States.
Item 7A. Quantitative and Qualitative Disclosures About Market Risk
Market Sensitivity
We have market risk primarily in connection with the pricing of our products and services, the purchase of raw materials, and the cost of shipping and handling. We strive to offset pricing declines for certain products through obtaining reductions in raw materials costs and the introduction of new products.
Inflation
Our business has at times been impacted by increasing costs. If our costs were to become subject to significant inflationary pressures, we may not be able to fully offset such higher costs through price increases. Our inability or failure to do so could adversely affect our business, financial condition and results of operations.
Foreign Currency Exchange Rate Risk
The operation of Garmin’s subsidiaries in international markets results in exposure to movements in currency exchange rates. We have experienced significant impacts to our financial results due to the strengthening and weakening of the U.S. Dollar. The potential of volatile foreign exchange rate fluctuations in the future could have a significant effect on our results of operations. The Company has not historically hedged its foreign currency exchange rate risks with financial instruments.
The currencies that have historically created a majority of the Company’s exchange rate exposure are the Taiwan Dollar and Euro. Garmin Corporation, headquartered in Xizhi, Taiwan, uses the local currency as the functional currency. The Company translates all assets and liabilities at year‐end exchange rates and income and expense accounts at rates prevailing during the year. In order to minimize the effect of the currency exchange fluctuations on our net assets, we have elected to retain most of our Taiwan subsidiary’s cash and investments denominated in U.S. Dollars.
Most European subsidiaries use the Euro as the functional currency. The functional currency of our largest European subsidiary, Garmin (Europe) Ltd. is the U.S. Dollar, and as some transactions occur in British Pounds Sterling or Euros, foreign currency gains or losses have been realized historically related to the movements of those currencies relative to the U.S. Dollar.
During fiscal year 2022, the Company incurred a net foreign currency loss of $11.3 million. The U.S. Dollar strengthened against the Australian Dollar, Polish Zloty, Chinese Yuan, Euro, Japanese Yen, and British Pound Sterling, partially offset by the U.S. Dollar strengthening against the Taiwan Dollar. During fiscal 2022, the U.S. Dollar strengthened 6.4% against the Australian Dollar, 7.1% against the Polish Zloty, 8.5% against the Chinese Yuan, 5.4% against the Euro, 12.7% against the Japanese Yen, and 9.6% against the British Pound Sterling, resulting in losses of $8.9 million, $6.0 million, $5.8 million, $5.1 million, $3.7 million, and $1.9 million, respectively, partially offset by the U.S. Dollar strengthening 9.7% against the Taiwan Dollar, resulting in a gain of $28.0 million. The remaining net currency loss of $7.9 million was related to the impacts of other currencies, each of which was individually immaterial. These and other currency moves during fiscal year 2022 also resulted in a currency translation adjustment of $149.4 million within accumulated other comprehensive income (loss).
We assessed the Company’s exposure to movements in currency exchange rates by performing a sensitivity analysis of adverse changes in exchange rates and the corresponding impact to our results of operations. Based on monetary assets and liabilities denominated in currencies other than respective functional currencies as of December 31, 2022 and December 25, 2021, hypothetical and reasonably possible adverse changes of 10% for the Taiwan Dollar, Euro, Polish Zloty, Japanese Yen, Swiss Franc, and Australian Dollar would have resulted in an adverse impact on income before income taxes of approximately $81 million and $68 million, respectively.
Interest Rate Risk
We have no outstanding long-term debt as of December 31, 2022. We, therefore, have no meaningful debt-related interest rate risk.
We are exposed to interest rate risk in connection with our investments in marketable securities. As interest rates change, the unrealized gains and losses associated with those securities will fluctuate accordingly.
The primary objectives of the Company’s investment policy are to preserve capital, maintain an acceptable degree of liquidity, and maximize yield within the constraint of low credit risk. The Company does not intend to sell securities in an unrealized loss position and it is not more likely than not that the Company will be required to sell such investments before recovery of their amortized costs bases, which may be maturity. As of December 31, 2022 and December 25, 2021, the Company had not recognized an allowance for credit losses on any securities in an unrealized loss position.
We assessed the Company’s exposure to interest rate risk by performing a sensitivity analysis of a parallel shift in the yield curve and the corresponding impact to the Company’s portfolio of marketable securities. Based on balance sheet positions as of December 31, 2022 and December 25, 2021, the hypothetical and reasonably possible 100 basis point increases in interest rates across all securities would have resulted in declines in portfolio fair market value of approximately $31 million and $40 million at December 31, 2022 and December 25, 2021, respectively. Such losses would only be realized if the Company sold the investments prior to maturity.
Item 8. Financial Statements and Supplementary Data
CONSOLIDATED FINANCIAL STATEMENTS
Garmin Ltd. and Subsidiaries
Years Ended December 31, 2022, December 25, 2021, and December 26, 2020
Contents
Report of Independent Regist****ered Public Accounting Firm
To the Stockholders and the Board of Directors of Garmin Ltd. and Subsidiaries
Opinion on the Financial Statements
We have audited the accompanying consolidated balance sheets of Garmin Ltd. and Subsidiaries (the Company) as of December 31, 2022 and December 25, 2021, the related consolidated statements of income, comprehensive income, stockholders’ equity and cash flows for each of the three years in the period ended December 31, 2022, and the related notes (collectively referred to as the “consolidated financial statements”). In our opinion, the consolidated financial statements present fairly, in all material respects, the financial position of the Company at December 31, 2022 and December 25, 2021, and the results of its operations and its cash flows for each of the three years in the period ended December 31, 2022, in conformity with U.S. generally accepted accounting principles.
We also have audited, in accordance with the standards of the Public Company Accounting Oversight Board (United States) (PCAOB), the Company’s internal control over financial reporting as of December 31, 2022, based on criteria established in Internal Control-Integrated Framework issued by the Committee of Sponsoring Organizations of the Treadway Commission (2013 framework) and our report dated February 22, 2023, expressed an unqualified opinion thereon.
Basis for Opinion
These financial statements are the responsibility of the Company’s management. Our responsibility is to express an opinion on the Company’s financial statements based on our audits. We are a public accounting firm registered with the PCAOB and are required to be independent with respect to the Company in accordance with the U.S. federal securities laws and the applicable rules and regulations of the Securities and Exchange Commission and the PCAOB.
We conducted our audits in accordance with the standards of the PCAOB. Those standards require that we plan and perform the audit to obtain reasonable assurance about whether the financial statements are free of material misstatement, whether due to error or fraud. Our audits included performing procedures to assess the risks of material misstatement of the financial statements, whether due to error or fraud, and performing procedures that respond to those risks. Such procedures included examining, on a test basis, evidence regarding the amounts and disclosures in the financial statements. Our audits also included evaluating the accounting principles used and significant estimates made by management, as well as evaluating the overall presentation of the financial statements. We believe that our audits provide a reasonable basis for our opinion.
Critical Audit Matters
The critical audit matters communicated below are matters arising from the current period audit of the financial statements that were communicated or required to be communicated to the audit committee and that: (1) relate to accounts or disclosures that are material to the financial statements and (2) involved our especially challenging, subjective or complex judgments. The communication of critical audit matters does not alter in any way our opinion on the consolidated financial statements, taken as a whole, and we are not, by communicating the critical audit matters below, providing separate opinions on the critical audit matters or on the accounts or disclosures to which they relate.
Valuation of Goodwill
| Description of the Matter | The Company assigns goodwill acquired in business combinations to its reporting units as of each acquisition date. At December 31, 2022, the Company’s goodwill balance related to the consumer auto reporting unit was approximately $77 million. As discussed in Note 1 of the consolidated financial statements, goodwill is tested for impairment at least annually at the reporting unit level. Revenue and profits of the consumer auto reporting unit declined for a number of years through fiscal 2020 as competing technologies emerged and market saturation occurred for certain key products. Revenue and profit of the consumer auto reporting unit has since experienced periods of increases and decreases. Considering uncertainty in qualitative factors, management performed a step one quantitative impairment test of the consumer auto reporting unit in the fourth quarter of 2022. |
| Auditing management’s annual goodwill impairment test for the consumer auto reporting unit was complex and highly judgmental due to the significant estimation required in determining the fair value of the reporting unit. In particular, the fair value estimate was sensitive to significant assumptions such as the discount rate, projected future revenues, projected future operating margins, and terminal growth rates which are affected by expectations about future market or economic conditions. | |
| How We Addressed the Matter in Our Audit | We obtained an understanding, evaluated the design and tested the operating effectiveness of controls over the Company’s consumer auto goodwill impairment review process. For example, we tested controls over management's review of the significant assumptions (e.g., discount rate, projected revenue growth rates, projected operating margins, terminal growth rates) used to develop the prospective financial information (PFI) for the quantitative analysis. We also tested management's controls to validate that the data used in the valuation was complete and accurate. To test the estimated fair value of the Company’s consumer auto reporting unit, we performed audit procedures that included, among others, assessing the methodology and testing the significant assumptions discussed above and the underlying data used by the Company in its analysis. We included valuation specialists on our team to review the Company’s model, method, and the more sensitive assumptions such as the discount rate and terminal growth assumptions. We compared the significant assumptions used by management to current industry and economic trends, changes to the Company’s business model, forecasts used in the Company’s annual operating plans and other relevant factors. We assessed the historical accuracy of management’s forecast estimates and performed sensitivity analyses of significant assumptions to evaluate the changes in the fair value of the consumer auto reporting unit that would result from changes in the assumptions. We reconciled the fair value of the reporting unit to its carrying value, testing the Company’s determination of the assets and liabilities used within the reporting unit that are the basis for the carrying value. In addition, we tested management’s reconciliat |
Showing the first 8K of 126K characters. Open the full section
Item 9. Changes in and Disagreements with Accountants on Accounting and Financial Disclosure
None.
Item 9A. Controls and Procedures
(a) Conclusion Regarding the Effectiveness of Disclosure Controls and Procedures
Under the supervision and with the participation of our management, including the Chief Executive Officer and Chief Financial Officer, we have evaluated the effectiveness of the design and operation of our disclosure controls and procedures pursuant to Exchange Act Rule 13a-15(b) as of the end of the period covered by this report. Based on the evaluation, the Chief Executive Officer and Chief Financial Officer have concluded that these disclosure controls and procedures are effective.
(b) Management’s Report on Internal Control over Financial Reporting
Management of the Company is responsible for establishing and maintaining adequate internal control over financial reporting for the Company. The Company’s internal control over financial reporting is a process designed to provide reasonable assurance regarding the reliability of financial reporting and the preparation of financial statements for external purposes in accordance with generally accepted accounting principles.
Because of its inherent limitations, internal control over financial reporting may not prevent or detect misstatements. Also, projections of any evaluation of effectiveness to future periods are subject to the risk that controls may become inadequate because of changes in conditions, or that the degree of compliance with the policies or procedures may deteriorate.
Management of the Company assessed the effectiveness of the Company’s internal control over financial reporting as of December 31, 2022. In making this assessment, management used the criteria set forth by the Committee of Sponsoring Organizations of the Treadway Commission (COSO) in “Internal Control-Integrated Framework” (2013 framework).
Based on such assessment and those criteria, management believes that the Company maintained effective internal control over financial reporting as of December 31, 2022.
Ernst & Young LLP, the independent registered public accounting firm that audited the Company’s consolidated financial statements, issued an attestation report on management’s effectiveness of the Company’s internal control over financial reporting as of December 31, 2022, as stated in their report which is included herein. That attestation report appears below.
(c) Attestation Report of the Independent Registered Public Accounting Firm
Report of Independent Registered Public Accounting Firm
To the Stockholders and the Board of Directors of Garmin Ltd. and Subsidiaries
Opinion on Internal Control over Financial Reporting
We have audited Garmin Ltd. and Subsidiaries’ internal control over financial reporting as of December 31, 2022, based on criteria established in Internal Control-Integrated Framework issued by the Committee of Sponsoring Organizations of the Treadway Commission (2013 framework), (the COSO criteria). In our opinion, Garmin Ltd. and Subsidiaries (the Company) maintained, in all material respects, effective internal control over financial reporting as of December 31, 2022, based on the COSO criteria.
We also have audited, in accordance with the standards of the Public Company Accounting Oversight Board (United States) (PCAOB), the consolidated balance sheets of the Company as of December 31, 2022 and December 25, 2021, the related consolidated statements of income, comprehensive income, stockholders’ equity and cash flows for each of the three years in the period ended December 31, 2022, and the related notes and our report dated February 22, 2023 expressed an unqualified opinion thereon.
Basis for Opinion
The Company’s management is responsible for maintaining effective internal control over financial reporting and for its assessment of the effectiveness of internal control over financial reporting included in the accompanying Management’s Report on Internal Control over Financial Reporting. Our responsibility is to express an opinion on the Company’s internal control over financial reporting based on our audit. We are a public accounting firm registered with the PCAOB and are required to be independent with respect to the Company in accordance with the U.S. federal securities laws and the applicable rules and regulations of the Securities and Exchange Commission and the PCAOB.
We conducted our audit in accordance with the standards of the PCAOB. Those standards require that we plan and perform the audit to obtain reasonable assurance about whether effective internal control over financial reporting was maintained in all material respects.
Our audit included obtaining an understanding of internal control over financial reporting, assessing the risk that a material weakness exists, testing and evaluating the design and operating effectiveness of internal control based on the assessed risk, and performing such other procedures as we considered necessary in the circumstances. We believe that our audit provides a reasonable basis for our opinion.
Definition and Limitations of Internal Control Over Financial Reporting
A company’s internal control over financial reporting is a process designed to provide reasonable assurance regarding the reliability of financial reporting and the preparation of financial statements for external purposes in accordance with generally accepted accounting principles. A company’s internal control over financial reporting includes those policies and procedures that (1) pertain to the maintenance of records that, in reasonable detail, accurately and fairly reflect the transactions and dispositions of the assets of the company; (2) provide reasonable assurance that transactions are recorded as necessary to permit preparation of financial statements in accordance with generally accepted accounting principles, and that receipts and expenditures of the company are being made only in accordance with authorizations of management and directors of the company; and (3) provide reasonable assurance regarding prevention or timely detection of unauthorized acquisition, use, or disposition of the company’s assets that could have a material effect on the financial statements.
Because of its inherent limitations, internal control over financial reporting may not prevent or detect misstatements. Also, projections of any evaluation of effectiveness to future periods are subject to the risk that controls may become inadequate because of changes in conditions, or that the degree of compliance with the policies or procedures may deteriorate.
/s/ Ernst & Young LLP
Kansas City, Missouri
February 22, 2023
(d) Changes in Internal Control over Financial Reporting
There were no changes in our internal control over financial reporting during the quarter ended December 31, 2022 that have materially affected, or are reasonably likely to materially affect, our internal control over financial reporting.
Item 9B. Other Information
Not applicable.
Item 9C. Disclosure Regarding Foreign Jurisdictions that Prevent Inspections
Not applicable.
PART III
Item 10. Directors, Executive Officers and Corporate Governance
Garmin has incorporated by reference certain information in response or partial response to the Items under this Part III of this Annual Report on Form 10-K pursuant to General Instruction G(3) of this Form 10-K and Rule 12b-23 under the Exchange Act. Garmin’s definitive proxy statement in connection with its annual meeting of shareholders scheduled for June 9, 2023 (the “Proxy Statement”) will be filed with the Securities and Exchange Commission no later than 120 days after December 31, 2022.
(a)
Directors of the Company
The information set forth in response to Item 401 of Regulation S-K under the headings “Proposal 5 – Re-election of six directors” in the Proxy Statement is hereby incorporated herein by reference in partial response to this Item 10.
(b)
Executive Officers of the Company
The information set forth in response to Item 401 of Regulation S-K under the heading “Information about our Executive Officers” in Part I of this Form 10-K is incorporated herein by reference in partial response to this Item 10.
(c)
Delinquent Section 16(a) Reports
The information set forth in response to Item 405 of Regulation S-K under the heading “Delinquent Section 16(a) Reports” in the Proxy Statement is hereby incorporated herein by reference in partial response to this Item 10.
(d)
Audit Committee and Audit Committee Financial Expert
The information set forth in response to Item 402 of Regulation S-K under the heading “Board Meetings and Standing Committee Meetings - Audit Committee” in the Proxy Statement is hereby incorporated herein by reference in partial response to this Item 10.
The Audit Committee consists of Joseph J. Hartnett, Charles W. Peffer and Catherine A. Lewis. Mr. Peffer serves as the Chairman of the Audit Committee. All members of the Audit Committee are “independent” within the meaning of the rules of the SEC and the New York Stock Exchange rules. Garmin’s Board of Directors has determined that Mr. Hartnett, Ms. Lewis, and Mr. Peffer are “audit committee financial experts” as defined by the SEC regulations implementing Section 407 of the Sarbanes-Oxley Act of 2002.
(e)
Code of Ethics
Garmin’s Board of Directors has adopted the Code of Conduct of Garmin Ltd. and Subsidiaries (the “Code”). The Code is applicable to all Garmin employees including the President and Chief Executive Officer, the Chief Financial Officer, the Controller and other officers. A copy of the Code is available on Garmin’s website at: https://www8.garmin.com/aboutGarmin/invRelations/documents/Code_of_Conduct.pdf. If any amendments to the Code are made, or any waivers with respect to the Code are granted to the President and Chief Executive Officer, the Chief Financial Officer or Controller, or any person performing a similar function, such amendment or waiver will be disclosed on Garmin’s website at: https://www8.garmin.com/aboutGarmin/invRelations/documents/Code_of_Conduct.pdf.
Item 11. Executive Compensation
The information set forth in response to Item 402 of Regulation S-K under the headings “Executive Compensation Matters” and “Proposal 5 - Re-election of six directors – Non-Management Director Compensation” in the Proxy Statement is hereby incorporated herein by reference in partial response to this Item 11.
The information set forth in response to Item 407(e)(4) of Regulation S-K under the heading “Proposal 5 -Re-election of six directors – Compensation Committee Interlocks and Insider Participation; Certain Relationships” in the Proxy Statement is hereby incorporated herein by reference in partial response to this Item 11.
The information set forth in response to Item 407(e)(5) of Regulation S-K under the heading “Executive Compensation Matters – Compensation Committee Report” in the Proxy Statement is hereby incorporated herein by reference in partial response to this Item 11.
Item 12. Security Ownership of Certain Beneficial Owners and Management and Related Stockholder Matters
The information set forth in response to Item 403 of Regulation S-K under the heading “Stock Ownership of Certain Beneficial Owners and Management” in the Proxy Statement is hereby incorporated herein by reference in partial response to this Item 12.
Equity Compensation Plan Information
The following table gives information as of December 31, 2022 about the Garmin common shares that may be issued under all of the Company’s existing equity compensation plans, as adjusted for stock splits.
| A | B | C | ||||||||
| Plan Category | Number of securities to be issued upon outstanding options, exercise of warrants and rights | Weighted- average exercise price of outstanding options, warrants and rights | Number of securities remaining available for future issuance under equity compensation plans (excluding securities reflected in column A) | |||||||
| Equity compensation plans approved by shareholders | 1,836,575 | N/A | 3,097,074 | |||||||
| Equity compensation plans not approved by shareholders | — | N/A | — | |||||||
| Total | 1,836,575 | N/A | 3,097,074 |
Table consists of the Garmin Ltd. 2000 Equity Incentive Plan, as amended and restated on June 27, 2010 (the “2000 Plan”), the Garmin Ltd. 2005 Equity Incentive Plan, as amended and restated on June 7, 2019, the Garmin Ltd. Employee Stock Purchase Plan, as amended and restated on June 7, 2019, and the Garmin Ltd. 2011 Non-Employee Directors’ Equity Incentive Plan, as amended and restated on February 15, 2019. In February 2023, the Board of Directors approved the termination of the 2000 Plan, which was effective immediately and resulted in 532,017 of remaining common shares previously authorized for issuance under the plan to be no longer available for issuance. The weighted-average exercise price does not reflect the shares that will be issued upon the payment of outstanding awards of RSUs.
The Company has no knowledge of any arrangement, the operation of which may at a subsequent date result in a change in control of the Company.
Item 13. Certain Relationships and Related Transactions, and Director Independence
The information set forth in response to Item 404 of Regulation S-K under the heading “Proposal 5 – Re-election of six directors - Compensation Committee Interlocks and Insider Participation; Certain Relationships” in the Proxy Statement is incorporated herein by reference in partial response to this Item 13.
The information set forth in response to Item 407(a) of Regulation S-K under the headings “Proposal 5 – Re-election of six directors” in the Proxy Statement is hereby incorporated herein by reference in partial response to this Item 13.
Item 14. Principal Accountant Fees and Services
The information set forth under the headings “Audit Matters -- Independent Registered Public Accounting Firm Fees” and “Pre-Approval of Services Provided by the Independent Auditor” in the Proxy Statement is hereby incorporated by reference in response to this Item 14.
PART IV
Item 15. Exhibits, and Financial Statement Schedules
(a) List of Documents filed as part of this Report
(1) Consolidated Financial Statements
The consolidated financial statements and related notes, together with the reports of Ernst & Young LLP, appear in Part II, Item 8 “Financial Statements and Supplementary Data” of this Form 10-K.
(2) Financial Statement Schedules
All schedules have been omitted because they are not applicable, are insignificant, or the required information is shown in the consolidated financial statements or notes thereto.
(3) Exhibits
The exhibits listed below are filed as part of, or incorporated by reference into, this Annual Report on Form 10-K:
- Management contract or compensatory plan or arrangement pursuant to 601(b)(10)(iii)(A) of Regulation S-K.
Item 16. Form 10-K Summary
None.
SIGNAT****URES
Pursuant to the requirements of Section 13 or 15(d) of the Securities Exchange Act of 1934, the registrant has duly caused this report to be signed on its behalf by the undersigned, thereunto duly authorized.
| GARMIN LTD. | ||
| By | /s/ Clifton A. Pemble | |
| Clifton A. Pemble | ||
| President and Chief Executive Officer |
Dated: February 22, 2023
POWER OF ATTORNEY
Know all persons by these presents, that each person whose signature appears below constitutes and appoints Clifton A. Pemble and Douglas G. Boessen and Andrew R. Etkind, and each of them, as his attorney-in-fact, with the power of substitution, for him in any and all capacities, to sign any amendments to this Annual Report on Form 10-K, and to file the same, with exhibits thereto and other documents in connection therewith, with the Securities and Exchange Commission, hereby ratifying and confirming all that said attorney-in-fact, or his substitute or substitutes, may do or cause to be done by virtue hereof.
Pursuant to the requirements of the Securities Exchange Act of 1934, this report on Form 10-K has been signed below by the following persons on behalf of the registrant and in the capacities indicated on February 22, 2023.
| /s/ Clifton A. Pemble | ||
| Clifton A. Pemble | ||
| Director, President and Chief Executive Officer | ||
| (Principal Executive Officer) | ||
| /s/ Douglas G. Boessen | ||
| Douglas G. Boessen | ||
| Chief Financial Officer and Treasurer | ||
| (Principal Financial Officer and Principal Accounting Officer) | ||
| /s/ Min H. Kao | /s/ Jonathan C. Burrell | |
| Min H. Kao | Jonathan C. Burrell | |
| Executive Chairman | Director | |
| /s/ Joseph J. Hartnett | /s/ Catherine A. Lewis | |
| Joseph J. Hartnett | Catherine A. Lewis | |
| Director | Director | |
| /s/ Charles W. Peffer | ||
| Charles W. Peffer | ||
| Director |
Garmin Ltd.
2022 Form 10-K Annual Report
Exhibit Index
The following exhibits are attached hereto. See Part IV of this Annual Report on Form 10-K for a complete list of exhibits.