 filings.tools
Halliburton 2018 10-K Annual Report
HAL · CIK 45012 · Form 10-K · Fiscal year ended December 31, 2018 · Filed February 13, 2019
17 sections, 286K characters. Original on sec.gov · Markdown · JSON
Cover and table of contents
UNITED STATES SECURITIES AND EXCHANGE COMMISSION
Washington, D.C. 20549
FORM 10-K
(Mark One)
[X] Annual Report Pursuant to Section 13 or 15(d) of the Securities Exchange Act of 1934
For the fiscal year ended December 31, 2018
OR
[ ] Transition Report Pursuant to Section 13 or 15(d) of the Securities Exchange Act of 1934
For the transition period from ______ to ______
Commission File Number 001-03492
HALLIBURTON COMPANY
(Exact name of registrant as specified in its charter)
| Delaware | 75-2677995 |
| (State or other jurisdiction of | (I.R.S. Employer |
| incorporation or organization) | Identification No.) |
| 3000 North Sam Houston Parkway East | |
| Houston, Texas 77032 | |
| (Address of principal executive offices) | |
| Telephone Number – Area code (281) 871-2699 | |
| Securities registered pursuant to Section 12(b) of the Act: | |
| Name of each exchange on | |
| Title of each class | which registered |
| Common Stock par value $2.50 per share | New York Stock Exchange |
| Securities registered pursuant to Section 12(g) of the Act: None | |
Indicate by check mark if the registrant is a well-known seasoned issuer, as defined in Rule 405 of the Securities Act.
Yes [X] No [ ]
Indicate by check mark if the registrant is not required to file reports pursuant to Section 13 or Section 15(d) of the Act.
Yes [ ] No [X]
Indicate by check mark whether the registrant (1) has filed all reports required to be filed by Section 13 or 15(d) of the Securities Exchange Act of 1934 during the preceding 12 months (or for such shorter period that the registrant was required to file such reports), and (2) has been subject to such filing requirements for the past 90 days.
Yes [X] No [ ]
Indicate by check mark whether the registrant has submitted electronically every Interactive Data File required to be submitted pursuant to Rule 405 of Regulation S-T (§ 232.405 of this chapter) during the preceding 12 months (or for such shorter period that the registrant was required to submit such files).
Yes [X] No [ ]
Indicate by check mark if disclosure of delinquent filers pursuant to Item 405 of Regulation S-K (§229.405 of this chapter) is not contained herein, and will not be contained, to the best of registrant’s knowledge, in definitive proxy or information statements incorporated by reference in Part III of this Form 10-K or any amendment to this Form 10-K. [X]
Indicate by check mark whether the registrant is a large accelerated filer, an accelerated filer, a non-accelerated filer, a smaller reporting company, or an emerging growth company. See the definitions of “large accelerated filer,” “accelerated filer,” “smaller reporting company,” and "emerging growth company" in Rule 12b-2 of the Exchange Act.
Large Accelerated Filer[X] Accelerated Filer [ ]
Non-accelerated Filer [ ] Smaller Reporting Company [ ]
Emerging Growth Company [ ]
Indicate by check mark whether the registrant is a shell company (as defined in Rule 12b-2 of the Exchange Act). Yes [ ] No [X]
The aggregate market value of Halliburton Company Common Stock held by nonaffiliates on June 30, 2018, determined using the per share closing price on the New York Stock Exchange Composite tape of $45.06 on that date, was approximately $39.5 billion.
As of February 8, 2019, there were 872,542,842 shares of Halliburton Company Common Stock, $2.50 par value per share, outstanding.
Portions of the Halliburton Company Proxy Statement for our 2019 Annual Meeting of Stockholders (File No. 001-03492) are incorporated by reference into Part III of this report.
HALLIBURTON COMPANY
Index to Form 10-K
For the Year Ended December 31, 2018
i
PART I
Item 1. Business**.**
General description of business
Halliburton Company’s predecessor was established in 1919 and incorporated under the laws of the State of Delaware in 1924. With approximately 60,000 employees, representing 140 nationalities in more than 80 countries, we help our customers maximize value throughout the lifecycle of the reservoir - from locating hydrocarbons and managing geological data, to drilling and formation evaluation, well construction and completion and optimizing production throughout the life of the asset. We serve major, national and independent oil and natural gas companies throughout the world and operate under two divisions, which form the basis for the two operating segments we report, the Completion and Production segment and the Drilling and Evaluation segment.
Completion and Production delivers cementing, stimulation, intervention, pressure control, specialty chemicals, artificial lift and completion products and services. The segment consists of the following product service lines:
| - | Production Enhancement: includes stimulation services and sand control services. Stimulation services optimize oil and natural gas reservoir production through a variety of pressure pumping services, nitrogen services and chemical processes, commonly known as hydraulic fracturing and acidizing. Sand control services include fluid and chemical systems and pumping services for the prevention of formation sand production. |
| - | Cementing: involves bonding the well and well casing while isolating fluid zones and maximizing wellbore stability. Our cementing product service line also provides casing equipment. |
| - | Completion Tools: provides downhole solutions and services to our customers to complete their wells, including well completion products and services, intelligent well completions, liner hanger systems, sand control systems and service tools. |
| - | Production Solutions: provides customized well intervention solutions to increase well performance, which includes coiled tubing, hydraulic workover units and downhole tools. |
| - | Pipeline & Process Services: provides a complete range of pre-commissioning, commissioning, maintenance and decommissioning services to the onshore and offshore pipeline and process plant construction, commissioning and maintenance industries. |
| - | Multi-Chem: provides customized specialty oilfield completion, production, and downstream water and process treatment chemicals and services to maximize production, ensure integrity of well and pipeline assets and address production, processing and transportation challenges. |
| - | Artificial Lift: provides services to maximize reservoir and wellbore recovery by applying lifting technology, intelligent field management solutions and related services throughout the life of the well, including electrical submersible pumps and progressive cavity pumps. |
Drilling and Evaluation provides field and reservoir modeling, drilling, evaluation and precise wellbore placement solutions that enable customers to model, measure, drill and optimize their well construction activities. The segment consists of the following product service lines:
| - | Baroid: provides drilling fluid systems, performance additives, completion fluids, solids control, specialized testing equipment and waste management services for oil and natural gas drilling, completion and workover operations. |
| - | Sperry Drilling: provides drilling systems and services that offer directional control for precise wellbore placement while providing important measurements about the characteristics of the drill string and geological formations while drilling wells. These services include directional and horizontal drilling, measurement-while-drilling, logging-while-drilling, surface data logging, multilateral systems, underbalanced applications and rig site information systems. |
| - | Wireline and Perforating: provides open-hole logging services that supply information on formation evaluation and reservoir fluid analysis, including formation lithology, rock properties and reservoir fluid properties. Also offered are cased-hole and slickline services, including perforating, pipe recovery services, through-casing formation evaluation and reservoir monitoring, casing and cement integrity measurements and well intervention services. |
| - | Drill Bits and Services: provides roller cone rock bits, fixed cutter bits, hole enlargement and related downhole tools and services used in drilling oil and natural gas wells. In addition, coring equipment and services are provided to acquire cores of the formation drilled for evaluation. |
| - | Landmark Software and Services: supplies integrated exploration, drilling and production software and related professional and data management services for the upstream oil and natural gas industry. |
| - | Testing and Subsea: provides acquisition and analysis of dynamic reservoir information and reservoir optimization solutions to the oil and natural gas industry through a broad portfolio of test tools, data acquisition services, fluid sampling, surface well testing and subsea safety systems. |
| - | Consulting and Project Management: provides integrated solutions to our customers by leveraging the full line of our oilfield services, products and technologies to solve customer challenges throughout the oilfield lifecycle. It includes project management, consulting, integrated asset management and well control and prevention services. |
See Note 2 to the consolidated financial statements for further financial information related to each of our business segments. We have manufacturing operations in various locations, the most significant of which are located in the United States, Canada, Malaysia, Singapore and the United Kingdom.
Business strategy
Our value proposition is to collaborate and engineer solutions to maximize asset value for our customers. We strive to achieve superior growth and returns for our shareholders by delivering technology and services that improve efficiency, increase recovery and maximize production for our customers. Our objectives are to:
| - | create a balanced portfolio of services and products supported by global infrastructure and anchored by technological innovation to further differentiate our company; |
| - | reach a distinguished level of operational excellence that reduces costs and creates real value; |
| - | preserve a dynamic workforce by being a preferred employer to attract, develop and retain the best global talent; and |
| - | uphold our strong ethical and business standards, and maintain the highest standards of health, safety and environmental performance. |
For further discussion on our business strategies, see "Management’s Discussion and Analysis of Financial Condition and Results of Operations – Executive Overview."
Markets and competition
We are one of the world’s largest diversified energy services companies. Our services and products are sold in highly competitive markets throughout the world. Competitive factors impacting sales of our services and products include: price; service delivery; health, safety and environmental standards and practices; service quality; global talent retention; understanding the geological characteristics of the hydrocarbon reservoir; product quality; warranty; and technical proficiency.
We conduct business worldwide in more than 80 countries. The business operations of our divisions are organized around four primary geographic regions: North America, Latin America, Europe/Africa/CIS and Middle East/Asia. In 2018, 2017 and 2016, based on the location of services provided and products sold, 58%, 53% and 41% of our consolidated revenue was from the United States. No other country accounted for more than 10% of our consolidated revenue during these periods. See “Management’s Discussion and Analysis of Financial Condition and Results of Operations” for additional information about our geographic operations. Because the markets for our services and products are vast and cross numerous geographic lines, it is not practicable to provide a meaningful estimate of the total number of our competitors. The industries we serve are highly competitive, and we have many substantial competitors. Most of our services and products are marketed through our service and sales organizations.
Operations in some countries may be adversely affected by unsettled political conditions, acts of terrorism, civil unrest, force majeure, war or other armed conflict, sanctions, expropriation or other governmental actions, inflation, changes in foreign currency exchange rates, foreign currency exchange restrictions and highly inflationary currencies, as well as other geopolitical factors. We believe the geographic diversification of our business activities reduces the risk that loss of operations in any one country, other than the United States, would be materially adverse to our business, consolidated results of operations or consolidated financial condition.
Information regarding our exposure to foreign currency fluctuations, risk concentration and financial instruments used to minimize risk is included in “Management’s Discussion and Analysis of Financial Condition and Results of Operations – Financial Instrument Market Risk” and in Note 13 to the consolidated financial statements.
Customers
Our revenue from continuing operations during the past three years was derived from the sale of services and products to the energy industry. No single customer represented more than 10% of our consolidated revenue in any period presented.
Raw materials
Raw materials essential to our business are normally readily available. Market conditions can trigger constraints in the supply of certain raw materials, such as proppants (primarily sand), hydrochloric acid and gels, including guar gum (a blending additive used in hydraulic fracturing). We are always seeking ways to ensure the availability of resources, as well as manage costs of raw materials. Our procurement department uses our size and buying power to enhance our access to key materials at competitive prices.
Patents
We own a large number of patents and have pending a substantial number of patent applications covering various products and processes. We are also licensed to utilize technology covered by patents owned by others, and we license others to utilize technology covered by our patents. We do not consider any particular patent to be material to our business operations.
Seasonality
Weather and natural phenomena can temporarily affect the performance of our services, but the widespread geographical locations of our operations mitigate those effects. Examples of how weather can impact our business include:
| - | the severity and duration of the winter in North America can have a significant impact on natural gas storage levels and drilling activity; |
| - | the timing and duration of the spring thaw in Canada directly affects activity levels due to road restrictions; |
| - | typhoons and hurricanes can disrupt coastal and offshore operations; and |
| - | severe weather during the winter normally results in reduced activity levels in the North Sea and Russia. |
Additionally, customer spending patterns for software, completion tools and various other oilfield services and products typically result in higher activity in the fourth quarter of the year. Conversely, customer budget constraints may lead to lower demand for our services and products in the fourth quarter of the year.
Employees
At December 31, 2018, we employed approximately 60,000 people worldwide compared to approximately 55,000 at December 31, 2017. At December 31, 2018, approximately 13% of our employees were subject to collective bargaining agreements. Based upon the geographic diversification of these employees, we do not believe any risk of loss from employee strikes or other collective actions would be material to the conduct of our operations taken as a whole.
Environmental regulation
We are subject to numerous environmental, legal and regulatory requirements related to our operations worldwide. For further information related to environmental matters and regulation, see Note 8 to the consolidated financial statements and Item 1(a), “Risk Factors.”
Hydraulic fracturing
Hydraulic fracturing is a process that creates fractures extending from the well bore into the rock formation to enable natural gas or oil to move more easily from the rock pores to a production conduit. A significant portion of our Completion and Production segment provides hydraulic fracturing services to customers developing shale natural gas and shale oil. From time to time, questions arise about the scope of our operations in the shale natural gas and shale oil sectors, and the extent to which these operations may affect human health and the environment.
At the direction of our customer, we design and generally implement a hydraulic fracturing operation to 'stimulate' the well's production, once the well has been drilled, cased and cemented. Our customer is generally responsible for providing the base fluid (usually water) used in the hydraulic fracturing of a well. We generally supply the proppant (primarily sand) and at least a portion of the additives used in the overall fracturing fluid mixture. In addition, we mix the additives and proppant with the base fluid and pump the mixture down the wellbore to create the desired fractures in the target formation. The customer is responsible for disposing and/or recycling for further use any materials that are subsequently produced or pumped out of the well, including flowback fluids and produced water.
As part of the process of constructing the well, the customer will take a number of steps designed to protect drinking water resources. In particular, the casing and cementing of the well are designed to provide 'zonal isolation' so that the fluids pumped down the wellbore and the oil and natural gas and other materials that are subsequently pumped out of the well will not come into contact with shallow aquifers or other shallow formations through which those materials could potentially migrate to freshwater aquifers or the surface.
The potential environmental impacts of hydraulic fracturing have been studied by numerous government entities and others. In 2004, the United States Environmental Protection Agency (EPA) conducted an extensive study of hydraulic fracturing practices, focusing on coalbed methane wells, and their potential effect on underground sources of drinking water. The EPA’s study concluded that hydraulic fracturing of coalbed methane wells poses little or no threat to underground sources of drinking water. In December 2016, the EPA released a final report, “Hydraulic Fracturing for Oil and Gas: Impacts from the Hydraulic Fracturing Water Cycle on Drinking Water Resources in the United States” representing the culmination of a six-year study requested by Congress. While the EPA report noted a potential for some impact to drinking water sources caused by hydraulic fracturing, the agency confirmed the overall incidence of impacts is low. Moreover, a number of the areas of potential impact identified in the report involve activities for which we are not generally responsible, such as potential impacts associated with withdrawals of surface water for use as a base fluid and management of wastewater.
We have proactively developed processes to provide our customers with the chemical constituents of our hydraulic fracturing fluids to enable our customers to comply with state laws as well as voluntary standards established by the Chemical Disclosure Registry, www.fracfocus.org. We have also invested considerable resources in developing hydraulic fracturing technologies, in both the equipment and chemistry portions of our business, which offer our customers a variety of environment-friendly alternatives related to the use of hydraulic fracturing fluid additives and other aspects of our hydraulic fracturing operations. We created a hydraulic fracturing fluid system comprised of materials sourced entirely from the food industry. In addition, we have engineered a process that uses ultraviolet light to control the growth of bacteria in hydraulic fracturing fluids, allowing customers to minimize the use of chemical biocides. We are committed to the continued development of innovative chemical and mechanical technologies that allow for more economical and environment-friendly development of the world’s oil and natural gas reserves, and that reduce noise while complying with Tier 4 lower emission legislation.
In evaluating any environmental risks that may be associated with our hydraulic fracturing services, it is helpful to understand the role that we play in the development of shale natural gas and shale oil. Our principal task generally is to manage the process of injecting fracturing fluids into the borehole to 'stimulate' the well. Thus, based on the provisions in our contracts and applicable law, the primary environmental risks we face are potential pre-injection spills or releases of stored fracturing fluids and potential spills or releases of fuel or other fluids associated with pumps, blenders, conveyors, or other above-ground equipment used in the hydraulic fracturing process.
Although possible concerns have been raised about hydraulic fracturing, the circumstances described above have helped to mitigate those concerns. To date, we have not been obligated to compensate any indemnified party for any environmental liability arising directly from hydraulic fracturing, although there can be no assurance that such obligations or liabilities will not arise in the future. For further information on risks related to hydraulic fracturing, see Item 1(a), “Risk Factors.”
Working capital
We fund our business operations through a combination of available cash and equivalents, short-term investments and cash flow generated from operations. In addition, our revolving credit facility is available for additional working capital needs.
Web site access
Our annual reports on Form 10-K, quarterly reports on Form 10-Q, current reports on Form 8-K and amendments to those reports filed or furnished pursuant to Section 13(a) or 15(d) of the Securities Exchange Act of 1934 are made available free of charge on our internet web site (www.halliburton.com) as soon as reasonably practicable after we have electronically filed the material with, or furnished it to, the Securities and Exchange Commission (SEC). The SEC maintains an internet site (www.sec.gov) that contains our reports, proxy and information statements and our other SEC filings. We have posted on our web site our Code of Business Conduct, which applies to all of our employees and Directors and serves as a code of ethics for our principal executive officer, principal financial officer, principal accounting officer and other persons performing similar functions. Any amendments to our Code of Business Conduct or any waivers from provisions of our Code of Business Conduct granted to the specified officers above are disclosed on our web site within four business days after the date of any amendment or waiver pertaining to these officers. There have been no waivers from provisions of our Code of Business Conduct for the years 2018, 2017, or 2016. Except to the extent expressly stated otherwise, information contained on or accessible from our web site or any other web site is not incorporated by reference into this annual report on Form 10-K and should not be considered part of this report.
Executive Officers of the Registrant
The following table indicates the names and ages of the executive officers of Halliburton Company as of February 13, 2019, including all offices and positions held by each in the past five years:
| Name and Age | Offices Held and Term of Office | |
| Anne L. Beaty (Age 62) | Senior Vice President, Finance of Halliburton Company, since March 2017 | |
| Senior Vice President, Internal Assurance Services of Halliburton Company, November 2013 to March 2017 | ||
| Eric J. Carre (Age 52) | Executive Vice President, Global Business Lines of Halliburton Company, since May 2016 | |
| Senior Vice President, Drilling and Evaluation Division of Halliburton Company, June 2011 to April 2016 | ||
| Charles E. Geer, Jr. (Age 48) | Vice President and Corporate Controller of Halliburton Company, since January 2015 | |
| Vice President, Finance of Halliburton Company, December 2013 to December 2014 | ||
| Myrtle L. Jones (Age 59) | Senior Vice President, Tax of Halliburton Company, since March 2013 | |
| Lance Loeffler (Age 41) | Executive Vice President and Chief Financial Officer of Halliburton Company, since November 2018 | |
| Vice President of Investor Relations of Halliburton Company, April 2016 to November 2018 | ||
| Vice President of Corporate Development of Halliburton Company, August 2014 to April 2016 | ||
| Director of Deutsche Bank, March 2011 to August 2014 | ||
| Timothy M. McKeon (Age 46) | Vice President and Treasurer of Halliburton Company, since January 2014 | |
| Jeffrey A. Miller (Age 55) | Chairman of the Board, President and Chief Executive Officer of Halliburton Company, since January 2019 | |
| Member of the Board of Directors, President and Chief Executive Officer of Halliburton Company, June 2017 to December 2018 | ||
| Member of the Board of Directors and President of Halliburton Company, August 2014 to May 2017 | ||
| Executive Vice President and Chief Operating Officer of Halliburton Company, September 2012 to July 2014 | ||
| Lawrence J. Pope (Age 50) | Executive Vice President of Administration and Chief Human Resources Officer of Halliburton Company, since January 2008 | |
| Joe D. Rainey (Age 62) | President, Eastern Hemisphere of Halliburton Company, since January 2011 | |
| Mark J. Richard (Age 57) | President, Western Hemisphere of Halliburton Company, since February 2019 | |
| Senior Vice President, Northern U.S. Region of Halliburton Company, August 2018 to January 2019 | ||
| Senior Vice President, Business Development and Marketing of Halliburton Company, November 2015 to July 2018 | ||
| Senior Vice President, Europe/Sub-Saharan Africa Region of Halliburton Company, February 2014 to October 2015 | ||
| Robb L. Voyles (Age 61) | Executive Vice President, Secretary and General Counsel of Halliburton Company, since May 2015 | |
| Interim Chief Financial Officer of Halliburton Company, March 2017 to June 2017 | ||
| Executive Vice President and General Counsel of Halliburton Company, January 2014 to April 2015 |
There are no family relationships between the executive officers of the registrant or between any director and any executive officer of the registrant.
Item 1. (a). Risk Factors.
The statements in this section describe the known material risks to our business and should be considered carefully.
Trends in oil and natural gas prices affect the level of exploration, development and production activity of our customers and the demand for our services and products, which could have a material adverse effect on our business, consolidated results of operations and consolidated financial condition.
Demand for our services and products is particularly sensitive to the level of exploration, development and production activity of, and the corresponding capital spending by, oil and natural gas companies. The level of exploration, development and production activity is directly affected by trends in oil and natural gas prices, which historically have been volatile and are likely to continue to be volatile. Prices for oil and natural gas are subject to large fluctuations in response to relatively minor changes in the supply of and demand for oil and natural gas, market uncertainty and a variety of other economic factors that are beyond our control. Given the long-term nature of many large-scale development projects, even the perception of longer-term lower oil and natural gas prices by oil and natural gas companies can cause them to reduce or defer major expenditures. We also have a small number of integrated projects that have remuneration tied to hydrocarbon production. Reduction in oil and gas prices can affect the overall returns for these projects, either lengthening the time until the expected returns are realized or by impairing the value of the asset. Any prolonged reductions of commodity prices or expectations of such reductions could have a material adverse effect on our business, consolidated results of operations and consolidated financial condition, and could result in asset impairments and severance costs.
Factors affecting the prices of oil and natural gas include:
| - | the level of supply and demand for oil and natural gas; |
| - | the ability or willingness of the Organization of Petroleum Exporting Countries (OPEC) to set and maintain oil production levels; |
| - | the level of oil production in the U.S. and by other non-OPEC countries; |
| - | oil refining capacity and shifts in end-customer preferences toward fuel efficiency and the use of natural gas; |
| - | the cost of, and constraints associated with, producing and delivering oil and natural gas; |
| - | governmental regulations, including the policies of governments regarding the exploration for and production and development of their oil and natural gas reserves; |
| - | weather conditions and natural disasters; |
| - | worldwide political, military and economic conditions; and |
| - | increased demand for alternative fuels and electric vehicles, including government initiatives to promote the use of renewable energy sources and public sentiment around alternatives to oil and gas. |
Our business is dependent on capital spending by our customers, and reductions in capital spending could have a material adverse effect on our business, consolidated results of operations and consolidated financial condition.
Our business is directly affected by changes in capital expenditures by our customers, and reductions in their capital spending could reduce demand for our services and products and have a material adverse effect on our business, consolidated results of operations, and consolidated financial condition. Some of the items that may impact our customer's capital spending include:
| - | oil and natural gas prices, including volatility of oil and natural gas prices and expectations regarding future prices; |
| - | the inability of our customers to access capital on economically advantageous terms; |
| - | restrictions on our customers' ability to get their produced oil and natural gas to market due to infrastructure limitations (such as those that currently exist in the U.S. Permian Basin); |
| - | the consolidation of our customers; |
| - | customer personnel changes; and |
| - | adverse developments in the business or operations of our customers, including write-downs of oil and natural gas reserves and borrowing base reductions under customer credit facilities. |
Any significant reduction in commodity prices or a change in our customers’ expectations of commodity prices, economic growth or supply and demand for oil and natural gas may result in capital budget reductions in the future. For example, we believe that the drop in the price of oil at the end of 2018, despite the recovery during January 2019, had a negative impact on certain of our customers’ expectations about prices during 2019 and, as a result, the amount of their capital spending budgets for 2019. Any substantial and unexpected drop in commodity prices in the future, even if the drop is relatively short-lived, could similarly affect our customers’ expectations and capital spending, which could result in a material adverse effect on our business, consolidated results of operations and consolidated financial condition.
Our operations are subject to political and economic instability and risk of government actions that could have a material adverse effect on our business, consolidated results of operations and consolidated financial condition.
We are exposed to risks inherent in doing business in each of the countries in which we operate. Our operations are subject to various risks unique to each country that could have a material adverse effect on our business, consolidated results of operations and consolidated financial condition. With respect to any particular country, these risks may include:
| - | political and economic instability, including: |
-
civil unrest, acts of terrorism, war and other armed conflict;
-
inflation; and
-
currency fluctuations, devaluations and conversion restrictions; and
| - | governmental actions that may: |
-
result in expropriation and nationalization of our assets in that country;
-
result in confiscatory taxation or other adverse tax policies;
-
limit or disrupt markets or our operations, restrict payments, or limit the movement of funds;
-
impose sanctions on our ability to conduct business with certain customers or persons;
-
result in the deprivation of contract rights; and
-
result in the inability to obtain or retain licenses required for operation.
For example, due to the unsettled political conditions in many oil-producing countries, our operations, revenue and profits are subject to the adverse consequences of war, terrorism, civil unrest, strikes, currency controls and governmental actions. These and other risks described above could result in the loss of our personnel or assets, cause us to evacuate our personnel from certain countries, cause us to increase spending on security worldwide, cause us to cease operating in certain countries, disrupt financial and commercial markets, including the supply of and pricing for oil and natural gas, and generate greater political and economic instability in some of the geographic areas in which we operate. Areas where we operate that have significant risk include, but are not limited to: the Middle East, North Africa, Angola, Azerbaijan, Indonesia, Kazakhstan, Mexico, Nigeria, Russia and Venezuela. In addition, any possible reprisals as a consequence of military or other action, such as acts of terrorism in the United States or elsewhere, could have a material adverse effect on our business, consolidated results of operations and consolidated financial condition.
Our operations are subject to cyberattacks that could have a material adverse effect on our business, consolidated results of operations and consolidated financial condition.
We are increasingly dependent on digital technologies and services to conduct our business. We use these technologies for internal purposes, including data storage, processing and transmissions, as well as in our interactions with customers and suppliers. Examples of these digital technologies include analytics, automation, and cloud services. Digital technologies and services are subject to the risk of cyberattacks and, given the nature of such attacks, some incidents can remain undetected for a period of time despite our efforts to detect and respond to them in a timely manner. We routinely monitor our systems for cyber threats and have processes in place to detect and remediate vulnerabilities. Nevertheless, we have experienced occasional cyberattacks and attempted breaches over the past year, including phishing emails and ransomware infections. We detected and remediated all of these incidents. No known leakage of financial, technical or customer data occurred and none of the incidents had a material adverse effect on our business, operations, reputation, or consolidated results of operations or consolidated financial condition.
If our systems for protecting against cybersecurity risks prove not to be sufficient, we could be adversely affected by, among other things: loss of or damage to intellectual property, proprietary or confidential information, or customer, supplier, or employee data; interruption of our business operations; and increased costs required to prevent, respond to, or mitigate cybersecurity attacks. These risks could harm our reputation and our relationships with customers, suppliers, employees and other third parties, and may result in claims against us. These risks could have a material adverse effect on our business, consolidated results of operations and consolidated financial condition.
Our operations outside the United States require us to comply with a number of United States and international regulations, violations of which could have a material adverse effect on our business, consolidated results of operations and consolidated financial condition.
Our operations outside the United States require us to comply with a number of United States and international regulations. For example, our operations in countries outside the United States are subject to the United States Foreign Corrupt Practices Act (FCPA), which prohibits United States companies and their agents and employees from providing anything of value to a foreign official for the purposes of influencing any act or decision of these individuals in their official capacity to help obtain or retain business, direct business to any person or corporate entity, or obtain any unfair advantage. Our activities create the risk of unauthorized payments or offers of payments by our employees, agents, or joint venture partners that could be in violation of anti-corruption laws, even though some of these parties are not subject to our control. We have internal control
policies and procedures and have implemented training and compliance programs for our employees and agents with respect to the FCPA. However, we cannot assure that our policies, procedures and programs always will protect us from reckless or criminal acts committed by our employees or agents. We are also subject to the risks that our employees, joint venture partners and agents outside of the United States may fail to comply with other applicable laws. Allegations of violations of applicable anti-corruption laws have resulted and may in the future result in internal, independent, or government investigations. Violations of anti-corruption laws may result in severe criminal or civil sanctions, and we may be subject to other liabilities, which could have a material adverse effect on our business, consolidated results of operations and consolidated financial condition.
In addition, the shipment of goods, services and technology across international borders subjects us to extensive trade laws and regulations. Our import activities are governed by the unique customs laws and regulations in each of the countries where we operate. Moreover, many countries, including the United States, control the export and re-export of certain goods, services and technology and impose related export recordkeeping and reporting obligations. Governments may also impose economic sanctions against certain countries, persons and entities that may restrict or prohibit transactions involving such countries, persons and entities, which may limit or prevent our conduct of business in certain jurisdictions. During 2014, the United States and European Union imposed sectoral sanctions directed at Russia’s oil and gas industry. Among other things, these sanctions restrict the provision of U.S. and EU goods, services and technology in support of exploration or production for deep water, Arctic offshore, or shale projects that have the potential to produce oil in Russia. These sanctions resulted in our winding down and ending work on two projects in Russia in 2014, and have prevented us from pursuing certain other projects in Russia. In 2017 and 2018, the U.S. Government imposed additional sanctions against Russia, Russia’s oil and gas industry and certain Russian companies. Our ability to engage in certain future projects in Russia or involving certain Russian customers is dependent upon whether or not our involvement in such projects is restricted under U.S. or EU sanctions laws and the extent to which any of our current or prospective operations in Russia or with certain Russian customers may be subject to those laws. Those laws may change from time to time, and any expansion of sanctions against Russia’s oil and gas industry could further hinder our ability to do business in Russia or with certain Russian customers, which could have a material adverse effect on our consolidated results of operations.
In 2017, the U.S. Government announced sanctions directed at certain Venezuelan individuals and imposed additional economic sanctions around certain categories of trade financing transactions in Venezuela. In the first quarter of 2018, the Office of Foreign Assets Control (OFAC) of the U.S. Department of the Treasury issued additional guidance on these sanctions which purports to prohibit the acceptance of payments on receivables issued on or after August 25, 2017 and outstanding longer than 90 days from customers subject to U.S. sanctions related to Venezuela in the absence of an OFAC license. During the first quarter of 2018, we wrote down all of our remaining investment in Venezuela. See Note 4 to the consolidated financial statements for further information. On January 28, 2019, OFAC issued additional sanctions targeting the Venezuela energy sector and granted a general license to us to continue our operations in Venezuela until July 27, 2019, subject to previously issued OFAC sanctions. We are continuing our limited operations in Venezuela pursuant to this general license and are evaluating our operations in advance of the July 27, 2019 termination of the general license.
The laws and regulations concerning import activity, export recordkeeping and reporting, export control and economic sanctions are complex and constantly changing. These laws and regulations can cause delays in shipments and unscheduled operational downtime. Moreover, any failure to comply with applicable legal and regulatory trading obligations could result in criminal and civil penalties and sanctions, such as fines, imprisonment, debarment from governmental contracts, seizure of shipments and loss of import and export privileges. In addition, investigations by governmental authorities and legal, social, economic and political issues in these countries could have a material adverse effect on our business, consolidated results of operations and consolidated financial condition.
Changes in, compliance with, or our failure to comply with laws in the countries in which we conduct business may negatively impact our ability to provide services in, make sales of equipment to and transfer personnel or equipment among some of those countries and could have a material adverse effect on our business and consolidated results of operations.
In the countries in which we conduct business, we are subject to multiple and, at times, inconsistent regulatory regimes, including those that govern our use of radioactive materials, explosives and chemicals in the course of our operations. Various national and international regulatory regimes govern the shipment of these items. Many countries, but not all, impose special controls upon the export and import of radioactive materials, explosives and chemicals. Our ability to do business is subject to maintaining required licenses and complying with these multiple regulatory requirements applicable to these special products. In addition, the various laws governing import and export of both products and technology apply to a wide range of services and products we offer. In turn, this can affect our employment practices of hiring people of different nationalities because these laws may prohibit or limit access to some products or technology by employees of various nationalities. Changes in, compliance with, or our failure to comply with these laws may negatively impact our ability to provide services in, make sales of equipment to and transfer personnel or equipment among some of the countries in which we operate and could have a material adverse effect on our business and consolidated results of operations.
The adoption of any future federal, state, or local laws or implementing regulations imposing reporting obligations on, or limiting or banning, the hydraulic fracturing process could make it more difficult to complete natural gas and oil wells and could have a material adverse effect on our business, consolidated results of operations and consolidated financial condition.
Various federal and state legislative and regulatory initiatives, as well as actions in other countries, have been or could be undertaken which could result in additional requirements or restrictions being imposed on hydraulic fracturing operations. For example, legislation and/or regulations have been adopted in many U.S. states that require additional disclosure regarding chemicals used in the hydraulic fracturing process but that generally include protections for proprietary information. Legislation, regulations and/or policies have also been adopted at the state level that impose other types of requirements on hydraulic fracturing operations (such as limits on operations in the event of certain levels of seismic activity). Additional legislation and/or regulations are being considered at the state and local level that could impose further chemical disclosure or other regulatory requirements (such as prohibitions on hydraulic fracturing operations in certain areas) that could affect our operations. Three states (New York, Maryland and Vermont) have banned the use of high volume hydraulic fracturing. Local jurisdictions in some states have adopted ordinances that restrict or in certain cases prohibit the use of hydraulic fracturing, although many of these ordinances have been challenged and some have been overturned. In addition, governmental authorities in various foreign countries where we have provided or may provide hydraulic fracturing services have imposed or are considering imposing various restrictions or conditions that may affect hydraulic fracturing operations.
The adoption of any future federal, state, local, or foreign laws or regulations imposing reporting obligations on, or limiting or banning, the hydraulic fracturing process could make it more difficult to complete natural gas and oil wells and could have a material adverse effect on our business, consolidated results of operations and consolidated financial condition.
Liabilities arising out of catastrophic well incidents could have a material adverse effect on our business, consolidated results of operations and consolidated financial condition.
Catastrophic events can occur at well sites where we conduct our operations, including blowouts resulting in explosions, fires, personal injuries, property damage, pollution and regulatory responsibility. Generally, we rely on contractual indemnities, releases and limitations on liability with our customers, and liability insurance coverage, to protect us from potential liability related to such occurrences. However, we do not have these contractual provisions in all contracts, and even where we do, it is possible that the respective customer or insurer could seek to avoid or be financially unable to meet its obligations or a court may decline to enforce such provisions. Damages that are not indemnified or released could greatly exceed available insurance coverage and could have a material adverse effect on our business, consolidated results of operations and consolidated financial condition.
Liability for cleanup costs, natural resource damages and other damages arising as a result of environmental laws could be substantial and could have a material adverse effect on our business, consolidated results of operations and consolidated financial condition.
We are exposed to claims under environmental requirements and, from time to time, such claims have been made against us. In the United States, environmental requirements and regulations typically impose strict liability. Strict liability means that in some situations we could be exposed to liability for cleanup costs, natural resource damages and other damages as a result of our conduct that was lawful at the time it occurred or the conduct of prior operators or other third parties. We are periodically notified of potential liabilities at federal and state superfund sites. These potential liabilities may arise from both historical Halliburton operations and the historical operations of companies that we have acquired. Our exposure at these sites may be materially impacted by unforeseen adverse developments both in the final remediation costs and with respect to the final allocation among the various parties involved at the sites. The relevant regulatory agency may bring suit against us for amounts in excess of what we have accrued and what we believe is our proportionate share of remediation costs at any superfund site. We also could be subject to third-party claims, including punitive damages, with respect to environmental matters for which we have been named as a potentially responsible party. Liability for damages arising as a result of environmental laws or related third-party claims could be substantial and could have a material adverse effect on our business, consolidated results of operations and consolidated financial condition.
Failure on our part to comply with, and the costs of compliance with, applicable health, safety and environmental requirements could have a material adverse effect on our business, consolidated results of operations and consolidated financial condition.
Our business is subject to a variety of health, safety and environmental laws, rules and regulations in the United States and other countries, including those covering hazardous materials and requiring emission performance standards for facilities. For example, our well service operations routinely involve the handling of significant amounts of waste materials, some of which are classified as hazardous substances. We also store, transport and use radioactive and explosive materials in certain of our operations. Applicable regulatory requirements include those concerning:
| - | the containment and disposal of hazardous substances, oilfield waste and other waste materials; |
| - | the importation and use of radioactive materials; |
| - | the use of underground storage tanks; |
| - | the use of underground injection wells; and |
| - | the protection of worker safety both onshore and offshore. |
These and other requirements generally are becoming increasingly strict. The failure to comply with the requirements, many of which may be applied retroactively, may result in:
| - | administrative, civil and criminal penalties; |
| - | revocation of permits to conduct business; and |
| - | corrective action orders, including orders to investigate and/or clean up contamination. |
Failure on our part to comply with applicable environmental requirements or costs arising from regulatory compliance, including compliance with changes in or expansion of applicable regulatory requirements, could have a material adverse effect on our business, consolidated results of operations and consolidated financial condition.
Existing or future laws, regulations, treaties or international agreements related to greenhouse gases, climate change and alternative energy sources could have a negative impact on our business and may result in additional compliance obligations that could have a material adverse effect on our business, consolidated results of operations and consolidated financial condition.
Changes in environmental requirements related to greenhouse gases, climate change and alternative energy sources may negatively impact demand for our services. For example, oil and natural gas exploration and production may decline as a result of environmental requirements, including land use policies responsive to environmental concerns. State, national and international governments and agencies in areas in which we conduct business continue to evaluate, and in some instances adopt, climate-related legislation and other regulatory initiatives that would restrict emissions of greenhouse gases. Because our business depends on the level of activity in the oil and natural gas industry, existing or future laws, regulations, treaties, or international agreements related to greenhouse gases and climate change, including incentives to conserve energy or use alternative energy sources, may reduce demand for oil and natural gas and could have a negative impact on our business. Likewise, such restrictions may result in additional compliance obligations with respect to the release, capture, sequestration and use of carbon dioxide that could have a material adverse effect on our business, consolidated results of operations and consolidated financial condition.
Our business could be materially and adversely affected by severe or unseasonable weather where we have operations.
Our business could be materially and adversely affected by severe weather, particularly in Canada, the Gulf of Mexico, Russia and the North Sea. Some experts believe global climate change could increase the frequency and severity of extreme weather conditions. Repercussions of severe or unseasonable weather conditions may include:
| - | evacuation of personnel and curtailment of services; |
| - | weather-related damage to offshore drilling rigs resulting in suspension of operations; |
| - | weather-related damage to our facilities and project work sites; |
| - | inability to deliver materials to jobsites in accordance with contract schedules; |
| - | decreases in demand for oil and natural gas during unseasonably warm winters; and |
| - | loss of productivity. |
Changes in or interpretation of tax law and currency/repatriation control could impact the determination of our income tax liabilities for a tax year.
We have operations in more than 80 countries. Consequently, we are subject to the jurisdiction of a significant number of taxing authorities. The income earned in these various jurisdictions is taxed on differing bases, including net income actually earned, net income deemed earned and revenue-based tax withholding. The final determination of our income tax liabilities involves the interpretation of local tax laws, tax treaties and related authorities in each jurisdiction, as well as the significant use of estimates and assumptions regarding the scope of future operations and results achieved and the timing and nature of income earned and expenditures incurred. Changes in the operating environment, including changes in or interpretation of tax law and currency/repatriation controls, could impact the determination of our income tax liabilities for the year.
We are subject to foreign exchange risks and limitations on our ability to reinvest earnings from operations in one country to fund the capital needs of our operations in other countries or to repatriate assets from some countries.
A sizable portion of our consolidated revenue and consolidated operating expenses is in foreign currencies. As a result, we are subject to significant risks, including:
| - | foreign currency exchange risks resulting from changes in foreign currency exchange rates and the implementation of exchange controls; and |
| - | limitations on our ability to reinvest earnings from operations in one country to fund the capital needs of our operations in other countries. |
As an example, we conduct business in countries that have restricted or limited trading markets for their local currencies and restrict or limit cash repatriation. We may accumulate cash in those geographies, but we may be limited in our ability to convert our profits into United States dollars or to repatriate the profits from those countries.
Our failure to protect our proprietary information and any successful intellectual property challenges or infringement proceedings against us could materially and adversely affect our competitive position.
We rely on a variety of intellectual property rights that we use in our services and products. We may not be able to successfully preserve these intellectual property rights in the future, and these rights could be invalidated, circumvented or challenged. In addition, the laws of some foreign countries in which our services and products may be sold do not protect intellectual property rights to the same extent as the laws of the United States. Our failure to protect our proprietary information and any successful intellectual property challenges or infringement proceedings against us could materially and adversely affect our competitive position.
If we are not able to design, develop and produce commercially competitive products and to implement commercially competitive services in a timely manner in response to changes in the market, customer requirements, competitive pressures and technology trends, our business and consolidated results of operations could be materially and adversely affected, and the value of our intellectual property may be reduced.
The market for our services and products is characterized by continual technological developments to provide better and more reliable performance and services. If we are not able to design, develop and produce commercially competitive products and to implement commercially competitive services in a timely manner in response to changes in the market, customer requirements, competitive pressures and technology trends, our business and consolidated results of operations could be materially and adversely affected, and the value of our intellectual property may be reduced. Likewise, if our proprietary technologies, equipment, facilities, or work processes become obsolete, we may no longer be competitive, and our business and consolidated results of operations could be materially and adversely affected.
If we lose one or more of our significant customers or if our customers delay paying or fail to pay a significant amount of our outstanding receivables, it could have a material adverse effect on our business, consolidated results of operations and consolidated financial condition.
We depend on a limited number of significant customers. While no single customer represented more than 10% of consolidated revenue in any period presented, the loss of one or more significant customers could have a material adverse effect on our business and our consolidated results of operations.
In most cases, we bill our customers for our services in arrears and are, therefore, subject to our customers delaying or failing to pay our invoices. In weak economic or commodity price environments, we may experience increased delays and failures due to, among other reasons, a reduction in our customers’ cash flow from operations and their access to the credit markets. If our customers delay paying or fail to pay us a significant amount of our outstanding receivables, it could have a material adverse effect on our business, consolidated results of operations and consolidated financial condition.
We sometimes provide integrated project management services in the form of long-term, fixed price contracts that may require us to assume additional risks associated with cost over-runs, operating cost inflation, labor availability and productivity, supplier and contractor pricing and performance, and potential claims for liquidated damages.
We sometimes provide integrated project management services outside our normal discrete business in the form of long-term, fixed price contracts. Some of these contracts are required by our customers, primarily national oil companies (NOCs). These services include acting as project managers as well as service providers and may require us to assume additional risks associated with cost over-runs. These customers may provide us with inaccurate information in relation to their reserves, which is a subjective process that involves location and volume estimation, that may result in cost over-runs, delays and project losses. In addition, NOCs often operate in countries with unsettled political conditions, war, civil unrest, or other types of community issues. These issues may also result in cost over-runs, delays and project losses.
Providing services on an integrated basis may also require us to assume additional risks associated with operating cost inflation, labor availability and productivity, supplier pricing and performance, and potential claims for liquidated damages. We rely on third-party subcontractors and equipment providers to assist us with the completion of these types of contracts. To the extent that we cannot engage subcontractors or acquire equipment or materials in a timely manner and on reasonable terms, our ability to complete a project in accordance with stated deadlines or at a profit may be impaired. If the amount we are required to pay for these goods and services exceeds the amount we have estimated in bidding for fixed-price work, we could experience losses in the performance of these contracts. These delays and additional costs may be substantial, and we may be required to compensate our customers for these delays. This may reduce the profit to be realized or result in a loss on a project.
Constraints in the supply of, prices for and availability of transportation of raw materials can have a material adverse effect on our business and consolidated results of operations.
Raw materials essential to our business, such as proppants (primarily sand), hydrochloric acid, and gels, including guar gum, are normally readily available. Shortage of raw materials as a result of high levels of demand or loss of suppliers during market challenges can trigger constraints in the supply chain of those raw materials, particularly where we have a relationship with a single supplier for a particular resource. Many of the raw materials essential to our business require the use of rail, storage and trucking services to transport the materials to our jobsites. These services, particularly during times of high demand, may cause delays in the arrival of or otherwise constrain our supply of raw materials. These constraints could have a material adverse effect on our business and consolidated results of operations. In addition, price increases imposed by our vendors for raw materials used in our business and the inability to pass these increases through to our customers could have a material adverse effect on our business and consolidated results of operations.
Our acquisitions, dispositions and investments may not result in anticipated benefits and may present risks not originally contemplated, which may have a material adverse effect on our business, consolidated results of operations and consolidated financial condition.
We continually seek opportunities to maximize efficiency and value through various transactions, including purchases or sales of assets, businesses, investments, or joint venture interests. These transactions are intended to (but may not) result in the realization of savings, the creation of efficiencies, the offering of new products or services, the generation of cash or income, or the reduction of risk. Acquisition transactions may use cash on hand or be financed by additional borrowings or by the issuance of our common stock. These transactions may also affect our business, consolidated results of operations and consolidated financial condition.
These transactions also involve risks, and we cannot ensure that:
| - | any acquisitions we attempt will be completed on the terms announced, or at all; |
| - | any acquisitions would result in an increase in income or provide an adequate return of capital or other anticipated benefits; |
| - | any acquisitions would be successfully integrated into our operations and internal controls; |
| - | the due diligence conducted prior to an acquisition would uncover situations that could result in financial or legal exposure, including under the FCPA, or that we will appropriately quantify the exposure from known risks; |
| - | any disposition would not result in decreased earnings, revenue, or cash flow; |
| - | use of cash for acquisitions would not adversely affect our cash available for capital expenditures and other uses; or |
| - | any dispositions, investments, or acquisitions, including integration efforts, would not divert management resources. |
Actions of and disputes with our joint venture partners could have a material adverse effect on the business and results of operations of our joint ventures and, in turn, our business and consolidated results of operations.
We conduct some operations through joint ventures in which unaffiliated third parties may control the operations of the joint venture or we may share control. As with any joint venture arrangement, differences in views among the joint venture participants may result in delayed decisions, the joint venture operating in a manner that is contrary to our preference or in failures to agree on major issues. We also cannot control the actions of our joint venture partners, including any nonperformance, default, or bankruptcy of our joint venture partners. These factors could have a material adverse effect on the business and results of operations of our joint ventures and, in turn, our business and consolidated results of operations.
Our ability to operate and our growth potential could be materially and adversely affected if we cannot attract, employ and retain technical personnel at a competitive cost.
Many of the services that we provide and the products that we sell are complex and highly engineered and often must perform or be performed in harsh conditions. We believe that our success depends upon our ability to attract, employ and retain technical personnel with the ability to design, utilize and enhance these services and products. A significant increase in the wages paid by competing employers could result in a reduction of our skilled labor force, increases in the wage rates that we must pay, or both. If either of these events were to occur, our cost structure could increase, our margins could decrease and any growth potential could be impaired.
The loss or unavailability of any of our executive officers or other key employees could have a material adverse effect on our business.
We depend greatly on the efforts of our executive officers and other key employees to manage our operations. The loss or unavailability of any of our executive officers or other key employees could have a material adverse effect on our business.
Item 1(b). Unresolved Staff Comments**.**
None.
Item 2. Properties.
We own or lease numerous properties in domestic and foreign locations. Our principal properties include manufacturing facilities, research and development laboratories, technology centers and corporate offices. We also have numerous small facilities that include sales, project and support offices and bulk storage facilities throughout the world. All of our owned properties are unencumbered. We believe all properties that we currently occupy are suitable for their intended use.
The following locations represent our major facilities by segment:
| – | Completion and Production: Arbroath, United Kingdom; Johor Bahru, Malaysia; and Lafayette, Louisiana |
| – | Drilling and Evaluation: Alvarado, Texas; Nisku, Canada; and The Woodlands, Texas |
| – | Shared/corporate facilities: Bangalore, India; Carrollton, Texas; Denver, Colorado; Dhahran, Saudi Arabia; Dubai, United Arab Emirates (corporate executive offices); Duncan, Oklahoma; Houston, Texas (corporate executive offices); Kuala Lumpur, Malaysia; London, England; Moscow, Russia; Panama City, Panama; Pune, India; Rio de Janeiro, Brazil; Singapore; and Tananger, Norway |
Item 3. Legal Proceedings.
Information related to Item 3. Legal Proceedings is included in Note 8 to the consolidated financial statements.
Item 4. Mine Safety Disclosures.
Our barite and bentonite mining operations, in support of our fluid services business, are subject to regulation by the federal Mine Safety and Health Administration under the Federal Mine Safety and Health Act of 1977. Information concerning mine safety violations or other regulatory matters required by section 1503(a) of the Dodd-Frank Wall Street Reform and Consumer Protection Act and Item 104 of Regulation S-K (17 CFR 229.104) is included in Exhibit 95 to this annual report.
PART II
Item 5. Market for Registrant’s Common Equity, Related Stockholder Matters and Issuer Purchases of Equity Securities.
Halliburton Company’s common stock is traded on the New York Stock Exchange under the symbol "HAL." Information related to quarterly dividend payments is included under the caption “Quarterly Financial Data” in the consolidated financial statements. The declaration and payment of future dividends will be at the discretion of the Board of Directors and will depend on, among other things, future earnings, general financial condition and liquidity, success in business activities, capital requirements and general business conditions. Subject to Board of Directors approval, our intention is to continue paying dividends at our current rate during 2019.
The following graph and table compare total shareholder return on our common stock for the five-year period ended December 31, 2018, with the Philadelphia Oil Service Index (OSX) and the Standard & Poor’s 500 ® Index over the same period. This comparison assumes the investment of $100 on December 31, 2013 and the reinvestment of all dividends. The shareholder return set forth is not necessarily indicative of future performance. The following graph and related information shall not be deemed “soliciting material” or to be “filed” with the SEC, nor shall such information be incorporated by reference into any future filing under the Securities Act of 1933 or the Securities Exchange Act of 1934, except to the extent that Halliburton specifically incorporates it by reference into such filing.
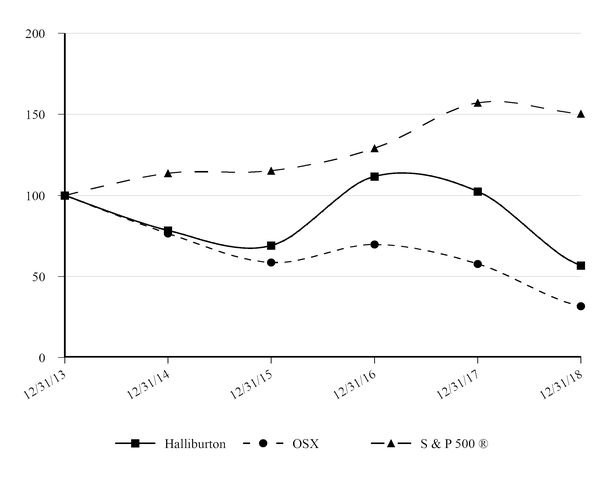
| December 31 | ||||||||||||||||||
| 2013 | 2014 | 2015 | 2016 | 2017 | 2018 | |||||||||||||
| Halliburton | $ | 100.00 | $ | 78.40 | $ | 69.09 | $ | 111.64 | $ | 102.44 | $ | 56.78 | ||||||
| Philadelphia Oil Service Index (OSX) | 100.00 | 76.49 | 58.60 | 69.72 | 57.73 | 31.63 | ||||||||||||
| Standard & Poor’s 500 ® Index | 100.00 | 113.69 | 115.26 | 129.05 | 157.22 | 150.33 |
At February 8, 2019, we had 11,774 shareholders of record. In calculating the number of shareholders, we consider clearing agencies and security position listings as one shareholder for each agency or listing.
The following table is a summary of repurchases of our common stock during the three-month period ended December 31, 2018.
| Period | Total Number of Shares Purchased (a) | Average Price Paid per Share | Total Number of Shares Purchased as Part of Publicly Announced Plans or Programs (b) | Maximum Number (or Approximate Dollar Value) of Shares that may yet be Purchased Under the Program (b) |
| October 1 - 31 | 2,885,114 | $34.88 | 2,868,100 | $5,400,004,968 |
| November 1 - 30 | 2,907,936 | $34.52 | 2,896,800 | $5,300,007,172 |
| December 1 - 31 | 193,064 | $30.45 | — | $5,300,007,172 |
| Total | 5,986,114 | $34.56 | 5,764,900 |
| (a) | Of the 5,986,114 shares purchased during the three-month period ended December 31, 2018, 221,214 shares were acquired from employees in connection with the settlement of income tax and related benefit withholding obligations arising from vesting in restricted stock grants. These shares were not part of a publicly announced program to purchase common stock. |
| (b) | Our Board of Directors has authorized a plan to repurchase a specified dollar amount of our common stock from time to time. During the fourth quarter of 2018, we repurchased approximately 5.8 million shares of our common stock pursuant to our share repurchase program for a total cost of approximately $200 million at an average price of $34.69 per share. Approximately $5.3 billion remained authorized for repurchases as of December 31, 2018. From the inception of this program in February 2006 through December 31, 2018, we repurchased approximately 212 million shares of our common stock for a total cost of approximately $8.8 billion. |
Item 6. Selected Financial Data.
Information related to selected financial data is included on page 61 of this annual report.
Item 7. Management’s Discussion and Analysis of Financial Condition and Results of Operations**.**
Information related to Management’s Discussion and Analysis of Financial Condition and Results of Operations is included on pages 19 through 32 of this annual report.
Item 7. (a). Quantitative and Qualitative Disclosures About Market Risk.
Information related to market risk is included in “Management’s Discussion and Analysis of Financial Condition and Results of Operations – Financial Instrument Market Risk” and Note 13 to the consolidated financial statements.
Item 8. Financial Statements and Supplementary Data.
| Page No. | |
| Management’s Report on Internal Control Over Financial Reporting | 33 |
| Reports of Independent Registered Public Accounting Firm | 34 |
| Consolidated Statements of Operations for the years ended December 31, 2018, 2017 and 2016 | 36 |
| Consolidated Statements of Comprehensive Income for the years ended December 31, 2018, 2017 and 2016 | 37 |
| Consolidated Balance Sheets at December 31, 2018 and 2017 | 38 |
| Consolidated Statements of Cash Flows for the years ended December 31, 2018, 2017 and 2016 | 39 |
| Consolidated Statements of Shareholders’ Equity for the years ended December 31, 2018, 2017 and 2016 | 40 |
| Notes to Consolidated Financial Statements | 41 |
| Selected Financial Data (Unaudited) | 61 |
| Quarterly Financial Data (Unaudited) | 62 |
Item 9. Changes in and Disagreements with Accountants on Accounting and Financial Disclosure**.**
None.
Item 9(a). Controls and Procedures**.**
In accordance with the Securities Exchange Act of 1934 Rules 13a-15 and 15d-15, we carried out an evaluation, under the supervision and with the participation of management, including our Chief Executive Officer and Chief Financial Officer, of the effectiveness of our disclosure controls and procedures as of the end of the period covered by this report. Based on that evaluation, our Chief Executive Officer and Chief Financial Officer concluded that our disclosure controls and procedures were effective as of December 31, 2018 to provide reasonable assurance that information required to be disclosed in our reports filed or submitted under the Exchange Act is recorded, processed, summarized and reported within the time periods specified in the Securities and Exchange Commission’s rules and forms. Our disclosure controls and procedures include controls and procedures designed to ensure that information required to be disclosed in reports filed or submitted under the Exchange Act is accumulated and communicated to our management, including our Chief Executive Officer and Chief Financial Officer, as appropriate, to allow timely decisions regarding required disclosure.
There has been no change in our internal control over financial reporting that occurred during the three months ended December 31, 2018 that has materially affected, or is reasonably likely to materially affect, our internal control over financial reporting.
See page 33 for Management’s Report on Internal Control Over Financial Reporting and page 35 for Report of Independent Registered Public Accounting Firm on its assessment of our internal control over financial reporting.
Item 9. (b). Other Information.
None.
HALLIBURTON COMPANY
Management’s Discussion and Analysis of Financial Condition and Results of Operations
EXECUTIVE OVERVIEW
Financial results
Our business strengthened in 2018 as we continued to build for a longer-term industry recovery. We experienced some challenges in North America during the latter half of the year as a result of offtake capacity limitations and customer budget constraints, but we believe these are temporary in nature. We successfully maintained our global market share in 2018, which was accomplished by our investments in strategic growth areas and by competing in key markets as we continue to collaborate and engineer solutions to maximize asset value for our customers and align our business with customers in the fastest growing market segments.
We generated total company revenue of $24.0 billion during 2018, a 16% increase from the $20.6 billion of revenue generated in 2017, with our Completion and Production segment improving 22% and our Drilling and Evaluation segment improving 6%. We also reported total company operating income of approximately $2.5 billion in 2018, an 80% increase from operating income of $1.4 billion in 2017. These improvements were primarily associated with pressure pumping services, drilling activity and artificial lift in North America, as well as drilling activity in the Eastern Hemisphere.
Our North America revenue in 2018 increased 25% compared to 2017, outperforming the average North American rig count growth of 13%. However, the United States land rig count was relatively flat over the second half of 2018, with an average quarterly increase of less than 2%. A combination of offtake capacity limitations and customer budget constraints led to less demand for completion services during the fourth quarter of 2018. The lower demand created excess equipment capacity in the market and had a detrimental effect on pricing. As a result, our North America revenue decreased by 11% from the third quarter of 2018 to the fourth quarter of 2018, primarily driven by lower activity and pricing in stimulation services.
Our international business continues to show signs of a steady recovery and delivered annual revenue growth for the first time since 2014, with a 6% improvement from 2017 to 2018. This underscores the versatility and global reach of our business portfolio. Improvements in revenue were driven primarily by increased drilling and well intervention activity in the Middle East. While the international markets are continuing to improve, they are in the early stages of a recovery and pricing pressure remains a challenge. We have grown our international market share throughout the downturn because of our service quality and technology offerings and our willingness to collaborate with our customers. Our product service lines continue to focus on technology-driven value propositions to help our customers increase production and lower costs.
Business outlook
Commodity prices fell towards the end of 2018, with both West Texas Intermediate (WTI) and Brent crude oil spot prices dropping over 40% to levels not experienced since June of 2017. This price volatility created headwinds as we entered 2019. However, oil prices have climbed since the beginning of 2019, and we believe supply and demand fundamentals for multi-year industry growth are still intact. Our industry is going through a transformation brought on by the shale revolution and the recent down-cycle. The industry has removed substantial costs from the system and introduced significant efficiencies and many of our customers in North America appear to have shifted their strategy from production growth to operating within cash flow and generating returns. We believe this is a positive sign for the long-term prospects of our industry.
In North America, the drop in oil prices at the end of 2018 appears to have created some uncertainty about our customers' expectations about future prices, which in turn led to customer budgets for 2019 that are more limited than previously anticipated. Although we expect these reloaded budgets will drive modest improvement in completion activity levels in 2019, we anticipate that pressure on services pricing will continue in the first quarter. We believe, however, that there are several catalysts for a potential completions activity rebound in North America. These catalysts include what we expect will be a supportive commodity price environment, offtake capacity constraints alleviating in the Permian basin, and a high inventory of drilled but uncompleted (DUC) wells. If these catalysts materialize, we believe they will increase customer urgency and, in turn, drive higher pricing in the second half of 2019. We will continue to adjust our cost structure to market conditions. We are actively maintaining and improving the condition of our fleet to position our North America land business for success as the market improves.
Internationally, the market recovery continues at a modest pace. Over the course of 2019, we believe activity will improve across all international regions, although off of a low base in some geographies, such as Asia Pacific and Africa. This international recovery is led by mature fields as customers broadly favor shorter cycle returns and lower risk projects in today’s environment. We believe in the strength of our mature fields technology portfolio, and we intend to continue building our mature fields capabilities in 2019 and beyond. We believe we are well-positioned for continued growth as a result of the significant investments we made to grow our global footprint in the last cycle, which included increasing our product service line operations in various geographies, expanding our manufacturing capacity in Singapore and opening technology centers in Saudi Arabia, India and Brazil. We intend to continue collaborating with our customers to improve their project economics and our profitability through advanced technology and increased operating efficiency.
During 2018, we had approximately $2.0 billion of capital expenditures, an increase of 48% from 2017, which were predominantly made in our Production Enhancement, Sperry Drilling, Artificial Lift, Wireline and Perforating, and Cementing product service lines. We intend to reduce our capital expenditures by 20% in 2019 to approximately $1.6 billion. We intend to focus our 2019 capital expenditures on key technologies and capabilities that deliver differentiation and drive returns, such as our new directional drilling platform and the expansion of our production business.
In 2019, we will continue to build the foundation for a longer-term recovery. We intend to dynamically respond to the changing market, invest effectively and remain flexible in our cost structure. We will maintain an appropriate level of capital spending to support our business. We believe in responsible capital stewardship, prioritizing capital efficiency, investing in the technologies that deliver differentiation and returns, and generating strong cash flow. We remain committed to generating strong cash flow by using cost levers, managing working capital, and remaining flexible on our capital spending with a focus on strong return-generating opportunities. In 2018, we continued our focus on returning capital to shareholders through share repurchases and dividends, which totaled over $1 billion. Going forward, we plan to use excess cash on strategic investments that meet our returns thresholds, for reducing debt, and for returning cash to our shareholders.
We intend to continue to strengthen our product service lines through a combination of organic growth, investment and selective acquisitions. We plan to continue executing the following strategies in 2019:
| - | directing capital and resources into strategic growth markets, including unconventional plays and mature fields; |
| - | leveraging our broad |
Showing the first 8K of 166K characters. Open the full section
Item 10. Directors, Executive Officers and Corporate Governance.
The information required for the directors of the Registrant is incorporated by reference to the Halliburton Company Proxy Statement for our 2019 Annual Meeting of Stockholders (File No. 001-03492) under the captions “Election of Directors” and “Involvement in Certain Legal Proceedings.” The information required for the executive officers of the Registrant is included under Part I on pages 5 through 6 of this annual report. The information required for a delinquent form required under Section 16(a) of the Securities Exchange Act of 1934 is incorporated by reference to the Halliburton Company Proxy Statement for our 2019 Annual Meeting of Stockholders (File No. 001-03492) under the caption “Section 16(a) Beneficial Ownership Reporting Compliance,” to the extent any disclosure is required. The information for our code of ethics is incorporated by reference to the Halliburton Company Proxy Statement for our 2019 Annual Meeting of Stockholders (File No. 001-03492) under the caption “Corporate Governance.” The information regarding our Audit Committee and the independence of its members, along with information about the audit committee financial expert(s) serving on the Audit Committee, is incorporated by reference to the Halliburton Company Proxy Statement for our 2019 Annual Meeting of Stockholders (File No. 001-03492) under the caption “The Board of Directors and Standing Committees of Directors.”
Item 11. Executive Compensation.
This information is incorporated by reference to the Halliburton Company Proxy Statement for our 2019 Annual Meeting of Stockholders (File No. 001-03492) under the captions “Compensation Discussion and Analysis,” “Compensation Committee Report,” “Summary Compensation Table,” “Grants of Plan-Based Awards in Fiscal 2018,” “Outstanding Equity Awards at Fiscal Year End 2018,” “2018 Option Exercises and Stock Vested,” “2018 Nonqualified Deferred Compensation,” “Employment Contracts and Change-in-Control Arrangements,” “Post-Termination or Change-in-Control Payments,” “Equity Compensation Plan Information” and “Directors’ Compensation.”
Item 12. (a). Security Ownership of Certain Beneficial Owners.
This information is incorporated by reference to the Halliburton Company Proxy Statement for our 2019 Annual Meeting of Stockholders (File No. 001-03492) under the caption “Stock Ownership of Certain Beneficial Owners and Management.”
Item 12(b). Security Ownership of Management**.**
This information is incorporated by reference to the Halliburton Company Proxy Statement for our 2019 Annual Meeting of Stockholders (File No. 001-03492) under the caption “Stock Ownership of Certain Beneficial Owners and Management.”
Item 12(c). Changes in Control**.**
Not applicable.
Item 12(d). Securities Authorized for Issuance Under Equity Compensation Plans**.**
This information is incorporated by reference to the Halliburton Company Proxy Statement for our 2019 Annual Meeting of Stockholders (File No. 001-03492) under the caption “Equity Compensation Plan Information.”
Item 13. Certain Relationships and Related Transactions, and Director Independence.
This information is incorporated by reference to the Halliburton Company Proxy Statement for our 2019 Annual Meeting of Stockholders (File No. 001-03492) under the caption “Corporate Governance” to the extent any disclosure is required and under the caption “The Board of Directors and Standing Committees of Directors.”
Item 14. Principal Accounting Fees and Services.
This information is incorporated by reference to the Halliburton Company Proxy Statement for our 2019 Annual Meeting of Stockholders (File No. 001-03492) under the caption “Fees Paid to KPMG LLP.”
PART IV
Item 15. Exhibits.
| 1. | Financial Statements: | |
| The reports of the Independent Registered Public Accounting Firm and the financial statements of Halliburton Company as required by Part II, Item 8, are included on pages 34 through 35 and pages 36 through 60 of this annual report. See index on page (i). | ||
| 2. | Financial Statement Schedules: | |
| The schedules listed in Rule 5-04 of Regulation S-X (17 CFR 210.5-04) have been omitted because they are not applicable or the required information is shown in the consolidated financial statements or notes thereto. | ||
| 3. | Exhibits: |
| * | 24.1 | Powers of attorney for the following directors signed in January 2019: |
| Abdulaziz F. Al Khayyal | ||
| William E. Albrecht | ||
| Alan M. Bennett | ||
| James R. Boyd | ||
| Milton Carroll | ||
| Nance K. Dicciani | ||
| Murry S. Gerber | ||
| Robert A. Malone | ||
| * | 31.1 | Certification of Chief Executive Officer pursuant to Section 302 of the Sarbanes-Oxley Act of 2002. |
| * | 31.2 | Certification of Chief Financial Officer pursuant to Section 302 of the Sarbanes-Oxley Act of 2002. |
| ** | 32.1 | Certification of Chief Executive Officer pursuant to Section 906 of the Sarbanes-Oxley Act of 2002. |
| ** | 32.2 | Certification of Chief Financial Officer pursuant to Section 906 of the Sarbanes-Oxley Act of 2002. |
| * | 95 | Mine Safety Disclosures. |
| * | 101.INS | XBRL Instance Document - the instance document does not appear in the Interactive Data File because its XBRL tags are embedded within the Inline XBRL document |
| * | 101.SCH | XBRL Taxonomy Extension Schema Document |
| * | 101.CAL | XBRL Taxonomy Extension Calculation Linkbase Document |
| * | 101.LAB | XBRL Taxonomy Extension Label Linkbase Document |
| * | 101.PRE | XBRL Taxonomy Extension Presentation Linkbase Document |
| * | 101.DEF | XBRL Taxonomy Extension Definition Linkbase Document |
| * Filed with this Form 10-K. | ||
| ** Furnished with this Form 10-K. | ||
| † Management contracts or compensatory plans or arrangements. |
Item 16. Form 10-K Summary.
None.
SIGNATURES
As required by Section 13 or 15(d) of the Securities Exchange Act of 1934, the registrant has authorized this report to be signed on its behalf by the undersigned authorized individuals on this 13th day of February, 2019.
| HALLIBURTON COMPANY | |
| By | /s/ Jeffrey A. Miller |
| Jeffrey A. Miller | |
| Chairman of the Board, President and Chief Executive Officer |
As required by the Securities Exchange Act of 1934, this report has been signed below by the following persons in the capacities indicated on this 13th day of February, 2019.
| Signature | Title |
| /s/ Jeffrey A. Miller | Chairman of the Board, Director, President and |
| Jeffrey A. Miller | Chief Executive Officer |
| /s/ Lance Loeffler | Executive Vice President and |
| Lance Loeffler | Chief Financial Officer |
| /s/ Charles E. Geer, Jr. | Vice President and |
| Charles E. Geer, Jr. | Corporate Controller |
| Signature | Title |
| * Abdulaziz F. Al Khayyal | Director |
| Abdulaziz F. Al Khayyal | |
| * William E. Albrecht | Director |
| William E. Albrecht | |
| * Alan M. Bennett | Director |
| Alan M. Bennett | |
| * James R. Boyd | Director |
| James R. Boyd | |
| * Milton Carroll | Director |
| Milton Carroll | |
| * Nance K. Dicciani | Director |
| Nance K. Dicciani | |
| * Murry S. Gerber | Director |
| Murry S. Gerber | |
| * Robert A. Malone | Director |
| Robert A. Malone | |
| /s/ Robb L. Voyles | |
| *By Robb L. Voyles, Attorney-in-fact |