 filings.tools
Item 7. Management’s Discussion and Analysis of Financial Condition and Results of Operations.
56K characters. Original on sec.gov · Markdown
Item 7. Management’s Discussion and Analysis of Financial Condition and Results of Operations.
Management's Discussion and Analysis of Financial Condition and Results of Operations (MD&A) should be read in conjunction with the consolidated and combined financial statements included in "Item 8. Financial Statements and Supplementary Data" contained herein.
EXECUTIVE OVERVIEW
Financial results
We experienced challenging market dynamics in 2019 as our customers in the North America market fundamentally shifted from growth to capital discipline, impacting our business through reduced customer activity and pricing pressure, while the international markets continued their recovery. We executed our value proposition, delivered exceptional safety and service quality, and remained focused on generating strong returns and cash flow. The following graph illustrates our revenue and operating margins for each operating segment over the past three years.
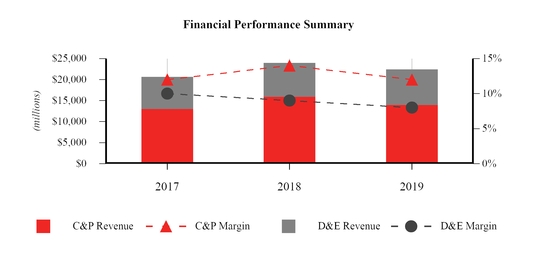
During 2019, we generated total company revenue of $22.4 billion, a 7% decrease from the $24.0 billion of revenue generated in 2018, with our Completion and Production (C&P) segment declining by 12% and our Drilling and Evaluation (D&E) segment improving by 4%. We reported a total company operating loss of approximately $448 million in 2019 driven by $2.5 billion of impairments and other charges. This compares to operating income of $2.5 billion in 2018. A significant decline in stimulation activity and pricing in North America land during 2019 negatively impacted operating results, coupled with reduced drilling activity in the Middle East.
Our North America revenue declined 18% in 2019, as compared to 2018, driven by reduced customer activity and pricing, and our decision to focus on customers that provide better returns. The North America land rig count decreased 26% from its high point in early 2019 to its low point in December 2019, with a 9% drop from the third to the fourth quarter. Customer activity declined across all basins in North America land during the fourth quarter of 2019, affecting both our drilling and completions businesses. This reduction in activity resulted in part from our North American customers’ increase in capital discipline. With this backdrop, we moved quickly to implement a service delivery improvement strategy and initiate cost reductions, which included proactively managing our fleet count to anticipated levels of near-term demand, executing personnel reductions, and rationalizing our real estate portfolio. We performed this exercise with a focus on adjusting our cost structure to improve financial performance. We did, however, experience growth in many of our non-hydraulic fracturing businesses and will continue to focus on these businesses going forward.
With strong growth opportunities internationally, we continued to benefit from the recovery in this market as revenue increased 10% in 2019, as compared to 2018, outgrowing the international rig count for the second year in a row. All international regions significantly contributed to this revenue increase, led by Asia Pacific, Latin America and Europe, with meaningful contributions from both of our divisions. Our Completion and Production division led with a 13% increase in revenue due to higher activity in mature fields in Europe and unconventionals in Argentina, the United Arab Emirates, and Australia, while our Drilling and Evaluation division grew international revenues by 8% with increased activity levels in all markets, particularly Norway, Mexico, China and Nigeria.
HAL 2019 FORM 10-K | 19
| Table of Contents | Item 7 | Executive Overview |
Business outlook
2019 closed the decade of the shale revolution that transformed the United States into the world's top hydrocarbon producer. Our company was an early participant in this development and invested and innovated alongside our customers since the beginning. As unconventionals enter the maturation phase and as capital spending by our customers has decreased, we remain committed to the North American market and taking appropriate actions to thrive in the new environment. The cost containment measures we took in the fourth quarter of 2019 should benefit our business as we adapt to this dynamic market environment.
In North America, the shale industry is facing its biggest challenge since the 2015 downturn with a strong focus on capital discipline. In the fourth quarter of 2019, the market experienced a long-awaited attrition of equipment. More equipment is expected to exit the market in 2020 driven by lower demand and increasing service intensity. After systematically rationalizing and reducing equipment supply in 2019 to adjust to changing activity levels, in 2020 we plan to provide the capacity that maximizes the returns on our overall fleet. We also expect customer spending behavior to remain similar to 2019 in which some operators spend a higher portion of their budgets earlier in the year. With North America customer spending expected to decline again in 2020, we will continue our strategy to maximize returns with an appropriate level of service capacity while continuing to invest in technologies that improve margins. We plan to continue strategic growth opportunities with our non-hydraulic fracturing businesses. Our Wireline and Perforating, Artificial Lift, and Specialty Chemical product lines all produced strong double-digit revenue growth in 2019, despite the overall market softness in U.S. land, and we intend to build on this momentum and spread it to other services.
Internationally, we expect a third consecutive year of customer spending growth. We believe we have the right footprint and an enhanced technology portfolio to compete successfully across the international markets. Our pipeline of projects is strong and we expect continued growth in our Drilling and Evaluation division as our iCruise rotary steerable drilling platform roll-out continues, new offshore drilling activity begins around the world, and we operate a full year of our Norway integrated contracts. Pricing in certain international regions is improving, and we expect this momentum to continue in 2020. We are gaining pricing traction on new work and contract renewals, and we are making strategic choices about the work we pursue to deliver returns-driven growth in the international markets. We intend to be prudent with capital allocation with a strategic reallocation of assets to opportunities with better returns, driving the right pricing discussions with customers. We believe that with increased activity, disciplined capital allocation, pricing improvements, and our ability to compete for a larger share of high-margin services, we will achieve international margin expansion.
In 2020, we will continue to focus on delivering margin expansion and strong returns and cash flow while continuing to build the foundation for a longer-term recovery. We intend to dynamically respond to the changing market, invest effectively and remain flexible in our cost structure. We believe in responsible capital stewardship, prioritizing capital efficiency, and investing in the technologies that deliver differentiation and returns. We will continue to collaborate and engineer solutions to maximize asset value for our customers and align our business with customers in the fastest growing market segments with attention to the sustainability of our business, minimizing environmental impacts and acting as a responsible corporate citizen.
We intend to continue to strengthen our product service lines through a combination of organic growth, investment and selective acquisitions. We plan to continue executing the following strategies in 2020:
| - | prudently allocating capital into strategic markets around the world; |
| - | collaborating with, and engineering solutions to maximize asset value for, our customers; |
| - | leveraging our broad technology offerings to provide value to our customers and enable them to more efficiently drill and complete their wells; |
| - | investing in technology that will help our customers reduce reservoir uncertainty, increase operational efficiency and improve well productivity - as well as help us reduce our costs and deliver acceptable returns; |
| - | improving working capital and managing our balance sheet to maximize our financial flexibility; |
| - | seeking additional ways to be one of the most cost-efficient service providers in the industry by optimizing costs, maintaining capital discipline and leveraging our scale and breadth of operations; and |
| - | striving to achieve superior returns and cash flow generation for our shareholders. |
Our operating performance and business outlook are described in more detail in “Business Environment and Results of Operations.”
HAL 2019 FORM 10-K | 20
| Table of Contents | Item 7 | Executive Overview |
Capital expenditures
During 2019, our capital expenditures were approximately $1.5 billion, a decrease of 24% from 2018, which were predominantly made in our Sperry Drilling, Production Enhancement, Artificial Lift, Wireline and Perforating, and Production Solutions product service lines. We intend to reduce our capital expenditures by 20% in 2020 to approximately $1.2 billion. We believe this level of spend, approximately 60% of which we plan to allocate to our Completion and Production division, will allow continued investments in our anticipated international growth while continuing to adjust our business to the current conditions in North America. Within this reduced budget, we will continue investing in and growing certain of our businesses, expanding our Artificial Lift footprint, continuing our global roll-out of our iCruise rotary steerable drilling platform, and focusing on digital efforts and new technologies aimed at improving our efficiency and reducing our operating costs. However, the allocation of capital expenditures across business lines may change depending on market conditions. We believe our capital allocation decisions are consistent with our focus on generating strong cash flow for our investors, regardless of the market environment.
Financial markets, liquidity and capital resources
We believe we have invested our cash balances conservatively and secured sufficient financing to help mitigate any near-term negative impact on our operations from adverse market conditions. As of December 31, 2019, we had $2.3 billion of cash and equivalents and $3.5 billion of available committed bank credit under our revolving credit facility which expires in 2024. We believe this provides us with sufficient liquidity to address the challenges and opportunities of the current market. For additional information on market conditions, see “Liquidity and Capital Resources” and “Business Environment and Results of Operations.”
HAL 2019 FORM 10-K | 21
| Table of Contents | Item 7 | Liquidity and Capital Resources |
LIQUIDITY AND CAPITAL RESOURCES
As of December 31, 2019, we had $2.3 billion of cash and equivalents, compared to $2.0 billion of cash and equivalents at December 31, 2018.
Significant sources and uses of cash in 2019
Sources of cash:
| – | Cash flows from operating activities were $2.4 billion. Included within cash flows from operating activities was a negative impact from the primary components of our working capital (receivables, inventories and accounts payable) of a net $161 million, primarily associated with reduced payables and a build-up of inventory related to our strategic technology deployments, coupled with approximately $144 million of severance payments. |
Uses of cash:
| – | Capital expenditures were $1.5 billion and were predominantly made in our Sperry Drilling, Production Enhancement, Artificial Lift, Wireline and Perforating and Production Solutions product service lines. |
| – | We paid $630 million of dividends to our shareholders. |
| – | We repurchased approximately 4.5 million shares of our common stock under our share repurchase program at a total cost of approximately $100 million. |
Future sources and uses of cash
We manufacture most of our own equipment, which provides some flexibility to increase or decrease our capital expenditures based on market conditions. Capital spending for 2020 is currently expected to be approximately $1.2 billion, a reduction of approximately 20% from 2019. For additional information on capital expenditures, see “Executive Overview.”
We are actively evaluating our debt maturity profile and other opportunities around uses of cash, which could include paying off portions of near-term debt, funding acquisitions and organic growth projects or shareholder return opportunities.
Currently, our quarterly dividend rate is $0.18 per common share, or approximately $158 million. Subject to Board of Directors approval, our intention is to continue paying dividends at our current rate during 2020. Our Board of Directors has authorized a program to repurchase our common stock from time to time. Approximately $5.2 billion remained authorized for repurchases as of December 31, 2019 and may be used for open market and other share purchases.
Contractual obligations
The following table summarizes our significant contractual obligations and other long-term liabilities as of December 31, 2019:
| Payments Due | |||||||||||||||||||||
| Millions of dollars | 2020 | 2021 | 2022 | 2023 | 2024 | Thereafter | Total | ||||||||||||||
| Long-term debt (a) | $ | 11 | $ | 697 | $ | 4 | $ | 1,100 | $ | — | $ | 8,604 | $ | 10,416 | |||||||
| Interest on debt (b) | 520 | 511 | 486 | 486 | 448 | 7,431 | 9,882 | ||||||||||||||
| Operating leases | 235 | 186 | 149 | 107 | 71 | 442 | 1,190 | ||||||||||||||
| Finance leases | 61 | 62 | 62 | 61 | 48 | 82 | 376 | ||||||||||||||
| Purchase obligations (c) | 618 | 139 | 51 | 19 | — | 1 | 828 | ||||||||||||||
| Other long-term liabilities (d) | 24 | — | — | — | — | — | 24 | ||||||||||||||
| Total | $ | 1,469 | $ | 1,595 | $ | 752 | $ | 1,773 | $ | 567 | $ | 16,560 | $ | 22,716 |
| (a) | Represents principal amounts of long-term debt, including current maturities of debt, which excludes any unamortized debt issuance costs and discounts. |
| (b) | Interest on debt includes 77 years of interest on $300 million of debentures at 7.6% interest that become due in 2096. |
| (c) | Amount in 2020 primarily represents certain purchase orders for goods and services utilized in the ordinary course of our business. |
| (d) | Represents pension funding obligations associated with international plans for 2020 only and are based on assumptions that are subject to change as we are currently not able to reasonably estimate our contributions for years after 2020. |
Due to the uncertainty with respect to the timing of potential future cash outflows associated with our uncertain tax positions, we are not able to reasonably estimate the period of cash settlement with the respective taxing authorities. Therefore, gross unrecognized tax benefits have been excluded from the contractual obligations table above. We had $425 million of gross
HAL 2019 FORM 10-K | 22
| Table of Contents | Item 7 | Liquidity and Capital Resources |
unrecognized tax benefits, excluding penalties and interest, at December 31, 2019, of which we estimate $235 million may require a cash payment by us. We estimate that $205 million of the cash payment will not be settled within the next 12 months.
Other factors affecting liquidity
Financial position in current market. As of December 31, 2019, we had $2.3 billion of cash and equivalents and $3.5 billion of available committed bank credit under our revolving credit facility which expires in 2024. Furthermore, we have no financial covenants or material adverse change provisions in our bank agreements, and our debt maturities extend over a long period of time. We believe our cash on hand, cash flows generated from operations and our available credit facility will provide sufficient liquidity to address the challenges and opportunities of the current market and our global cash needs in 2020, including capital expenditures, working capital investments, dividends, if any, and contingent liabilities.
Guarantee agreements. In the normal course of business, we have agreements with financial institutions under which approximately $2.1 billion of letters of credit, bank guarantees, or surety bonds were outstanding as of December 31, 2019. Some of the outstanding letters of credit have triggering events that would entitle a bank to require cash collateralization.
Credit ratings. Our credit ratings with Standard & Poor’s (S&P) remain A- for our long-term debt and A-2 for our short-term debt, with a negative outlook. Our credit ratings with Moody’s Investors Service (Moody's) remain Baa1 for our long-term debt and P-2 for our short-term debt, with a stable outlook.
Customer receivables. In line with industry practice, we bill our customers for our services in arrears and are, therefore, subject to our customers delaying or failing to pay our invoices. In weak economic environments, we may experience increased delays and failures to pay our invoices due to, among other reasons, a reduction in our customers’ cash flow from operations and their access to the credit markets, as well as unsettled political conditions. If our customers delay paying or fail to pay us a significant amount of our outstanding receivables, it could have a material adverse effect on our liquidity, consolidated results of operations and consolidated financial condition. See Note 5 to the consolidated financial statements for further discussion.
HAL 2019 FORM 10-K | 23
| Table of Contents | Item 7 | Business Environment and Results of Operations |
BUSINESS ENVIRONMENT AND RESULTS OF OPERATIONS
We operate in more than 80 countries throughout the world to provide a comprehensive range of services and products to the energy industry. Our revenue is generated from the sale of services and products to major, national, and independent oil and natural gas companies worldwide. The industry we serve is highly competitive with many substantial competitors in each segment of our business. In 2019, 2018 and 2017, based on the location of services provided and products sold, 51%, 58% and 53%, respectively, of our consolidated revenue was from the United States. No other country accounted for more than 10% of our revenue.
Operations in some countries may be adversely affected by unsettled political conditions, acts of terrorism, civil unrest, force majeure, war or other armed conflict, health or similar issues, sanctions, expropriation or other governmental actions, inflation, changes in foreign currency exchange rates, foreign currency exchange restrictions and highly inflationary currencies, as well as other geopolitical factors. We believe the geographic diversification of our business activities reduces the risk that an interruption of operations in any one country, other than the United States, would be materially adverse to our consolidated results of operations.
Activity within our business segments is significantly impacted by spending on upstream exploration, development and production programs by our customers. Also impacting our activity is the status of the global economy, which impacts oil and natural gas consumption.
Some of the more significant determinants of current and future spending levels of our customers are oil and natural gas prices and our customers' expectations about future prices, global oil supply and demand, completions intensity, the world economy, the availability of credit, government regulation and global stability, which together drive worldwide drilling and completions activity. Additionally, many of our customers in North America have shifted their strategy from production growth to operating within cash flow and generating returns. Lower oil and natural gas prices usually translate into lower exploration and production budgets and lower rig count, while the opposite is usually true for higher oil and natural gas prices. Our financial performance is therefore significantly affected by oil and natural gas prices and worldwide rig activity, which are summarized in the tables below.
The following table shows the average oil and natural gas prices for West Texas Intermediate (WTI), United Kingdom Brent crude oil and Henry Hub natural gas:
| 2019 | 2018 | 2017 | |||||||
| Oil price - WTI (1) | $ | 56.98 | $ | 64.94 | $ | 50.93 | |||
| Oil price - Brent (1) | 64.36 | 71.08 | 54.30 | ||||||
| Natural gas price - Henry Hub (2) | 2.54 | 3.17 | 3.04 | ||||||
| (1) Oil price measured in dollars per barrel(2) Natural gas price measured in dollars per million British thermal units (Btu), or MMBtu |
The historical average rig counts based on the weekly Baker Hughes rig count data were as follows:
| 2019 | 2018 | 2017 | ||||
| U.S. Land | 920 | 1,013 | 856 | |||
| U.S. Offshore | 23 | 19 | 20 | |||
| Canada | 134 | 191 | 206 | |||
| North America | 1,077 | 1,223 | 1,082 | |||
| International | 1,098 | 988 | 949 | |||
| Worldwide total | 2,175 | 2,211 | 2,031 |
HAL 2019 FORM 10-K | 24
| Table of Contents | Item 7 | Business Environment and Results of Operations |
Crude oil prices have been extremely volatile over the past five years. WTI oil spot prices declined significantly beginning in 2014 from a peak price of $108 per barrel in June 2014 to a low of $26 per barrel in February 2016, a level which had not been experienced since 2003. Since the low point experienced in early 2016, oil prices increased substantially, with WTI oil spot prices reaching a high of $77 per barrel in June 2018. In late 2018, oil prices again declined with WTI oil spot prices reaching a low of $44 per barrel in December, but rising to a high of $66 per barrel in April 2019. The average full year 2019 WTI crude oil spot price of $57 decreased 12% from the average 2018 price.
In the United States Energy Information Administration (EIA) January 2020 "Short Term Energy Outlook," the EIA projected Brent prices to average $65 per barrel in 2020 and $68 per barrel in 2021, while WTI prices were projected to average approximately $5.50 less per barrel through 2020 and 2021. The International Energy Agency's (IEA) January 2020 "Oil Market Report" forecasts 2020 global demand to average approximately 101.5 million barrels per day, an increase of 1% from 2019, driven by increases in the Asia Pacific region, while all other regions remain approximately the same.
The Henry Hub natural gas spot price in the United States averaged $2.54 per MMBtu in 2019, a decrease of $0.63 per MMBtu, or 20%, from 2018. The EIA January 2020 “Short Term Energy Outlook” projects Henry Hub natural gas prices to average $2.33 per MMBtu in 2020 and some upward price pressures to emerge in 2021 causing the average price to increase to $2.54 per MMBtu.
North America operations
The average North America rig count decreased 146 rigs, or 12%, for the full year 2019 as compared to 2018. The market for both drilling and completion services softened during the second half of 2019 with a continued reduction in activity as customers were focused on staying within their capital spending budgets. Some of the other factors leading to activity reductions included an oversupplied gas market and concerns about oil demand softness. In 2020, based on current information, we expect customers in U.S. land to reduce capital spending by approximately 10% from 2019 levels.
International operations
The average international rig count for 2019 increased 110 rigs, or 11% compared to 2018. We continue to see a broad-based recovery across numerous international geographies, and we expect more revenue and margin growth opportunities coming from mature fields and shallow water markets in 2020. Barring a global economic slowdown, broader offshore recovery should add momentum to the international growth. In 2020, we expect the international spend by our customers to slightly increase, making it the third consecutive year of spending growth.
Venezuela. The general license issued by the Office of Foreign Assets Control (OFAC) of the U.S. Department of Treasury, which allows us to continue operating in Venezuela despite OFAC sanctions imposed against the Venezuelan energy industry, was set to expire on July 27, 2019, but has been extended several times and is now set to expire on April 22, 2020. Consequently, unless OFAC further extends the term of the general license, we will cease operations in Venezuela on that date in order to comply with the sanctions. In that event, it is unlikely that we will be able to remove our assets that remain in Venezuela and those assets may be expropriated. Since we have previously written down all of our investment in Venezuela and have maintained limited operations in this country during the general license period, we do not expect the expiration of the license to have a material adverse effect on our business, consolidated results of operations and consolidated financial condition.
HAL 2019 FORM 10-K | 25
| Table of Contents | Item 7 | Results of Operations in 2019 Compared to 2018 |
RESULTS OF OPERATIONS IN 2019 COMPARED TO 2018
| Revenue: | Favorable | Percentage | |||||||||
| Millions of dollars | 2019 | 2018 | (Unfavorable) | Change | |||||||
| Completion and Production | $ | 14,031 | $ | 15,973 | $ | (1,942 | ) | (12 | )% | ||
| Drilling and Evaluation | 8,377 | 8,022 | 355 | 4 | |||||||
| Total revenue | $ | 22,408 | $ | 23,995 | $ | (1,587 | ) | (7 | )% | ||
| By geographic region: | |||||||||||
| North America | $ | 11,884 | $ | 14,431 | $ | (2,547 | ) | (18 | )% | ||
| Latin America | 2,364 | 2,065 | 299 | 14 | |||||||
| Europe/Africa/CIS | 3,285 | 2,945 | 340 | 12 | |||||||
| Middle East/Asia | 4,875 | 4,554 | 321 | 7 | |||||||
| Total | $ | 22,408 | $ | 23,995 | $ | (1,587 | ) | (7 | )% |
| Operating income (loss): | Favorable | Percentage | |||||||||
| Millions of dollars | 2019 | 2018 | (Unfavorable) | Change | |||||||
| Completion and Production | $ | 1,671 | $ | 2,278 | $ | (607 | ) | (27 | )% | ||
| Drilling and Evaluation | 642 | 745 | (103 | ) | (14 | ) | |||||
| Total | 2,313 | 3,023 | (710 | ) | (23 | ) | |||||
| Corporate and other | (255 | ) | (291 | ) | 36 | 12 | |||||
| Impairments and other charges | (2,506 | ) | (265 | ) | (2,241 | ) | n/m | ||||
| Total operating income (loss) | $ | (448 | ) | $ | 2,467 | $ | (2,915 | ) | n/m | ||
| n/m = not meaningful |
Consolidated revenue in 2019 was $22.4 billion, a decrease of $1.6 billion, or 7%, compared to 2018, primarily due to lower activity and pricing in North America land, primarily associated with stimulation services and well construction. Revenue from North America was 53% of consolidated revenue in 2019 and 60% of consolidated revenue in 2018.
We reported a consolidated operating loss of $448 million in 2019 driven by $2.5 billion of impairments and other charges. This compares to operating income of $2.5 billion in 2018, which includes $265 million of impairments and other charges related to Venezuela. A significant decline in stimulation activity and pricing in North America land during 2019 negatively impacted operating results, coupled with reduced drilling activity in the Middle East. See Note 2 to the consolidated financial statements for further discussion on impairments and other charges.
OPERATING SEGMENTS
Completion and Production
Completion and Production revenue was $14.0 billion in 2019, a decrease of $1.9 billion, or 12%, compared to 2018. Operating income was $1.7 billion in 2019, a 27% decrease from $2.3 billion in 2018. These results were primarily driven by reduced activity and pricing for stimulation services and lower completion tool sales in North America land. Partially offsetting these results were increased artificial lift activity in North America land, higher completion tool sales in the Gulf of Mexico, increased pressure pumping activity and higher completion tool sales in the Eastern Hemisphere, and higher pressure pumping activity in Latin America.
Drilling and Evaluation
Drilling and Evaluation revenue was $8.4 billion in 2019, an increase of $355 million, or 4%, from 2018. These results were primarily driven by a global increase in wireline activity, increased activity in multiple product service lines in the North Sea and Mexico, coupled with improved drilling activity in Asia Pacific and higher testing activity in the Eastern Hemisphere. These improvements were partially offset by decreased activity for drilling-related services in North America land and lower project management activity in the Middle East.
HAL 2019 FORM 10-K | 26
| Table of Contents | Item 7 | Results of Operations in 2019 Compared to 2018 |
Operating income was $642 million in 2019, a decrease of $103 million, or 14%, compared to 2018. These results were primarily driven by a decline in drilling activity in North America land, coupled with lower project management and drilling activity in the Middle East. Partially offsetting these results were global improvements in wireline activity and increased drilling-related services in Europe/Africa/CIS.
GEOGRAPHIC REGIONS
North America
North America revenue was $11.9 billion in 2019, an 18% decrease compared to 2018, resulting from lower activity and pricing in North America land, primarily associated with stimulation and drilling-related activity. This decline was partially offset by increased artificial lift activity in North America land and improved completion tool sales in the Gulf of Mexico.
Latin America
Latin America revenue was $2.4 billion in 2019, a 14% increase compared to 2018, resulting primarily from increased activity in multiple product service lines in Mexico and Argentina, partially offset by decreased well construction activity in Brazil.
Europe/Africa/CIS
Europe/Africa/CIS revenue was $3.3 billion in 2019, a 12% increase compared to 2018. The increases were due to higher activity for multiple product service lines throughout the region, primarily in the North Sea, Israel and Russia, partially offset by decreased pipeline services across the region.
Middle East/Asia
Middle East/Asia revenue was $4.9 billion in 2019, a 7% increase compared to 2018. The increases were due to higher activity throughout the region, primarily related to pressure pumping, completion tool sales and wireline activity, partially offset by decreased drilling activity and project management activity in the Middle East.
OTHER OPERATING ITEMS
Impairments and other charges were $2.5 billion in 2019, consisting of asset impairments, primarily associated with pressure pumping and drilling equipment, as well as severance and other costs incurred as we adjusted our cost structure during the year. This compares to $265 million of impairments and other charges recorded in 2018, representing a write-down of all of our remaining investment in Venezuela. See Note 2 to the consolidated financial statements for further discussion on these charges.
NONOPERATING ITEMS
Effective tax rate. During 2019, we recorded a total income tax provision of $7 million on a pre-tax loss of $1.1 billion, resulting in an effective tax rate of -0.6%. During 2018, we recorded a total income tax provision $157 million on pre-tax income of $1.8 billion, resulting in an effective tax rate of 8.7%. See Note 11 to the consolidated financial statements for significant drivers of these effective tax rates.
HAL 2019 FORM 10-K | 27
| Table of Contents | Item 7 | Results of Operations in 2018 Compared to 2017 |
RESULTS OF OPERATIONS IN 2018 COMPARED TO 2017
Information related to the comparison of our operating results between the years 2018 and 2017 is included in "Item 7. Management's Discussion and Analysis of Financial Condition and Results of Operations" of our 2018 Form 10-K filed with the SEC and is incorporated by reference into this annual report on Form 10-K.
HAL 2019 FORM 10-K | 28
| Table of Contents | Item 7 | Critical Accounting Estimates |
CRITICAL ACCOUNTING ESTIMATES
The preparation of financial statements requires the use of judgments and estimates. Our critical accounting policies are described below to provide a better understanding of how we develop our assumptions and judgments about future events and related estimates and how they can impact our financial statements. A critical accounting estimate is one that requires our most difficult, subjective or complex judgments and assessments and is fundamental to our results of operations. We identified our most critical accounting estimates to be:
| - | forecasting our effective income tax rate, including our future ability to utilize foreign tax credits and the realizability of deferred tax assets (including net operating loss carryforwards), and providing for uncertain tax positions; |
| - | legal and investigation matters; |
| - | valuations of long-lived assets, including intangible assets and goodwill; |
| - | purchase price allocation for acquired businesses; and |
| - | allowance for bad debts. |
We base our estimates on historical experience and on various other assumptions we believe to be reasonable according to the current facts and circumstances, the results of which form the basis for making judgments about the carrying values of assets and liabilities that are not readily apparent from other sources. We believe the following are the critical accounting policies used in the preparation of our consolidated financial statements, as well as the significant estimates and judgments affecting the application of these policies. This discussion and analysis should be read in conjunction with our consolidated financial statements and related notes included in this report.
Income tax accounting
We recognize the amount of taxes payable or refundable for the current year and use an asset and liability approach in recognizing the amount of deferred tax liabilities and assets for the future tax consequences of events that have been recognized in our financial statements or tax returns. We apply the following basic principles in accounting for our income taxes:
| - | a current tax liability or asset is recognized for the estimated taxes payable or refundable on tax returns for the current year; |
| - | a deferred tax liability or asset is recognized for the estimated future tax effects attributable to temporary differences and carryforwards; |
| - | the measurement of current and deferred tax liabilities and assets is based on provisions of the enacted tax law, and the effects of potential future changes in tax laws or rates are not considered; and |
| - | the value of deferred tax assets is reduced, if necessary, by the amount of any tax benefits that, based on available evidence, are not expected to be realized. |
We determine deferred taxes separately for each tax-paying component (an entity or a group of entities that is consolidated for tax purposes) in each tax jurisdiction. That determination includes the following procedures:
| - | identifying the types and amounts of existing temporary differences; |
| - | measuring the total deferred tax liability for taxable temporary differences using the applicable tax rate; |
| - | measuring the total deferred tax asset for deductible temporary differences and operating loss carryforwards using the applicable tax rate; |
| - | measuring the deferred tax assets for each type of tax credit carryforward; and |
| - | reducing the deferred tax assets by a valuation allowance if, based on available evidence, it is more likely than not that some portion or all of the deferred tax assets will not be realized. |
Our methodology for recording income taxes requires a significant amount of judgment in the use of assumptions and estimates. Additionally, we use forecasts of certain tax elements, such as taxable income and foreign tax credit utilization, as well as evaluate the feasibility of implementing tax planning strategies. Given the inherent uncertainty involved with the use of such variables, there can be significant variation between anticipated and actual results. Unforeseen events may significantly impact these variables, and changes to these variables could have a material impact on our income tax accounts related to both continuing and discontinued operations.
HAL 2019 FORM 10-K | 29
| Table of Contents | Item 7 | Critical Accounting Estimates |
We have operations in more than 80 countries. Consequently, we are subject to the jurisdiction of a significant number of taxing authorities. The income earned in these various jurisdictions is taxed on differing bases, including net income actually earned, net income deemed earned and revenue-based tax withholding. Our tax filings are routinely examined in the normal course of business by tax authorities. The final determination of our income tax liabilities involves the interpretation of local tax laws, tax treaties and related authorities in each jurisdiction, as well as the significant use of estimates and assumptions regarding the scope of future operations and results achieved and the timing and nature of income earned and expenditures incurred. The final determination of tax audits or changes in the operating environment, including changes in tax law and currency/repatriation controls, could impact the determination of our income tax liabilities for a tax year and have an adverse effect on our financial statements.
Tax filings of our subsidiaries, unconsolidated affiliates and related entities are routinely examined in the normal course of business by tax authorities. These examinations may result in assessments of additional taxes, which we work to resolve with the tax authorities and through the judicial process. Predicting the outcome of disputed assessments involves some uncertainty. Factors such as the availability of settlement procedures, willingness of tax authorities to negotiate and the operation and impartiality of judicial systems vary across the different tax jurisdictions and may significantly influence the ultimate outcome. We review the facts for each assessment, and then utilize assumptions and estimates to determine the most likely outcome and provide taxes, interest and penalties as needed based on this outcome. We provide for uncertain tax positions pursuant to current accounting standards, which prescribe a minimum recognition threshold and measurement methodology that a tax position taken or expected to be taken in a tax return is required to meet before being recognized in the financial statements. The standards also provide guidance for derecognition classification, interest and penalties, accounting in interim periods, disclosure and transition.
Legal and investigation matters
As discussed in Note 10 of our consolidated financial statements, we are subject to various legal and investigation matters arising in the ordinary course of business. As of December 31, 2019, we have accrued an estimate of the probable and estimable costs for the resolution of some of our legal and investigation matters, which is not material to our consolidated financial statements. For other matters for which the liability is not probable and reasonably estimable, we have not accrued any amounts. Attorneys in our legal department monitor and manage all claims filed against us and review all pending investigations. Generally, the estimate of probable costs related to these matters is developed in consultation with internal and outside legal counsel representing us. Our estimates are based upon an analysis of potential results, assuming a combination of litigation and settlement strategies. The accuracy of these estimates is impacted by, among other things, the complexity of the issues and the amount of due diligence we have been able to perform. We attempt to resolve these matters through settlements, mediation and arbitration proceedings when possible. If the actual settlement costs, final judgments or fines, after appeals, differ from our estimates, there may be a material adverse effect on our future financial results. We have in the past recorded significant adjustments to our initial estimates of these types of contingencies.
Value of long-lived assets, including intangible assets and goodwill
We carry a variety of long-lived assets on our balance sheet including property, plant and equipment, goodwill and other intangibles. Impairment is the condition that exists when the carrying amount of a long-lived asset exceeds its fair value, and any impairment charge that we record reduces our operating income. Goodwill is the excess of the cost of an acquired entity over the net of the amounts assigned to assets acquired and liabilities assumed. We conduct impairment tests on goodwill annually, during the third quarter, or more frequently whenever events or changes in circumstances indicate an impairment may exist. We conduct impairment tests on long-lived assets, other than goodwill, whenever events or changes in circumstances indicate that the carrying value may not be recoverable.
When conducting an impairment test on long-lived assets, other than goodwill, we first group individual assets based on a the lowest level for which identifiable cash flows are largely independent of the cash flows from other assets, which requires some judgment. We then compare estimated future undiscounted cash flows expected to result from the use and eventual disposition of the asset group to its carrying amount. If the undiscounted cash flows are less than the asset group’s carrying amount, we then determine the asset group's fair value by using a discounted cash flow analysis. This analysis is based on estimates such as management’s short-term and long-term forecast of operating performance, including revenue growth rates and expected profitability margins, estimates of the remaining useful life and service potential of the assets within the asset group, and a discount rate based on our weighted average cost of capital. An impairment loss is measured and recorded as the amount by which the asset group's carrying amount exceeds its fair value. See Note 2 to the consolidated financial statements for impairments and other charges recorded during the year ended December 31, 2019.
HAL 2019 FORM 10-K | 30
| Table of Contents | Item 7 | Critical Accounting Estimates |
We perform our goodwill impairment assessment for each reporting unit, which is the same as our reportable segments, the Completion and Production division and the Drilling and Evaluation division, comparing the estimated fair value of each reporting unit to the reporting unit’s carrying value, including goodwill. We estimate the fair value for each reporting unit using a discounted cash flow analysis based on management’s short-term and long-term forecast of operating performance. This analysis includes significant assumptions regarding discount rates, revenue growth rates, expected profitability margins, forecasted capital expenditures and the timing of expected future cash flows based on market conditions. If the estimated fair value of a reporting unit exceeds its carrying amount, goodwill of the reporting unit is not considered impaired. If the carrying amount of a reporting unit exceeds its estimated fair value, an impairment loss is measured and recorded.
The impairment assessments discussed above incorporate inherent uncertainties, including projected commodity pricing, supply and demand for our services and future market conditions, which are difficult to predict in volatile economic environments and could result in impairment charges in future periods if actual results materially differ from the estimated assumptions utilized in our forecasts. If market conditions further deteriorate, including crude oil prices significantly declining and remaining at low levels for a sustained period of time, we could be required to record additional impairments of the carrying value of our long-lived assets in the future which could have a material adverse impact on our operating results. See Note 1 to the consolidated financial statements for our accounting policies related to long-lived assets.
Acquisitions - purchase price allocation
We allocate the purchase price of an acquired business to its identifiable assets and liabilities based on estimated fair values. The excess of the purchase price over the amount allocated to the assets and liabilities, if any, is recorded as goodwill. We use all available information to estimate fair values, including quoted market prices, the carrying value of acquired assets and widely accepted valuation techniques such as discounted cash flows. We engage third-party appraisal firms when appropriate to assist in fair value determination of inventories, identifiable intangible assets and any other significant assets or liabilities. The judgments made in determining the estimated fair value assigned to each class of assets acquired and liabilities assumed, as well as asset lives, can materially impact our results of operations. Our acquisitions may also include contingent consideration, or earn-out provisions, which provide for additional consideration to be paid to the seller if certain future conditions are met. These earn-out provisions are estimated and recognized at fair value at the acquisition date based on projected earnings or other financial metrics over specified periods after the acquisition date. These estimates are reviewed during the specified period and adjusted based on actual results.
Allowance for bad debts
We evaluate our global accounts receivable through a continuous process of assessing our portfolio on an individual customer and overall basis. This process consists of a thorough review of historical collection experience, current aging status of the customer accounts, financial condition of our customers and whether the receivables involve retainages. We also consider the economic environment of our customers, both from a marketplace and geographic perspective, in evaluating the need for an allowance. Based on our review of these factors, we establish or adjust allowances for specific customers. This process involves a high degree of judgment and estimation, and frequently involves significant dollar amounts. Accordingly, our results of operations can be affected by adjustments to the allowance due to actual write-offs that differ from estimated amounts.
At December 31, 2019, our allowance for bad debts totaled $776 million, or 15.4% of notes and accounts receivable before the allowance. At December 31, 2018, our allowance for bad debts totaled $738 million, or 12.8% of notes and accounts receivable before the allowance. The allowance for bad debts in both years is primarily comprised of accounts receivable with our primary customer in Venezuela. A hypothetical 100 basis point change in our estimate of the collectability of our notes and accounts receivable balance as of December 31, 2019 would have resulted in a $51 million adjustment to 2019 total operating costs and expenses. See Note 5 to the consolidated financial statements for further information.
OFF BALANCE SHEET ARRANGEMENTS
At December 31, 2019, we had no material off balance sheet arrangements. In the normal course of business, we have agreements with financial institutions under which approximately $2.1 billion of letters of credit, bank guarantees or surety bonds were outstanding as of December 31, 2019. Some of the outstanding letters of credit have triggering events that would entitle a bank to require cash collateralization. None of these off balance sheet arrangements either has, or is likely to have, a material effect on our consolidated financial statements.
HAL 2019 FORM 10-K | 31
| Table of Contents | Item 7 | Financial Instrument Market Risk |
FINANCIAL INSTRUMENT MARKET RISK
We are exposed to market risk from changes in foreign currency exchange rates and interest rates. We selectively manage these exposures through the use of derivative instruments, including forward foreign exchange contracts, foreign exchange options and interest rate swaps. The objective of our risk management strategy is to minimize the volatility from fluctuations in foreign currency and interest rates. We do not use derivative instruments for trading purposes. The counterparties to our forward contracts, options and interest rate swaps are global commercial and investment banks.
We use a sensitivity analysis model to measure the impact of potential adverse movements in foreign currency exchange rates and interest rates. With respect to foreign exchange sensitivity, after consideration of the impact from our foreign exchange hedges, a hypothetical 10% adverse change in the value of all our foreign currency positions relative to the United States dollar as of December 31, 2019 would result in a $91 million, pre-tax, loss for our net monetary assets denominated in currencies other than United States dollars. With respect to interest rates sensitivity, after consideration of the impact from our interest rate swap, a hypothetical 100 basis point increase in the LIBOR rate would result in approximately an additional $1 million of interest charges for the year ended December 31, 2019.
There are certain limitations inherent in the sensitivity analyses presented, primarily due to the assumption that exchange rates and interest rates change instantaneously in an equally adverse fashion. In addition, the analyses are unable to reflect the complex market reactions that normally would arise from the market shifts modeled. While this is our best estimate of the impact of the various scenarios, these estimates should not be viewed as forecasts.
For further information regarding foreign currency exchange risk, interest rate risk and credit risk, see Note 15 to the consolidated financial statements.
ENVIRONMENTAL MATTERS
We are subject to numerous environmental, legal and regulatory requirements related to our operations worldwide. For information related to environmental matters, see Note 10 to the consolidated financial statements and "Part I, Item 1(a). “Risk Factors.”
FORWARD-LOOKING INFORMATION
The Private Securities Litigation Reform Act of 1995 provides safe harbor provisions for forward-looking information. Forward-looking information is based on projections and estimates, not historical information. Some statements in this Form 10-K are forward-looking and use words like “may,” “may not,” “believe,” “do not believe,” “plan,” “estimate,” “intend,” “expect,” “do not expect,” “anticipate,” “do not anticipate,” “should,” “likely” and other expressions. We may also provide oral or written forward-looking information in other materials we release to the public. Forward-looking information involves risk and uncertainties and reflects our best judgment based on current information. Our results of operations can be affected by inaccurate assumptions we make or by known or unknown risks and uncertainties. In addition, other factors may affect the accuracy of our forward-looking information. As a result, no forward-looking information can be guaranteed. Actual events and the results of our operations may vary materially.
We do not assume any responsibility to publicly update any of our forward-looking statements regardless of whether factors change as a result of new information, future events or for any other reason. You should review any additional disclosures we make in our press releases and Forms 10-K, 10-Q and 8-K filed with or furnished to the SEC. We also suggest that you listen to our quarterly earnings release conference calls with financial analysts.
HAL 2019 FORM 10-K | 32
| Table of Contents | Item 7(a) | Quantitative and Qualitative Disclosures About Market Risk |
Item 7(a). Quantitative and Qualitative Disclosures About Market Risk**.**
Information related to market risk is included in "Item 7. Management’s Discussion and Analysis of Financial Condition and Results of Operations – Financial Instrument Market Risk” and Note 15 to the consolidated financial statements.
HAL 2019 FORM 10-K | 33
Previous: Item 6. Selected Financial Data. · Next: Item 8. Financial Statements and Supplementary Data.