 filings.tools
Cover and table of contents
44K characters. Original on sec.gov · Markdown
Cover and table of contents
UNITED STATES SECURITIES AND EXCHANGE COMMISSION
Washington, D.C. 20549
FORM 10-K
(Mark One)
| ☒ | Annual Report Pursuant to Section 13 or 15(d) of the Securities Exchange Act of 1934 |
For the fiscal year ended December 31, 2020
OR
| ☐ | Transition Report Pursuant to Section 13 or 15(d) of the Securities Exchange Act of 1934 For the transition period from ______ to ______ |
Commission File Number 001-03492
HALLIBURTON COMPANY
(Exact name of registrant as specified in its charter)
| Delaware | 75-2677995 | ||||
| (State or other jurisdiction of | (I.R.S. Employer | ||||
| incorporation or organization) | Identification No.) |
3000 North Sam Houston Parkway East
Houston, Texas 77032
(Address of Principal Executive Offices)
Telephone Number – Area Code (281) 871-2699
| Securities registered pursuant to Section 12(b) of the Act: | ||||||||
| Title of each class | Trading Symbol | Name of each exchange on which registered | ||||||
| Common Stock, par value $2.50 per share | HAL | New York Stock Exchange | ||||||
| Securities registered pursuant to Section 12(g) of the Act: None |
Indicate by check mark if the registrant is a well-known seasoned issuer, as defined in Rule 405 of the Securities Act.
| Yes | ☒ | No | ☐ |
Indicate by check mark if the registrant is not required to file reports pursuant to Section 13 or Section 15(d) of the Act.
| Yes | ☐ | No | ☒ |
Indicate by check mark whether the registrant (1) has filed all reports required to be filed by Section 13 or 15(d) of the Securities Exchange Act of 1934 during the preceding 12 months (or for such shorter period that the registrant was required to file such reports), and (2) has been subject to such filing requirements for the past 90 days.
| Yes | ☒ | No | ☐ |
Indicate by check mark whether the registrant has submitted electronically every Interactive Data File required to be submitted pursuant to Rule 405 of Regulation S-T (§ 232.405 of this chapter) during the preceding 12 months (or for such shorter period that the registrant was required to submit such files).
| Yes | ☒ | No | ☐ |
Indicate by check mark whether the registrant is a large accelerated filer, an accelerated filer, a non-accelerated filer, a smaller reporting company, or an emerging growth company. See the definitions of “large accelerated filer,” “accelerated filer,” “smaller reporting company,” and "emerging growth company" in Rule 12b-2 of the Exchange Act.
| Large Accelerated Filer | ☒ | Accelerated Filer | ☐ | |||||||||||
| Non-accelerated Filer | ☐ | Emerging Growth Company | ☐ | |||||||||||
| Smaller Reporting Company | ☐ |
Indicate by check mark whether the registrant has filed a report on and attestation to its management's assessment of the effectiveness of its internal control over financial reporting under Section 404(b) of the Sarbanes-Oxley Act (15 U.S.C. 7262(b)) by the registered public accounting firm that prepared or issued its audit report. ☒
Indicate by check mark whether the registrant is a shell company (as defined in Rule 12b-2 of the Exchange Act).
| Yes | ☐ | No | ☒ |
The aggregate market value of Halliburton Company Common Stock held by non-affiliates on June 30, 2020, determined using the per share closing price on the New York Stock Exchange Composite tape of $12.98 on that date, was approximately $10.1 billion.
As of January 29, 2021, there were 888,632,775 shares of Halliburton Company Common Stock, $2.50 par value per share, outstanding.
Portions of the Halliburton Company Proxy Statement for our 2021 Annual Meeting of Shareholders (File No. 001-03492) are incorporated by reference into Part III of this report.
HALLIBURTON COMPANY
Index to Form 10-K
For the Year Ended December 31, 2020
i
| Table of Contents | Item 1 | Business |
PART I
Item 1. Business.
Description of business
Halliburton Company is one of the world's largest providers of products and services to the energy industry. Its predecessor was established in 1919 and incorporated under the laws of the State of Delaware in 1924. Inspired by the past and leading into the future, what started with a single product from a single location is now a global enterprise. We are proud of our over 100 years of operation, innovation, collaboration, and execution. Halliburton has fostered a culture of unparalleled service to the world's major, national, and independent oil and gas producers. With approximately 40,000 employees, representing 130 nationalities in more than 70 countries, we help our customers maximize asset value throughout the lifecycle of the reservoir - from locating hydrocarbons and managing geological data, to drilling and formation evaluation, well construction and completion, and optimizing production throughout the life of the asset.
2020 Highlights
- Safety and service quality: We achieved exceptional safety and service quality performance. We delivered historic bests across our business. Our total recordable incident rate and non-productive time improved by over 20% for the second year in a row. This is a result of our employees’ continued commitment to safety and process execution.
- Financial: We delivered swift and aggressive cost reduction actions in response to a decrease in global demand for our products and services. We systematically rationalized our operations to adjust to market activity levels, including through reducing equipment and personnel, restructuring our real estate holdings, and improving our service delivery platform, which contributed to improved margins by year-end 2020.
- Technology: We continued to innovate, launching several new products and services, and delivered best in class performance across a spectrum of digital technologies.
- Sustainable energy: We launched Halliburton Labs, a collaborative environment where entrepreneurs, academics, investors, and industrial labs come together to advance cleaner, affordable energy. Also, we committed to setting science-based targets to reduce our greenhouse gas emissions.
2021 Focus
- International: We are stronger technically, geographically, and organizationally; we see an unfolding activity recovery and are well positioned to drive profitable growth internationally.
- North America: As operators increase their activity levels to achieve maintenance level production, the operating leverage we have created in North America should allow us to increase our operating profits and cash flows.
- Digital: We are positioned to accelerate the deployment and integration of digitally enabled technologies, both internally and for our customers.
- Capital efficiency: We plan to advance technologies and make strategic choices that lower our capital expenditure profile.
- Sustainable energy: We will play an active role in advancing cleaner, affordable energy solutions.
Operating segments
We operate under two divisions, which form the basis for the two operating segments we report, the Completion and Production segment and the Drilling and Evaluation segment.
Completion and Production delivers cementing, stimulation, intervention, pressure control, artificial lift, and completion products and services. The segment consists of the following product service lines:
- Production Enhancement: includes stimulation services and sand control services. Stimulation services optimize oil and natural gas reservoir production through a variety of pressure pumping services, and chemical processes, commonly known as hydraulic fracturing and acidizing. Sand control services include fluid and chemical systems for the prevention of formation sand production.
- Cementing: involves bonding the well and well casing while isolating fluid zones and maximizing wellbore stability. Our cementing product service line also provides casing equipment.
- Completion Tools: provides downhole solutions and services to our customers to complete their wells, including well completion products and services, intelligent well completions, liner hanger systems, sand control systems, multilateral systems, and service tools.
- Production Solutions: provides customized well intervention solutions to increase well performance, which includes coiled tubing, hydraulic workover units, downhole tools, pumping services, and nitrogen services.
HAL 2020 FORM 10-K | 1
| Table of Contents | Item 1 | Business |
- Artificial Lift: provides services to maximize reservoir and wellbore recovery by applying lifting technology, intelligent field management solutions, and related services throughout the life of the well, including electrical submersible pumps.
- Pipeline & Process Services: provides a complete range of pre-commissioning, commissioning, maintenance, and decommissioning services to the onshore and offshore pipeline and process plant construction commissioning and maintenance industries. We have made a strategic decision to market this business for sale.
Drilling and Evaluation provides field and reservoir modeling, drilling, fluids and specialty chemicals, evaluation and precise wellbore placement solutions that enable customers to model, measure, drill, and optimize their well construction activities. The segment consists of the following product service lines:
- Baroid: provides drilling fluid systems, performance additives, completion fluids, solids control, specialized testing equipment, and waste management services for oil and natural gas drilling, completion, and workover operations. It also provides customized specialty oilfield completion, production, and downstream water and process treatment chemicals and services.
- Sperry Drilling: provides drilling systems and services that offer directional control for precise wellbore placement while providing important measurements about the characteristics of the drill string and geological formations while drilling wells. These services include directional and horizontal drilling, measurement-while-drilling, logging-while-drilling, surface data logging, and rig site information systems.
- Wireline and Perforating: provides open-hole logging services that supply information on formation evaluation and reservoir fluid analysis, including formation lithology, rock properties, and reservoir fluid properties. Also offered are cased-hole and slickline services, including perforating, pipe recovery services, through-casing formation evaluation and reservoir monitoring, casing and cement integrity measurements, and well intervention services.
- Drill Bits and Services: provides roller cone rock bits, fixed cutter bits, hole enlargement and related downhole tools and services used in drilling oil and natural gas wells. In addition, coring equipment and services are provided to acquire cores of the formation drilled for evaluation.
- Landmark Software and Services: provides cloud based digital services and artificial intelligence solutions on an open architecture for subsurface insights, integrated well construction, and reservoir and production management for the upstream oil and natural gas industry.
- Testing and Subsea: provides acquisition and analysis of dynamic reservoir information and reservoir optimization solutions to the oil and natural gas industry through a broad portfolio of test tools, data acquisition services, fluid sampling, surface well testing, subsea safety systems, and underbalanced applications.
- Halliburton Project Management: provides integrated solutions to our customers by leveraging the full line of our oilfield services, products, and technologies to solve customer challenges throughout the oilfield lifecycle, including project management and integrated asset management.
The following charts depict the company's revenue split between its two operating segments for the years ended December 31, 2020 and 2019.
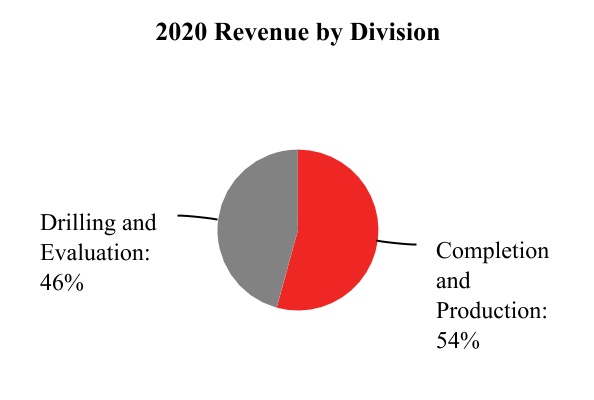
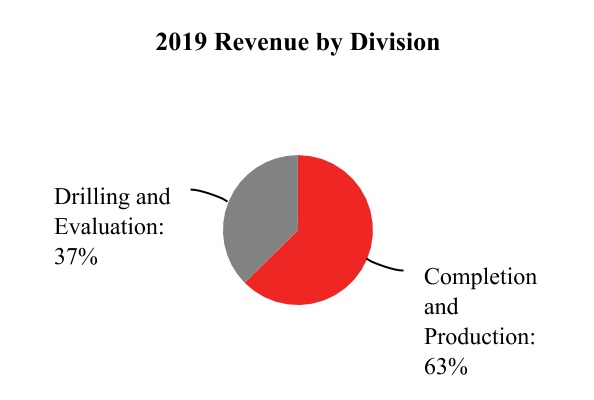
See Note 3 to the consolidated financial statements for further financial information related to each of our business segments.
HAL 2020 FORM 10-K | 2
| Table of Contents | Item 1 | Business |
Business strategy
Our value proposition is to collaborate and engineer solutions to maximize asset value for our customers. We strive to achieve strong cash flows and returns for our shareholders by delivering technology and services that improve efficiency, increase recovery, and maximize production for our customers. Our strategic priorities are to:
- deliver profitable growth in our international business;
- drive strategic changes that maximize cash flows in our leaner North America business;
- accelerate the deployment and integration of our digital technologies, both internally and with our customers;
- improve capital efficiency by advancing our technologies and making strategic choices that lower our capital expenditure profile; and
- actively participate in advancing a sustainable energy future.
For further discussion on our business strategies, see "Item 7. Management’s Discussion and Analysis of Financial Condition and Results of Operations – Executive Overview."
Markets and competition
We are one of the world’s largest diversified energy services companies. Our services and products are sold in highly competitive markets throughout the world. Competitive factors impacting sales of our services and products include: price; service delivery; health, safety and environmental standards and practices; service quality; global talent retention; understanding the geological characteristics of the hydrocarbon reservoir; product quality; warranty; and technical proficiency.
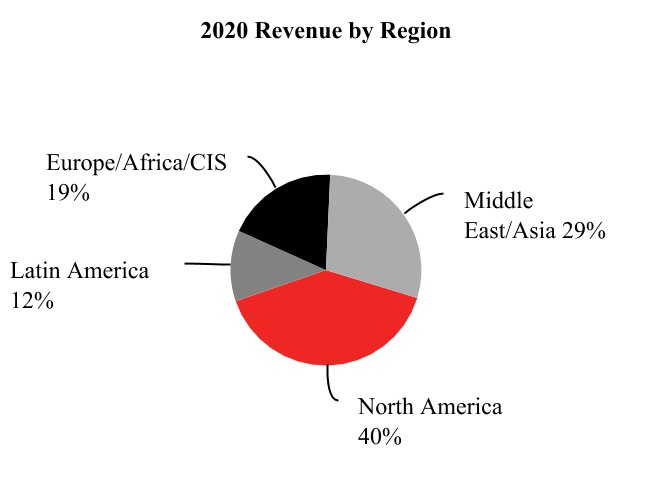
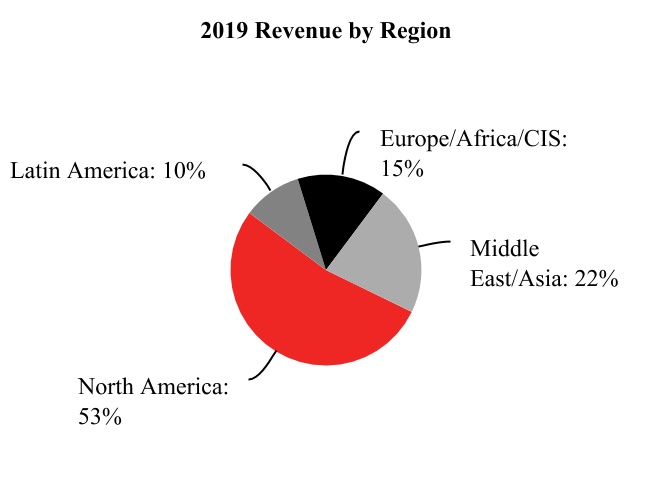
We conduct business worldwide in more than 70 countries. The business operations of our divisions are organized around four primary geographic regions: North America, Latin America, Europe/Africa/CIS, and Middle East/Asia. In 2020, 2019, and 2018, based on the location of services provided and products sold, 38%, 51%, and 58%, respectively, of our consolidated revenue was from the United States. No other country accounted for more than 10% of our consolidated revenue during these periods. See "Item 7. Management’s Discussion and Analysis of Financial Condition and Results of Operations” for additional information about our geographic operations. Because the markets for our services and products are vast and cross numerous geographic lines, it is not practicable to provide a meaningful estimate of the total number of our competitors. The industries we serve are highly competitive, and we have many substantial competitors. Most of our services and products are marketed through our service and sales organizations.
The following charts depict the company's revenue split between its four primary geographic regions for the years ended December 31, 2020 and 2019.
Operations in some countries may be adversely affected by unsettled political conditions, acts of terrorism, civil unrest, force majeure, war or other armed conflict, health or similar issues, sanctions, expropriation or other governmental actions, inflation, changes in foreign currency exchange rates, foreign currency exchange restrictions and highly inflationary currencies, as well as other geopolitical factors. We believe the geographic diversification of our business activities reduces the risk that loss of operations in any one country, other than the United States, would be materially adverse to our business, consolidated results of operations, or consolidated financial condition.
HAL 2020 FORM 10-K | 3
| Table of Contents | Item 1 | Business |
Information regarding our exposure to foreign currency fluctuations, risk concentration and financial instruments used to minimize risk is included in "Item 7. Management’s Discussion and Analysis of Financial Condition and Results of Operations – Financial Instrument Market Risk” and in Note 15 to the consolidated financial statements.
Customers
Our revenue during the past three years was derived from the sale of services and products to the energy industry. No single customer represented more than 10% of our consolidated revenue in any period presented.
Raw materials
Raw materials essential to our business are normally readily available. Market conditions can trigger constraints in the supply of certain raw materials, such as proppants (primarily sand), hydrochloric acid, and gels. We are always seeking ways to ensure the availability of resources and manage raw materials costs. Our procurement department uses our size and buying power to enhance our access to key materials at competitive prices.
Patents
We own a large number of patents and have pending a substantial number of patent applications covering various products and processes. We are also licensed to utilize technology covered by patents owned by others, and we license others to utilize technology covered by our patents. We do not consider any particular patent to be material to our business operations.
Seasonality
Weather and natural phenomena can temporarily affect the performance of our services, but the widespread geographical locations of our operations mitigate those effects. Examples of how weather can impact our business include:
- the severity and duration of the winter in North America can have a significant impact on natural gas storage levels and drilling activity;
- the timing and duration of the spring thaw in Canada directly affects activity levels due to road restrictions;
- typhoons and hurricanes can disrupt coastal and offshore operations; and
- severe weather during the winter normally results in reduced activity levels in the North Sea and Russia.
Additionally, customer spending patterns for completion tools typically result in higher activity in the fourth quarter of the year. Conversely, customer spending patterns and budget constraints in North America may lead to lower demand for various other services and products in the second half of the year.
Our workforce
We collaborate as a team to execute for each other, our customers, and our shareholders. At December 31, 2020, we employed approximately 40,000 people worldwide compared to approximately 55,000 at December 31, 2019. At December 31, 2020, approximately 17% of our employees were subject to collective bargaining agreements. We have operations in over 70 countries. Based upon the geographic diversification of these employees, we do not believe any risk of loss from employee strikes or other collective actions would be material to the conduct of our operations taken as a whole.
Diversity, inclusion and career development
The diversity of our global workforce stimulates creativity and innovation as we use our collective talents to develop unique solutions to address the world's energy challenges. We create a positive work environment by maintaining a strong culture of diversity and inclusion, supported by our Code of Business Conduct and employment practices. We remain one of the most diverse companies in the world with over 130 nationalities represented, with a focus on having a local workforce in the countries in which we do business.
We have made significant progress on increasing our gender diversity in our science, technology, engineering, and mathematics (STEM) focused job roles, which are pipelines for operational leadership. The total population of women in STEM-based roles is 15% today. We have doubled our hiring of women in STEM-based job roles over the last ten years and intend to continue this effort.
HAL 2020 FORM 10-K | 4
| Table of Contents | Item 1 | Business |
We are committed to providing an inclusive workplace and career development opportunities to attract and retain talented employees. An important key to having engaged employees is offering best-in-class training and career development programs to enhance opportunities for professional growth. We manage employee performance and engagement through frequent Check-ins between employees and managers. These discussions focus on status of work, priorities, performance, feedback, and development. All employees are part of the Check-in process, which is the cornerstone of our performance management and career development framework. For employees who have been identified as having top leadership potential, Halliburton offers a four-tiered Business Leadership Development program designed to provide additional skills, knowledge, and experience.
Compensation, benefits and well-being
Halliburton’s compensation programs are integrated with our overall business strategies and management processes to incentivize performance, maximize returns, and build shareholder value. We work with consultants to benchmark our compensation and benefits programs to help us offer competitive remuneration packages to attract and retain high-performing executives. We also offer comprehensive benefits and competitive salaries to attract qualified candidates to meet the dynamic needs of employees and their families, in addition to retirement plans and health and wellness benefits.
Safety
Our safety vision expresses our dedication to setting the highest standards, embracing all challenges, and making no compromises in fulfilling our commitment to our employees to get them home safely at the end of the day. For the years ended December 31, 2020 and December 31, 2019, our recordable incident rate was 0.20% and 0.29%, respectively, and non-productive time was 0.31% and 0.39%, respectively.
Government regulation
We are subject to numerous environmental, legal, and regulatory requirements related to our operations worldwide. For further information related to environmental matters and regulation, see Note 10 to the consolidated financial statements and "Item 1(a). Risk Factors.”
Hydraulic fracturing
Hydraulic fracturing is a process that creates fractures extending from the well bore into the rock formation to enable natural gas or oil to move more easily from the rock pores to a production conduit. A significant portion of our Completion and Production segment provides hydraulic fracturing services to customers developing shale natural gas and shale oil. From time to time, questions arise about the scope of our operations in the shale natural gas and shale oil sectors, and the extent to which these operations may affect human health and the environment.
At the direction of our customer, we design and generally implement a hydraulic fracturing operation to 'stimulate' the well's production, once the well has been drilled, cased, and cemented. Our customer is generally responsible for providing the base fluid (usually water) used in the hydraulic fracturing of a well. We frequently supply the proppant (primarily sand) and at least a portion of the additives used in the overall fracturing fluid mixture. In addition, we mix the additives and proppant with the base fluid and pump the mixture down the wellbore to create the desired fractures in the target formation. The customer is responsible for disposing and/or recycling for further use any materials that are subsequently produced or pumped out of the well, including flowback fluids and produced water.
As part of the process of constructing the well, the customer will take a number of steps designed to protect drinking water resources. In particular, the casing and cementing of the well are designed to provide 'zonal isolation' so that the fluids pumped down the wellbore and the oil and natural gas and other materials that are subsequently pumped out of the well will not come into contact with shallow aquifers or other shallow formations through which those materials could potentially migrate to freshwater aquifers or the surface.
The potential environmental impacts of hydraulic fracturing have been studied by numerous government entities and others. In 2004, the United States Environmental Protection Agency (EPA) conducted an extensive study of hydraulic fracturing practices, focusing on coalbed methane wells, and their potential effect on underground sources of drinking water. The EPA’s study concluded that hydraulic fracturing of coalbed methane wells poses little or no threat to underground sources of drinking water. In December 2016, the EPA released a final report, “Hydraulic Fracturing for Oil and Gas: Impacts from the Hydraulic Fracturing Water Cycle on Drinking Water Resources in the United States” representing the culmination of a six-year study requested by Congress. While the EPA report noted a potential for some impact to drinking water sources caused by hydraulic fracturing, the agency confirmed the overall incidence of impacts is low. Moreover, a number of the areas of potential impact identified in the report involve activities for which we are not generally responsible, such as potential impacts associated with withdrawals of surface water for use as a base fluid and management of wastewater.
HAL 2020 FORM 10-K | 5
| Table of Contents | Item 1 | Business |
We have proactively developed processes to provide our customers with the chemical constituents of our hydraulic fracturing fluids to enable our customers to comply with state laws as well as voluntary standards established by the Chemical Disclosure Registry, www.fracfocus.org. We have invested considerable resources in developing hydraulic fracturing technologies, in both the equipment and chemistry portions of our business, which offer our customers a variety of environment-friendly options related to the use of hydraulic fracturing fluid additives and other aspects of our hydraulic fracturing operations. We created a hydraulic fracturing fluid system comprised of materials sourced entirely from the food industry. In addition, we have engineered a process that uses ultraviolet light to control the growth of bacteria in hydraulic fracturing fluids, allowing customers to minimize the use of chemical biocides. We are committed to the continued development of innovative chemical and mechanical technologies that allow for more economical and environment-friendly development of the world’s oil and natural gas reserves, and that reduce noise while complying with Tier 4 lower emission legislation.
In evaluating any environmental risks that may be associated with our hydraulic fracturing services, it is helpful to understand the role that we play in the development of shale natural gas and shale oil. Our principal task generally is to manage the process of injecting fracturing fluids into the borehole to 'stimulate' the well. Thus, based on the provisions in our contracts and applicable law, the primary environmental risks we face are potential pre-injection spills or releases of stored fracturing fluids and potential spills or releases of fuel or other fluids associated with pumps, blenders, conveyors, or other above-ground equipment used in the hydraulic fracturing process.
Although possible concerns have been raised about hydraulic fracturing, the circumstances described above have helped to mitigate those concerns. To date, we have not been obligated to compensate any indemnified party for any environmental liability arising directly from hydraulic fracturing, although there can be no assurance that such obligations or liabilities will not arise in the future. For further information on risks related to hydraulic fracturing, see "Item 1(a). Risk Factors.”
Working capital
We fund our business operations through a combination of available cash and equivalents, short-term investments, and cash flow generated from operations. In addition, our revolving credit facility is available for additional working capital needs.
Web site access - www.halliburton.com
Our annual reports on Form 10-K, quarterly reports on Form 10-Q, current reports on Form 8-K and amendments to those reports filed or furnished to the Securities and Exchange Commission (SEC) pursuant to Section 13(a) or 15(d) of the Securities Exchange Act of 1934 are available at www.halliburton.com soon thereafter. The SEC website www.sec.gov contains our reports, proxy and information statements and our other SEC filings. Our Code of Business Conduct, which applies to all our employees and Directors and serves as a code of ethics for our principal executive officer, principal financial officer, principal accounting officer, and other persons performing similar functions, can be found at www.halliburton.com. Any amendments to our Code of Business Conduct or any waivers from provisions of our Code of Business Conduct granted to the specified officers above are also disclosed on our web site within four business days after the date of any amendment or waiver pertaining to these officers. There have been no waivers from provisions of our Code of Business Conduct for the years 2020, 2019, or 2018. Except to the extent expressly stated otherwise, information contained on or accessible from our web site or any other web site is not incorporated by reference into this annual report on Form 10-K and should not be considered part of this report.
Executive Officers of the Registrant
The following table indicates the names and ages of the executive officers of Halliburton Company as of February 5, 2021, including all offices and positions held by each in the past five years:
| Name and Age | Offices Held and Term of Office | |||||||
| Anne L. Beaty (Age 64) | Senior Vice President, Finance of Halliburton Company, since March 2017 | |||||||
| Senior Vice President, Internal Assurance Services of Halliburton Company, November 2013 to March 2017 | ||||||||
| Van H. Beckwith (Age 55) | Executive Vice President, Secretary and Chief Legal Officer of Halliburton Company, since December 2020 | |||||||
| Senior Vice President and General Counsel, January 2020 to December 2020 | ||||||||
| Partner, Baker Botts L.L.P., January 1999 to December 2019 |
HAL 2020 FORM 10-K | 6
| Table of Contents | Item 1 | Business |
| Eric J. Carre (Age 54) | Executive Vice President, Global Business Lines of Halliburton Company, since May 2016 | |||||||
| Senior Vice President, Drilling and Evaluation Division of Halliburton Company, June 2011 to April 2016 | ||||||||
| Charles E. Geer, Jr. (Age 50) | Senior Vice President and Chief Accounting Officer of Halliburton Company, since December 2019 | |||||||
| Vice President and Corporate Controller of Halliburton Company, January 2015 to December 2019 | ||||||||
| Myrtle L. Jones (Age 61) | Senior Vice President, Tax of Halliburton Company, since March 2013 | |||||||
| Lance Loeffler (Age 43) | Executive Vice President and Chief Financial Officer of Halliburton Company, since November 2018 | |||||||
| Vice President of Investor Relations of Halliburton Company, April 2016 to November 2018 | ||||||||
| Vice President of Corporate Development of Halliburton Company, August 2014 to April 2016 | ||||||||
| Timothy M. McKeon (Age 48) | Vice President and Treasurer of Halliburton Company, since January 2014 | |||||||
| Jeffrey A. Miller (Age 57) | Chairman of the Board, President and Chief Executive Officer of Halliburton Company, since January 2019 | |||||||
| Member of the Board of Directors, President and Chief Executive Officer of Halliburton Company, June 2017 to December 2018 | ||||||||
| Member of the Board of Directors and President of Halliburton Company, August 2014 to May 2017 | ||||||||
| Lawrence J. Pope (Age 52) | Executive Vice President of Administration and Chief Human Resources Officer of Halliburton Company, since January 2008 | |||||||
| Joe D. Rainey (Age 64) | President, Eastern Hemisphere of Halliburton Company, since January 2011 | |||||||
| Mark J. Richard (Age 59) | President, Western Hemisphere of Halliburton Company, since February 2019 | |||||||
| Senior Vice President, Northern U.S. Region of Halliburton Company, August 2018 to January 2019 | ||||||||
| Senior Vice President, Business Development and Marketing of Halliburton Company, November 2015 to July 2018 |
There are no family relationships between the executive officers of the registrant or between any director and any executive officer of the registrant.
HAL 2020 FORM 10-K | 7
| Table of Contents | Item 1(a) | Risk Factors |
Next: Item 1. (a). Risk Factors.