 filings.tools
Item 2. Management's Discussion and Analysis of Financial Condition and Results of Operations
32K characters. Original on sec.gov · Markdown
Item 2. Management's Discussion and Analysis of Financial Condition and Results of Operations
Management's Discussion and Analysis of Financial Condition and Results of Operations (MD&A) should be read in conjunction with the condensed consolidated financial statements included in "Item 1. Financial Statements" contained herein.
EXECUTIVE OVERVIEW
Organization
We are one of the world's largest providers of products and services to the energy industry. We help our customers maximize value throughout the lifecycle of the reservoir - from locating hydrocarbons and managing geological data, to drilling and formation evaluation, well construction and completion, and optimizing production throughout the life of the asset. Activity levels within our operations are significantly impacted by spending on upstream exploration, development, and production programs by major, national, and independent oil and natural gas companies. We report our results under two segments, the Completion and Production segment and the Drilling and Evaluation segment.
-
Completion and Production delivers cementing, stimulation, intervention, pressure control, artificial lift, specialty chemicals, and completion products and services. The segment consists of Production Enhancement, Cementing, Completion Tools, Production Solutions, Artificial Lift, Multi-Chem, and Pipeline and Process Services.
-
Drilling and Evaluation provides field and reservoir modeling, drilling, fluids, evaluation, and precise wellbore placement solutions that enable customers to model, measure, drill, and optimize their well construction activities. The segment consists of Baroid, Sperry Drilling, Wireline and Perforating, Drill Bits and Services, Landmark Software and Services, Testing and Subsea, and Project Management.
The business operations of our segments are organized around four primary geographic regions: North America, Latin America, Europe/Africa/CIS, and Middle East/Asia. We have manufacturing operations in various locations, the most significant of which are in the United States, Malaysia, Singapore, and the United Kingdom. With approximately 46,000 employees, we operate in more than 70 countries around the world, and our corporate headquarters is in Houston, Texas.
Our value proposition is to collaborate and engineer solutions to maximize asset value for our customers. We work to achieve strong cash flows and returns for our shareholders by delivering technology and services that improve efficiency, increase recovery, and maximize production for our customers. Our strategic priorities are to:
- International: Allocate our capital to the highest return opportunities and increase our international growth in both onshore and offshore markets.
- North America: Drive better pricing, increased efficiency, and higher margin through utilization of our automated and intelligent fracturing technologies and increased market penetration of our premium low-emissions electronic fracturing equipment.
- Digital: Continue to drive differentiation and efficiencies through the deployment and integration of digital and automation technologies, both internally and for our customers.
- Capital efficiency: Maintain our capital expenditures in the range of 5-6% of revenue while focusing on technological advancements and process changes that reduce our manufacturing and maintenance costs and improve how we move equipment and respond to market opportunities.
- Sustainability and energy mix transition: Continue to:
-
Leverage the increasing number of participants in and scope of Halliburton Labs to gain insight into developing value chains in the energy mix transition;
-
Develop and deploy solutions to help oil and gas operators lower their emissions while also using our existing technologies in renewable energy applications;
-
Develop technologies and solutions to lower our own emissions; and
-
Grow our participation in the entire life cycle of carbon capture and storage, hydrogen, and geothermal projects globally.
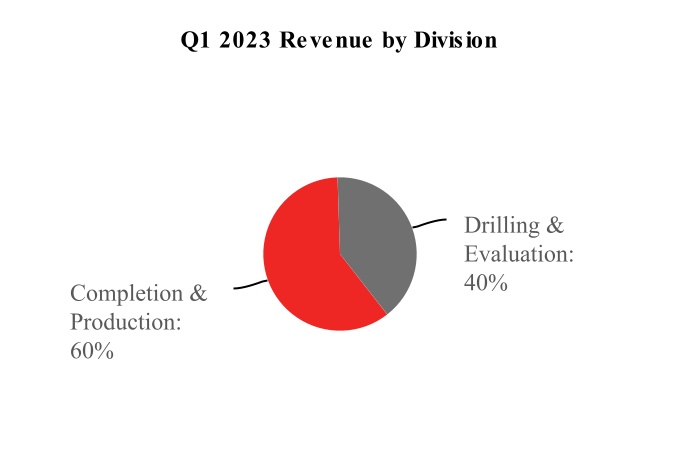
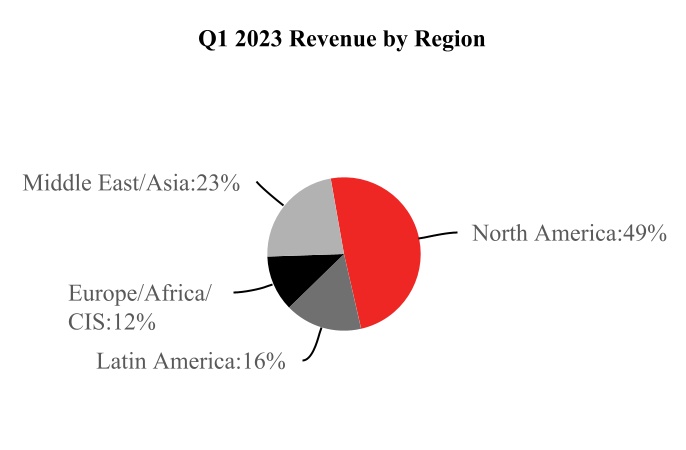
The following charts depict the revenue split between our two operating segments and our four primary geographic regions for the quarter ended March 31, 2023.
HAL Q1 2023 FORM 10-Q | 12
| Table of Contents | Part I. Item 2 | Executive Overview |
Market conditions
Commodity price volatility continued during the first quarter of 2023 driven by inflationary pressures, changes to OPEC+ production levels, supply chain shortages, demand uncertainty, recessionary fears, and geopolitical conflicts. During the first quarter of 2023, the West Texas Intermediate (WTI) crude oil price averaged approximately $76 per barrel and the Brent crude oil price average approximately $81 per barrel. Both of these prices were well below the average price per barrel for 2022. The U.S. land average rig count continued to be lower than pre-COVID-19 pandemic levels. On April 2, 2023, OPEC+ announced a voluntary production cut of 1.2 million barrels per day, effective May 2023 through the end of the year, in addition to the Russian Federation's announcement of a reduction of 0.5 million barrels per day from March 2023 until the end of 2023. The International Energy Agency's (IEA) April 2023 "Oil Market Report" indicates that the additional OPEC+ cut will push world oil supply down by 0.4 million barrels per day by the end of 2023, thus resulting in an expected oil supply deficit. We believe that these production cuts, together with the continued underinvestment in oil and gas exploration when compared to historic levels will result in higher oil prices. The Brent crude oil spot price in the United States Energy Information Administration (EIA)'s April 2023 forecast averages $85 per barrel in 2023, an increase of 2.4%, or $2 per barrel, from the prior month's forecast, reflecting a decrease in global production and a relatively unchanged outlook for global oil consumption.
Globally, we continue to be impacted by increased supply chain lead times for the supply of raw materials and transportation logistics. We monitor market trends and work to mitigate cost impacts through economies of scale in global procurement, technology modifications, and efficient sourcing practices. Also, while we have been impacted by inflationary cost increases, primarily related to frac sand, chemicals, cement, and logistics costs, we generally try to pass much of those increases on to our customers and we believe we have effective solutions to minimize the operational impact.
Financial results
The following graph illustrates our revenue and operating margins for each operating segment for the first quarter of 2022 and 2023.

HAL Q1 2023 FORM 10-Q | 13
| Table of Contents | Part I. Item 2 | Executive Overview |
During the first quarter of 2023, we generated total company revenue of $5.7 billion, a 33% increase as compared to the first quarter of 2022. We reported operating income of $977 million during the first quarter of 2023 compared to operating income of $511 million during the first quarter of 2022. Our Completion and Production segment revenue increased 45% in the first quarter of 2023 as compared to the first quarter of 2022, primarily due to increased pressure pumping services in North America land. Our Drilling and Evaluation segment revenue increased 17% in the first quarter of 2023 as compared to the first quarter of 2022, driven primarily by improvements in drilling-related services, wireline activity, and testing services globally. Both segment results were negatively impacted in the first quarter of 2023 when compared to the first quarter of 2022, as a result of the sale of our Russian operations during the third quarter of 2022.
In North America, our revenue increased 44% in the first quarter of 2023, as compared to the first quarter of 2022, driven by increased stimulation activity and pricing gains, increased well construction and wireline activity in North America land, and increased activity in the U.S. Gulf of Mexico across multiple product service lines. The North America average rig count increased 18% in the first quarter of 2023 as compared to the first quarter of 2022.
Internationally, revenue increased 23% in the first quarter of 2023, as compared to the first quarter of 2022, primarily driven by higher activity for drilling and completions related services across all regions, partially offset by the sale of our Russian operations during the third quarter of 2022. The international average rig count increased 11% in the first quarter of 2023 as compared to the first quarter of 2022.
Sustainability and Energy Advancement
We continue to pursue our strategic initiatives around advancing cleaner, affordable energy, and supporting sustainable energy advancements using innovation and technology to decarbonize both our and our customers' operations. This includes the continued development and deployment of solutions designed to help oil and gas operators lower their environmental impact while also using our existing technologies in sustainable energy applications.
In February of 2023, Halliburton and Siguler Guff & Company, LP announced the launch of Envana Software Partners, LLC. The new venture provides critical emissions management software-as-a-service solutions to track greenhouse gas emissions in the oil and gas industry and other industries.
In addition, Halliburton Labs, our clean energy accelerator, continues to provide us insight into developing value chains in the energy mix transition and opportunities to assist early stage companies to enable them to achieve scaling milestones. Halliburton Labs has 24 participants and alumni as of the end of the first quarter of 2023.
Our operating performance and liquidity are described in more detail in "Liquidity and Capital Resources" and “Business Environment and Results of Operations.”
HAL Q1 2023 FORM 10-Q | 14
| Table of Contents | Part I. Item 2 | Liquidity and Capital Resources |
LIQUIDITY AND CAPITAL RESOURCES
As of March 31, 2023, we had $1.9 billion of cash and equivalents, compared to $2.3 billion of cash and equivalents at December 31, 2022.
Significant sources and uses of cash during the first three months of 2023
Sources of cash:
*•*Cash flows from operating activities were $122 million. This included a negative impact from the primary components of our working capital (receivables, inventories, and accounts payable) of a net $728 million, primarily associated with increased receivables and inventory.
Uses of cash:
*•*Capital expenditures were $268 million.
-
We paid $145 million of dividends to our shareholders.
-
We repurchased 2.9 million shares of our common stock for $100 million.
Future sources and uses of cash
We manufacture most of our own equipment, which provides us with some flexibility to increase or decrease our capital expenditures based on market conditions. We currently expect capital spending for 2023 to be within our target of approximately 5-6% of revenue. We believe this level of spend will allow us to invest in our key strategic areas. However, we will continue to maintain capital discipline and monitor the rapidly changing market dynamics, and we may adjust our capital spend accordingly.
While we maintain focus on liquidity and debt reduction, we are also focused on providing cash returns to our shareholders. Our quarterly dividend rate is $0.16 per common share, or approximately $145 million. In January of 2023, our Board of Directors approved a capital return framework with a goal of returning at least 50% of our annual free cash flow to shareholders through dividends and share repurchases and we expect our returns to shareholders will be in line with our capital return framework for 2023.
We may utilize share repurchases as part of our capital return framework. Our Board of Directors has authorized a program to repurchase our common stock from time to time. Repurchases of 2.9 million shares of common stock occurred during the first quarter of 2023 under this program. Approximately $4.8 billion remained authorized for repurchases as of March 31, 2023 and may be used for open market and other share purchases.
Other factors affecting liquidity
Financial position in current market. As of March 31, 2023, we had $1.9 billion of cash and equivalents and $3.5 billion of available committed bank credit under a revolving credit facility with an expiration date of April 27, 2027. We believe we have a manageable debt maturity profile, with approximately $500 million coming due beginning in 2025 through 2027. Furthermore, we have no financial covenants or material adverse change provisions in our bank agreements, and our debt maturities extend over a long period of time. We believe our cash on hand, cash flows generated from operations, and our available credit facility will provide sufficient liquidity to address the challenges and opportunities of the current market and our global cash needs, including capital expenditures, working capital investments, shareholder returns, if any, and contingent liabilities.
Guarantee agreements. In the normal course of business, we have agreements with financial institutions under which approximately $2.1 billion of letters of credit, bank guarantees, or surety bonds were outstanding as of March 31, 2023. Some of the outstanding letters of credit have triggering events that would entitle a bank to require cash collateralization; however, none of these triggering events have occurred. As of March 31, 2023, we had no material off-balance sheet liabilities and were not required to make any material cash distributions to our unconsolidated subsidiaries.
Credit ratings. Our credit ratings with Standard & Poor’s (S&P) remain BBB+ for our long-term debt and A-2 for our short-term debt, with a stable outlook. Our credit ratings with Moody’s Investors Service (Moody's) remain Baa1 for our long-term debt and P-2 for our short-term debt, with a stable outlook.
HAL Q1 2023 FORM 10-Q | 15
| Table of Contents | Part I. Item 2 | Liquidity and Capital Resources |
Customer receivables. In line with industry practice, we bill our customers for our services in arrears and are, therefore, subject to our customers delaying or failing to pay our invoices. In weak economic environments, we may experience increased delays and failures to pay our invoices due to, among other reasons, a reduction in our customers’ cash flow from operations and their access to the credit markets, as well as unsettled political conditions.
Receivables from our primary customer in Mexico accounted for approximately 11% of our total receivables as of March 31, 2023. While we have experienced payment delays in Mexico, these amounts are not in dispute and we have not historically had, and we do not expect, any material write-offs due to collectability of receivables from this customer.
HAL Q1 2023 FORM 10-Q | 16
| Table of Contents | Part I. Item 2 | Business Environment and Results of Operations |
BUSINESS ENVIRONMENT AND RESULTS OF OPERATIONS
We operate in more than 70 countries throughout the world to provide a comprehensive range of services and products to the energy industry. Our revenue is generated from the sale of services and products to major, national, and independent oil and natural gas companies worldwide. The industry we serve is highly competitive with many substantial competitors in each segment of our business. During the first three months of 2023, based upon the location of the services provided and products sold, 47% of our consolidated revenue was from the United States, compared to 43% of our consolidated revenue from the United States in the first three months of 2022. No other country accounted for more than 10% of our revenue.
Activity within our business segments is significantly impacted by spending on upstream exploration, development, and production programs by our customers. Also impacting our activity is the status of the global economy, which impacts oil and natural gas consumption.
Some of the more significant determinants of current and future spending levels of our customers are oil and natural gas prices and our customers' expectations about future prices, global oil supply and demand, completions intensity, the world economy, the availability of capital, government regulation, and global stability, which together drive worldwide drilling and completions activity. Additionally, during 2023, we generally expect that many of our customers in North America will continue their strategy of operating within their cash flows and generating returns rather than prioritizing production growth. Lower oil and natural gas prices usually translate into lower exploration and production budgets and lower rig count, while the opposite is usually true for higher oil and natural gas prices. Our financial performance is therefore significantly affected by oil and natural gas prices and worldwide rig activity, which are summarized in the tables below.
The table below shows the average prices for WTI crude oil, United Kingdom Brent crude oil, and Henry Hub natural gas.
| Three Months Ended March 31 | Year Ended December 31 | ||||||||||||||||
| 2023 | 2022 | 2022 | |||||||||||||||
| Oil price - WTI (1) | $ | 76.08 | $ | 94.45 | $ | 96.04 | |||||||||||
| Oil price - Brent (1) | 81.17 | 100.30 | 100.78 | ||||||||||||||
| Natural gas price - Henry Hub (2) | 2.65 | 4.66 | 6.29 | ||||||||||||||
| (1) | Oil price measured in dollars per barrel. | ||||||||||||||||
| (2) | Natural gas price measured in dollars per million British thermal units (Btu), or MMBtu. |
The historical average rig counts based on the weekly Baker Hughes rig count data were as follows:
| Three Months Ended March 31 | Year Ended December 31 | ||||||||||||||||
| 2023 | 2022 | 2022 | |||||||||||||||
| U.S. Land | 744 | 619 | 708 | ||||||||||||||
| U.S. Offshore | 16 | 16 | 15 | ||||||||||||||
| Canada | 221 | 198 | 175 | ||||||||||||||
| North America | 981 | 833 | 898 | ||||||||||||||
| International | 915 | 823 | 851 | ||||||||||||||
| Worldwide total | 1,896 | 1,656 | 1,749 |
HAL Q1 2023 FORM 10-Q | 17
| Table of Contents | Part I. Item 2 | Business Environment and Results of Operations |
Business outlook
According to the United States Energy Information Administration (EIA) April 2023 "Short Term Energy Outlook", the Brent spot price is expected to average $86 per barrel for the second quarter of 2023, with an expected full year 2023 average of $85 per barrel, a decline of approximately $16 per barrel, or 16%, as compared to the full year 2022 average. The 2023 forecasted Brent spot price reflects a forecast for less global production in 2023 and a relatively unchanged outlook for global oil consumption. According to the EIA, WTI prices are expected to average $80 per barrel in the second quarter of 2023 and $79 per barrel for the full year 2023, resulting in a decrease of approximately $16 per barrel, or 17%, compared to the full year 2022.
The EIA April 2023 “Short Term Energy Outlook” projects Henry Hub natural gas prices to average $2.65 per MMBtu during the second quarter of 2023, and average $2.94 per MMBtu for the full year 2023.
Per the International Energy Agency (IEA) April 2023 "Oil Market Report", the forecasted global oil demand is set to average 101.9 million barrels per day in 2023, an approximate 2.0 million barrels per day increase from 2022. The EIA projects crude oil production in the United States will average 12.54 million barrels per day in 2023, a 5% increase from the average 11.88 million barrels per day in 2022, and to average 12.75 million barrels per day in 2024, an increase of 2% from 2023.
We continue to expect that oil and gas demand will grow over the next several years, despite the actions taken by central banks in an attempt to control inflation by increasing interest rates and the resulting concern about a potential economic slowdown. We believe the demand will be driven by economic expansion, energy security concerns, relaxed COVID restrictions in China, and population growth. We believe many years of increased investment in existing and new sources of production is the only solution to increase supply and that production will be needed from conventional and unconventional, deep-water and shallow-water, and short and long-cycle projects.
Internationally, we expect exploration and production activity to grow 17-19% during 2023 compared to 2022, with most new activity coming from the Middle East, Asia and Latin America, both onshore and offshore. In North America, we expect strong activity and anticipate customer spending to increase by at least 15% during 2023 as compared to 2022.
HAL Q1 2023 FORM 10-Q | 18
| Table of Contents | Part I. Item 2 | Results of Operations in 2023 Compared to 2022 (QTD) |
RESULTS OF OPERATIONS IN 2023 COMPARED TO 2022
Three Months Ended March 31, 2023 Compared with Three Months Ended March 31, 2022
| Three Months Ended March 31 | Favorable | Percentage | |||||||||||||||
| Millions of dollars | 2023 | 2022 | (Unfavorable) | Change | |||||||||||||
| Revenue: | |||||||||||||||||
| By operating segment: | |||||||||||||||||
| Completion and Production | $ | 3,409 | $ | 2,353 | $ | 1,056 | 45 | % | |||||||||
| Drilling and Evaluation | 2,268 | 1,931 | 337 | 17 | |||||||||||||
| Total revenue | $ | 5,677 | $ | 4,284 | $ | 1,393 | 33 | % | |||||||||
| By geographic region: | |||||||||||||||||
| North America | $ | 2,765 | $ | 1,925 | $ | 840 | 44 | % | |||||||||
| Latin America | 915 | 653 | 262 | 40 | |||||||||||||
| Europe/Africa/CIS | 662 | 677 | (15) | (2) | |||||||||||||
| Middle East/Asia | 1,335 | 1,029 | 306 | 30 | |||||||||||||
| Total revenue | $ | 5,677 | $ | 4,284 | $ | 1,393 | 33 | % | |||||||||
| Operating income: | |||||||||||||||||
| By operating segment: | |||||||||||||||||
| Completion and Production | $ | 666 | $ | 296 | $ | 370 | 125 | % | |||||||||
| Drilling and Evaluation | 369 | 294 | 75 | 26 | |||||||||||||
| Total operations | 1,035 | 590 | 445 | 75 | |||||||||||||
| Corporate and other | (58) | (57) | (1) | (2) | % | ||||||||||||
| Impairments and other charges | — | (22) | 22 | n/m | |||||||||||||
| Total operating income | $ | 977 | $ | 511 | $ | 466 | 91 | % | |||||||||
| n/m = not meaningful |
Operating Segments
Completion and Production
Completion and Production revenue in the first quarter of 2023 was $3.4 billion, an increase of $1.1 billion, or 45%, when compared to the first quarter of 2022. Operating income in the first quarter of 2023 was $666 million, an increase of $370 million, or 125%, when compared to the first quarter of 2022. These results were driven by increased pressure pumping services in North America land, higher completion tool sales in the Middle East, the U.S. Gulf of Mexico, and Brazil, and higher artificial lift activity in North America land and Kuwait. This improvement was partially offset by lower completion tool sales in Norway.
Drilling and Evaluation
Drilling and Evaluation revenue in the first quarter of 2023 was $2.3 billion, an increase of $337 million, or 17%, when compared to the first quarter of 2022. Operating income in the first quarter of 2023 was $369 million, an increase of $75 million, or 26%, when compared to the first quarter of 2022. These results were due to an increase in drilling-related services in the Western Hemisphere and the Middle East/Asia region, higher wireline activity globally, higher project management activity in Mexico and the Middle East, along with higher testing services in the Western Hemisphere and Saudi Arabia. Partially offsetting these increases was lower software sales in Mexico.
Both segments' results were negatively impacted in the first quarter of 2023 when compared to the first quarter of 2022, as a result of the sale of our Russian operations during the third quarter of 2022.
HAL Q1 2023 FORM 10-Q | 19
| Table of Contents | Part I. Item 2 | Results of Operations in 2023 Compared to 2022 (QTD) |
Geographic Regions
North America
North America revenue in the first quarter of 2023 was $2.8 billion, a 44% increase compared to the first quarter of 2022. This increase was primarily driven by improved stimulation activity and pricing gains, in addition to higher well construction services, artificial lift activity, and wireline activity in North America land and the U.S. Gulf of Mexico, and increased completion tool sales in the U.S. Gulf of Mexico.
Latin America
Latin America revenue in the first quarter of 2023 was $915 million, a 40% increase compared to the first quarter of 2022, due to increased well construction services, stimulation activity, and testing services in Mexico and Argentina, along with improved project management activity in Mexico, higher completion tool sales in Brazil, and increased wireline activity across the region. Partially offsetting this increase was lower software sales in Mexico.
Europe/Africa/CIS
Europe/Africa/CIS revenue in the first quarter of 2023 was $662 million, a 2% decrease compared to the first quarter of 2022. This decline was primarily driven by the sale of our Russian operations during the third quarter of 2022, in addition to lower completion tool sales and well construction services in Norway. This decrease was partially offset by improved well construction services and stimulation activity throughout Africa, and increased activity in multiple product service lines in Senegal.
Middle East/Asia
Middle East/Asia revenue in the first quarter of 2023 was $1.3 billion, a 30% increase compared to the first quarter of 2022, resulting from improved activity across multiple product service lines in Saudi Arabia, improved well construction services across the region, higher project management activity in Iraq and Kuwait, and higher completion tool sales in Qatar and Asia.
Nonoperating Items
Loss on early extinguishment of debt. During the three months ended March 31, 2022, we recorded a $42 million loss on the early redemption of $600 million aggregate principal amount of our 3.8% senior notes, which included premiums and unamortized expenses.
Effective tax rate. During the three months ended March 31, 2023, we recorded a total income tax provision of $174 million on a pre-tax income of $829 million, resulting in an effective tax rate of 21.0% for the quarter. During the three months ended March 31, 2022, we recorded a total income tax provision of $68 million on a pre-tax income of $332 million, resulting in an effective tax rate of 20.5% for the quarter.
HAL Q1 2023 FORM 10-Q | 20
| Table of Contents | Part I. Item 2 | Forward-Looking Information |
FORWARD-LOOKING INFORMATION
The Private Securities Litigation Reform Act of 1995 provides safe harbor provisions for forward-looking information. Forward-looking information is based on projections and estimates, not historical information. Some statements in this Form 10-Q are forward-looking and use words like “may,” “may not,” “believe,” “do not believe,” “plan,” “estimate,” “intend,” “expect,” “do not expect,” “anticipate,” “do not anticipate,” “should,” “likely,” and other expressions. We may also provide oral or written forward-looking information in our statements and other materials we release to the public. Forward-looking information involves risk and uncertainties and reflects our best judgment based on current information. Our results of operations can be affected by inaccurate assumptions we make or by known or unknown risks and uncertainties. In addition, other factors may affect the accuracy of our forward-looking information. As a result, no forward-looking information can be guaranteed. Actual events and the results of our operations may vary materially.
We do not assume any responsibility to publicly update any of our forward-looking statements regardless of whether factors change as a result of new information, future events, or for any other reason. You should review any additional disclosures we make in our press releases and Forms 10-K, 10-Q, and 8-K filed with or furnished to the SEC. We also suggest that you listen to our quarterly earnings release conference calls with financial analysts.
Previous: Item 1. Financial Statements · Next: Item 3. Quantitative and Qualitative Disclosures About Market Risk