 filings.tools
Item 7. Management’s Discussion and Analysis of Financial Condition and Results of Operations.
38K characters. Original on sec.gov · Markdown
Item 7. Management’s Discussion and Analysis of Financial Condition and Results of Operations.
Our MD&A includes the following sections:
| • | Executive Summary |
| • | Results of Operations and Non-GAAP Measures |
| • | Liquidity and Capital Resources |
| • | Critical Accounting Policies |
Executive Summary
Highlights of our annual financial performance follow.
| dollars in millions, except per share data | Fiscal | Fiscal | Fiscal | ||||||||
| 2018 | 2017 | 2016 | |||||||||
| Net sales | $ | 108,203 | $ | 100,904 | $ | 94,595 | |||||
| Net earnings | 11,121 | 8,630 | 7,957 | ||||||||
| Effective tax rate | 23.6 | % | 37.0 | % | 36.3 | % | |||||
| Diluted earnings per share | $ | 9.73 | $ | 7.29 | $ | 6.45 | |||||
| Net cash provided by operating activities | $ | 13,038 | $ | 12,031 | $ | 9,783 | |||||
| Proceeds from long-term debt, net of discounts | 3,466 | 2,991 | 4,959 | ||||||||
| Repayments of long-term debt | 1,209 | 543 | 3,045 | ||||||||
| Repurchases of common stock | 9,963 | 8,000 | 6,880 |
—————
Note: Fiscal 2018 includes 53 weeks. Fiscal 2017 and fiscal 2016 include 52 weeks.
We reported net sales of $108.2 billion in fiscal 2018. Net earnings were $11.1 billion, or $9.73 per diluted share. The 53rd week in fiscal 2018 added $1.7 billion of net sales and $241 million of net earnings and increased diluted earnings per share by $0.21. Our effective tax rate was 23.6% for fiscal 2018 and lower than fiscal 2017 and fiscal 2016 primarily due to enactment of the Tax Act.
We opened two new stores in Mexico and one new store in the U.S. during fiscal 2018, for a total store count of 2,287 at February 3, 2019. At the end of fiscal 2018, a total of 306 of our stores, or 13.4%, were located in Canada and Mexico. Total sales per square foot were $446.86 in fiscal 2018, and our inventory turnover ratio was 5.1 times at the end of fiscal 2018.
We generated $13.0 billion of cash flow from operations during fiscal 2018 and issued $3.5 billion of long-term debt in fiscal 2018. This cash flow, along with cash on hand, was used to fund cash payments of $10.0 billion for share repurchases, pay $4.7 billion of dividends, fund $2.4 billion in capital expenditures, repay $1.2 billion of senior notes that matured in September 2018, and repay $220 million of net short-term borrowings.
During fiscal 2018, we repurchased $10.0 billion of our common stock through ASR agreements and open market transactions. In February 2019, our Board of Directors authorized a $15.0 billion share repurchase program that replaced the December 2017 authorization, and we announced a 32% increase in our quarterly cash dividend to $1.36 per share.
Our ROIC was 44.8% for fiscal 2018. See the "Non-GAAP Financial Measures" section below for our definition and calculation of ROIC, as well as a reconciliation of NOPAT, a non-GAAP financial measure, to net earnings (the most comparable GAAP financial measure).
Results of Operations and Non-GAAP Measures
The tables and discussion below should be read in conjunction with our consolidated financial statements and related notes included in this report. We believe the percentage relationship between net sales and major categories in our consolidated statements of earnings, as well as the percentage change in the associated dollar amounts, are relevant to an evaluation of our business.
| Fiscal | Fiscal | Fiscal | ||||||||||||||||||
| 2018 | 2017 | 2016 | ||||||||||||||||||
| dollars in millions | $ | % of Net Sales | $ | % of Net Sales | $ | % of Net Sales | ||||||||||||||
| Net sales | $ | 108,203 | $ | 100,904 | $ | 94,595 | ||||||||||||||
| Gross profit | 37,160 | 34.3 | % | 34,356 | 34.0 | % | 32,313 | 34.2 | % | |||||||||||
| Operating expenses: | ||||||||||||||||||||
| Selling, general and administrative | 19,513 | 18.0 | 17,864 | 17.7 | 17,132 | 18.1 | ||||||||||||||
| Depreciation and amortization | 1,870 | 1.7 | 1,811 | 1.8 | 1,754 | 1.9 | ||||||||||||||
| Impairment loss | 247 | 0.2 | — | — | — | — | ||||||||||||||
| Total operating expenses | 21,630 | 20.0 | 19,675 | 19.5 | 18,886 | 20.0 | ||||||||||||||
| Operating income | 15,530 | 14.4 | 14,681 | 14.5 | 13,427 | 14.2 | ||||||||||||||
| Interest and other (income) expense: | ||||||||||||||||||||
| Interest and investment income | (93 | ) | (0.1 | ) | (74 | ) | (0.1 | ) | (36 | ) | — | |||||||||
| Interest expense | 1,051 | 1.0 | 1,057 | 1.0 | 972 | 1.0 | ||||||||||||||
| Other | 16 | — | — | — | — | — | ||||||||||||||
| Interest and other, net | 974 | 0.9 | 983 | 1.0 | 936 | 1.0 | ||||||||||||||
| Earnings before provision for income taxes | 14,556 | 13.5 | 13,698 | 13.6 | 12,491 | 13.2 | ||||||||||||||
| Provision for income taxes | 3,435 | 3.2 | 5,068 | 5.0 | 4,534 | 4.8 | ||||||||||||||
| Net earnings | $ | 11,121 | 10.3 | % | $ | 8,630 | 8.6 | % | $ | 7,957 | 8.4 | % |
—————
Note: Fiscal 2018 includes 53 weeks. Fiscal 2017 and fiscal 2016 include 52 weeks. Certain percentages may not sum to totals due to rounding.
| % Change | |||||||||||||||||
| Selected financial and sales data: | Fiscal | Fiscal | Fiscal | Fiscal | Fiscal | ||||||||||||
| 2018 | 2017 | 2016 | 2018 vs. 2017 | 2017 vs. 2016 | |||||||||||||
| Comparable sales increase (1) (2) | 5.2 | % | 6.8 | % | 5.6 | % | N/A | N/A | |||||||||
| Comparable customer transactions increase (2) (3) | 1.0 | % | 2.2 | % | 2.8 | % | N/A | N/A | |||||||||
| Comparable average ticket increase (2) (3) | 4.2 | % | 4.5 | % | 2.7 | % | N/A | N/A | |||||||||
| Customer transactions (in millions) (3) (4) | 1,620.8 | 1,578.6 | 1,544.0 | 2.7 | % | 2.2 | % | ||||||||||
| Average ticket (3) (4) | $ | 65.74 | $ | 63.06 | $ | 60.35 | 4.2 | % | 4.5 | % | |||||||
| Sales per square foot (3) (4) | $ | 446.86 | $ | 417.02 | $ | 390.78 | 7.2 | % | 6.7 | % | |||||||
| Diluted earnings per share | $ | 9.73 | $ | 7.29 | $ | 6.45 | 33.5 | % | 13.0 | % |
—————
| (1) | The calculations for fiscal 2017 and fiscal 2016 do not include results for Interline, which was acquired in fiscal 2015. |
| (2) | The calculations do not include results from the 53rd week of fiscal 2018. |
| (3) | The calculations do not include results for Interline. |
| (4) | The 53rd week of fiscal 2018 increased customer transactions by 24.5 million, added $0.01 to average ticket, and increased sales per square foot by $6.87. |
Fiscal 2018 Compared to Fiscal 2017
Sales. We assess our sales performance by evaluating both net sales and comparable sales.
Net Sales. Fiscal 2018 consisted of 53 weeks compared to 52 weeks in fiscal 2017. Net sales for fiscal 2018 increased $7.3 billion, or 7.2%, to $108.2 billion. The increase in net sales in fiscal 2018 primarily reflected the impact of positive comparable sales driven by average ticket growth and increased customer transactions as well as $1.7 billion of net sales attributable to the additional week in fiscal 2018. Online sales, which consist of sales generated online through our websites for products picked up in our stores or delivered to customer locations, represented 7.9% of net sales and grew 26.2% during fiscal 2018. The adoption of ASU No. 2014-09 benefited net sales by $216 million in fiscal 2018, while the effect of foreign currency had a negligible impact on net sales. See Note 1 to our consolidated financial statements for more information on ASU No. 2014-09 and the implementation of this new standard for revenue recognition.
Comparable Sales. Comparable sales is a measure that highlights the performance of our existing locations and websites by measuring the change in net sales for a period over the comparable prior-period of equivalent length. Comparable sales includes sales at all locations, physical and online, open greater than 52 weeks (including remodels and relocations) and excluding closed stores. Retail stores become comparable on the Monday following their 365th day of operation. Acquisitions, digital or otherwise, are included in comparable sales after we own them for more than 52 weeks (with the exception of Interline which is excluded from comparable sales for periods prior to fiscal 2018). Net sales for the 53rd week in a fiscal year are not included in the comparable sales calculation for that fiscal year. For example, our comparable sales results for fiscal 2018 compare weeks 1 through 52 in fiscal 2018 to the 52-week period reported for fiscal 2017. Comparable sales is intended only as supplemental information and is not a substitute for net sales presented in accordance with GAAP.
Total comparable sales increased 5.2% in fiscal 2018. The increase in comparable sales reflected a number of factors, including the execution of our strategic efforts to drive an enhanced interconnected experience in both the physical and digital worlds. All of our merchandising departments posted positive comparable sales in fiscal 2018 except for Lighting, which was negative primarily due to LED price deflation. For fiscal 2018, comparable sales for our Appliances, Tools, Electrical, Décor, Plumbing, Lumber, and Indoor Garden merchandising departments were above the Company average. Our comparable average ticket increased 4.2% in fiscal 2018 while comparable customer transactions increased 1.0% during fiscal 2018. The increase in comparable average ticket was due in large part to strong sales in big ticket purchases in certain categories, such as appliances and vinyl plank flooring.
Gross Profit. Gross profit increased $2.8 billion, or 8.2%, to $37.2 billion in fiscal 2018. Gross profit as a percent of net sales, or gross profit margin, was 34.3% in fiscal 2018 compared to 34.0% in fiscal 2017. The increase in gross profit margin for fiscal 2018 was primarily driven by a $598 million benefit from the adoption of ASU No. 2014-09 and a benefit from mix of products sold, partially offset by higher transportation and fuel costs in our supply chain and shrink. The additional week in fiscal 2018 contributed $615 million to gross profit.
Operating Expenses. Our operating expenses are composed of SG&A, depreciation and amortization, and impairment loss.
Selling, General & Administrative. SG&A increased $1.6 billion, or 9.2%, to $19.5 billion in fiscal 2018. As a percent of net sales, SG&A was 18.0% for fiscal 2018 compared to 17.7% for fiscal 2017. The increase in SG&A as a percent of net sales for fiscal 2018 reflected an increase of $598 million from the adoption of ASU No. 2014-09 and $544 million of incremental investments made in the business, partially offset by expense leverage resulting from the positive sales environment and continued expense control. The additional week in fiscal 2018 contributed $301 million to SG&A.
Depreciation and Amortization. Depreciation and amortization increased $59 million, or 3.3%, in fiscal 2018. As a percent of net sales, depreciation and amortization was 1.7% for fiscal 2018 compared to 1.8% in fiscal 2017. The decrease in depreciation and amortization as a percent of net sales reflected expense leverage resulting from the positive sales environment and the timing of asset additions, partially offset by $136 million of incremental depreciation stemming from investments in the business. The additional week in fiscal 2018 did not result in incremental expense because we recognize depreciation and amortization expense on a monthly basis.
Impairment Loss. We recognized a $247 million impairment loss in fiscal 2018 related to certain trade names associated with Interline. See Note 1 to our consolidated financial statements for more information.
Interest and Other, net. Interest and other, net, was $974 million for fiscal 2018 compared to $983 million for fiscal 2017. Interest and other, net, as a percent of net sales decreased to 0.9% in fiscal 2018 from 1.0% in fiscal 2017, primarily reflecting sales leverage resulting from the positive sales environment, decreased tax reserves
due to certain positive audit settlements, and higher interest income, partially offset by higher interest expense on long-term debt balances in fiscal 2018 and a loss on the sale of a non-strategic asset.
Provision for Income Taxes. Our combined effective income tax rate was 23.6% for fiscal 2018 compared to 37.0% for fiscal 2017. The decrease in the provision for income taxes in fiscal 2018 primarily reflected the enactment of the Tax Act and adjustments to the provisional tax charge recorded in the fourth quarter of fiscal 2017 as well as certain positive audit settlements. See Note 5 to our consolidated financial statements for further discussion.
Diluted Earnings per Share. Diluted earnings per share were $9.73 for fiscal 2018 compared to $7.29 for fiscal 2017. Diluted earnings per share for fiscal 2018 reflected a benefit of $1.48 per share resulting from the enactment of the Tax Act, a benefit of $0.21 per share for the 53rd week, and a decrease of $0.16 per share due to the impairment loss.
Diluted earnings per share for fiscal 2017 included a benefit of $0.09 per share as a result of the adoption of ASU No. 2016-09, which requires that we recognize tax benefits or deficiencies related to share-based payment awards in the provision for income taxes. Diluted earnings per share for fiscal 2017 also reflected decreases of $0.11 per share due to the net tax charge recorded in connection with the enactment of the Tax Act and $0.06 per share due to the one-time bonus payment to hourly associates made as a result of the Tax Act.
Fiscal 2017 Compared to Fiscal 2016
Sales.
Net Sales. Net sales for fiscal 2017 increased $6.3 billion, or 6.7%, to $100.9 billion. The increase in net sales in fiscal 2017 primarily reflected the impact of positive comparable sales driven by increased customer transactions and average ticket growth. Hurricane-related sales contributed approximately $662 million to net sales in the second half of fiscal 2017.
Comparable Sales. Total comparable sales increased 6.8% in fiscal 2017. The increase in comparable sales reflected a number of factors, including the execution of our strategy and broad-based growth across our stores and online. Online sales, which consist of sales generated online through our websites for products picked up in our stores or delivered to customer locations, represented 6.7% of net sales and grew 21.5% during fiscal 2017. All of our merchandising departments posted positive comparable sales except for one, which was flat in fiscal 2017. Comparable sales for our Lumber, Electrical, Tools, Appliances, Flooring, Building Materials, and Indoor Garden merchandising departments were above the Company average during fiscal 2017. Our comparable customer transactions increased 2.2% during fiscal 2017. Further, our comparable average ticket increased 4.5% in fiscal 2017, due in part to strong sales in big ticket purchases in certain merchandising departments, such as Appliances and Flooring.
Gross Profit. Gross profit increased $2.0 billion, or 6.3%, to $34.4 billion in fiscal 2017. Gross profit as a percent of net sales, or gross profit margin, was 34.0% in fiscal 2017 compared to 34.2% in fiscal 2016. The modest decline in gross profit margin for fiscal 2017 reflected the impact of lower margin hurricane-related sales and higher shrink, partially offset by benefits from our supply chain.
Operating Expenses.
Selling, General & Administrative. SG&A increased $732 million, or 4.3%, to $17.9 billion in fiscal 2017 and included approximately $170 million of hurricane-related expenses. As a percent of net sales, SG&A was 17.7% for fiscal 2017 compared to 18.1% for fiscal 2016. The decrease in SG&A as a percent of net sales for fiscal 2017 reflected expense leverage resulting from the positive sales environment and continued expense control.
Depreciation and Amortization. Depreciation and amortization increased $57 million, or 3.2%, in fiscal 2017. The decrease in depreciation and amortization as a percent of net sales to 1.8% in fiscal 2017 from 1.9% in fiscal 2016 reflected expense leverage resulting from the positive sales environment.
Interest and Other, net. Interest and other, net, was $983 million for fiscal 2017 compared to $936 million for fiscal 2016. Interest and other, net, as a percent of net sales was 1.0% for both fiscal 2017 and fiscal 2016 and reflected additional interest expense in fiscal 2017 resulting from higher long-term debt balances in fiscal 2017, offset by higher interest income in fiscal 2017 compared to fiscal 2016.
Provision for Income Taxes. Our combined effective income tax rate was 37.0% for fiscal 2017 compared to 36.3% for fiscal 2016. The effective income tax rate for fiscal 2017 reflected a net $127 million charge resulting from
the enactment of the Tax Act. The effective income tax rate for fiscal 2017 also reflected a $106 million benefit to our provision for income taxes for share-based payment awards as a result of our adoption of ASU No. 2016-09.
Diluted Earnings per Share. Diluted earnings per share were $7.29 for fiscal 2017 compared to $6.45 for fiscal 2016. Diluted earnings per share for fiscal 2017 included a benefit of $0.09 per share as a result of the adoption of ASU No. 2016-09, as well as decreases of $0.11 per share due to the net tax charge recorded in connection with the enactment of the Tax Act and $0.06 per share due to the one-time bonus payment to hourly associates made as a result of the Tax Act.
Non-GAAP Financial Measures
To provide clarity, internally and externally, about our operating performance, we supplement our reporting with certain non-GAAP financial measures. However, this supplemental information should not be considered in isolation or as a substitute for the related GAAP measures. Non-GAAP financial measures presented herein may differ from similar measures used by other companies.
Return on Invested Capital. We believe ROIC is meaningful for investors and management because it measures how effectively we deploy our capital base. We define ROIC as NOPAT, a non-GAAP financial measure, for the most recent twelve-month period, divided by average debt and equity. We define average debt and equity as the average of beginning and ending long-term debt (including current installments) and equity for the most recent twelve-month period.
The calculation of ROIC, together with a reconciliation of NOPAT to net earnings (the most comparable GAAP measure), follows.
| Fiscal | Fiscal | Fiscal | |||||||||
| dollars in millions | 2018 | 2017 | 2016 | ||||||||
| Net earnings | $ | 11,121 | $ | 8,630 | $ | 7,957 | |||||
| Interest and other, net | 974 | 983 | 936 | ||||||||
| Provision for income taxes | 3,435 | 5,068 | 4,534 | ||||||||
| Operating income | 15,530 | 14,681 | 13,427 | ||||||||
| Income tax adjustment (1) | (3,665 | ) | (5,432 | ) | (4,874 | ) | |||||
| NOPAT | $ | 11,865 | $ | 9,249 | $ | 8,553 | |||||
| Average debt and equity (2) | $ | 26,492 | $ | 27,074 | $ | 27,203 | |||||
| ROIC | 44.8 | % | 34.2 | % | 31.4 | % |
—————
Note: Fiscal 2018 includes 53 weeks. Fiscal 2017 and fiscal 2016 include 52 weeks.
| (1) | Income tax adjustment is defined as operating income multiplied by our effective tax rate for the trailing twelve months. |
| (2) | The beginning balance of equity for fiscal 2018 has been adjusted to reflect an opening balance sheet adjustment of $75 million due to the adoption of ASU No. 2014-09, Revenue from Contracts with Customers, in fiscal 2018. |
Liquidity and Capital Resources
Cash and Cash Equivalents at End of Year
At February 3, 2019, we had $1.8 billion in cash and cash equivalents, of which $1.4 billion was held by our foreign subsidiaries. We believe that our current cash position, access to the long-term debt capital markets, funds available from our commercial paper programs, and cash flow generated from operations should be sufficient not only for our operating requirements but also to enable us to complete our capital expenditure programs and fund dividend payments, share repurchases, and any required long-term debt payments through the next several fiscal years. In addition, we have the ability to obtain alternative sources of financing.
As we accelerate our investments in the business, we expect capital expenditures of approximately $2.7 billion in fiscal 2019.
Debt and Derivatives
We have commercial paper programs with an aggregate borrowing capacity of $3.0 billion. All of our short-term borrowings in fiscal 2018 and fiscal 2017 were under these commercial paper programs. In connection with these
programs, we have back-up credit facilities with a consortium of banks for borrowings up to $3.0 billion, which consist of a five-year $2.0 billion credit facility and a 364-day $1.0 billion credit facility. In December 2018, we completed the renewal of our 364-day $1.0 billion credit facility, extending the maturity from December 2018 to December 2019. In December 2017, we replaced our five-year $2.0 billion credit facility that was scheduled to expire in December 2019, with a new, substantially identical five-year $2.0 billion credit facility that expires in December 2022. At February 3, 2019, we were in compliance with all of the covenants contained in the credit facilities, none of which are expected to impact our liquidity or capital resources. At February 3, 2019, there were $1.3 billion of borrowings outstanding under these commercial paper programs compared to $1.6 billion at January 28, 2018.
We also issue senior notes from time to time and use derivative financial instruments in the management of our exposure to fluctuations in foreign currencies and interest rates on certain long-term debt. See Note 4 and Note 7 to our consolidated financial statements for further discussion of our debt and derivative agreements.
Leases
We use capital and operating leases to finance a portion of our real estate, including our stores, distribution centers, and store support centers. See Note 3 and Note 4 to our consolidated financial statements for further discussion of our capital and operating leases.
Share Repurchases
In fiscal 2018, we repurchased $10.0 billion of our common stock through open market transactions and ASR agreements. In December 2017, our Board of Directors authorized a $15.0 billion share repurchase program, of which approximately $2.9 billion remained at the end of fiscal 2018. In February 2019, our Board of Directors authorized a new $15.0 billion share repurchase program that replaced the previous authorization. See Note 6 to our consolidated financial statements for further discussion of our share repurchases.
Cash Flows Summary
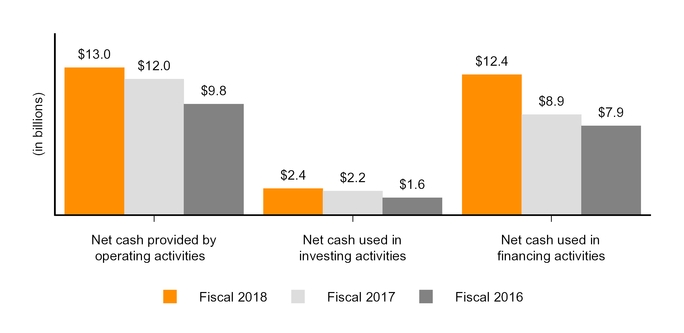
Operating Activities. Cash flow generated from operations provides us with a significant source of liquidity. Our operating cash flows result primarily from cash received from our customers, offset by cash payments we make for products and services, employee compensation, operations and occupancy costs. Cash provided by or used in operating activities is also subject to changes in working capital. Working capital at any specific point in time is subject to many variables, including seasonality, inventory management and category expansion, the timing of cash receipts and payments, vendor payment terms, and fluctuations in foreign exchange rates.
Net cash provided by operating activities increased $1.0 billion in fiscal 2018 and increased $2.2 billion in fiscal 2017. The increase in fiscal 2018 primarily reflected an increase in net earnings, partially offset by net cash outflows associated with changes in working capital. The increase in net earnings during fiscal 2018 was primarily due to a lower effective income tax rate in fiscal 2018 resulting from the enactment of the Tax Act and higher comparable
sales. The increase in fiscal 2017 primarily reflected an increase in net earnings and net cash inflows associated with changes in working capital. The increase in earnings in fiscal 2017 resulted from higher comparable sales and expense leverage.
Investing Activities. Cash used in investing activities primarily reflected:
| • | $2.4 billion of capital expenditures for investments in our business in fiscal 2018; |
| • | $1.9 billion of capital expenditures for investments in our business and $374 million cash paid in connection with the acquisitions of Compact Power Equipment, Inc. and The Company Store in fiscal 2017; and |
| • | $1.6 billion of capital expenditures for investments in our business in fiscal 2016. |
Financing Activities. Cash used in financing activities primarily reflected:
| • | $10.0 billion of share repurchases and $4.7 billion of cash dividends paid, partially offset by $2.0 billion of net proceeds from short- and long-term debt in fiscal 2018; |
| • | $8.0 billion of share repurchases and $4.2 billion of cash dividends paid, partially offset by $3.3 billion of net proceeds from short- and long-term debt in fiscal 2017; and |
| • | $6.9 billion of share repurchases and $3.4 billion of cash dividends paid, partially offset by $2.3 billion of net proceeds from short- and long-term debt in fiscal 2016. |
Contractual Obligations
Our significant contractual obligations at February 3, 2019 were as follows:
| Payments Due by Period | |||||||||||||||||||
| in millions | Total | Less than 1 Year | 1 to 3 Years | 3 to 5 Years | More Than 5 Years | ||||||||||||||
| Short-term debt | $ | 1,339 | $ | 1,339 | $ | — | $ | — | $ | — | |||||||||
| Long-term debt – principal payments (1) | 27,100 | 1,000 | 4,100 | 3,250 | 18,750 | ||||||||||||||
| Long-term debt – interest payments (2) | 16,768 | 1,022 | 1,913 | 1,664 | 12,169 | ||||||||||||||
| Capital lease obligations (3) | 1,709 | 150 | 310 | 279 | 970 | ||||||||||||||
| Operating lease obligations | 7,036 | 976 | 1,704 | 1,266 | 3,090 | ||||||||||||||
| Purchase obligations (4) | 1,601 | 1,080 | 302 | 182 | 37 | ||||||||||||||
| Unrecognized tax benefits (5) | 65 | 65 | — | — | — | ||||||||||||||
| Total | $ | 55,618 | $ | 5,632 | $ | 8,329 | $ | 6,641 | $ | 35,016 |
—————
| (1) | Excludes capital lease obligations. |
| (2) | Interest payments are calculated at current interest rates, including the impact of active interest rate swaps. |
| (3) | Includes $660 million of imputed interest. |
| (4) | Purchase obligations include all legally binding contracts such as firm commitments for inventory purchases, utility purchases, capital expenditures, software acquisitions and license commitments, and legally binding service contracts. Purchase orders that are not binding agreements are excluded from the table above. |
| (5) | Excludes $429 million of noncurrent unrecognized tax benefits due to uncertainty regarding the timing of future cash tax payments. |
Off-Balance Sheet Arrangements
Other than operating leases for a portion of our real estate and other assets, we have no off-balance sheet arrangements.
Critical Accounting Policies
Our significant accounting policies are disclosed in Note 1 to our consolidated financial statements. The following discussion addresses our most critical accounting policies, which are those that are both important to the portrayal of our financial condition and results of operations, and that require significant judgment or use of significant assumptions or complex estimates.
Merchandise Inventories
We value the substantial majority of our inventory under the retail inventory method, using the first-in, first-out method, with the remainder of our inventories valued under a cost method. Under the retail inventory method,
inventories are stated at cost, which is determined by applying a cost-to-retail ratio to the retail value of inventories. The retail value of our inventory is adjusted as needed to reflect current market conditions. Because these adjustments are based on current prevailing market conditions, the value of our inventory approximates the lower of cost or market.
As the valuation under the retail inventory method is based on estimates such as markups, markdowns, and inventory losses (or shrink), there exists an inherent uncertainty in the final determination of inventory cost and gross profit. We do not believe there is a reasonable likelihood for a material change in the estimates or assumptions we use to value our inventory under the retail inventory method. We believe that the retail inventory method provides an inventory valuation which approximates cost and results in valuing our inventory at the lower of cost or market.
Impairment of Long-Lived Assets
We evaluate our long-lived assets each quarter for indicators of potential impairment. Indicators of impairment include current period losses combined with a history of losses, our decision to relocate or close a store or other location before the end of its previously estimated useful life, or when changes in other circumstances indicate the carrying amount of an asset may not be recoverable. The evaluation for long-lived assets is performed at the lowest level of identifiable cash flows, which is generally the individual store level. The assets of a store with indicators of impairment are evaluated for recoverability by comparing its undiscounted future cash flows with its carrying value. Our cash flow projections look several years into the future and include assumptions on variables such as future sales and operating margin growth rates, economic conditions, market competition, and inflation.
If the carrying value is greater than the undiscounted future cash flows, we then measure the asset’s fair value to determine whether an impairment loss should be recognized. If the resulting fair value is less than the carrying value, an impairment loss is recognized. We generally base our estimates of fair market value on market appraisals of owned locations and estimates of the amount of potential sublease income and the time required to sublease for leased locations. Impairments and lease obligation costs on closings and relocations were not material to our consolidated financial statements in fiscal 2018.
Self-Insurance
We have established liabilities for certain losses related to general liability (including product liability), workers’ compensation, employee group medical, and automobile claims for which we are self-insured. Our self-insured retention or deductible, as applicable, for each claim involving general liability, workers’ compensation, and automobile liability is limited to $25 million, $1 million, and $1 million, respectively. We have no stop loss limits for self-insured employee group medical claims. Our liabilities represent estimates of the ultimate cost for claims incurred at the balance sheet date. The estimated liabilities are not discounted and are established based upon analysis of historical data and actuarial estimates. The liabilities are reviewed by management and third-party actuaries on a regular basis to ensure that they are appropriate. While we believe these estimates are reasonable based on the information currently available, if actual trends, including the severity or frequency of claims, medical cost inflation or fluctuations in premiums, differ from our estimates, our results of operations could be impacted. Actual results related to these types of claims did not vary materially from estimated amounts for fiscal 2018, fiscal 2017 or fiscal 2016.
Revenues
We recognize revenue, net of estimated returns and sales tax, at the time the customer takes possession of merchandise or when a service is performed. We estimate the liability for sales returns, including the estimated gross profit impact, based on our historical return levels and believe that our estimate for sales returns is a reasonable reflection of future returns. In connection with the adoption of ASU No. 2014-09, we also recognize a return asset, and corresponding adjustment to cost of sales, for our right to recover the goods returned by the customer, measured at the former carrying amount of the goods, less any expected recovery cost. At each financial reporting date, we assess our estimates of expected returns, refund liabilities, and return assets.
We defer revenue and the related gross profit for payments received from customers for which the customer has not yet taken possession of merchandise or we have not yet performed the service for the customer. This amount is recorded as deferred revenue. We estimate the gross profit related to deferred revenue using historical rates, which we believe to be a reasonable reflection of future rates. If these estimates significantly differ from actual amounts, our net sales and gross profit could be impacted.
Vendor Allowances
Vendor allowances primarily consist of volume rebates that are earned as a result of attaining certain purchase levels and co-op advertising allowances for the promotion of vendors’ products that are typically based on guaranteed minimum amounts with additional amounts being earned for attaining certain purchase levels. These vendor allowances are accrued as earned, with those allowances received as a result of attaining certain purchase levels accrued over the incentive period based on estimates of purchases. We believe that our estimate of vendor allowances earned based on expected volume of purchases over the incentive period is an accurate reflection of the ultimate allowance to be received from our vendors.
Volume rebates and certain co-op advertising allowances earned are initially recorded as a reduction in merchandise inventories and a subsequent reduction in cost of sales when the related product is sold. Certain co-op advertising allowances that are reimbursements of specific, incremental and identifiable costs incurred to promote vendors’ products are recorded as an offset against advertising expense in SG&A.
Additional Information
For information on accounting pronouncements that have impacted or are expected to materially impact our financial condition, results of operations, or cash flows, see Note 1 to our consolidated financial statements.
Previous: Item 6. Selected Financial Data. · Next: Item 7A. Quantitative and Qualitative Disclosures About Market Risk.