 filings.tools
Item 7. Management’s Discussion and Analysis of Financial Condition and Results of Operations.
42K characters. Original on sec.gov · Markdown
Item 7. Management’s Discussion and Analysis of Financial Condition and Results of Operations.
Our MD&A includes the following sections:
Executive Summary
Highlights of our annual financial performance follow:
| dollars in millions, except per share data | Fiscal | Fiscal | Fiscal | ||||||||||||||
| 2020 | 2019 | 2018 | |||||||||||||||
| Net sales | $ | 132,110 | $ | 110,225 | $ | 108,203 | |||||||||||
| Net earnings | 12,866 | 11,242 | 11,121 | ||||||||||||||
| Diluted earnings per share | $ | 11.94 | $ | 10.25 | $ | 9.73 | |||||||||||
| Net cash provided by operating activities | $ | 18,839 | $ | 13,687 | $ | 13,165 | |||||||||||
| Payments for businesses acquired, net | 7,780 | — | 21 | ||||||||||||||
| Proceeds from long-term debt, net of discounts and premiums | 7,933 | 3,420 | 3,466 | ||||||||||||||
| Repayments of long-term debt | 2,872 | 1,070 | 1,209 | ||||||||||||||
| Repurchases of common stock | 791 | 6,965 | 9,963 |
—————
Note: Fiscal 2020 and fiscal 2019 include 52 weeks. Fiscal 2018 includes 53 weeks.
We reported net sales of $132.1 billion in fiscal 2020. Net earnings were $12.9 billion, or $11.94 per diluted share. We opened two new stores in Mexico and three new stores in the U.S. during fiscal 2020, for a total store count of 2,296 at January 31, 2021. At the end of fiscal 2020, a total of 309 of our stores, or 13.5%, were located in Canada and Mexico. Total sales per retail square foot were $543.74 in fiscal 2020. Our inventory turnover ratio was 5.8 times at the end of fiscal 2020, up from 4.9 times last year, driven by a significant increase in customer demand across core merchandising departments.
We generated $18.8 billion of cash flow from operations and issued $7.9 billion of long-term debt, net of discounts and premiums, during fiscal 2020. These funds, together with cash on hand, were used to acquire HD Supply for net consideration of $7.8 billion, pay $6.5 billion of dividends, repay an aggregate of $2.9 billion of long-term debt, fund $2.5 billion in capital expenditures, repay $974 million of net short-term borrowings, and fund cash payments of $791 million for share repurchases before we suspended share repurchases in March 2020. We resumed share repurchases in the first quarter of fiscal 2021. In February 2021, we announced a 10% increase in our quarterly cash dividend to $1.65 per share.
Our ROIC was 40.8% for fiscal 2020 and 45.4% for fiscal 2019. See the “Non-GAAP Financial Measures” section below for our definition and calculation of ROIC, as well as a reconciliation of NOPAT, a non-GAAP financial measure, to net earnings (the most comparable GAAP financial measure). The decrease in ROIC from fiscal 2019 primarily reflects our decision to temporarily enhance our liquidity position, including the suspension of share repurchases.
In December 2020, we completed the acquisition of HD Supply, a leading national distributor of MRO products in the multifamily and hospitality end markets. We believe the acquisition of HD Supply will help position the Company to accelerate sales growth by better serving both existing and new MRO customers. See Note 12 to our consolidated financial statements for further discussion of the HD Supply acquisition.
COVID-19
The outbreak of the COVID-19 coronavirus, which was declared a pandemic by the World Health Organization in March 2020, has led to adverse impacts on the U.S. and global economies and has impacted and continues to impact our supply chain, operations, and customer demand. Even though the Company has taken measures to adapt to operating in this challenging environment, the pandemic could further affect our operations and the
operations of our suppliers and vendors as a result of additional shut-downs or other governmental orders; restrictions and limitations on travel, logistics and other business activities; potential product and labor shortages; limitations on store or facility operations up to and including closures; and other governmental, business or consumer actions. As circumstances have evolved, our focus has been and continues to be on two key priorities: the safety and well-being of our associates and customers, and providing our customers and communities with the products and services that they need.
As we adapted to operations in a COVID-19 environment during fiscal 2020, we took a number of actions to promote social and physical distancing. At the beginning of the pandemic, we implemented a change to store operating hours, and we took measures to limit the number of customers in stores, which included canceling or modifying certain annual merchandising events and rolling out curbside pickup at our stores. We also shifted store support operations to remote or virtual. As we have continued to adapt and refine our approach, we have adjusted our response to better manage growing demand in the stores, including adopting a more localized approach on customer limits and expanding store hours while still focusing on promoting a safe shopping environment. In addition, masks or facial coverings are required for all associates and customers in our U.S. stores and other facilities.
The impact of COVID-19 and the actions we have taken in response to it had varying effects on our results of operations throughout fiscal 2020. Overall, we saw a significant acceleration in sales with strong performance across our departments as customers have focused on home improvement projects and repairs. As our customers continued to seek alternative methods for obtaining the products they needed, online sales grew by approximately 86% in fiscal 2020.
The increase in customer demand for certain products together with the impact of COVID-19 on our supply chain has put pressure on our ability to maintain high in-stock levels, particularly for certain high demand products. We have been able to mitigate some of the impact, however, due to the benefits from our strategic investments and by working cross-functionally and partnering with our suppliers to make real-time adjustments to our product assortments, introducing alternative products, or reducing assortments to the most popular selections in certain product categories.
Given these ongoing demands and the complexity of the current environment, we have focused on taking care of our associates by investing in additional pay and benefits, including expanded paid time off for all hourly associates to use at their discretion and the implementation of a temporary weekly bonus program. To continue to support our associates, we have transitioned away from these temporary programs and have implemented permanent compensation enhancements for frontline, hourly associates beginning in the third quarter of fiscal 2020, totaling approximately $1 billion of expected incremental expense on an annualized basis. Collectively, the enhanced pay and benefits implemented in fiscal 2020 resulted in additional expense of approximately $2.0 billion in fiscal 2020.
Although we cannot estimate the future impact of COVID-19 or the recovery from the pandemic, we believe our existing liquidity will be sufficient to continue to run our business effectively. We also believe that the investments we have made in recent years in our stores, interconnected and digital assets, associates, supply chain, and merchandising organization have allowed us to quickly adapt to shifts in customer needs and behaviors and the fluid circumstances created by the pandemic. We continue to actively monitor our business and operations and may take further actions as may be required by federal, state or local authorities or that we determine are in the best interests of our associates, customers, suppliers, vendors and shareholders.
Results of Operations and Non-GAAP Measures
The tables and discussion below should be read in conjunction with our consolidated financial statements and related notes included in this report. The following table displays the percentage relationship between net sales and major categories in our consolidated statements of earnings:
| Fiscal | Fiscal | Fiscal | |||||||||||||||||||||||||||||||||
| 2020 | 2019 | 2018 | |||||||||||||||||||||||||||||||||
| dollars in millions | $ | % of Net Sales | $ | % of Net Sales | $ | % of Net Sales | |||||||||||||||||||||||||||||
| Net sales | $ | 132,110 | $ | 110,225 | $ | 108,203 | |||||||||||||||||||||||||||||
| Gross profit | 44,853 | 34.0 | % | 37,572 | 34.1 | % | 37,160 | 34.3 | % | ||||||||||||||||||||||||||
| Operating expenses: | |||||||||||||||||||||||||||||||||||
| Selling, general and administrative | 24,447 | 18.5 | 19,740 | 17.9 | 19,513 | 18.0 | |||||||||||||||||||||||||||||
| Depreciation and amortization | 2,128 | 1.6 | 1,989 | 1.8 | 1,870 | 1.7 | |||||||||||||||||||||||||||||
| Impairment loss | — | — | — | — | 247 | 0.2 | |||||||||||||||||||||||||||||
| Total operating expenses | 26,575 | 20.1 | 21,729 | 19.7 | 21,630 | 20.0 | |||||||||||||||||||||||||||||
| Operating income | 18,278 | 13.8 | 15,843 | 14.4 | 15,530 | 14.4 | |||||||||||||||||||||||||||||
| Interest and other (income) expense: | |||||||||||||||||||||||||||||||||||
| Interest and investment income | (47) | — | (73) | (0.1) | (93) | (0.1) | |||||||||||||||||||||||||||||
| Interest expense | 1,347 | 1.0 | 1,201 | 1.1 | 1,051 | 1.0 | |||||||||||||||||||||||||||||
| Other | — | — | — | — | 16 | — | |||||||||||||||||||||||||||||
| Interest and other, net | 1,300 | 1.0 | 1,128 | 1.0 | 974 | 0.9 | |||||||||||||||||||||||||||||
| Earnings before provision for income taxes | 16,978 | 12.9 | 14,715 | 13.3 | 14,556 | 13.5 | |||||||||||||||||||||||||||||
| Provision for income taxes | 4,112 | 3.1 | 3,473 | 3.2 | 3,435 | 3.2 | |||||||||||||||||||||||||||||
| Net earnings | $ | 12,866 | 9.7 | % | $ | 11,242 | 10.2 | % | $ | 11,121 | 10.3 | % |
—————
Note: Fiscal 2020 and fiscal 2019 include 52 weeks. Fiscal 2018 includes 53 weeks. Certain percentages may not sum to totals due to rounding.
| % Change | |||||||||||||||||||||||||||||
| Selected financial and sales data: | Fiscal | Fiscal | Fiscal | Fiscal | Fiscal | ||||||||||||||||||||||||
| 2020 | 2019 | 2018 | 2020 vs. 2019 | 2019 vs. 2018 | |||||||||||||||||||||||||
| Comparable sales (% change) (1) (6) | 19.7 | % | 3.5 | % | 5.2 | % | N/A | N/A | |||||||||||||||||||||
| Comparable customer transactions (% change) (1) (2) (6) | 8.6 | % | 1.1 | % | 1.0 | % | N/A | N/A | |||||||||||||||||||||
| Comparable average ticket (% change) (1) (2) (6) | 10.5 | % | 2.5 | % | 4.2 | % | N/A | N/A | |||||||||||||||||||||
| Customer transactions (in millions) (2) (3) (6) | 1,756.3 | 1,616.0 | 1,620.8 | 8.7 | % | (0.3) | % | ||||||||||||||||||||||
| Average ticket (2) (3) (4) (6) | $74.32 | $67.30 | $65.74 | 10.4 | % | 2.4 | % | ||||||||||||||||||||||
| Sales per retail square foot (2) (3) (5) (6) | $543.74 | $454.82 | $446.86 | 19.6 | % | 1.8 | % | ||||||||||||||||||||||
| Diluted earnings per share | $11.94 | $10.25 | $9.73 | 16.5 | % | 5.3 | % |
—————
(1)Fiscal 2019 compares the 52 week period in fiscal 2019 to weeks 2 through 53 in fiscal 2018. Fiscal 2018 calculations do not include results from the 53rd week of fiscal 2018 and compare weeks 1 through 52 in fiscal 2018 to the 52 week period in fiscal 2017.
*(2)*Does not include results for the legacy Interline Brands business, now operating as a part of The Home Depot Pro.
(3)The 53rd week of fiscal 2018 increased customer transactions by 24.5 million, added $0.01 to average ticket, and increased sales per retail square foot by $6.87.
*(4)*Average ticket represents the average price paid per transaction and is used by management to monitor the performance of the Company, as it represents a primary driver in measuring sales performance.
*(5)*Sales per retail square foot represents sales divided by the retail store square footage. Sales per retail square foot is a measure of the efficiency of sales based on the total square footage of our stores and is used by management to monitor the performance of the Company as an indicator of the productivity of owned and leased square footage for retail operations.
*(6)*Does not include results for HD Supply, which was acquired in December 2020.
Fiscal 2020 Compared to Fiscal 2019
Sales. We assess our sales performance by evaluating both net sales and comparable sales.
Net Sales. Net sales for fiscal 2020 increased $21.9 billion, or 19.9%, to $132.1 billion. The increase in net sales for fiscal 2020 primarily reflected the impact of positive comparable sales driven by an increase in comparable customer transactions and comparable average ticket. Online sales, which consist of sales generated online through our websites for products picked up in our stores or delivered to customer locations, represented 14.4% of net sales and grew by approximately 86% during fiscal 2020. The increase in online sales in fiscal 2020 was driven in large part by the impact of COVID-19, with customers continuing to leverage our digital platforms for their shopping needs. A stronger U.S. dollar negatively impacted sales growth by $381 million in fiscal 2020.
Comparable Sales. Comparable sales is a measure that highlights the performance of our existing locations and websites by measuring the change in net sales for a period over the comparable prior-period of equivalent length. Comparable sales includes sales at all locations, physical and online, open greater than 52 weeks (including remodels and relocations) and excludes closed stores. Retail stores become comparable on the Monday following their 52nd week of operation. Acquisitions are included in comparable sales after they have been owned for more than 52 weeks. Comparable sales is intended only as supplemental information and is not a substitute for net sales presented in accordance with GAAP.
Total comparable sales increased 19.7% in fiscal 2020, reflecting a 10.5% increase in comparable average ticket and an 8.6% increase in comparable customer transactions. The increase in comparable sales reflected a number of factors, including increased consumer demand across our core categories and the execution of our strategic efforts to drive an enhanced interconnected experience in both the physical and digital worlds. The increase in comparable average ticket and comparable customer transactions was primarily driven by an increase in the number of products sold per transaction and stronger in-store and online customer engagement, as well as commodity price inflation primarily from lumber. During fiscal 2020, 11 of our 14 merchandising departments posted double-digit positive comparable sales, while Plumbing, Kitchen and Bath, and Flooring posted high single-digit positive comparable sales when compared to last year.
Gross Profit. Gross profit increased $7.3 billion, or 19.4%, to $44.9 billion in fiscal 2020. Gross profit as a percent of net sales, or gross profit margin, was 34.0% in fiscal 2020 compared to 34.1% in fiscal 2019, reflecting a change in product mix, higher shrink and increased supply chain expense, partially offset by the benefit from lower promotional activity in fiscal 2020 as we cancelled or modified certain annual merchandising events in response to COVID-19.
Operating Expenses. Our operating expenses are composed of SG&A and depreciation and amortization.
Selling, General & Administrative. SG&A increased $4.7 billion, or 23.8%, to $24.4 billion in fiscal 2020. As a percent of net sales, SG&A was 18.5% for fiscal 2020 compared to 17.9% for fiscal 2019. The increase in SG&A as a percent of net sales for fiscal 2020 was primarily driven by an additional $2.0 billion of expense related to expanded associate pay and benefits, an additional $238 million of operational expense related to COVID-19, and additional expense related to our store success sharing program and store and field-based management bonuses, partially offset by leverage resulting from a positive comparable sales environment. SG&A in fiscal 2020 also includes transaction-related expenses of $110 million associated with the acquisition of HD Supply.
Depreciation and Amortization. Depreciation and amortization increased $139 million, or 7.0%, to $2.1 billion in fiscal 2020. As a percent of net sales, depreciation and amortization was 1.6% for fiscal 2020 compared to 1.8% in fiscal 2019. The decrease in depreciation and amortization as a percent of net sales primarily reflected leverage resulting from positive comparable sales and timing of asset additions, partially offset by strategic investments in the business.
Interest and Other, net. Interest and other, net, was $1.3 billion for fiscal 2020 compared to $1.1 billion for fiscal 2019. Interest and other, net, as a percent of net sales was 1.0% for both fiscal 2020 and fiscal 2019, and primarily reflected higher interest expense resulting from higher debt balances offset by leverage resulting from a positive comparable sales environment.
Provision for Income Taxes. Our combined effective income tax rate was 24.2% for fiscal 2020 compared to 23.6% for fiscal 2019. The provision for income taxes increased in fiscal 2020 primarily as a result of certain discrete tax benefits in fiscal 2019.
Diluted Earnings per Share. Diluted earnings per share were $11.94 for fiscal 2020 compared to $10.25 for fiscal 2019. The increase in diluted earnings per share for fiscal 2020 reflected the impact of a positive comparable sales environment, partially offset by the additional expenses incurred in response to COVID-19, as well as the incremental expense associated with our store success sharing program and store and field-based management bonuses.
Fiscal 2019 Compared to Fiscal 2018
For a comparison of our results of operations for fiscal 2019 to fiscal 2018, see “Part II, Item 7. Management’s Discussion and Analysis of Financial Condition and Results of Operations” of our Form 10-K for the fiscal year ended February 2, 2020, filed with the SEC on March 25, 2020.
Non-GAAP Financial Measures
To provide clarity about our operating performance, we supplement our reporting with certain non-GAAP financial measures. However, this supplemental information should not be considered in isolation or as a substitute for the related GAAP measures. Non-GAAP financial measures presented herein may differ from similar measures used by other companies.
Return on Invested Capital. We believe ROIC is meaningful for investors and management because it measures how effectively we deploy our capital base. We define ROIC as NOPAT, a non-GAAP financial measure, for the most recent twelve-month period, divided by average debt and equity. We define average debt and equity as the average of beginning and ending long-term debt (including current installments) and equity for the most recent twelve-month period.
The calculation of ROIC, together with a reconciliation of NOPAT to net earnings (the most comparable GAAP measure), follows:
| Fiscal | Fiscal | Fiscal | |||||||||||||||
| dollars in millions | 2020 | 2019 | 2018 | ||||||||||||||
| Net earnings | $ | 12,866 | $ | 11,242 | $ | 11,121 | |||||||||||
| Interest and other, net | 1,300 | 1,128 | 974 | ||||||||||||||
| Provision for income taxes | 4,112 | 3,473 | 3,435 | ||||||||||||||
| Operating income | 18,278 | 15,843 | 15,530 | ||||||||||||||
| Income tax adjustment (1) | (4,423) | (3,739) | (3,665) | ||||||||||||||
| NOPAT | $ | 13,855 | $ | 12,104 | $ | 11,865 | |||||||||||
| Average debt and equity (2) | $ | 33,964 | $ | 26,686 | $ | 26,492 | |||||||||||
| ROIC | 40.8 | % | 45.4 | % | 44.8 | % |
—————
Note: Fiscal 2020 and fiscal 2019 include 52 weeks. Fiscal 2018 includes 53 weeks.
*(1)*Income tax adjustment is defined as operating income multiplied by our effective tax rate for the trailing twelve months.
(2)The beginning balance of equity for fiscal 2019 was adjusted to reflect an immaterial opening balance sheet adjustment due to the adoption of Topic 842, Leases, in fiscal 2019. The beginning balance of equity for fiscal 2018 was adjusted to reflect an opening balance sheet adjustment of $75 million due to the adoption of Topic 606, Revenue from Contracts with Customers, in fiscal 2018.
Liquidity and Capital Resources
Cash and Cash Equivalents at End of Year
At January 31, 2021, we had $7.9 billion in cash and cash equivalents, of which $1.3 billion was held by our foreign subsidiaries. We believe that our current cash position, access to the long-term debt capital markets, cash flow generated from operations, and funds available from our commercial paper programs, should be sufficient not only for our operating requirements but also to enable us to complete our capital expenditure programs, fund dividend payments, fund any share repurchases, and make any required long-term debt payments through the next several fiscal years. We also intend to maintain an elevated cash position during fiscal 2021 to further enhance our strong liquidity position. In addition, we believe we have the ability to obtain alternative sources of financing, if necessary.
During fiscal 2020, we chose to defer some of our in-store strategic investments to prioritize the safety of our associates and customers in response to COVID-19. We expect to complete these investments in fiscal 2021. For
fiscal 2021, we will continue to follow our disciplined approach to capital allocation, and we currently estimate capital expenditures of approximately two percent of net sales on an annual basis. However, we may adjust our capital expenditures to support the operations of the business or in response to the economic environment, as necessary or appropriate.
Debt and Derivative Instruments
In March 2020, we expanded our commercial paper programs from $3.0 billion to $6.0 billion to further enhance our liquidity position in response to the pandemic. All of our short-term borrowings in fiscal 2020 and fiscal 2019 were under these commercial paper programs. In connection with these programs, we had back-up credit facilities with a consortium of banks for borrowings up to $6.5 billion, which consisted of (1) a five-year $2.0 billion credit facility, which is scheduled to expire in December 2023, (2) a 364-day $1.0 billion credit facility scheduled to expire December 2021, and (3) a 364-day $3.5 billion credit facility that we entered into in March 2020 that was scheduled to expire in March 2021. In December 2020, we completed the renewal of our 364-day $1.0 billion credit facility and extended our five-year $2.0 billion credit facility, which extended the maturities from December 2020 to December 2021 and from December 2022 to December 2023, respectively. On January 29, 2021, we terminated the 364-day $3.5 billion credit facility and at the same time reduced our commercial paper programs back to a maximum of $3.0 billion. At January 31, 2021, we were in compliance with all of the covenants contained in the two remaining credit facilities, none of which are expected to impact our liquidity or capital resources. At January 31, 2021, there were no borrowings outstanding under our commercial paper programs compared to $974 million outstanding at February 2, 2020. We may enter into additional credit facilities or other debt financing.
We issue senior notes from time to time as part of our capital management strategy. In March 2020 and January 2021, we issued $5.0 billion and $3.0 billion of senior notes, respectively. We also repaid an aggregate of $2.9 billion of long-term debt during fiscal 2020, and in March 2021, we also fully repaid our $1.35 billion 2.00% senior notes that had a maturity date of April 2021.
We use derivative and nonderivative instruments as part of our normal business operations in the management of our exposure to fluctuations in foreign currency exchange rates and interest rates on certain debt. See Note 4 to our consolidated financial statements for further discussion of our senior notes issuances, repayments and derivative instruments.
Leases
We use operating and finance leases to fund a portion of our real estate, including our stores, distribution centers, and store support centers. See Note 3 to our consolidated financial statements for further discussion of our operating and finance leases.
Share Repurchases
In February 2019, our Board of Directors authorized $15.0 billion in share repurchases, of which approximately $7.7 billion remained available at the end of fiscal 2020. During fiscal 2020, we had cash payments of $791 million for repurchases of our common stock through open market purchases. In March 2020, we suspended our share repurchases to ensure sufficient liquidity to meet the needs of the business during the pandemic. We resumed share repurchases in the first quarter of fiscal 2021, the amount and continuation of which will be influenced by the evolving economic and pandemic environment.
Cash Flows Summary
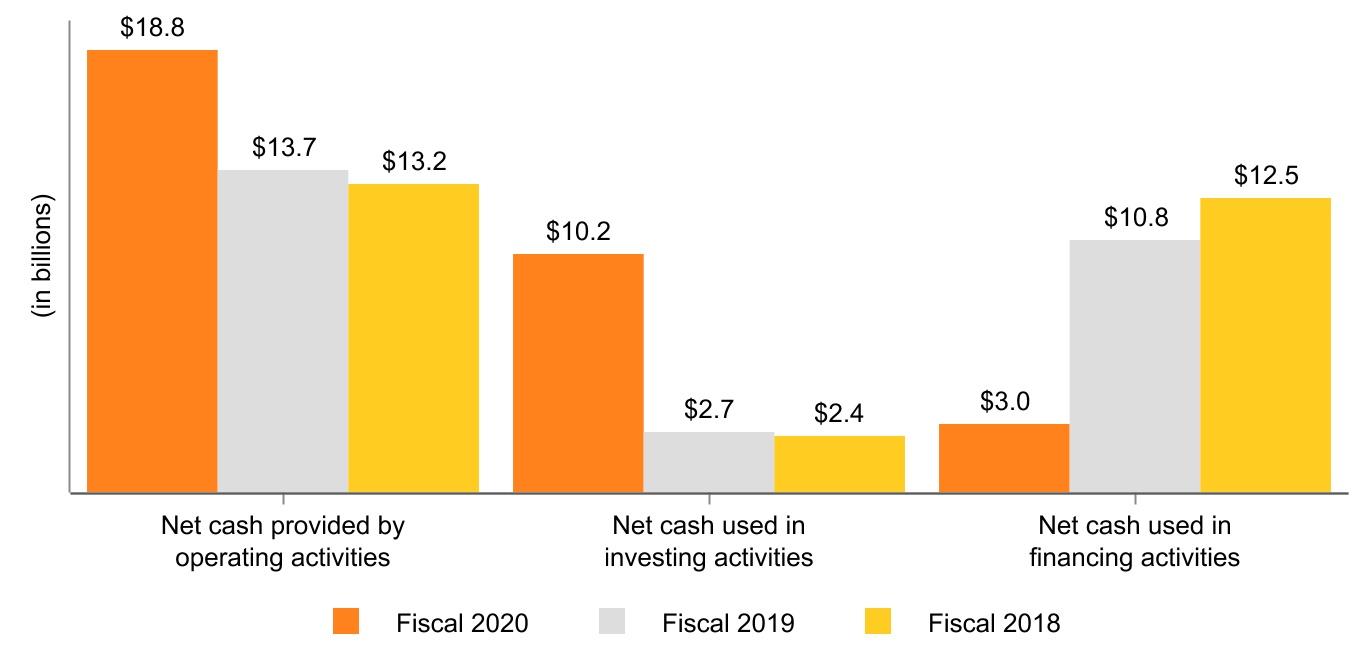
Operating Activities. Cash flow generated from operations provides us with a significant source of liquidity. Our operating cash flows result primarily from cash received from our customers, offset by cash payments we make for products and services, associate compensation, operations, and occupancy costs.
Cash provided by or used in operating activities is also subject to changes in working capital. Working capital at any specific point in time is subject to many variables, including seasonality, inventory management and category expansion, the timing of cash receipts and payments, vendor payment terms, and fluctuations in foreign exchange rates.
Net cash provided by operating activities increased by $5.2 billion in fiscal 2020 compared to fiscal 2019, primarily driven by an increase in net earnings and changes in working capital. Working capital was impacted by timing of vendor payments, along with higher merchandise inventories to continue to support increasing demand and replenish in-stock levels.
Investing Activities. Cash used in investing activities increased by $7.5 billion in fiscal 2020 compared to fiscal 2019, primarily due to $7.8 billion of net consideration paid to acquire HD Supply, partially offset by the deferral of certain capital expenditures in fiscal 2020 due to COVID-19. See Note 12 to our consolidated financial statements for further discussion of the HD Supply acquisition.
Financing Activities. Cash used in financing activities in fiscal 2020 primarily reflected $7.9 billion of net proceeds from long-term debt, offset by $6.5 billion of cash dividends paid, $2.9 billion of repayments of long-term debt, $974 million of net repayments of short-term debt, and $791 million for share repurchases prior to our suspension of share repurchases in March 2020.
Cash used in financing activities in fiscal 2019 primarily reflected $7.0 billion for share repurchases, $6.0 billion of cash dividends paid, and $1.4 billion of repayments of short- and long-term debt, offset by $3.4 billion of net proceeds from long-term debt.
Contractual Obligations
Our significant contractual obligations at January 31, 2021 were as follows:
| Payments Due by Period | |||||||||||||||||||||||||||||
| in millions | Total | Less than 1 Year | 1 to 3 Years | 3 to 5 Years | More Than 5 Years | ||||||||||||||||||||||||
| Long-term debt – principal payments (1) | $ | 34,750 | $ | 1,350 | $ | 3,250 | $ | 2,100 | $ | 28,050 | |||||||||||||||||||
| Long-term debt – interest payments (2) | 20,581 | 1,162 | 2,210 | 2,114 | 15,095 | ||||||||||||||||||||||||
| Finance lease obligations (3) | 3,693 | 272 | 565 | 590 | 2,266 | ||||||||||||||||||||||||
| Operating lease obligations (3) | 7,122 | 955 | 1,814 | 1,352 | 3,001 | ||||||||||||||||||||||||
| Purchase obligations (4) | 3,778 | 2,689 | 1,030 | 56 | 3 | ||||||||||||||||||||||||
| Unrecognized tax benefits (5) | 7 | 7 | — | — | — | ||||||||||||||||||||||||
| Total | $ | 69,931 | $ | 6,435 | $ | 8,869 | $ | 6,212 | $ | 48,415 |
—————
*(1)*Excludes finance lease obligations.
*(2)*Interest payments are calculated at current interest rates, including the impact of active interest rate swaps.
*(3)*Includes finance and operating lease imputed interest of $927 million and $938 million, respectively.
*(4)*Purchase obligations include all legally binding contracts such as firm commitments for inventory purchases, media and sponsorship spend, software acquisitions, license commitments, and legally binding service contracts.
*(5)*Excludes $533 million of noncurrent unrecognized tax benefits due to uncertainty regarding the timing of future cash tax payments.
Off-Balance Sheet Arrangements
We have no material off-balance sheet arrangements.
Critical Accounting Policies
Our significant accounting policies are disclosed in Note 1 to our consolidated financial statements. The following discussion addresses our most critical accounting policies, which are those that are both important to the representation of our financial condition and results of operations, and that require significant judgment or use of significant assumptions or complex estimates.
Merchandise Inventories
We value the majority of our inventory under the retail inventory method, using the first-in, first-out method, with the remainder of our inventories valued under a cost method. Under the retail inventory method, inventories are stated at cost, which is determined by applying a cost-to-retail ratio to the retail value of inventories.
The retail value of our inventory is adjusted as needed to reflect current market conditions. Because these adjustments are based on current prevailing market conditions, the value of our inventory approximates the lower of cost or market. The valuation under the retail inventory method is based on a number of factors such as markups, markdowns, and inventory losses (or shrink). As such, there exists an inherent uncertainty in the final determination of inventory cost and gross profit. We determine markups and markdowns based on the consideration of a variety of factors such as current and anticipated demand, customer preferences and buying trends, age of the merchandise, and weather conditions.
We calculate shrink based on actual inventory losses identified as a result of physical inventory counts during each fiscal period and estimated inventory losses between physical inventory counts. The estimate for shrink occurring in the interim period between physical inventory counts is calculated on a store-specific basis and is primarily based on recent shrink results. Due to changes in operating conditions during fiscal 2020 as a result of the COVID-19 pandemic, we used the results from a sample of stores that were able to conduct physical inventories as a basis for estimating shrink for those stores at which physical inventory counts were temporarily suspended during the year. We believe the sample of stores that were selected for inventory counts in the current year provides a reasonable basis for estimating shrink where a physical inventory count was not performed in fiscal 2020. Historically, the difference between estimated shrink and actual inventory losses has not been material to our annual financial results.
We do not believe there is a reasonable likelihood for a material change in the estimates or assumptions we use to value our inventory under the retail inventory method. We believe that the retail inventory method provides an inventory valuation which approximates cost and results in valuing our inventory at the lower of cost or market.
Impairment of Long-Lived Assets
We evaluate our long-lived assets each quarter for indicators of potential impairment. Indicators of impairment include current period losses combined with a history of losses, our decision to relocate or close a store or other location before the end of its previously estimated useful life, or when changes in other circumstances indicate the carrying amount of an asset may not be recoverable. The evaluation for long-lived assets is performed at the lowest level of identifiable cash flows, which is generally the individual store level. The assets of a store with indicators of impairment are evaluated for recoverability by comparing their undiscounted future cash flows with their carrying value. Our cash flow projections look several years into the future and include assumptions of variables such as future sales and operating margin growth rates, economic conditions, market competition, and inflation.
If the carrying value is greater than the undiscounted future cash flows, we then measure the asset’s fair value to determine whether an impairment loss should be recognized. If the resulting fair value is less than the carrying value, an impairment loss is recognized. We generally base our estimates of fair market value on market appraisals of owned locations and estimates of the amount of potential sublease income and the time required to sublease for leased locations. Impairments of long-lived assets were not material to our consolidated financial statements in fiscal 2020, fiscal 2019 or fiscal 2018.
Uncertain Tax Positions
We are subject to income taxes in the United States and in multiple jurisdictions across our global operations. Thus, the determination of our provision for income taxes requires significant judgment, the use of estimates, and the interpretations and application of complex tax law. Our provision for income taxes could be affected by many factors, including changes in business operations, changes in tax law, outcomes of income tax audits, changes in our assessment of certain tax contingencies, the impact of discrete tax items, and the mix of earnings among our U.S. and foreign operations.
The calculation of our tax liabilities involves dealing with complexity and thus, there are many transactions and calculations for which the ultimate tax determination is uncertain. The assessment of uncertain tax positions requires the use of significant judgment in evaluating our tax positions and assessing the timing and amounts of deductible and taxable items. We record the benefits of uncertain tax positions in our financial statements only after determining a more likely than not probability that the uncertain tax positions will be sustained.
Business Combinations
We account for business combinations using the acquisition method of accounting, which requires that once control is obtained, all the assets acquired and liabilities assumed are recorded at their respective fair values at the date of acquisition. The determination of fair values of identifiable assets and liabilities requires estimates and the use of valuation techniques when market value is not readily available and requires a significant amount of management judgment. For the valuation of intangible assets acquired in a business combination, we typically use an income approach. Significant estimates in valuing certain intangible assets include, but are not limited to, the amount and timing of future cash flows, growth rates, customer attrition rates, discount rates and useful lives. The excess of the purchase price over fair values of identifiable assets acquired and liabilities assumed is recorded as goodwill. During the measurement period, which is up to one year from the acquisition date, we may record adjustments to the assets acquired and liabilities assumed with the corresponding offset to goodwill. Upon the conclusion of the measurement period, any subsequent adjustments are recorded to earnings.
Additional Information
For information on accounting pronouncements that have impacted or are expected to materially impact our financial condition, results of operations, or cash flows, see Note 1 to our consolidated financial statements.
Previous: Item 6. Selected Financial Data. · Next: Item 7A. Quantitative and Qualitative Disclosures About Market Risk.