 filings.tools
Home Depot 10-K 2024-01-28
Filed 2024-03-13. 24 sections, 401K characters. Original on sec.gov · Markdown · JSON
Cover and table of contents
UNITED STATES
SECURITIES AND EXCHANGE COMMISSION
Washington, D.C. 20549
FORM 10-K
(Mark One)
☒ ANNUAL REPORT PURSUANT TO SECTION 13 OR 15(d) OF THE SECURITIES EXCHANGE ACT OF 1934
For the fiscal year ended January 28, 2024
or
☐ TRANSITION REPORT PURSUANT TO SECTION 13 OR 15(d) OF THE SECURITIES EXCHANGE ACT OF 1934
For the transition period from to
Commission file number 1-8207
THE HOME DEPOT, INC.
(Exact name of registrant as specified in its charter)
| Delaware | 95-3261426 | ||||||||||||||||
| (State or other jurisdiction of incorporation or organization) | (I.R.S. Employer Identification No.) |
| 2455 Paces Ferry Road | ||||||||||||||||||||
| Atlanta, | Georgia | 30339 | ||||||||||||||||||
| (Address of principal executive offices) | (Zip Code) |
Registrant’s telephone number, including area code: (770) 433-8211
| Securities registered pursuant to Section 12(b) of the Act: | ||||||||||||||
| Title of each class | Trading Symbol | Name of each exchange on which registered | ||||||||||||
| Common Stock, $0.05 Par Value Per Share | HD | New York Stock Exchange |
Securities registered pursuant to section 12(g) of the Act: None
Indicate by check mark if the registrant is a well-known seasoned issuer, as defined in Rule 405 of the Securities Act. Yes ☒ No ☐
Indicate by check mark if the registrant is not required to file reports pursuant to Section 13 or Section 15(d) of the Act. Yes ☐ No ☒
Indicate by check mark whether the registrant (1) has filed all reports required to be filed by Section 13 or 15(d) of the Securities Exchange Act of 1934 during the preceding 12 months (or for such shorter period that the registrant was required to file such reports), and (2) has been subject to such filing requirements for the past 90 days. Yes ☒ No ☐
Indicate by check mark whether the registrant has submitted electronically every Interactive Data File required to be submitted pursuant to Rule 405 of Regulation S-T (§ 232.405 of this chapter) during the preceding 12 months (or for such shorter period that the registrant was required to submit such files). Yes ☒ No ☐
Indicate by check mark whether the registrant is a large accelerated filer, an accelerated filer, a non-accelerated filer, a smaller reporting company, or an emerging growth company. See the definitions of “large accelerated filer,” “accelerated filer,” “smaller reporting company,” and “emerging growth company” in Rule 12b-2 of the Exchange Act.
Large accelerated filer ☒ Accelerated filer ☐ Non-accelerated filer ☐ Smaller reporting company ☐ Emerging growth company ☐
If an emerging growth company, indicate by check mark if the registrant has elected not to use the extended transition period for complying with any new or revised financial accounting standards provided pursuant to Section 13(a) of the Exchange Act. ¨
Indicate by check mark whether the registrant has filed a report on and attestation to its management’s assessment of the effectiveness of its internal control over financial reporting under Section 404(b) of the Sarbanes-Oxley Act (15 U.S.C. 7262(b)) by the registered public accounting firm that prepared or issued its audit report. ☒
If securities are registered pursuant to Section 12(b) of the Act, indicate by check mark whether the financial statements of the registrant included in the filing reflect the correction of an error to previously issued financial statements. ☐
Indicate by check mark whether any of those error corrections are restatements that required a recovery analysis of incentive-based compensation received by any of the registrant’s executive officers during the relevant recovery period pursuant to § 240.10D-1(b). ☐
Indicate by check mark whether the registrant is a shell company (as defined in Rule 12b-2 of the Act). Yes ☐ No ☒
The aggregate market value of voting common stock held by non-affiliates of the registrant on July 28, 2023 was $331.5 billion.
The number of shares outstanding of the registrant’s common stock as of February 28, 2024 was 991,015,773 shares.
DOCUMENTS INCORPORATED BY REFERENCE
Portions of the registrant’s proxy statement for the 2024 Annual Meeting of Shareholders are incorporated by reference in Part III of this Form 10-K to the extent described herein.
TABLE OF CONTENTS
| Fiscal 2023 Form 10-K | i | |
COMMONLY USED OR DEFINED TERMS
| Term | Definition | |||||||
| ASU | Accounting Standards Update | |||||||
| BODFS | Buy Online, Deliver From Store | |||||||
| BOPIS | Buy Online, Pickup In Store | |||||||
| BORIS | Buy Online, Return In Store | |||||||
| BOSS | Buy Online, Ship to Store | |||||||
| CDP | The not-for-profit organization formerly known as the Carbon Disclosure Project | |||||||
| Comparable sales | As defined in the Results of Operations section of MD&A | |||||||
| DIFM | Do-It-For-Me | |||||||
| DIY | Do-It-Yourself | |||||||
| EH&S | Environmental, Health, and Safety | |||||||
| EPA | U.S. Environmental Protection Agency | |||||||
| ESG | Environmental, social, and governance | |||||||
| ESPP | Employee Stock Purchase Plan | |||||||
| Exchange Act | Securities Exchange Act of 1934, as amended | |||||||
| FASB | Financial Accounting Standards Board | |||||||
| fiscal 2020 | Fiscal year ended January 31, 2021 (includes 52 weeks) | |||||||
| fiscal 2021 | Fiscal year ended January 30, 2022 (includes 52 weeks) | |||||||
| fiscal 2022 | Fiscal year ended January 29, 2023 (includes 52 weeks) | |||||||
| fiscal 2023 | Fiscal year ended January 28, 2024 (includes 52 weeks) | |||||||
| fiscal 2024 | Fiscal year ending February 2, 2025 (includes 53 weeks) | |||||||
| GAAP | U.S. generally accepted accounting principles | |||||||
| IRS | Internal Revenue Service | |||||||
| LIBOR | London interbank offered rate | |||||||
| MD&A | Management’s Discussion and Analysis of Financial Condition and Results of Operations | |||||||
| MRO | Maintenance, repair, and operations | |||||||
| NOPAT | Net operating profit after tax | |||||||
| NYSE | New York Stock Exchange | |||||||
| PLCC | Private label credit card | |||||||
| Pro | Professional customer | |||||||
| Restoration Plans | Home Depot FutureBuilder Restoration Plan and HD Supply Restoration Plan | |||||||
| ROIC | Return on invested capital | |||||||
| SEC | Securities and Exchange Commission | |||||||
| Securities Act | Securities Act of 1933, as amended | |||||||
| SG&A | Selling, general, and administrative expenses | |||||||
| SOFR | Secured Overnight Financing Rate |
| Fiscal 2023 Form 10-K | ii | |
FORWARD-LOOKING STATEMENTS
Certain statements contained herein, as well as in other filings we make with the SEC and other written and oral information we release, regarding our performance or other events or developments in the future constitute “forward-looking statements” as defined in the Private Securities Litigation Reform Act of 1995. Forward-looking statements may relate to, among other things, the demand for our products and services, including as a result of macroeconomic conditions; net sales growth; comparable sales; the effects of competition; our brand and reputation; implementation of interconnected retail, store, supply chain and technology initiatives; inventory and in-stock positions; the state of the economy; the state of the housing and home improvement markets; the state of the credit markets, including mortgages, home equity loans, and consumer credit; the impact of tariffs; issues related to the payment methods we accept; demand for credit offerings; management of relationships with our associates, potential associates, suppliers and service providers; cost and availability of labor; costs of fuel and other energy sources; events that could disrupt our business, supply chain, technology infrastructure, or demand for our products and services, such as international trade disputes, natural disasters, climate change, public health issues, cybersecurity events, geopolitical conflicts, and military conflicts or acts of war; our ability to maintain a safe and secure store environment; our ability to address expectations regarding environmental, social and governance matters and meet related goals; continuation or suspension of share repurchases; net earnings performance; earnings per share; future dividends; capital allocation and expenditures; liquidity; return on invested capital; expense leverage; changes in interest rates; changes in foreign currency exchange rates; commodity or other price inflation and deflation; our ability to issue debt on terms and at rates acceptable to us; the impact and expected outcome of investigations, inquiries, claims, and litigation, including compliance with related settlements; the challenges of operating in international markets; the adequacy of insurance coverage; the effect of accounting charges; the effect of adopting certain accounting standards; the impact of legal and regulatory changes, including changes to tax laws and regulations; store openings and closures; financial outlook; and the impact of acquired companies on our organization and the ability to recognize the anticipated benefits of any acquisitions.
Forward-looking statements are based on currently available information and our current assumptions, expectations and projections about future events. You should not rely on our forward-looking statements. These statements are not guarantees of future performance and are subject to future events, risks and uncertainties — many of which are beyond our control, dependent on the actions of third parties, or currently unknown to us — as well as potentially inaccurate assumptions that could cause actual results to differ materially from our historical experience and our expectations and projections. These risks and uncertainties include, but are not limited to, those described in Part I, Item 1A. Risk Factors, and elsewhere in this report and also as may be described from time to time in future reports we file with the SEC. You should read such information in conjunction with our consolidated financial statements and related notes and Part II, Item 7. Management’s Discussion and Analysis of Financial Condition and Results of Operations in this report. There also may be other factors that we cannot anticipate or that are not described herein, generally because we do not currently perceive them to be material. Such factors could cause results to differ materially from our expectations. Forward-looking statements speak only as of the date they are made, and we do not undertake to update these statements other than as required by law. You are advised, however, to review any further disclosures we make on related subjects in our filings with the SEC and in our other public statements.
| Fiscal 2023 Form 10-K | iii | |
PART I
Item 1. Business.
INTRODUCTION
The Home Depot, Inc. is the world’s largest home improvement retailer based on net sales for fiscal 2023. We offer our customers a wide assortment of building materials, home improvement products, lawn and garden products, décor products, and facilities maintenance, repair and operations products. We also provide a number of services, including home improvement installation services and tool and equipment rental. As of the end of fiscal 2023, we operated 2,335 stores located throughout the U.S. (including the Commonwealth of Puerto Rico and the territories of the U.S. Virgin Islands and Guam), Canada, and Mexico. The Home Depot stores average approximately 104,000 square feet of enclosed space, with approximately 24,000 additional square feet of outside garden area. We also maintain a network of distribution and fulfillment centers, as well as a number of e-commerce websites in the U.S., Canada and Mexico. When we refer to “The Home Depot,” the “Company,” “we,” “us” or “our” in this report, we are referring to The Home Depot, Inc. and its consolidated subsidiaries.
The Home Depot, Inc. is a Delaware corporation that was incorporated in 1978. Our Store Support Center (corporate headquarters) is located at 2455 Paces Ferry Road, Atlanta, Georgia 30339. Our telephone number at that address is (770) 433-8211.
OUR BUSINESS
OUR STRATEGY
The retail landscape has changed rapidly over the past several years, with a complex macroeconomic environment and customer expectations continually evolving. In fiscal 2023, we experienced a year of moderation after the unprecedented growth of the prior three years, as we navigated the continued shift in consumer consumption trends away from goods and towards services and the impact of a rising interest rate environment. Our ability to operate successfully and meet the needs of our customers in an efficient and cost-effective way was due in significant part to our investments over the past several years aimed at creating an interconnected, frictionless shopping experience that enables our customers to seamlessly blend the digital and physical worlds. Going forward, we will continue to leverage the momentum of these investments and invest in our business in support of the following goals:
-
We intend to provide the best customer experience in home improvement and develop differentiated capabilities for our customers;
-
We intend to extend our position as the low-cost provider in home improvement; and
-
We intend to be the most efficient investor of capital in home improvement.
We believe that these goals will help us grow faster than the market and deliver value to our shareholders. We are steadfast in this commitment, while also recognizing that exercising corporate responsibility and being informed by the needs of our other stakeholders, including our customers, associates, supplier partners, and communities, creates value for all stakeholders, including our shareholders.
DELIVER SHAREHOLDER VALUE
We deliver on our objective to create shareholder value through our disciplined approach to capital allocation. Our capital allocation principles are as follows:
-
First, we intend to reinvest in our business to drive growth faster than the market.
-
Second, after meeting the needs of the business, we look to pay a quarterly dividend.
-
Third, after reinvesting in our business and paying our dividend, we intend to return excess cash to our shareholders through share repurchases.
In fiscal 2023, we invested $3.2 billion in capital expenditures to support our business, advance our goals, and continue to build an interconnected customer experience. We also focused on driving productivity throughout the business by lowering our product and transportation costs and initiating a plan to reduce our fixed cost structure by approximately $500 million, which we expect will be realized in fiscal 2024. The combination of reinvesting in the business to drive higher sales and supporting productivity to lower costs allows us to improve our customer experience, increase our competitiveness in the market, and deliver shareholder value.
| Fiscal 2023 Form 10-K | 1 | |
In fiscal 2023, we returned over $16 billion to shareholders in the form of cash dividends and share repurchases. Our capital allocation is discussed further in Part II, Item 7. Management’s Discussion and Analysis of Financial Condition and Results of Operations.
OUR CUSTOMERS
We serve two primary customer groups — consumers (including both DIY and DIFM customers) and professional customers — and have developed varying approaches to meet their diverse needs:
DIY Customers
These customers are typically homeowners who purchase products and complete their own projects and installations. Our associates assist these customers both in our stores and through online resources and other media designed to provide product and project knowledge. We also offer a variety of clinics and workshops both to share this knowledge and to build an emotional connection with our DIY customers. As the preferences and behaviors of our DIY customers are changing, we are investing in capabilities to better serve the needs of those customers.
Professional Customers (or “Pros”)
These customers are primarily professional renovators/remodelers, general contractors, maintenance professionals, handymen, property managers, building service contractors and specialty tradespeople, such as electricians, plumbers and painters. These customers build, renovate, remodel, repair, and maintain residential properties, multifamily properties, hospitality properties, and commercial facilities, including education, healthcare, government, institutional, and office buildings.
We have a number of initiatives designed to drive growth with Pros, including those working on both simple and complex projects. We remain focused on providing a customized online experience, a dedicated sales force, a broad assortment of Pro-focused products and brands, an extensive delivery network, our Pro Xtra loyalty program, and enhanced credit offerings. Building on our historical strength as a destination for urgent purchase needs, we are investing in differentiated capabilities that will help us better serve our Pros’ complex purchase needs, including expanded supply chain capabilities, additional trade credit offerings, more showroom space, and an enhanced order management system.
We serve the MRO marketplace through our subsidiary HD Supply, a leading national distributor and provider of MRO products and related value-added services to multifamily, hospitality, healthcare, and government housing facilities, among others. Our MRO operations use a distribution center-based model that sells products primarily through a professional sales force and through e-commerce platforms and print catalogs.
In October 2023, we announced changes to our leadership structure, aligning our outside sales and service business with our global store organization to better serve our Pros by leveraging our full ecosystem and newest capabilities. We recognize the great value our Pros provide to their clients, and we strive to make their jobs easier and help them grow their businesses, from expanded capabilities to improve their business and customer experience to the Path to Pro network we are building for Pros to connect with jobseekers to help address the skilled labor shortage. We believe that investments aimed at deepening our relationships with our Pros are yielding increased engagement and will continue to translate into incremental sales to these customers.
DIFM Customers
Intersecting our DIY customers and our Pros are our DIFM customers. These customers are typically homeowners who use Pros to complete their project or installation. Currently, we offer installation services in a variety of categories, such as flooring, water heaters, bath, garage doors, cabinets, cabinet makeovers, countertops, sheds, furnaces and central air systems, and windows. DIFM customers can purchase these services in our stores, online, or in their homes through in-home consultations. In addition to serving our DIFM customer needs, we believe our focus on the Pros who perform services for these customers helps us drive higher product sales.
OUR PRODUCTS AND SERVICES
A typical The Home Depot store stocks approximately 30,000 to 40,000 items during the year, including both national brand name and proprietary products. Our online product offerings complement our stores by serving as an extended aisle, and we offer a significantly broader product assortment through our websites and mobile applications, including homedepot.com, our primary website; homedepot.ca and homedepot.com.mx, our websites in Canada and Mexico, respectively; hdsupply.com, our website for our MRO products and related services; our websites for custom window coverings including blinds.com, justblinds.com and americanblinds.com; and thecompanystore.com, our website featuring textiles and décor products.
| Fiscal 2023 Form 10-K | 2 | |
We believe our merchandising organization is a key competitive advantage, delivering product innovation, assortment and value, which reinforces our position as the product authority in home improvement. In fiscal 2023, we continued to invest in merchandising resets in our stores to refine assortments, optimize space productivity, introduce innovative new products to our customers, and improve visual merchandising to drive a better shopping experience. At the same time, we remain focused on offering everyday values in our stores and online. To help our merchandising organization keep pace with changing customer expectations and increasing desire for innovation, localization, and personalization, we are continuing to invest in tools to better leverage our data and drive a deeper level of collaboration with our supplier partners. As a result, we have continued to focus on enhanced merchandising information technology tools to help us: (1) build an interconnected shopping experience that is tailored to our customers’ shopping intent and location; (2) provide the best value in the market; and (3) optimize our product assortments. Our merchandising team leverages technology and works closely with our inventory and supply chain teams, as well as our supplier partners, to manage our assortments, drive innovation, manage the cost environment, and adjust inventory levels to respond to fluctuations in demand.
To complement our merchandising efforts, we offer a number of services for our customers, including installation services for our DIY and DIFM customers, as noted above. We also provide tool and equipment rentals at locations across the U.S. and Canada, providing value and convenience for both Pros and consumers. To improve the customer experience and continue to grow this differentiated service offering, we are continuing to invest in more locations (including continuing to pilot rental locations in Mexico), more tools, and better technology.
Sourcing and Quality Assurance
We maintain a global sourcing program to obtain high-quality and innovative products directly from manufacturers in the U.S. and around the world. During fiscal 2023, in addition to our U.S. sourcing operations, we maintained sourcing offices in Mexico, Canada, China, India, Vietnam and Europe. To ensure that suppliers adhere to our high standards of social and environmental responsibility, we also have a global responsible sourcing program. Under our supplier contracts, our suppliers are obligated to ensure that their products comply with applicable international, federal, state and local laws. These contracts also require compliance with our responsible sourcing standards, which cover a variety of expectations across multiple areas of social compliance, including supply chain transparency, compliance with applicable laws and regulations addressing prohibitions on child and forced labor, health and safety, environmental matters, compensation, and hours of work. To drive accountability with our suppliers, our standard supplier buying agreement includes a factory audit right related to these standards, and we conduct factory audits and compliance visits with non-Canada and non-U.S. suppliers of private branded and direct import products. Our 2023 Responsible Sourcing Report, available on our website at https://corporate.homedepot.com under “Responsibility > Sourcing Responsibly,” provides more information about this program. In addition, we have both quality assurance and engineering resources dedicated to establishing criteria and overseeing compliance with safety, quality and performance standards for our private branded products.
Intellectual Property
Our business has one of the most recognized brands in North America. As a result, we believe that The Home Depot® trademark has significant value and is an important factor in the marketing of our products, e-commerce, stores and business. We have registered or applied for registration of trademarks, service marks, copyrights and internet domain names, both domestically and internationally, for use in our business, including our proprietary brands such as HDX®, Husky®, Hampton Bay®, Home Decorators Collection®, Glacier Bay®, Vigoro®, Everbilt® and Lifeproof®. The duration of trademark registrations varies from country to country. However, trademarks are generally valid and may be renewed indefinitely as long as they are in use and/or their registrations are properly maintained.
We also maintain patent portfolios relating to our business operations, retail services, and products, and we seek to patent or otherwise protect innovations we incorporate into our business. Patents generally have a term of twenty years from the date they are filed. As our patent portfolio has been built over time, the remaining terms of the individual patents across our patent portfolio vary. Although our patents have value, no single patent is essential to our business. We continuously assess our merchandising departments and product lines for opportunities to expand the assortment of products offered within The Home Depot’s portfolio of proprietary and exclusive brands.
COMPETITION AND SEASONALITY
Our industry is highly competitive, fragmented, and evolving. As a result, we face competition for customers for our products and services from a variety of retailers, suppliers, service providers, and distributors and manufacturers that sell products directly to their respective customer bases. These competitors range from traditional brick-and-mortar, to multichannel, to exclusively online, and they include a number of other home improvement retailers; local,
| Fiscal 2023 Form 10-K | 3 | |
regional and national hardware stores; electrical, plumbing and building materials supply houses; and lumber yards. With respect to some products and services, we also compete with specialty design stores, showrooms, discount stores, paint stores, specialty and mass digital retailers, warehouse clubs, MRO distributors, home décor retailers, and other retailers, as well as with providers of home improvement services and tool and equipment rental. The internet facilitates competitive entry, price transparency, and comparison shopping, increasing the level of competition we face.
Both in-store and online, we compete primarily based on customer experience, price, quality, product availability and assortment, and delivery options. We also compete based on store location and appearance, presentation of merchandise, and ease of shopping experience. Our Pros also look for dedicated sales support, competitive credit and pricing options, project planning tools, and product depth and job lot quantities, particularly for their complex purchase needs. Furthermore, with respect to delivery options, customers are seeking faster and/or guaranteed delivery times, low-price or free shipping, and/or convenient pickup options. Our ability to be competitive on delivery and pickup times, options and costs depends on many factors, including the success of our supply chain investments, described more fully under “Our Supply Chain” below.
Our business is subject to seasonal influences. Generally, our highest volume of sales occurs in our second fiscal quarter, as we move into the spring season in the regions in which we operate.
INTERCONNECTED SHOPPING EXPERIENCE
We continue to enhance our capabilities to provide our customers with a frictionless interconnected shopping experience across our stores, online, on the job site, and in their homes, focusing on continued investments in our website and mobile apps to enhance the digital customer experience.
Digital Experience
Enhancements to our digital properties are critical for our increasingly interconnected customers, who often research products and check available inventory online before going into one of our stores to view products in person or talk to an associate and then making their purchase either in store or online. While in the store, customers may also go online to access ratings and reviews, compare prices, view our extended assortment, and purchase additional products. Our investments in a truly interconnected experience are focused on bringing together the power of our physical retail presence and the frictionless interaction of our digital capabilities.
A significant majority of the traffic in our digital channels is on mobile devices. Mobile customers expect more simplicity and relevancy in their digital interactions. As a result, we have made investments in our digital properties to improve the overall presentation and ease of navigation for the user. We have also enhanced the “shopability” of an online product by including more information on the product’s landing page, including related products and/or parts of a collection, as well as various fulfillment options. We believe our focus on improving search capabilities, site functionality, category presentation, product content, speed to checkout, and fulfillment options has yielded higher traffic, better conversion and continued sales growth.
Further, we do not view the interconnected shopping experience as a specific transaction; rather, we believe it encompasses an entire journey from inspiration and know-how, to purchase and fulfillment, to post-purchase care and support. Customers expect more personalized messaging, so we are continuing to focus on connecting marketing activities with the online and in-store experiences to create seamless engagement across channels. From the inspirational point of the purchase journey to providing product know-how, we continue to invest in the infrastructure and capabilities needed to deliver the most relevant marketing messages to our customers based on what is important to them today.
Store Experience
Our stores remain the hub of our business, and we continue to invest to improve the customer shopping experience through easier navigation and increased convenience and speed of checkout. In fiscal 2023, we continued to leverage the investments made in our stores over the past several years to operate effectively and meet customer expectations. These investments included wayfinding signage and store refresh packages; self-service lockers, online order storage areas and curbside service to enable convenient online order pickup options; electronic shelf label capabilities; and the re-design of front-end areas, including reconfigured service desks, improved layouts in checkout areas, and expanded and enhanced self-checkout options. We have also empowered our customers with additional self-help tools, including mobile app-enabled store navigation. Our app provides store-specific maps, which allow customers to pinpoint the exact location of an item on their mobile devices. Finally, we have also invested in compensation enhancements for our front-line associates, which we believe are contributing to lower attrition, increased associate engagement, and fewer safety incidents in our stores. We believe these investments
| Fiscal 2023 Form 10-K | 4 | |
are driving higher customer satisfaction scores, and we will continue to invest to improve the customer experience. In addition, we have identified areas that have experienced significant population growth or where market voids exist, and in fiscal 2023 we initiated a plan to open approximately 80 new stores over a five-year period to address those opportunities. These new stores will help relieve pressure at existing high-volume stores and add stores in areas with less store coverage, helping us to improve the customer experience and drive revenue growth.
Investing in Associate Productivity. We continually strive to improve our store operations to remove complexity and inefficient processes, allowing our associates to spend more of their time serving our customers. To this end, we have continued to focus on process improvements like optimizing product flow to improve on-shelf product availability and thus decrease the amount of time store associates spend locating products; creating a simpler order management system; expanding in-aisle, real-time mobile learning tools for our associates’ own development and to assist with customer questions; and using labor model tools to better align associate activity with customer needs. For a number of years, our associates have used web-enabled handheld devices to help them more efficiently meet the needs of the business and serve customers. Our current generation of these digital “hdPhone” devices offers enhanced functionality that allows associates to readily query inventory, access applications that support customer service, and assist with locating products. Our hdPhones also give our U.S. store associates access to Sidekick, an application that directs associates to bays where product is low or out of stock and helps our associates prioritize the highest value tasks more effectively. To further support productivity, in fiscal 2023 we rolled out Computer Vision in our U.S. stores, which provides greater visibility into where product is located, including both on the shelves and in the overhead space, enabling strategically-directed tasking and improving on-shelf availability.
Investing in Safety. We remain committed to maintaining a safe shopping and working environment for our customers and associates. We accomplish this by creating a strong culture of safety, building on our core value of Taking Care of Our People, that starts from the top with engaged leaders who empower associates to make decisions that prioritize the safety of everyone. We use data to identify areas of greatest risk, including emerging risks, and invest in tools, equipment and technology to reduce those risks in our packaging, processes, and behaviors. Our associate training and awareness initiatives target individual roles and responsibilities, integrating with overall strategies that promote physical and psychological safety and mental wellness.
We empower trained EH&S associates to continuously evaluate, develop, implement and enforce policies, processes and programs in our stores, facilities and offices across the Company. Our EH&S policies are woven into our everyday operations for site, district and regional teams, and integrate with operating platforms to provide safety line-of-sight to all leaders and associates. Common program elements include daily store inspection checklists; routine follow-up audits from our store-based safety team members; preventative maintenance programs to promote equipment and physical space safety; and departmental merchandising safety standards.
OUR SUPPLY CHAIN
We continue to focus on building best-in-class competitive advantages in our supply chain to be responsive to our customers’ expectations for how, when and where they choose to receive our products and services. As part of enhancing the interconnected shopping experience, we continue to invest in our supply chain network, with the goal of achieving the fastest, most efficient and most reliable delivery capabilities in home improvement. Our efforts are focused on ensuring product availability and increasing the speed and reliability of delivery for our customers while managing our costs. Our supply chain investments have helped us to operate effectively and meet our customers’ needs, even with the challenging environment over the past few years.
We centrally forecast and replenish the vast majority of our store products through sophisticated inventory management systems and utilize our network of distribution centers to serve both our stores’ and customers’ needs. Our supply chain includes multiple distribution center platforms in the U.S., Canada, and Mexico tailored to meet the needs of our stores and customers based on types of products, location, transportation, and delivery requirements. These include rapid deployment centers, stocking distribution centers, bulk distribution centers, flatbed distribution centers, and direct fulfillment centers, among others. Over the past several years, we have invested to further automate and mechanize our rapid deployment center network to drive greater efficiency and faster movement of product.
We are also continuing to enhance our supply chain network, with our expanded fulfillment facilities designed to drive speed and reliability of delivery for our customers. In many markets we offer same day or next day delivery of a multitude of products through our stores and fulfillment centers. We also have omni-channel fulfillment centers, which deliver product directly to customers, and market delivery operations, which function as local hubs to consolidate freight for dispatch to customers for the final mile of delivery, with a focus on appliances. We met our goals to control more of our appliance delivery end-to-end and manage all of our appliance delivery volume through our market delivery operations in fiscal 2022, and in fiscal 2023, we continued to invest in these capabilities,
| Fiscal 2023 Form 10-K | 5 | |
including expansion of our last mile delivery capacity. We have also opened additional flatbed distribution centers, which handle large items like lumber and building materials that are transported on flatbed trucks. Our network is designed to create a competitive advantage with unique, industry-leading capabilities for home improvement needs for both our Pros and consumers. We will continue to invest in our supply chain network as needed to support our business.
In addition to our distribution and fulfillment centers, we leverage our stores as a network of convenient customer pickup, return, and delivery fulfillment locations. Our premium real estate footprint provides a distinct structural and competitive advantage. For customers who shop online and want to pick up or return merchandise at a store, or have it delivered from a store, we have four interconnected retail programs: BOSS, BOPIS, BODFS, and BORIS. We also provide curbside pickup to complement our BOPIS offerings, in addition to the self-service lockers at the front entrance of many of our stores. We also offer car and van delivery service from the majority of our U.S. stores. For fiscal 2023, approximately 50% of our U.S. online orders were fulfilled through a store. We also continue to focus on developing new capabilities to improve both efficiency and customer experience for delivery from our stores. Our strategic intent is to have a portfolio of efficient, timely and reliable sources and methods of delivery to choose from, optimizing order fulfillment and delivery based on customer needs, inventory locations, and available transportation options.
CORPORATE RESPONSIBILITY AND HUMAN CAPITAL MANAGEMENT
We view corporate responsibility matters through the lens of our business, with an understanding that if we support our associates, our customers, our supplier partners, and the communities we serve, we also support our business and create long-term value for our shareholders. As a result, we believe that what is commonly called ESG today is fundamentally embedded in our operations and culture. We organize our efforts around three pillars: (1) Focus on Our People, (2) Operate Sustainably, and (3) Strengthen Our Communities. Highlights of each of these pillars are set forth below. For further information on our three pillars and other ESG-related matters, see our annual ESG Report, available on our website at https://corporate.homedepot.com/responsibility.
Focus on Our People
Our culture and our associates provide intangible and hard-to-replicate competitive advantages, which have been key to helping us navigate challenging market conditions. Our associates are essential to providing the experience and service that our customers demand. To preserve and protect that customer experience, we focus on cultivating a compelling associate experience, which we believe supports our ability to attract and retain our associates. This includes investing in competitive wages and benefits while also providing the culture, tools, training and development opportunities that make working at The Home Depot an enjoyable and rewarding experience. These actions are the foundation of our key tenets of putting customers first and taking care of our associates.
Culture and Values. The Home Depot has a strong commitment to ethics and integrity, and we are a values- and culture-centric business. Our commitment to our core values drives our approach to human capital management. Our culture is based on our servant leadership philosophy represented by the inverted pyramid, which puts primary importance on our customers and our associates by positioning them at the top, with senior management at the base in a support role. We bring our culture to life through our core values, which serve as the foundation of our business and as the guiding principles behind the decisions we make every day.


Our values also guide our efforts to create an environment that will help us attract and retain skilled associates in the competitive marketplace for talent. We empower our associates to deliver a superior customer experience by living our values, and we position our associates to embody our core values by integrating the importance of our culture into ongoing development programs and rewards programs. Leaders participate in programs designed to
| Fiscal 2023 Form 10-K | 6 | |
build and strengthen our culture, such as training on leadership skills, cross-functional collaboration, inclusiveness, and associate engagement, and associates receive training on unconscious bias. Our core values are at the root of our human capital management programs.
Our Workforce. At the end of fiscal 2023, we employed approximately 463,100 associates, of whom approximately 46,200 were salaried, with the remainder compensated on an hourly basis. Set forth below is the geographic makeup of our workforce:
| Geographic Location | Number of Associates | % of Total Workforce | ||||||||||||
| United States | 411,200 | 88.8 | % | |||||||||||
| Canada | 33,800 | 7.3 | % | |||||||||||
| Mexico | 17,800 | 3.8 | % | |||||||||||
| Other (1) | 300 | 0.1 | % | |||||||||||
| Total | 463,100 | 100% | ||||||||||||
————
(1) Includes associates in our sourcing organization located in China, Vietnam, India, Italy, Poland and Turkey.
Talent Attraction and Development. As we attract and hire new associates, we strive to create a customer-like experience for jobseekers by focusing on speed and personalization as they progress through the steps of our recruiting process. We employ targeted marketing practices through our careers website, which personalizes the user’s experience based on jobseeker location and searching behavior. Jobseekers can also apply for roles from anywhere using desktop or mobile devices. Once a jobseeker has applied for a role and has been selected to move forward in the recruiting process, we provide self-service for many of our positions by allowing candidates to schedule or reschedule pre-hire activities directly from their mobile device. Lastly, we created a quick hiring process for select roles by matching candidates to jobs that fit their needs.
We offer all of our associates the opportunity to benefit from robust development opportunities. Our Home Depot University, or “HDU,” program, is a key part of this development, offering relevant content through multiple platforms, including instructor-led classes, e-learning, mobile learning, and additional online resources. We also invest in ongoing growth and development by providing coaching through continuous leader support and empowering our associates to learn new skills at their own pace through mobile applications our associates can access at any time. We equip our leaders with the tools they need to develop themselves and their teams through several programs designed to help them lead inclusively, empower their teams, and serve as mentors for our associates.
We also continue to work to ensure our store leadership structure supports both associate development and engagement as well as alignment across our organization. In fiscal 2023, we continued to refine the updated store leadership structure established in fiscal 2022, which created new management positions in our stores focused on the customer service experience, increasing the number of managers on the floor at any given time. This structure frees up time for other store leaders to devote to associate training and development. The result is an improved customer and associate experience, while also providing new career paths for associates. In fiscal 2023, we also announced changes to our senior leadership structure to better align the outside sales and service team with the global store organization, so that both outside sales and store associates can better serve our Pros.
Associate Engagement. Associate engagement is the emotional commitment associates have to The Home Depot. It is vital to our culture and to our success. We create an engaging workplace by continuously listening to and acting on associate feedback. We provide several pulse check surveys to associates throughout the year that help us determine how emotionally connected those associates are to our customers, the Company, their jobs, fellow associates, and leaders. In addition, our annual Voice of the Associate survey, which includes all associates, serves as our primary means of gauging associates’ level of engagement within their roles. We use the feedback from these surveys to help improve the overall associate experience. We also maintain a digital associate engagement platform that links associates with common interests and fuels connections to co-workers and Company leaders. Additionally, we have a number of programs to recognize stores and individual associates for exceptional customer service and demonstrating our core values.
Diversity, Equity and Inclusion. Guided by our core values and grounded in our culture, we believe that having a diverse, equitable and inclusive Company is key to our success. We strive to maintain a Company where our associates are valued and respected and feel a sense of belonging in the workplace, so that they can provide the customer experience that supports our business and the communities we serve. Our Office of Diversity, Equity and Inclusion (“DEI”) supports our DEI engagement efforts with our associates, suppliers, and communities.
| Fiscal 2023 Form 10-K | 7 | |
Below is the fiscal 2023 demographic data for our U.S. associates:
| Associate Population | Race/Ethnicity | Gender | ||||||||||||||||||||||||||||||||||||
| % Minority | % White | % Undisclosed | % Female | % Male | % Undisclosed | |||||||||||||||||||||||||||||||||
| U.S. Workforce | 49% | 49% | 2% | 37% | 62% | 1% | ||||||||||||||||||||||||||||||||
| U.S. Managers & Above (1) | 39% | 60% | 1% | 35% | 65% | 1% | ||||||||||||||||||||||||||||||||
| U.S. Officers | 25% | 74% | 1% | 31% | 68% | 1% |
————
(1) Does not include officers.
Note: Certain percentages may not sum to totals due to rounding.
As a Company, we have identified several priorities designed to guide our efforts to enhance diversity, equity and inclusion. We believe these associate-, supplier- and community-focused priorities will further enhance our customers’ experience and make a sustainable difference within the workplace, marketplace, and community:
- Associate Engagement
◦Consider inclusivity throughout our organization and create an environment where every associate feels included and valued for who they are
◦Promote equal opportunity in recruitment, hiring, training, development and advancement
- Supplier Diversity
◦Increase visibility into our spend with diverse suppliers, including diverse subcontractors
◦Increase the pipeline of diverse suppliers to be considered for engagement
- Community Engagement
◦Partner with organizations on programs designed to close the wealth gap
◦Support programs that advance education for all
Compensation and Benefits. Consistent with our core values, we take care of our people by offering competitive compensation and comprehensive benefits programs. We continuously make wage investments to ensure our compensation packages reflect the evolving circumstances across our markets. Our profit-sharing program for hourly associates also provides semi-annual cash awards for performance against our business plan. Our associates can take advantage of a range of benefits, including healthcare and wellness programs, vacation and leave of absence benefits including parental leave and paid sick/personal time off, a 401(k) match, our ESPPs, personal finance education and advisory services, assistance programs to help with managing personal and work-life challenges, family support programs, and educational assistance.
Operate Sustainably
We have a long-standing commitment to reduce the impact that our operations and products have on the environment, which we believe helps make our business stronger, more agile, and more resilient. This approach extends from the products and services we offer to our customers; to our store construction, maintenance and operations; to our supply chain and packaging initiatives; to our ethical sourcing program. As we strive to operate sustainably, we have focused on efforts that help protect the climate, reduce our environmental impact, and source products responsibly, and we have set goals to drive progress in these areas.
Our 2023 ESG Report, available on our website at https://corporate.homedepot.com/responsibility, includes more information on our goals, as well as specific initiatives we have in place to help achieve these goals. In order to progress against our goals to reduce our environmental footprint, we have a number of environmentally focused programs and initiatives.
Science-Based Targets for Emissions Reductions. In fiscal 2023, we submitted new reduction goals to the Science Based Targets initiative (SBTi) to reduce Scope 1, 2 and 3 emissions in line with the Paris Agreement goals, and we further enhanced our goal for Scope 3 emissions reductions in early fiscal 2024. We now plan to reduce our combined absolute Scope 1 and 2 emissions and our absolute Scope 3 Category 11 (“Use of Sold Products”) emissions by 42%, each by the end of fiscal 2030 from a fiscal 2020 base year. The SBTi has validated that our enhanced goals conform with its criteria and has determined that our Scope 1 and 2 target is in line with a 1.5-degree Celsius trajectory. Adoption of these SBTi-approved goals builds on and supersedes our previous science-based goals to reduce Scope 1 and 2 carbon emissions by 2.1% per year, to achieve a 40% reduction by the end of fiscal 2030 and a 50% reduction by the end of fiscal 2035.
| Fiscal 2023 Form 10-K | 8 | |
Store Operations and Renewable/Alternative Energy. We have reduced U.S. store electricity consumption through initiatives such as LED lighting upgrades; installation of energy-efficient HVAC systems; and participation in demand mitigation. We have also invested in on-site alternative or renewable energy projects such as fuel cells and solar panels and contracts with off-site wind and solar power providers. We have continued to work toward our goal to produce or procure renewable electricity equivalent to the electricity needs for all Home Depot facilities by the end of fiscal 2030.
Product Offerings. Through our Eco ActionsTM program, we have helped our customers more easily identify products related to five areas: carbon emissions, circularity, responsible chemistry, sustainable forestry, and water use. Under our Eco Actions program, we sell ENERGY STAR® certified appliances; WaterSense®-labeled bath faucets, showerheads, aerators, toilets, and irrigation controllers; LED light bulbs; tankless water heaters; and many other products. These products, through proper use, help our customers save money on their utility bills and reduce their environmental impact, and in fiscal 2023 we set new goals for customer savings on energy costs and reduced water usage through purchases of these products. In fiscal 2023, we also announced a goal that by the end of fiscal 2028, 85% of our U.S. and Canada in-store and online sales of push mowers and handheld outdoor power equipment will be powered by rechargeable battery technology. Through Eco Actions, we also provide customers with resources, such as project tutorials, to take individual action on environmental issues.
In-Store Recycling Programs. We offer customer-facing recycling programs in the U.S., including in-store recycling programs for compact fluorescent light bulbs, rechargeable batteries, and lead acid batteries.
Chemical Strategy. We are committed to increasing our assortment of products that meet high environmental standards, and we encourage our suppliers to invest in developing environmentally innovative products. We periodically evaluate our Chemical Strategy to ensure our approach and goals are appropriate. In fiscal 2023, we updated our Chemical Strategy to include a new goal to not allow added PFAS (Perfluoroalkyl and Polyfluoroalkyl Substance) chemicals in our new private-brand patio and home décor products sold in our U.S. and Canada stores by the end of fiscal 2025.
Sustainable Packaging. In addition to our goal related to eliminating expanded polystyrene foam (EPS) and polyvinyl chloride (PVC) film from new packaging for our private-brand products sold in U.S. and Canada stores and online, we are continually working with our suppliers to find ways to make product packaging more recyclable or simply use less material, such as through the reduction of single-use plastics. In fiscal 2023, we also announced a new goal that all private brand fiber packaging for new SKUs in our U.S. and Canada stores and online will be compostable, recyclable or recycled content by the beginning of fiscal 2027.
Supply Chain Optimization. Through our supply chain initiatives such as space sharing and optimization technology, we are working to maximize our use of every mile to make our supply chain more efficient.
CDP Participation. We are a long-standing participant in the annual CDP Climate Change disclosure process. CDP is an independent, international, not-for-profit organization providing a global system for companies and cities to measure, disclose, manage, and share environmental information. In February 2024, we received a score of “A-” from CDP on our Climate Change submission, reflecting leadership and an improved level of action on climate change. We began participating in CDP’s Forests disclosure process in fiscal 2023, receiving a score of “C” on our first submission, indicating awareness of how these issues intersect with our business.
Over the past several years, our commitment to sustainable operations has resulted in a number of environmental awards and recognitions. In 2023, we received the following awards: an EPA WaterSense® Partner of the Year Award for our commitment to offering and promoting water-efficient products; an EPA Safer Choice Partner of the Year Award, which recognizes achievement in products with safer chemicals that furthers innovative source reduction; and an EPA ENERGY STAR® Partner of the Year Award for our contribution to promoting energy efficiency.
Strengthen our Communities
One of our core values is “Giving Back,” and we support our communities in a number of ways. The Home Depot Foundation focuses on improving the homes and lives of U.S. veterans, assisting communities affected by natural disasters, and training skilled tradespeople to fill the labor gap. The Company and The Home Depot Foundation are partnering with industry leaders on training programs to train the next generation of skilled tradespeople and help them find careers in the home improvement industry through our Path to Pro program, which includes a career networking site to connect skilled tradespeople to industry Pros. Our Team Depot associate volunteers also extend the mission of The Home Depot Foundation in communities across the country, donating thousands of volunteer hours each year to serve the needs of our communities.
| Fiscal 2023 Form 10-K | 9 | |
We partner with a variety of suppliers and organizations to further support our DEI efforts. As noted above, our Office of DEI partners with community organizations on programs designed to close the wealth gap and enhance education outcomes across a broad range of communities. We are working to cultivate a supplier base that creates long-lasting growth and mutual business success, while strengthening the communities in which our customers and associates live.
Please see our 2023 ESG Report for additional information about our efforts to support the communities we serve.
GOVERNMENT REGULATION
As a company with both U.S. and international operations, we are subject to the laws of the U.S. and foreign jurisdictions in which we operate and the rules and regulations of various governing bodies, which may differ among jurisdictions. Compliance with these laws, rules and regulations has not had, and is not expected to have, a material effect on our capital expenditures, results of operations, or competitive position as compared to prior periods.
AVAILABLE INFORMATION
Our internet website is www.homedepot.com. We make available on the Investor Relations section of our website, free of charge, our Annual Reports to shareholders, Annual Reports on Form 10-K, Quarterly Reports on Form 10-Q, Current Reports on Form 8-K, Proxy Statements, and Forms 3, 4 and 5, and amendments to those reports, as soon as reasonably practicable after filing such documents with, or furnishing such documents to, the SEC.
We include website addresses throughout this report for reference only. The information contained on these websites is not incorporated by reference into this report.
Item 1A. Risk Factors.
Our business, results of operations, and financial condition are subject to numerous risks and uncertainties. In connection with any investment decision with respect to our securities, you should carefully consider the following risk factors, as well as the other information contained in this report and our other filings with the SEC. Additional risks and uncertainties not presently known to us or that we currently deem immaterial may also impair our business operations. Should any of these risks materialize, our business, results of operations, financial condition and future prospects could be negatively impacted, which in turn could affect the trading value of our securities. You should read these Risk Factors in conjunction with Part II, Item 7. Management’s Discussion and Analysis of Financial Condition and Results of Operations and our consolidated financial statements and related notes in Item 8.
STRATEGIC RISKS
Strong competition could adversely affect prices and demand for our products and services and could decrease our market share.
Our industry is highly competitive, highly fragmented, and evolving. As a result, we face competition for customers for our products and services from a variety of retailers, suppliers, service providers, and distributors and manufacturers that sell products directly to their respective customer bases.
These competitors range from traditional brick-and-mortar, to multichannel, to exclusively online, and they include a number of other home improvement retailers; local, regional and national hardware stores; electrical, plumbing and building materials supply houses; and lumber yards. With respect to some products and services, we also compete with specialty design stores, showrooms, discount stores, paint stores, specialty and mass digital retailers, warehouse clubs, MRO distributors, home décor retailers, and other retailers, as well as with providers of home improvement services and tool and equipment rental. The internet facilitates competitive entry, price transparency, and comparison shopping, increasing the level of competition we face.
We compete primarily based on customer experience; price; quality; product availability, assortment, and innovation; and delivery options, both in-store and online. We also compete based on store location and appearance, presentation of merchandise, and ease of shopping experience throughout every step of the project, from inspiration and research to any post-purchase support. Our Pros also look for dedicated sales support, competitive credit and pricing options, project planning tools, product depth and job lot quantities, particularly for their complex purchase needs. Furthermore, customers are increasingly shopping online and seeking faster and/or guaranteed delivery times, low-price or free shipping, and/or convenient pickup options. Our ability to be competitive on delivery and pickup times, options and costs depends on many factors, including leveraging the momentum of our investments in our supply chain and our interconnected retail capabilities to further enhance the customer shopping experience. Failure to successfully manage these factors and offer competitive delivery and pickup options could negatively impact our profit margins and the demand for our products.
| Fiscal 2023 Form 10-K | 10 | |
We use our marketing, advertising and promotional programs to drive customer traffic and compete more effectively, and we must regularly assess and adjust our efforts to address changes in the competitive landscape. Intense competitive pressures from one or more of our competitors, such as through aggressive promotional pricing or liquidation events, or our inability to adapt effectively and quickly to a changing competitive landscape, could adversely affect our prices, our margins, or demand for our products and services. If we are unable to timely and appropriately respond to these competitive pressures, including through the delivery of a superior interconnected customer experience or through maintenance of effective sales and marketing, advertising or promotional programs leveraging both our digital and physical platforms, our market share and our financial performance could be adversely affected. In fiscal 2023 we also continued to operate in an inflationary and rising interest rate environment, and the long-term outlook is difficult to predict. If we experience inflation or deflation at a level beyond our ability to respond effectively, we may not be able to adjust prices to sufficiently offset the effects without negatively impacting consumer demand or margins, as applicable, or it may adversely affect our ability to compete based on price.
We may not timely identify or effectively respond to consumer needs, expectations or trends, which could adversely affect our relationship with our customers, the demand for our products and services, and our market share.
The success of our business depends in part on our ability to identify and respond promptly to evolving trends in demographics; shifts in consumer preferences, expectations and needs; changes in the macroeconomic environment; and unexpected weather conditions, natural disasters, or public health issues (including pandemics and related impacts) that impact our customers, while also managing appropriate inventory levels in our stores and distribution or fulfillment centers and maintaining an excellent customer experience. It is difficult to successfully predict the products and services our customers will demand. As our customers expect a more personalized experience, our ability to collect, use, retain, and protect relevant customer data is important to our ability to effectively meet their expectations. Our ability to collect and use that data, however, is subject to a number of external factors, including the impact of legislation or regulations governing data privacy, data-driven technologies such as artificial intelligence, and data security, as well as customer expectations around data collection, retention, and use. In addition, each of our primary customer groups has different needs and expectations, many of which evolve as the demographics in a particular customer group change. Customer preferences and expectations related to sustainability of products and operations are also changing. In addition, as the impacts of COVID-19 have subsided, customers have shifted more of their spending back to travel, dining and other experiences, compared to the historic levels of home improvement spending we saw during the heights of the pandemic. If we do not successfully differentiate the shopping experience to attract our customers and meet their individual needs and expectations, it may adversely impact our sales or our market share.
Customer expectations about the methods by which they purchase and receive products or services are also becoming more demanding. Customers routinely and increasingly use technology and a variety of electronic devices and digital platforms to rapidly compare products and prices, read product reviews, determine real-time product availability, and purchase products, and new channels and tools to expand the customer experience appear and change rapidly. Our Pros also look for additional capabilities, including dedicated sales support, competitive credit and pricing options, project planning tools, and product depth and job lot quantities, particularly for their complex purchase needs. Once products are purchased, customers seek alternate options for delivery of those pro
Showing the first 8K of 73K characters. Open the full section
Item 1B. Unresolved Staff Comments.
Not applicable.
Item 1C. Cybersecurity.
Risk Management and Strategy
We recognize the importance of assessing, identifying, and managing material risks associated with cybersecurity threats. We have implemented cybersecurity processes, technologies, and controls to aid in our efforts to assess, identify, and manage such risks. Our cybersecurity program prioritizes threat mitigation, while focusing on maintaining the integrity and resilience of our systems. We leverage the National Institute of Standards and Technology (“NIST”) Cybersecurity Framework as guidelines in the development of our cybersecurity program. We also adhere to applicable Payment Card Industry Data Security Standards. The cybersecurity risk management process and related governance processes are integrated into our broader enterprise risk management framework, which is designed to appropriately identify, prioritize, manage, and oversee risks.
Overseeing our cybersecurity efforts on a day-to-day basis is our cybersecurity team, led by our Chief Information Security Officer (“CISO”). Our cybersecurity team, in partnership with third parties, designs and implements our data security and cybersecurity programs, risk assessments, monitoring procedures, and training programs for our associates. We continue to make investments to enhance our ability to identify, protect from and detect security risks within our environment.
Monitoring and Mitigation. We maintain a range of tools and services to aid in and inform our monitoring and mitigation of cyber risks. Throughout the year, internal teams conduct targeted audits and penetration tests. We engage third parties to independently evaluate our cybersecurity maturity on an annual basis and perform a risk assessment, as well as to provide expertise as needed on various cybersecurity programs and issues. We maintain a security operations center that is staffed around the clock to detect, mitigate, and respond to cyber threats. In the event we identify a cybersecurity incident, we have defined procedures to respond to and recover from such incident as quickly as possible. Our policies and procedures are reviewed periodically to ensure they remain aligned with current regulatory requirements and the current threat landscape. We also have established classification and retention policies focused on limiting the risk of unauthorized exposure of customer, associate, and business data. We maintain cybersecurity insurance to help provide protection against losses arising from significant security incidents.
The Company has an Incident Response Team (“IRT”), a cross-functional group with the expertise, authority and resources to act quickly, efficiently and appropriately to investigate, coordinate the response to, remediate, and communicate regarding a cybersecurity incident. The IRT uses a detailed incident response plan that outlines and coordinates the actions we take to prepare for, detect, respond to and recover from cybersecurity incidents, which include processes to triage, assess the severity of, escalate, contain, investigate, and remediate an incident, as well as to comply with potentially applicable legal obligations and mitigate brand and reputational damage. In addition, our IRT engages in tabletop exercises at least annually to simulate a response to a cybersecurity incident and uses the findings to improve our processes, plans and technologies.
Training. We provide data security and privacy awareness and training to all associates upon hire and on an annual basis, with additional customized, role-based training provided to targeted internal audiences. In addition, we conduct periodic awareness campaigns and regular phishing email simulation tests to reinforce our new-hire and annual training and promote ongoing awareness of risks.
Vendor Security. We have a vendor risk management program that works to classify service provider or business partner risk based on several factors, including but not limited to data type accessed and/or retained. Using a risk-based approach, we perform diligence and security risk assessments for certain vendors and service providers and include appropriate obligations in our contractual arrangements.
Cybersecurity Risks. We have not experienced any material cybersecurity incidents in the past fiscal year. We face risks from cybersecurity threats that, if realized, may materially affect our business strategy, results of operations or financial condition. Despite our efforts, we cannot provide full assurance that our cybersecurity risk management processes will be fully implemented, complied with or effective in preventing or mitigating future cybersecurity risks. We describe whether and how risks from identified cybersecurity threats, including as a result of any previous cybersecurity incidents, have materially affected or, if realized, are reasonably likely to materially affect us, including our business strategy, results of operations, or financial condition, in Part I, Item 1A. “Risk Factors”.
| Fiscal 2023 Form 10-K | 22 | |
Governance
Our efforts to create a secure digital environment start with the governance and oversight of our data security and privacy policies and strategy. At the Board level, cybersecurity is overseen by the full Board and by the Board’s Audit Committee, which has primary responsibility for overseeing cybersecurity and privacy risks. At least quarterly, the Board and/or the Audit Committee receives reports on data protection and cybersecurity matters from senior information technology (“IT”) leaders, including our Chief Information Officer (“CIO”) and CISO, as well as the Chair of our Data Security and Privacy Governance Committee (discussed below). In addition, at least annually, our full Board holds a meeting dedicated to cybersecurity topics. Periodically, our Board receives presentations on cybersecurity matters from third-party cybersecurity experts.
Our CISO, who reports to our CIO, joined the Company in 2021 after working with the Company as a third-party consultant since 2019. During a nearly two-decade tenure at a leading professional services firm, he worked with clients on managing information security, developing cybersecurity strategy, and implementing effective information and cybersecurity programs and initiatives addressing emerging cybersecurity threats. Our CISO has significant prior cybersecurity experience, including experience protecting company, customer and associate data across a diverse set of industries. He holds a Bachelor of Science degree in Information Systems and has achieved several relevant certifications, including Certified Information Security Manager, Certified Information Systems Security Professional, and Certified Information Privacy Professional. Our CISO leads a team of over 500 associates focused on cybersecurity.
We have three management-level committees that support our cybersecurity, privacy and data governance efforts. They are led by our Data Security and Privacy Governance Committee, which provides management-level governance over cybersecurity matters, including discussion of cybersecurity priorities, emerging risks, awareness and training programs, risk mitigation efforts, and regulatory compliance. This committee is chaired by our Vice President – Internal Audit and Corporate Compliance and is composed of a cross-functional team of senior leaders, including our CEO. The committee generally meets quarterly and is supported by our Security and Technology Risk Leadership Committee and our Privacy and Data Governance Committee. The activities of the Data Security and Privacy Governance Committee are reported to the Audit Committee and/or the full Board by the Chair of the committee, as appropriate.
The Security and Technology Risk Leadership Committee provides leadership and oversight of our cybersecurity program. It is chaired by our CISO and composed of Company technology leaders as well as a cross-functional group of representatives from other departments. Our Privacy and Data Governance Committee provides leadership and oversight of our privacy and data governance programs. It is chaired by our Chief Privacy Officer and composed of a cross-functional group across approximately 20 departments. These committees generally meet monthly or every other month and report to the Data Security and Privacy Governance Committee on a regular basis.
Item 2. Properties.
The following table presents the percentage of our owned versus leased facilities in operation at the end of fiscal 2023, along with the total square footage:
| square footage in millions | Owned | Leased | Total Square Footage | ||||||||||||||
| Stores (1) | 89 | % | 11 | % | 242.3 | ||||||||||||
| Warehouses and distribution centers (2) | 3 | % | 97 | % | 111.5 | ||||||||||||
| Offices and other (3) | 31 | % | 69 | % | 4.8 | ||||||||||||
| Total | 358.6 |
—————
*(1)*Our owned stores include those subject to ground leases.
*(2)*We operated over 500 warehouses and distribution centers at the end of fiscal 2023.
*(3)*Our Store Support Center (corporate headquarters) is located in Atlanta, GA.
| Fiscal 2023 Form 10-K | 23 | |
The following table presents our U.S. store locations (including the Commonwealth of Puerto Rico and the territories of the U.S. Virgin Islands and Guam) at the end of fiscal 2023:
| U.S. | Stores | U.S. | Stores | U.S. | Stores | ||||||||||||||||||
| Alabama | 28 | Kentucky | 14 | Ohio | 70 | ||||||||||||||||||
| Alaska | 7 | Louisiana | 28 | Oklahoma | 16 | ||||||||||||||||||
| Arizona | 57 | Maine | 11 | Oregon | 27 | ||||||||||||||||||
| Arkansas | 14 | Maryland | 41 | Pennsylvania | 71 | ||||||||||||||||||
| California | 246 | Massachusetts | 45 | Puerto Rico | 10 | ||||||||||||||||||
| Colorado | 46 | Michigan | 70 | Rhode Island | 8 | ||||||||||||||||||
| Connecticut | 30 | Minnesota | 33 | South Carolina | 26 | ||||||||||||||||||
| Delaware | 9 | Mississippi | 14 | South Dakota | 1 | ||||||||||||||||||
| District of Columbia | 1 | Missouri | 34 | Tennessee | 39 | ||||||||||||||||||
| Florida | 158 | Montana | 6 | Texas | 183 | ||||||||||||||||||
| Georgia | 90 | Nebraska | 8 | Utah | 24 | ||||||||||||||||||
| Guam | 1 | Nevada | 21 | Vermont | 3 | ||||||||||||||||||
| Hawaii | 8 | New Hampshire | 20 | Virgin Islands | 2 | ||||||||||||||||||
| Idaho | 11 | New Jersey | 67 | Virginia | 50 | ||||||||||||||||||
| Illinois | 76 | New Mexico | 13 | Washington | 47 | ||||||||||||||||||
| Indiana | 24 | New York | 101 | West Virginia | 6 | ||||||||||||||||||
| Iowa | 10 | North Carolina | 40 | Wisconsin | 27 | ||||||||||||||||||
| Kansas | 16 | North Dakota | 2 | Wyoming | 5 | ||||||||||||||||||
| Total U.S. | 2,015 |
The following table presents our store locations outside of the U.S. at the end of fiscal 2023:
| Canada | Stores | Mexico | Stores | Mexico | Stores | ||||||||||||||||||
| Alberta | 27 | Aguascalientes | 2 | Nayarit | 1 | ||||||||||||||||||
| British Columbia | 26 | Baja California | 7 | Nuevo León | 14 | ||||||||||||||||||
| Manitoba | 6 | Baja California Sur | 2 | Oaxaca | 1 | ||||||||||||||||||
| New Brunswick | 3 | Campeche | 2 | Puebla | 5 | ||||||||||||||||||
| Newfoundland | 1 | Chiapas | 2 | Querétaro | 5 | ||||||||||||||||||
| Nova Scotia | 4 | Chihuahua | 6 | Quintana Roo | 4 | ||||||||||||||||||
| Ontario | 88 | Coahuila | 5 | San Luis Potosí | 2 | ||||||||||||||||||
| Prince Edward Island | 1 | Colima | 2 | Sinaloa | 5 | ||||||||||||||||||
| Quebec | 22 | Distrito Federal | 11 | Sonora | 5 | ||||||||||||||||||
| Saskatchewan | 4 | Durango | 2 | State of Mexico | 16 | ||||||||||||||||||
| Total Canada | 182 | Guanajuato | 5 | Tabasco | 1 | ||||||||||||||||||
| Guerrero | 2 | Tamaulipas | 5 | ||||||||||||||||||||
| Hidalgo | 1 | Tlaxcala | 1 | ||||||||||||||||||||
| Jalisco | 9 | Veracruz | 5 | ||||||||||||||||||||
| Michoacán | 4 | Yucatán | 2 | ||||||||||||||||||||
| Morelos | 3 | Zacatecas | 1 | ||||||||||||||||||||
| Total Mexico | 138 |
| Fiscal 2023 Form 10-K | 24 | |
Item 3. Legal Proceedings.
The Company is party to various legal proceedings arising in the ordinary course of its business, but is not currently a party to any legal proceeding that management believes will have a material adverse effect on our consolidated financial position or our results of operations.
SEC regulations require us to disclose certain information about proceedings arising under federal, state or local environmental regulations if we reasonably believe that such proceedings may result in monetary sanctions above a stated threshold. Pursuant to SEC regulations, the Company uses a threshold of $1 million for purposes of determining whether disclosure of any such proceedings is required.
As previously reported, in April 2021 we entered into a civil consent decree with the U.S. Department of Justice, the EPA, and the states of Utah, Massachusetts, and Rhode Island. The decree required certain changes to lead-safe work practices in our installation services business and provided for stipulated penalties for failure to perform by our third-party installers. In the first quarter of fiscal 2023, the EPA informed us that it believes we owe certain penalties for violations by our third-party installers of documentation requirements under the decree. We are engaged in discussions with the EPA regarding the basis for the stipulated penalties we allegedly owe under the decree. While we cannot predict the amount of stipulated penalties we may ultimately owe to the EPA under the decree, we do not expect it to have a material adverse effect on our consolidated financial condition, results of operations, or cash flows. Further, we expect to recoup any amount we ultimately owe from corresponding fines we levy against our third-party installers.
Item 4. Mine Safety Disclosures.
Item 5. Market for Registrant’s Common Equity, Related Stockholder Matters and Issuer Purchases of Equity Securities.
Since April 19, 1984, our common stock has been listed on the NYSE, trading under the symbol “HD.” We paid our first cash dividend on June 22, 1987 and have paid a cash dividend during each subsequent quarter. While we currently expect a cash dividend to be paid in the future, future dividend payments will depend on our earnings, capital requirements, financial condition, and other factors considered relevant by our Board of Directors.
At February 28, 2024, there were approximately 106,000 holders of record of our common stock and approximately 5,075,000 additional “street name” holders whose shares are held of record by banks, brokers, and other financial institutions.
STOCK PERFORMANCE GRAPH
The graph and table below present our cumulative total shareholder returns relative to the performance of the S&P Retail Composite Index and the S&P 500 Index for the five most recent fiscal years. The graph assumes $100 was invested at the closing price of our common stock on the NYSE and in each index on the last trading day of the fiscal year ended February 3, 2019 and assumes that all dividends were reinvested on the date paid. The points on the graph represent fiscal year-end amounts based on the last trading day in each fiscal year.
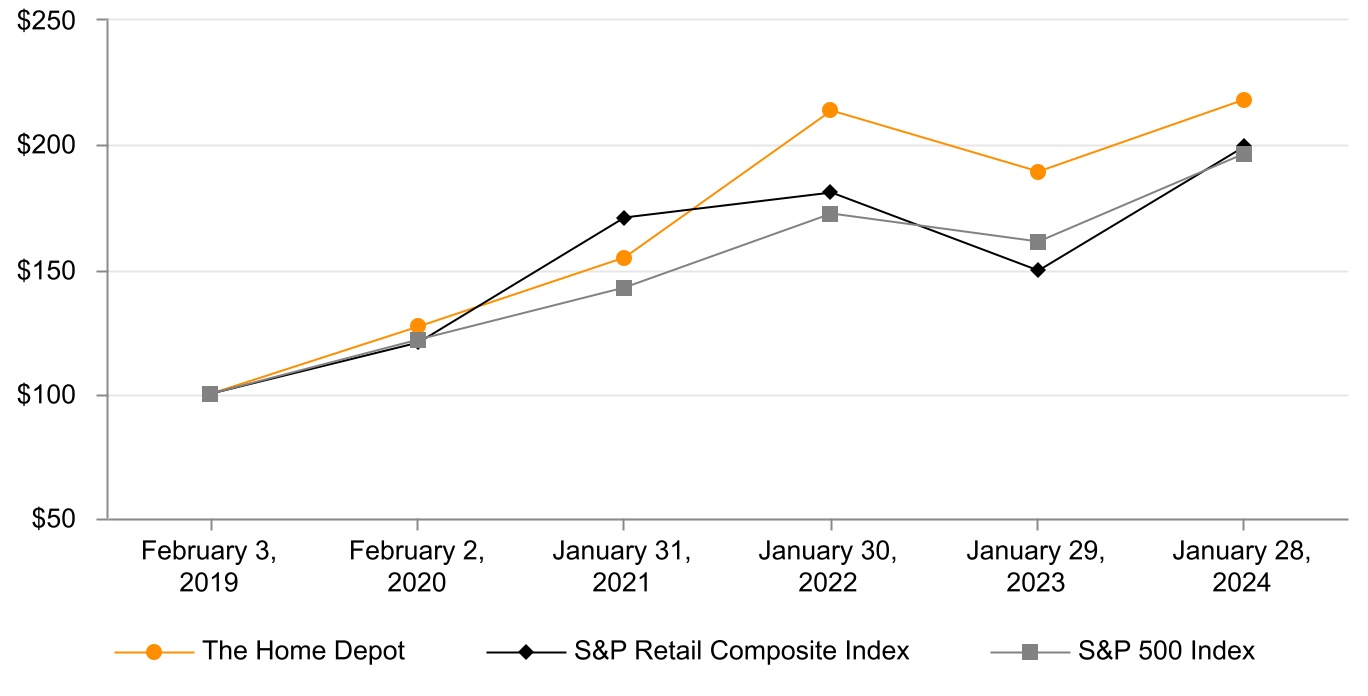
| Fiscal Year Ended | |||||||||||||||||||||||||||||||||||
| February 3, 2019 | February 2, 2020 | January 31, 2021 | January 30, 2022 | January 29, 2023 | January 28, 2024 | ||||||||||||||||||||||||||||||
| The Home Depot | $ | 100.00 | $ | 127.07 | $ | 154.49 | $ | 213.45 | $ | 189.05 | $ | 218.01 | |||||||||||||||||||||||
| S&P Retail Composite Index | 100.00 | 120.61 | 170.52 | 180.58 | 149.54 | 199.20 | |||||||||||||||||||||||||||||
| S&P 500 Index | 100.00 | 121.54 | 142.49 | 172.40 | 160.94 | 196.50 | |||||||||||||||||||||||||||||
| Fiscal 2023 Form 10-K | 26 | |
ISSUER PURCHASES OF EQUITY SECURITIES
The following table presents the number and average price of shares purchased in each fiscal month of the fourth quarter of fiscal 2023:
| Period | Total Number of Shares Purchased**(1)** | Average Price Paid Per Share**(1)(3)** | Total Number of Shares Purchased as Part of Publicly Announced Program**(2)** | Dollar Value of Shares that May Yet Be Purchased Under the Program**(2)(3)** | ||||||||||||||||||||||
| October 30, 2023 – November 26, 2023 | 1,556,247 | $ | 296.98 | 1,548,293 | $ | 13,296,250,745 | ||||||||||||||||||||
| November 27, 2023 – December 24, 2023 | 1,459,975 | 331.80 | 1,458,703 | 12,812,264,193 | ||||||||||||||||||||||
| December 25, 2023 – January 28, 2024 | 1,590,244 | 350.32 | 1,588,793 | 12,255,680,392 | ||||||||||||||||||||||
| 4,606,466 | 326.43 | 4,595,789 |
—————
*(1)*These amounts include repurchases pursuant to our Omnibus Stock Incentive Plan, as Amended and Restated May 19, 2022, and our 1997 Omnibus Stock Incentive Plan (collectively, the “Plans”). Under the Plans, participants surrender shares as payment of applicable tax withholding on the vesting of restricted stock. Participants in the Plans may also exercise stock options by surrendering shares of common stock that the participants already own as payment of the exercise price. Shares so surrendered by participants in the Plans are repurchased pursuant to the terms of the Plans and applicable award agreement and not pursuant to publicly announced share repurchase programs.
*(2)*On August 14, 2023, our Board of Directors approved a $15.0 billion share repurchase authorization that replaced the previous authorization of $15.0 billion, which was approved on August 18, 2022. The August 2023 authorization does not have a prescribed expiration date.
*(3)*Excludes excise taxes incurred on share repurchases.
SALES OF UNREGISTERED SECURITIES
During the fourth quarter of fiscal 2023, we issued 521 deferred stock units under the Home Depot, Inc. Nonemployee Directors’ Deferred Stock Compensation Plan pursuant to the exemption from registration provided by Section 4(a)(2) of the Securities Act and Rule 506 of the SEC’s Regulation D thereunder. The deferred stock units were credited during the fourth quarter of fiscal 2023 to the accounts of those non-employee directors who elected to receive all or a portion of board retainers in the form of deferred stock units instead of cash. The deferred stock units convert to shares of common stock on a one-for-one basis following a termination of service as described in this plan.
During the fourth quarter of fiscal 2023, we credited 882 deferred stock units to participant accounts under the Restoration Plans pursuant to an exemption from the registration requirements of the Securities Act for involuntary, non-contributory plans. The deferred stock units convert to shares of common stock on a one-for-one basis following a termination of service as described in these plans.
Item 6. Reserved.
Item 7. Management’s Discussion and Analysis of Financial Condition and Results of Operations.
The following discussion provides an analysis of the Company’s financial condition and results of operations from management's perspective and should be read in conjunction with the consolidated financial statements and related notes included in this report. The discussion in this Form 10-K generally focuses on fiscal 2023 compared to fiscal 2022. A discussion of our results of operations and changes in financial condition for fiscal 2022 compared to fiscal 2021 has been omitted from this report, but can be found in Part II, Item 7. Management’s Discussion and Analysis of Financial Condition and Results of Operations of our Form 10-K for fiscal 2022.
TABLE OF CONTENTS
| Executive Summary | 28 | |||||||
| Results of Operations | 28 | |||||||
| Liquidity and Capital Resources | 31 | |||||||
| Critical Accounting Estimates | 33 | |||||||
| Fiscal 2023 Form 10-K | 27 | |
EXECUTIVE SUMMARY
We reported net sales of $152.7 billion in fiscal 2023. Net earnings were $15.1 billion, or $15.11 per diluted share. During fiscal 2023, we opened eight new stores in the U.S. and five new stores in Mexico, resulting in a total store count of 2,335 at January 28, 2024. At the end of fiscal 2023, a total of 320 of our stores, or 13.7% of our total store count, were located in Canada and Mexico. Total sales per retail square foot were $604.55 in fiscal 2023. Our inventory turnover ratio was 4.3 times at the end of fiscal 2023, compared to 4.2 times at the end of fiscal 2022.
We generated $21.2 billion of cash flow from operations and issued $2.0 billion of long-term debt, net of discounts, during fiscal 2023. This cash flow, together with cash on hand, was used to fund cash payments of $8.4 billion for dividends and $8.0 billion for share repurchases. In addition, we invested $3.2 billion in capital expenditures and $1.5 billion in acquisitions, and we repaid $1.3 billion of long-term debt during fiscal 2023. In February 2024, we announced a 7.7% increase in our quarterly cash dividend to $2.25 per share.
Our ROIC was 36.7% for fiscal 2023 and 44.6% for fiscal 2022. The decrease in ROIC was primarily driven by lower operating income along with an increase in average long-term debt over the respective periods. See the Non-GAAP Financial Measures section below for our definition and calculation of ROIC, as well as a reconciliation of NOPAT, a non-GAAP financial measure, to net earnings (the most comparable GAAP financial measure).
RESULTS OF OPERATIONS
The following table presents the percentage relationship between net sales and major categories in our consolidated statements of earnings:
| Fiscal | Fiscal | Fiscal | |||||||||||||||||||||||||||||||||
| 2023 | 2022 | 2021 | |||||||||||||||||||||||||||||||||
| dollars in millions | $ | % of Net Sales | $ | % of Net Sales | $ | % of Net Sales | |||||||||||||||||||||||||||||
| Net sales | $ | 152,669 | $ | 157,403 | $ | 151,157 | |||||||||||||||||||||||||||||
| Gross profit | 50,960 | 33.4 | % | 52,778 | 33.5 | % | 50,832 | 33.6 | % | ||||||||||||||||||||||||||
| Operating expenses: | |||||||||||||||||||||||||||||||||||
| Selling, general and administrative | 26,598 | 17.4 | 26,284 | 16.7 | 25,406 | 16.8 | |||||||||||||||||||||||||||||
| Depreciation and amortization | 2,673 | 1.8 | 2,455 | 1.6 | 2,386 | 1.6 | |||||||||||||||||||||||||||||
| Total operating expenses | 29,271 | 19.2 | 28,739 | 18.3 | 27,792 | 18.4 | |||||||||||||||||||||||||||||
| Operating income | 21,689 | 14.2 | 24,039 | 15.3 | 23,040 | 15.2 | |||||||||||||||||||||||||||||
| Interest and other (income) expense: | |||||||||||||||||||||||||||||||||||
| Interest income and other, net | (178) | (0.1) | (55) | — | (44) | — | |||||||||||||||||||||||||||||
| Interest expense | 1,943 | 1.3 | 1,617 | 1.0 | 1,347 | 0.9 | |||||||||||||||||||||||||||||
| Interest and other, net | 1,765 | 1.2 | 1,562 | 1.0 | 1,303 | 0.9 | |||||||||||||||||||||||||||||
| Earnings before provision for income taxes | 19,924 | 13.1 | 22,477 | 14.3 | 21,737 | 14.4 | |||||||||||||||||||||||||||||
| Provision for income taxes | 4,781 | 3.1 | 5,372 | 3.4 | 5,304 | 3.5 | |||||||||||||||||||||||||||||
| Net earnings | $ | 15,143 | 9.9 | % | $ | 17,105 | 10.9 | % | $ | 16,433 | 10.9 | % |
—————
Note: Certain percentages may not sum to totals due to rounding.
| % Change | |||||||||||||||||||||||||||||
| Selected financial and sales data: | Fiscal | Fiscal | Fiscal | Fiscal | Fiscal | ||||||||||||||||||||||||
| 2023 | 2022 | 2021 | 2023 vs. 2022 | 2022 vs. 2021 | |||||||||||||||||||||||||
| Comparable sales (% change) | (3.2) | % | 3.1 | % | 11.4 | % | N/A | N/A | |||||||||||||||||||||
| Comparable customer transactions (% change) (1) | (2.9) | % | (5.4) | % | (0.1) | % | N/A | N/A | |||||||||||||||||||||
| Comparable average ticket (% change) (1) | (0.3) | % | 8.8 | % | 11.7 | % | N/A | N/A | |||||||||||||||||||||
| Customer transactions (in millions) (1) | 1,621.8 | 1,666.4 | 1,759.7 | (2.7) | % | (5.3) | % | ||||||||||||||||||||||
| Average ticket (1) (2) | $90.07 | $90.36 | $83.04 | (0.3) | % | 8.8 | % | ||||||||||||||||||||||
| Sales per retail square foot (1) (3) | $604.55 | $627.17 | $604.74 | (3.6) | % | 3.7 | % | ||||||||||||||||||||||
| Diluted earnings per share | $15.11 | $16.69 | $15.53 | (9.5) | % | 7.5 | % |
| Fiscal 2023 Form 10-K | 28 | |
—————
*(1)*Does not include results for HD Supply.
*(2)*Average ticket represents the average price paid per transaction and is used by management to monitor the performance of the Company, as it represents a primary driver in measuring sales performance.
*(3)*Sales per retail square foot represents sales divided by retail store square footage. Sales per retail square foot is a measure of the efficiency of sales based on the total square footage of our stores and is used by management to monitor the performance of the Company’s retail operations as an indicator of the productivity of owned and leased square footage for these retail operations.
FISCAL 2023 COMPARED TO FISCAL 2022
Sales
We assess our sales performance by evaluating both net sales and comparable sales.
Net Sales. Net sales for fiscal 2023 decreased $4.7 billion, or 3.0%, to $152.7 billion. The decrease in net sales for fiscal 2023 primarily reflects the impact of a negative comparable sales environment, primarily driven by a decrease in comparable customer transactions as well as the impact from lumber price deflation.
Online sales, which consist of sales generated online through our websites and mobile applications for products picked up at our stores or delivered to customer locations, represented 14.8% of net sales and increased by 1.1% during fiscal 2023 compared to fiscal 2022.
A weaker U.S. dollar positively impacted net sales by $276 million in fiscal 2023.
Comparable Sales. Comparable sales is a measure that highlights the performance of our existing locations and websites by measuring the change in net sales for a period over the comparable prior period of equivalent length. Comparable sales includes sales at all locations, physical and online, open greater than 52 weeks (including remodels and relocations) and excludes closed stores. Retail stores become comparable on the Monday following their 52nd week of operation. Acquisitions are typically included in comparable sales after they have been owned for more than 52 weeks. Comparable sales is intended only as supplemental information and is not a substitute for net sales presented in accordance with GAAP.
Total comparable sales decreased 3.2% in fiscal 2023, reflecting a 2.9% decrease in comparable customer transactions and a 0.3% decrease in comparable average ticket compared to fiscal 2022. The decrease in comparable customer transactions reflects the impact of macroeconomic factors, including the continued shift in consumer consumption trends away from goods and towards services and the impact of a higher interest rate environment, pressuring home improvement demand. The decrease in comparable average ticket reflects U.S. commodity price deflation, which negatively impacted average ticket by approximately 145 basis points, driven primarily by lumber. This was partially offset by inflation across several product categories, which slowed relative to prior years, along with demand for new and innovative products.
For fiscal 2023, four of our 14 merchandising departments—Building Materials, Outdoor Garden, Hardware, and Plumbing—posted positive comparable sales compared to fiscal 2022. All of our other merchandising departments posted negative comparable sales during fiscal 2023 compared to fiscal 2022, with our Lumber department posting a double-digit comparable sales decline primarily resulting from lumber price deflation, partially offset by higher unit sales.
Gross Profit
Gross profit decreased $1.8 billion, or 3.4%, to $51.0 billion in fiscal 2023. Gross profit as a percent of net sales, or gross profit margin, was 33.4% in fiscal 2023 compared to 33.5% in fiscal 2022. The decrease in gross profit margin primarily reflects price stabilization as well as reduction and optimization of our inventory position, partially offset by lower supply chain costs.
While we continue to experience shrink above historical averages, year-over-year pressure to gross profit margin from shrink decreased as we moved through fiscal 2023. As a result, shrink did not have a significant impact on our gross profit margin in fiscal 2023 compared to fiscal 2022.
Operating Expenses
Our operating expenses are composed of SG&A and depreciation and amortization.
| Fiscal 2023 Form 10-K | 29 | |
Selling, General & Administrative. SG&A increased $314 million, or 1.2%, to $26.6 billion in fiscal 2023. As a percent of net sales, SG&A was 17.4% in fiscal 2023 compared to 16.7% in fiscal 2022, primarily reflecting deleverage from a negative comparable sales environment along with previously executed wage investments for hourly associates, partially offset by the one-time benefit from the favorable settlement of litigation with a vendor as well as lower incentive compensation.
Depreciation and Amortization. Depreciation and amortization increased $218 million, or 8.9%, to $2.7 billion in fiscal 2023. As a percent of net sales, depreciation and amortization was 1.8% in fiscal 2023 compared to 1.6% in fiscal 2022, primarily reflecting increased depreciation expense from ongoing investments in the business and deleverage from a negative comparable sales environment.
Interest and Other, net
Interest and other, net increased $203 million, or 13.0%, to $1.8 billion in fiscal 2023. As a percent of net sales, interest and other, net, was 1.2% in fiscal 2023 compared to 1.0% in fiscal 2022, primarily due to increased variable rate interest on floating-rate debt resulting from interest rate swaps, higher average debt balances, and deleverage from a negative comparable sales environment, partially offset by higher interest income.
Provision for Income Taxes
Our combined effective income tax rate was 24.0% in fiscal 2023 compared to 23.9% in fiscal 2022.
Diluted Earnings per Share
Diluted earnings per share were $15.11 in fiscal 2023 compared to $16.69 in fiscal 2022. The decrease in diluted earnings per share for fiscal 2023 was primarily driven by lower net earnings during fiscal 2023, partially offset by lower diluted shares due to share repurchases.
NON-GAAP FINANCIAL MEASURES
To provide clarity on our operating performance, we supplement our reporting with certain non-GAAP financial measures. However, this supplemental information should not be considered in isolation or as a substitute for the related GAAP measures. Non-GAAP financial measures presented herein may differ from similar measures used by other companies.
Return on Invested Capital
We believe ROIC is meaningful for investors and management because it measures how effectively we deploy our capital base. We define ROIC as NOPAT, a non-GAAP financial measure, for the most recent twelve-month period, divided by average debt and equity. We define average debt and equity as the average of beginning and ending long-term debt (including current installments) and equity for the most recent twelve-month period.
The following table presents the calculation of ROIC, together with a reconciliation of NOPAT to net earnings (the most comparable GAAP measure):
| Fiscal | Fiscal | Fiscal | |||||||||||||||
| dollars in millions | 2023 | 2022 | 2021 | ||||||||||||||
| Net earnings | $ | 15,143 | $ | 17,105 | $ | 16,433 | |||||||||||
| Interest and other, net | 1,765 | 1,562 | 1,303 | ||||||||||||||
| Provision for income taxes | 4,781 | 5,372 | 5,304 | ||||||||||||||
| Operating income | 21,689 | 24,039 | 23,040 | ||||||||||||||
| Income tax adjustment (1) | (5,205) | (5,745) | (5,622) | ||||||||||||||
| NOPAT | $ | 16,484 | $ | 18,294 | $ | 17,418 | |||||||||||
| Average debt and equity | $ | 44,955 | $ | 41,055 | $ | 38,946 | |||||||||||
| ROIC | 36.7 | % | 44.6 | % | 44.7 | % |
—————
*(1)*Income tax adjustment is defined as operating income multiplied by our effective tax rate for the trailing twelve months.
| Fiscal 2023 Form 10-K | 30 | |
LIQUIDITY AND CAPITAL RESOURCES
At January 28, 2024, we had $3.8 billion in cash and cash equivalents, of which $1.0 billion was held by our foreign subsidiaries. We believe that our current cash position, cash flow generated from operations, funds available from our commercial paper program, and access to the long-term debt capital markets should be sufficient not only for our operating requirements, any required debt payments, and satisfaction of other contractual obligations, but also to enable us to invest in the business, fund dividend payments, and fund any share repurchases through the next several fiscal years. In addition, we believe we have the ability to obtain alternative sources of financing, if necessary.
Our material cash requirements include contractual and other obligations arising in the normal course of business. These obligations primarily include long-term debt and related interest payments, operating and finance lease obligations, and purchase obligations. In addition to our cash requirements, we follow a disciplined approach to capital allocation. This approach first prioritizes investing in the business, followed by paying dividends, with the intent of then returning excess cash to shareholders in the form of share repurchases. During fiscal 2023, we invested approximately $3.2 billion back into our business in the form of capital expenditures. Additionally, we invested approximately $1.5 billion on three acquisitions during fiscal 2023, accelerating our strategic initiatives and providing us with better capabilities to serve our customers.
For fiscal 2024, in line with our expectation of approximately two percent of net sales on an annual basis, we plan to invest approximately $3.0 billion to $3.5 billion back into our business in the form of capital expenditures, with investments focused on new stores and improving the customer experience, including through technology and development of other differentiated capabilities. However, we may adjust our capital expenditures to support the operations of the business, to enhance long-term strategic positioning, or in response to the economic environment, as necessary or appropriate.
During fiscal 2023, we paid cash dividends of $8.4 billion to shareholders. In February 2024, we announced a 7.7% increase in our quarterly cash dividend from $2.09 to $2.25 per share. We intend to pay a dividend in the future; however, any future dividend is subject to declaration by the Board of Directors based on our earnings, capital requirements, financial condition, and other factors considered relevant by our Board of Directors.
In August 2023, our Board of Directors approved a $15.0 billion share repurchase authorization that replaced the previous authorization of $15.0 billion, which was approved in August 2022. The August 2023 authorization does not have a prescribed expiration date. As of January 28, 2024, approximately $12.3 billion of the $15.0 billion share repurchase authorization remained available. During fiscal 2023, we had cash payments of $8.0 billion for repurchases of our common stock through open market purchases.
DEBT
We have a commercial paper program that allows for borrowings up to $5.0 billion. In connection with our program, we have back-up credit facilities with a consortium of banks for borrowings up to $5.0 billion, which consist of a five-year $3.5 billion credit facility scheduled to expire in July 2027 and a 364-day $1.5 billion credit facility scheduled to expire in July 2024. In July 2023, we completed the renewal of our 364-day $1.5 billion credit facility, extending the maturity from July 2023 to July 2024. All of our short-term borrowings during fiscal 2023 were under our commercial paper program, and the maximum amount outstanding at any time was $1.5 billion. At January 28, 2024, we had no outstanding borrowings under this program, and we were in compliance with all of the covenants contained in our credit facilities, none of which are expected to impact our liquidity or capital resources.
We also issue senior notes from time to time as part of our capital management strategy. In November 2023, we issued $2.0 billion of senior notes. The net proceeds were used for general corporate purposes, including the repayment of our 3.75% senior notes due February 15, 2024 and repurchases of shares of our common stock. In April 2023, we repaid $1.0 billion of senior notes at maturity. At January 28, 2024, we had an aggregate principal amount of senior notes outstanding of $42.2 billion, with $1.1 billion payable within 12 months. Future interest payments associated with these senior notes total $23.7 billion, with $1.7 billion payable within 12 months, based on current interest rates, which include the impact of our active interest rate swap agreements.
The indentures governing our senior notes do not generally limit our ability to incur additional indebtedness or require us to maintain financial ratios or specified levels of net worth or liquidity. The indentures governing the notes contain various customary covenants; however, none are expected to impact our liquidity or capital resources. See Note 5 to our consolidated financial statements for further discussion of our debt arrangements.
| Fiscal 2023 Form 10-K | 31 | |
LEASES
We use operating and finance leases largely to obtain a portion of our real estate, including our stores, distribution centers, and store support centers. At January 28, 2024, we had aggregate remaining lease payment obligations of $14.6 billion, with $1.7 billion payable within 12 months. Aggregate lease obligations include approximately $450 million of obligations related to leases not yet commenced. See Note 3 to our consolidated financial statements for further discussion of our operating and finance leases.
PURCHASE OBLIGATIONS AND OTHER
Purchase obligations include all legally binding contracts such as firm commitments for inventory purchases, media and sponsorship spend, software and license commitments, and legally binding service contracts. We issue inventory purchase orders in the ordinary course of business, which are typically cancellable by their terms, therefore we do not consider purchase orders that are cancellable to be firm inventory commitments. At January 28, 2024, we had aggregate purchase obligations of $2.5 billion, with $1.0 billion payable within 12 months.
At January 28, 2024, we had aggregate liabilities for unrecognized tax benefits totaling $689 million, of which approximately $25 million are expected to be paid in the next 12 months. The timing of payment, if any, associated with our long-term unrecognized tax benefit liabilities is unknown. See Note 6 to our consolidated financial statements for further discussion of our unrecognized tax benefits.
We have no material off-balance sheet arrangements.
CASH FLOWS SUMMARY
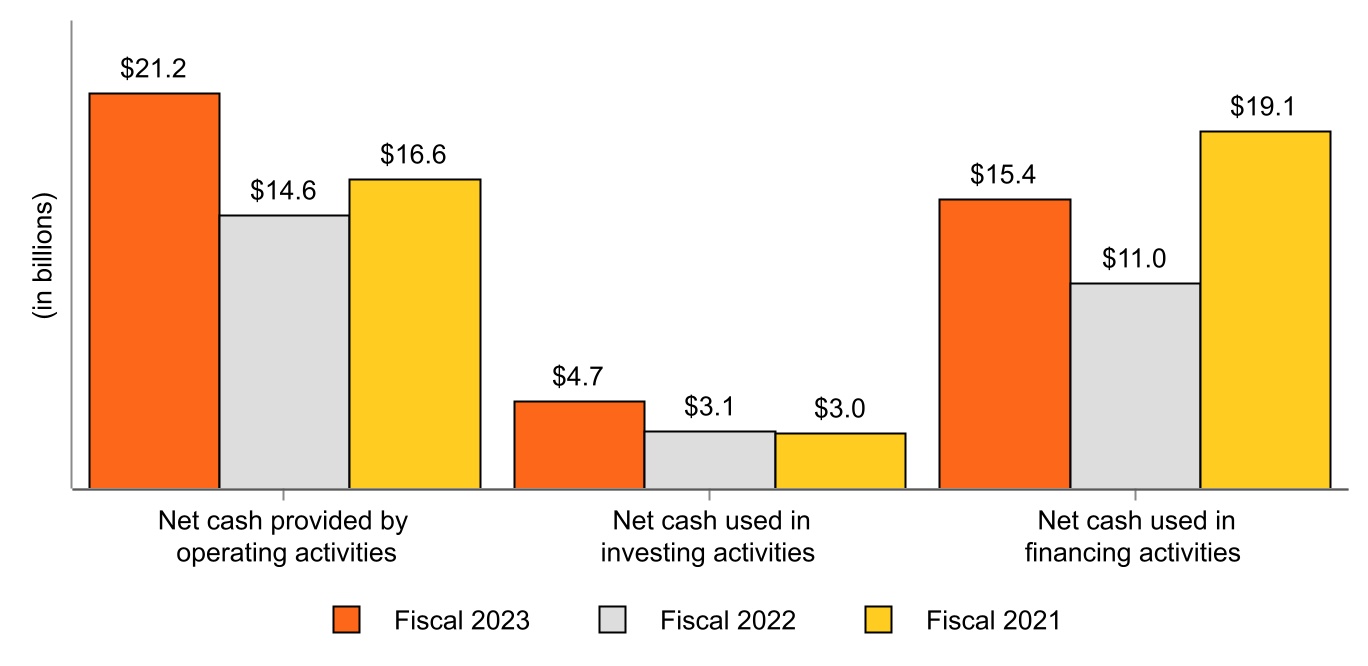
Operating Activities
Cash flow generated from operations provides us with a significant source of liquidity. Our operating cash flows result primarily from cash received from our customers, offset by cash payments we make for products and services, associate compensation, operations, occupancy costs, and income taxes. Cash provided by or used in operating activities is also subject to changes in working capital. Working capital at any point in time is subject to many variables, including seasonality, inventory management and category expansion, the timing of cash receipts and payments, vendor payment terms, and fluctuations in foreign exchange rates.
Net cash provided by operating activities increased by $6.6 billion in fiscal 2023 compared to fiscal 2022, primarily driven by changes in working capital, partially offset by a decrease in net earnings. Changes in working capital were primarily driven by lower inventory purchases in fiscal 2023 relative to fiscal 2022, as well as timing of vendor payments. Inventory levels normalized in fiscal 2023 as we adjusted purchasing activity to align with demand and continued to sell through existing inventory.
| Fiscal 2023 Form 10-K | 32 | |
Investing Activities
Net cash used in investing activities increased by $1.6 billion in fiscal 2023 compared to fiscal 2022, primarily resulting from cash paid for acquired businesses as well as increased capital expenditures primarily due to investments in new store growth. See Note 13 to our consolidated financial statements for further discussion of acquisitions.
Financing Activities
Net cash used in financing activities in fiscal 2023 primarily reflected $8.4 billion of cash dividends paid, $8.0 billion of share repurchases, and $1.3 billion of repayments of long-term debt, partially offset by $2.0 billion of net proceeds from long-term debt.
Cash used in financing activities in fiscal 2022 primarily reflected $7.8 billion of cash dividends paid, $6.7 billion of share repurchases, $2.5 billion of repayments of long-term debt, and $1.0 billion of net repayments of short-term debt, partially offset by $6.9 billion of net proceeds from long-term debt.
CRITICAL ACCOUNTING ESTIMATES
The preparation of our consolidated financial statements in accordance with GAAP requires that we make estimates and assumptions that affect the reported amounts of assets and liabilities, the disclosure of contingent assets and liabilities, and the reported amounts of revenues and expenses. Actual results could differ from those estimates.
Our significant accounting policies are disclosed in Note 1 to our consolidated financial statements. The following discussion addresses our most critical accounting estimates, which are those that are both important to the representation of our financial condition and results of operations, and that require significant judgment or use of significant assumptions or complex estimates.
MERCHANDISE INVENTORIES
We value the majority of our inventory under the retail inventory method, with the remainder of our inventories valued under a cost method, primarily the first-in, first-out method. Under the retail inventory method, inventories are stated at cost, which is determined by applying a cost-to-retail ratio to the retail value of inventories.
The retail value of our inventory is adjusted as needed to reflect current market conditions. Because these adjustments are based on current prevailing market conditions, the value of our inventory approximates the lower of cost or market. The valuation under the retail inventory method is based on a number of factors such as markups, markdowns, and inventory losses (or shrink). As such, there exists an inherent uncertainty in the final determination of inventory cost and gross profit. We determine markups and markdowns based on the consideration of a variety of factors such as current and anticipated demand, customer preferences and buying trends, age of the merchandise, and weather conditions.
We calculate shrink based on actual inventory losses identified as a result of physical inventory counts during each fiscal period and estimated inventory losses between physical inventory counts. The estimate for shrink occurring in the interim period between physical inventory counts is calculated on a store-specific basis and is primarily based on recent shrink results. A 10% increase in the shrink rate used to estimate our inventory shrink reserve would have increased cost of sales by approximately $104 million for fiscal 2023. Historically, the difference between estimated shrink and actual inventory losses has not been material to our annual financial results.
We do not believe there is a reasonable likelihood of a material change in the estimates or assumptions we use to value our inventory under the retail inventory method. We believe that the retail inventory method provides an inventory valuation which approximates cost and results in valuing our inventory at the lower of cost or market.
ADDITIONAL INFORMATION
For information on our accounting policies and on accounting pronouncements that have impacted or are expected to materially impact our financial condition, results of operations, or cash flows, see Note 1 to our consolidated financial statements.
| Fiscal 2023 Form 10-K | 33 | |
Item 7A. Quantitative and Qualitative Disclosures About Market Risk.
INTEREST RATE RISK
We have exposure to interest rate risk in connection with our long-term debt portfolio. We use interest rate swap agreements to manage our fixed/floating-rate debt portfolio, none of which are for trading or speculative purposes. At January 28, 2024, after giving consideration to our interest rate swap agreements, floating-rate debt principal was $5.4 billion, or approximately 13% of our senior notes portfolio. Our interest rate swap agreements were in an aggregate liability position of $858 million at January 28, 2024. The changes in the fair values of our interest rate swap agreements offset the changes in the fair value of the hedged long-term debt. Based on our January 28, 2024 floating-rate debt principal, a one percentage point increase in the interest rate of floating-rate debt would increase our annual interest expense by approximately $54 million.
During the second quarter of fiscal 2023, we amended all of our interest rate swap agreements to replace LIBOR with SOFR and concurrently adopted certain expedients provided in ASU No. 2020-04, “Reference Rate Reform (Topic 848)”. These amendments did not result in any change to our application of hedge accounting or have a material impact to our consolidated financial statements.
FOREIGN CURRENCY EXCHANGE RATE RISK
We are exposed to risks from foreign currency exchange rate fluctuations on the translation of our foreign operations into U.S. dollars and on the purchase of goods by these foreign operations that are not denominated in their local currencies. We use derivative instruments to hedge a portion of our foreign currency exchange rate risk, none of which are for trading or speculative purposes. Our foreign currency related hedging arrangements outstanding at the end of fiscal 2023 were not material.
COMMODITY PRICE RISK
We experience inflation and deflation related to our purchase and sale of certain commodity products. This price volatility could potentially have a material impact on our financial condition and/or our results of operations. In order to mitigate price volatility, we monitor commodity price fluctuations and may adjust our selling prices accordingly; however, our ability to recover higher costs through increased pricing may be limited by the competitive environment in which we operate. We currently do not use derivative instruments to manage these risks.
| Fiscal 2023 Form 10-K | 34 | |
Item 8. Financial Statements and Supplementary Data.
TABLE OF CONTENTS
| Fiscal 2023 Form 10-K | 35 | |
REPORT OF INDEPENDENT REGISTERED PUBLIC ACCOUNTING FIRM
To the Stockholders and the Board of Directors
The Home Depot, Inc.:
Opinion on the Consolidated Financial Statements
We have audited the accompanying consolidated balance sheets of The Home Depot, Inc. and its subsidiaries (the Company) as of January 28, 2024 and January 29, 2023, the related consolidated statements of earnings, comprehensive income, stockholders’ equity, and cash flows for each of the fiscal years in the three-year period ended January 28, 2024, and the related notes (collectively, the consolidated financial statements). In our opinion, the consolidated financial statements present fairly, in all material respects, the financial position of the Company as of January 28, 2024 and January 29, 2023, and the results of its operations and its cash flows for each of the fiscal years in the three-year period ended January 28, 2024, in conformity with U.S. generally accepted accounting principles.
We also have audited, in accordance with the standards of the Public Company Accounting Oversight Board (United States) (PCAOB), the Company’s internal control over financial reporting as of January 28, 2024, based on criteria established in Internal Control – Integrated Framework (2013) issued by the Committee of Sponsoring Organizations of the Treadway Commission, and our report dated March 13, 2024 expressed an unqualified opinion on the effectiveness of the Company’s internal control over financial reporting.
Basis for Opinion
These consolidated financial statements are the responsibility of the Company’s management. Our responsibility is to express an opinion on these consolidated financial statements based on our audits. We are a public accounting firm registered with the PCAOB and are required to be independent with respect to the Company in accordance with the U.S. federal securities laws and the applicable rules and regulations of the Securities and Exchange Commission and the PCAOB.
We conducted our audits in accordance with the standards of the PCAOB. Those standards require that we plan and perform the audit to obtain reasonable assurance about whether the consolidated financial statements are free of material misstatement, whether due to error or fraud. Our audits included performing procedures to assess the risks of material misstatement of the consolidated financial statements, whether due to error or fraud, and performing procedures that respond to those risks. Such procedures included examining, on a test basis, evidence regarding the amounts and disclosures in the consolidated financial statements. Our audits also included evaluating the accounting principles used and significant estimates made by management, as well as evaluating the overall presentation of the consolidated financial statements. We believe that our audits provide a reasonable basis for our opinion.
Critical Audit Matter
The critical audit matter communicated below is a matter arising from the current period audit of the consolidated financial statements that was communicated or required to be communicated to the audit committee and that: (1) relates to accounts or disclosures that are material to the consolidated financial statements and (2) involved our especially challenging, subjective, or complex judgments. The communication of a critical audit matter does not alter in any way our opinion on the consolidated financial statements, taken as a whole, and we are not, by communicating the critical audi
Showing the first 8K of 142K characters. Open the full section
Item 9. Changes in and Disagreements With Accountants on Accounting and Financial Disclosure.
Not applicable.
Item 9A. Controls and Procedures.
DISCLOSURE CONTROLS AND PROCEDURES
We maintain disclosure controls and procedures as defined in Rule 13a-15(e) under the Exchange Act that are designed to ensure that information required to be disclosed in our Exchange Act reports is recorded, processed, summarized, and reported within the time periods specified in the SEC’s rules and forms, and that such information is accumulated and communicated to our management, including our Chief Executive Officer and Chief Financial Officer, as appropriate, to allow timely decisions regarding required disclosure.
Management, with the participation of our Chief Executive Officer and Chief Financial Officer, has evaluated the effectiveness of our disclosure controls and procedures as of the end of the period covered by this report. Based on that evaluation, our Chief Executive Officer and Chief Financial Officer have concluded that, as of the end of the period covered by this report, our disclosure controls and procedures were effective.
MANAGEMENT’S REPORT ON INTERNAL CONTROL OVER FINANCIAL REPORTING
Our management is responsible for establishing and maintaining adequate internal control over financial reporting, as such term is defined in Rule 13a-15(f) promulgated under the Exchange Act. Under the supervision and with the participation of our management, including our Chief Executive Officer and Chief Financial Officer, we conducted an evaluation of the effectiveness of our internal control over financial reporting as of January 28, 2024 based on the framework in Internal Control – Integrated Framework (2013) issued by the Committee of Sponsoring Organizations of the Treadway Commission. Based on our evaluation, our management concluded that our internal control over financial reporting was effective as of January 28, 2024 in providing reasonable assurance regarding the reliability of financial reporting and the preparation of financial statements for external purposes in accordance with GAAP.
The effectiveness of our internal control over financial reporting as of January 28, 2024 has been audited by KPMG LLP, an independent registered public accounting firm, as stated in their report which is included herein.
CHANGES IN INTERNAL CONTROL OVER FINANCIAL REPORTING
We are in the process of an ongoing business transformation initiative, which includes upgrading and migrating certain accounting and finance systems. We plan to continue to migrate additional business processes over the course of the next few years and have modified and will continue to modify the design and implementation of certain internal control processes as the transformation continues.
Except as described above, there were no other changes in our internal control over financial reporting during the fiscal quarter ended January 28, 2024 that have materially affected, or are reasonably likely to materially affect, our internal control over financial reporting.
| Fiscal 2023 Form 10-K | 66 | |
REPORT OF INDEPENDENT REGISTERED PUBLIC ACCOUNTING FIRM
To the Stockholders and the Board of Directors
The Home Depot, Inc.:
Opinion on Internal Control Over Financial Reporting
We have audited The Home Depot, Inc. and its subsidiaries' (the Company) internal control over financial reporting as of January 28, 2024, based on criteria established in Internal Control – Integrated Framework (2013) issued by the Committee of Sponsoring Organizations of the Treadway Commission. In our opinion, the Company maintained, in all material respects, effective internal control over financial reporting as of January 28, 2024, based on criteria established in Internal Control – Integrated Framework (2013) issued by the Committee of Sponsoring Organizations of the Treadway Commission.
We also have audited, in accordance with the standards of the Public Company Accounting Oversight Board (United States) (PCAOB), the consolidated balance sheets of the Company as of January 28, 2024 and January 29, 2023, the related consolidated statements of earnings, comprehensive income, stockholders’ equity, and cash flows for each of the fiscal years in the three-year period ended January 28, 2024, and the related notes (collectively, the consolidated financial statements), and our report dated March 13, 2024 expressed an unqualified opinion on those consolidated financial statements.
Basis for Opinion
The Company’s management is responsible for maintaining effective internal control over financial reporting and for its assessment of the effectiveness of internal control over financial reporting, included in the accompanying Management’s Report on Internal Control Over Financial Reporting. Our responsibility is to express an opinion on the Company’s internal control over financial reporting based on our audit. We are a public accounting firm registered with the PCAOB and are required to be independent with respect to the Company in accordance with the U.S. federal securities laws and the applicable rules and regulations of the Securities and Exchange Commission and the PCAOB.
We conducted our audit in accordance with the standards of the PCAOB. Those standards require that we plan and perform the audit to obtain reasonable assurance about whether effective internal control over financial reporting was maintained in all material respects. Our audit of internal control over financial reporting included obtaining an understanding of internal control over financial reporting, assessing the risk that a material weakness exists, and testing and evaluating the design and operating effectiveness of internal control based on the assessed risk. Our audit also included performing such other procedures as we considered necessary in the circumstances. We believe that our audit provides a reasonable basis for our opinion.
Definition and Limitations of Internal Control Over Financial Reporting
A company’s internal control over financial reporting is a process designed to provide reasonable assurance regarding the reliability of financial reporting and the preparation of financial statements for external purposes in accordance with generally accepted accounting principles. A company’s internal control over financial reporting includes those policies and procedures that (1) pertain to the maintenance of records that, in reasonable detail, accurately and fairly reflect the transactions and dispositions of the assets of the company; (2) provide reasonable assurance that transactions are recorded as necessary to permit preparation of financial statements in accordance with generally accepted accounting principles, and that receipts and expenditures of the company are being made only in accordance with authorizations of management and directors of the company; and (3) provide reasonable assurance regarding prevention or timely detection of unauthorized acquisition, use, or disposition of the company’s assets that could have a material effect on the financial statements.
Because of its inherent limitations, internal control over financial reporting may not prevent or detect misstatements. Also, projections of any evaluation of effectiveness to future periods are subject to the risk that controls may become inadequate because of changes in conditions, or that the degree of compliance with the policies or procedures may deteriorate.
/s/ KPMG LLP
Atlanta, Georgia
March 13, 2024
| Fiscal 2023 Form 10-K | 67 | |
Item 9B. Other Information.
During the fiscal quarter ended January 28, 2024, no director or officer of the Company adopted or terminated a “Rule 10b5-1 trading arrangement” or “non-Rule 10b5-1 trading arrangement,” as each term is defined in Item 408(a) of the SEC’s Regulation S-K.
Item 9C. Disclosure Regarding Foreign Jurisdictions that Prevent Inspections.
Not applicable.
PART III
Item 10. Directors, Executive Officers and Corporate Governance.
Information required by this item, other than the information regarding the executive officers set forth below, is incorporated by reference to the sections entitled “Election of Directors,” “Corporate Governance,” “General,” and “Audit Committee Report” in our Proxy Statement for the 2024 Annual Meeting of Shareholders (“Proxy Statement”).
Executive officers are appointed by, and serve at the pleasure of, the Board of Directors. Our executive officers are as follows:
WILLIAM D. BASTEK, age 57, has been Executive Vice President – Merchandising, since March 2023. From January 2019 to March 2023, Mr. Bastek served as Senior Vice President of Merchandising, Hardlines for the Company, responsible for merchandising and marketing strategies for hardware and garden. Prior to that role, he was Merchandising Vice President for hardware and tools from December 2013 to January 2019. Mr. Bastek began his career in 1989 at HD Supply, formerly known as Maintenance Warehouse, which was originally acquired by the Company in 1997. Mr. Bastek has served in various roles of increasing responsibility, including Global Product Merchant, Senior Merchant, Divisional Merchandise Manager and Merchandising Vice President for building materials.
ANN-MARIE CAMPBELL, age 58, has been Senior Executive Vice President since November 2023. From October 2020 to October 2023, she served as Executive Vice President – U.S. Stores and International Operations, from February 2016 to October 2020, she served as Executive Vice President – U.S. Stores, from January 2009 to February 2016, she served as Division President of the Southern Division, and from December 2005 to January 2009, she served as Vice President – Vendor Services. Ms. Campbell began her career with The Home Depot in 1985 as a cashier and has held roles of increasing responsibility since she joined the Company, including vice president roles in the Company’s operations, merchandising, and marketing departments. She serves as a director of Workday, Inc., a financial and human capital management software vendor.
MATTHEW A. CAREY, age 59, has been Executive Vice President – Customer Experience since April 2022. He served as Executive Vice President and Chief Information Officer from September 2008 to April 2022. From January 2006 through August 2008, he served as Senior Vice President and Chief Technology Officer at eBay Inc., an online commerce platform. Mr. Carey was previously with Wal-Mart Stores, Inc., a general merchandise retailer, from June 1985 to December 2005. His final position with Wal-Mart was Senior Vice President and Chief Technology Officer. He serves as a director of Chipotle Mexican Grill, Inc., which owns and operates restaurants in the U.S. and internationally.
JOHN DEATON, age 50, has been Executive Vice President – Supply Chain & Product Development since November 2021. From April 2021 to October 2021, he served as Senior Vice President – Operations; from May 2017 to April 2021, he served as Senior Vice President – Supply Chain; from July 2011 to April 2017, he served as Senior Vice President – Brand and Product Development; and from April 2007 to June 2011, he served as Vice President – Supply Chain.
EDWARD P. DECKER, age 61, has served as our Chair since October 2022, and as our President and Chief Executive Officer since March 2022. He served as our President and Chief Operating Officer from October 2020 through February 2022. From August 2014 to October 2020, he served as Executive Vice President – Merchandising, and from October 2006 through July 2014, he served as Senior Vice President – Retail Finance, Pricing Analytics, and Assortment Planning. Mr. Decker joined The Home Depot in 2000 and held various strategic planning roles, including serving as Vice President – Strategic Business Development from November 2002 to April 2006 and Senior Vice President – Strategic Business and Asset Development from April 2006 to September 2006. Prior to joining the Company, Mr. Decker held various positions in strategic planning, business development, finance, and treasury at Kimberly-Clark Corp. and Scott Paper Co., both of which are consumer products companies.
| Fiscal 2023 Form 10-K | 68 | |
TIMOTHY A. HOURIGAN, age 67, has been Executive Vice President – Human Resources since June 2017. From February 2016 through June 2017, he served as Division President of the Southern Division. Prior to his role as Division President, Mr. Hourigan served in various human resources roles with the Company, including Vice President – Human Resources, U.S. Stores and Operations from September 2013 to February 2016; Vice President – Compensation and Benefits from February 2007 to September 2013; and Vice President – Human Resources from July 2002 to February 2007.
RICHARD V. McPHAIL, age 53, has been Executive Vice President and Chief Financial Officer since September 2019. From August 2017 through August 2019, he served as Senior Vice President, Finance Control and Administration of the Company, and was responsible for enterprise financial reporting and operations, financial planning and analysis, treasury, payments, tax, and international financial operations. From August 2014 to September 2017, he served as Senior Vice President, Finance, with responsibility for U.S. Retail finance, strategic and financial planning, and business development activity. Mr. McPhail served as Senior Vice President, Global FP&A, Strategy, and New Business Development, from March 2013 to August 2014; Vice President, Strategic Business Development, from January 2007 to March 2013; and director of Strategic Business Development from May 2005 to January 2007. Prior to joining the Company in 2005, Mr. McPhail served as executive vice president of corporate finance for Marconi Corporation plc in London, England. Prior to Marconi, Mr. McPhail held positions with Wachovia Securities and Arthur Andersen.
HECTOR PADILLA, age 49, has been Executive Vice President – U.S. Stores and Operations since November 2023. He previously served as Executive Vice President – Outside Sales & Services from May 2021 to October 2023, Division President of the Southern Division from June 2017 to May 2021, and Senior Vice President – Operations from November 2014 to June 2017. Mr. Padilla began his career with The Home Depot in 1994 as a store associate and has held roles of increasing responsibility since he joined the Company, serving in various management roles with oversight of field operations and services.
TERESA WYNN ROSEBOROUGH, age 65, has been Executive Vice President, General Counsel and Corporate Secretary since November 2011. From April 2006 through November 2011, Ms. Roseborough served in several legal positions with MetLife, Inc., a provider of insurance and other financial services, including Senior Chief Counsel – Compliance & Litigation and most recently as Deputy General Counsel. Prior to joining MetLife, Ms. Roseborough was a partner with the law firm Sutherland Asbill & Brennan LLP from February 1996 through March 2006 and a Deputy Assistant Attorney General in the Office of Legal Counsel of the United States Department of Justice from January 1994 through February 1996. Ms. Roseborough serves as a director of The Hartford Financial Services Group, Inc., an investment and insurance company.
FAHIM SIDDIQUI, age 57, has been Executive Vice President and Chief Information Officer since April 2022. He previously served as Senior Vice President of Information Technology from December 2018 to April 2022. Before joining The Home Depot, Mr. Siddiqui served as Senior Vice President and Chief Information Officer – eCommerce and Digital at Staples Inc. from May 2017 through November 2018. Prior to that role, he served in various technology, product and engineering leadership roles in the retail, energy and telecom sectors.
Item 11. Executive Compensation.
The information required by this item is incorporated by reference to the sections entitled “Executive Compensation,” “Director Compensation,” and “Leadership Development and Compensation Committee Report” in our Proxy Statement; provided that the section entitled “Executive Compensation – Pay Versus Performance” in our Proxy Statement is not incorporated herein by reference.
Item 12. Security Ownership of Certain Beneficial Owners and Management and Related Stockholder Matters.
The information required by this item is incorporated by reference to the sections entitled “Beneficial Ownership of Common Stock” and “Executive Compensation – Equity Compensation Plan Information” in our Proxy Statement.
Item 13. Certain Relationships and Related Transactions, and Director Independence.
The information required by this item is incorporated by reference to the section entitled “Corporate Governance” in our Proxy Statement.
Item 14. Principal Accountant Fees and Services.
Item 15. Exhibit and Financial Statement Schedules.
The following documents are filed as part of this report:
- Financial Statements
The following financial statements are set forth in Item 8 hereof:
-
Report of Independent Registered Public Accounting Firm (KPMG LLP, Atlanta, GA, Auditor Firm ID: 185);
-
Consolidated Balance Sheets as of January 28, 2024 and January 29, 2023;
-
Consolidated Statements of Earnings for fiscal 2023, fiscal 2022, and fiscal 2021;
-
Consolidated Statements of Comprehensive Income for fiscal 2023, fiscal 2022, and fiscal 2021;
-
Consolidated Statements of Stockholders’ Equity for fiscal 2023, fiscal 2022, and fiscal 2021;
-
Consolidated Statements of Cash Flows for fiscal 2023, fiscal 2022, and fiscal 2021; and
-
Notes to Consolidated Financial Statements.
- Financial Statement Schedules
All schedules are omitted, as the required information is inapplicable or the information is presented in our consolidated financial statements or related notes.
- Exhibits
Exhibits not filed or furnished herewith are incorporated by reference to exhibits previously filed with the SEC, as reflected in the table below. Our Current, Quarterly, and Annual Reports are filed with the SEC under File No. 1-8207. Our Registration Statements have the file numbers noted wherever such statements are identified in the following list of exhibits. We will furnish a copy of any exhibit to shareholders without charge upon written request to Investor Relations, The Home Depot, Inc., 2455 Paces Ferry Road, Atlanta, Georgia 30339, via the internet at http://ir.homedepot.com, or by calling Investor Relations at (770) 384-2871.
| Fiscal 2023 Form 10-K | 70 | |
| Exhibit | Description | Reference | ||||||||||||||||||||||||
| 4.14 | Form of 4.250% Senior Note due April 1, 2046 | Form 8-K filed February 12, 2016, Exhibit 4.4 | ||||||||||||||||||||||||
| 4.15 | Form of 2.125% Note due September 15, 2026 | Form 8-K filed September 15, 2016, Exhibit 4.2 | ||||||||||||||||||||||||
| 4.16 | Form of 3.500% Note due September 15, 2056 | Form 8-K filed September 15, 2016, Exhibit 4.3 | ||||||||||||||||||||||||
| 4.17 | Form of 3.900% Note due June 15, 2047 | Form 8-K filed June 5, 2017, Exhibit 4.4 | ||||||||||||||||||||||||
| 4.18 | Form of 2.800% Note due September 14, 2027 | Form 8-K filed September 14, 2017, Exhibit 4.2 | ||||||||||||||||||||||||
| 4.19 | Form of 3.900% Note due December 6, 2028 | Form 8-K filed December 6, 2018, Exhibit 4.4 | ||||||||||||||||||||||||
| 4.20 | Form of 4.500% Note due December 6, 2048 | Form 8-K filed December 6, 2018, Exhibit 4.5 | ||||||||||||||||||||||||
| 4.21 | Form of 2.950% Note due June 15, 2029 | Form 8-K filed June 17, 2019, Exhibit 4.2 | ||||||||||||||||||||||||
| 4.22 | Form of 3.900% Note due June 15, 2047 | Form 8-K filed June 17, 2019, Exhibit 4.3 | ||||||||||||||||||||||||
| 4.23 | Form of 2.950% Note due June 15, 2029 | Form 8-K filed January 13, 2020, Exhibit 4.2 | ||||||||||||||||||||||||
| 4.24 | Form of 3.125% Note due December 15, 2049 | Form 8-K filed January 13, 2020, Exhibit 4.3 | ||||||||||||||||||||||||
| 4.25 | Form of 2.500% Note due April 15, 2027 | Form 8-K filed March 30, 2020, Exhibit 4.2 | ||||||||||||||||||||||||
| 4.26 | Form of 2.700% Note due April 15, 2030 | Form 8-K filed March 30, 2020, Exhibit 4.3 | ||||||||||||||||||||||||
| 4.27 | Form of 3.300% Note due April 15, 2040 | Form 8-K filed March 30, 2020, Exhibit 4.4 | ||||||||||||||||||||||||
| 4.28 | Form of 3.350% Note due April 15, 2050 | Form 8-K filed March 30, 2020, Exhibit 4.5 | ||||||||||||||||||||||||
| 4.29 | Form of 0.900% Note due March 15, 2028 | Form 8-K filed January 7, 2021, Exhibit 4.2 | ||||||||||||||||||||||||
| 4.30 | Form of 1.375% Note due March 15, 2031 | Form 8-K filed January 7, 2021, Exhibit 4.3 | ||||||||||||||||||||||||
| 4.31 | Form of 2.375% Note due March 15, 2051 | Form 8-K filed January 7, 2021, Exhibit 4.4 | ||||||||||||||||||||||||
| 4.32 | Form of 1.500% Note due September 15, 2028 | Form 8-K filed September 21, 2021, Exhibit 4.2 | ||||||||||||||||||||||||
| 4.33 | Form of 1.875% Note due September 15, 2031 | Form 8-K filed September 21, 2021, Exhibit 4.3 | ||||||||||||||||||||||||
| 4.34 | Form of 2.750% Note due September 15, 2051 | Form 8-K filed September 21, 2021, Exhibit 4.4 | ||||||||||||||||||||||||
| 4.35 | Form of 2.700% Note due April 15, 2025 | Form 8-K filed March 28, 2022, Exhibit 4.2 | ||||||||||||||||||||||||
| 4.36 | Form of 2.875% Note due April 15, 2027 | Form 8-K filed March 28, 2022, Exhibit 4.3 | ||||||||||||||||||||||||
| 4.37 | Form of 3.250% Note due April 15, 2032 | Form 8-K filed March 28, 2022, Exhibit 4.4 | ||||||||||||||||||||||||
| 4.38 | Form of 3.625% Note due April 15, 2052 | Form 8-K filed March 28, 2022, Exhibit 4.5 | ||||||||||||||||||||||||
| 4.39 | Form of 4.000% Note due September 15, 2025 | Form 8-K filed September 19, 2022, Exhibit 4.2 | ||||||||||||||||||||||||
| 4.40 | Form of 4.500% Note due September 15, 2032 | Form 8-K filed September 19, 2022, Exhibit 4.3 | ||||||||||||||||||||||||
| 4.41 | Form of 4.950% Note due September 15, 2052 | Form 8-K filed September 19, 2022, Exhibit 4.4 | ||||||||||||||||||||||||
| 4.42 | Form of 5.125% Note due April 30, 2025 | Form 8-K filed December 4, 2023, Exhibit 4.2 | ||||||||||||||||||||||||
| 4.43 | Form of 4.950% Note due September 30, 2026 | Form 8-K filed December 4, 2023, Exhibit 4.3 | ||||||||||||||||||||||||
| 4.45 | Form of 4.900% Note due April 15, 2029 | Form 8-K filed December 4, 2023, Exhibit 4.4 | ||||||||||||||||||||||||
| 4.46 | Description of Securities | Form 10-K for the fiscal year ended February 2, 2020, Exhibit 4.33 | ||||||||||||||||||||||||
| 10.1 | † | The Home Depot, Inc. 1997 Omnibus Stock Incentive Plan | Form 10-Q for the fiscal quarter ended August 4, 2002, Exhibit 10.1 | |||||||||||||||||||||||
| 10.2 | † | Form of Executive Employment Death Benefit Agreement | Form 10-K for the fiscal year ended February 3, 2013, Exhibit 10.2 | |||||||||||||||||||||||
| 10.3 | † | The Home Depot Deferred Compensation Plan for Officers (As Amended and Restated Effective January 1, 2008) | Form 8-K filed August 20, 2007, Exhibit 10.1 | |||||||||||||||||||||||
| 10.4 | † | Amendment No. 1 to The Home Depot Deferred Compensation Plan for Officers (As Amended and Restated Effective January 1, 2008) | Form 10-K for the fiscal year ended January 31, 2010, Exhibit 10.4 | |||||||||||||||||||||||
| 10.5 | † | Amendment No. 2 to The Home Depot Deferred Compensation Plan for Officers (As Amended and Restated Effective January 1, 2008) | Form 10-K for the fiscal year ended January 31, 2021, Exhibit 10.5 | |||||||||||||||||||||||
| 10.6 | † | The Home Depot, Inc. Omnibus Stock Incentive Plan, as Amended and Restated May 19, 2022 | Form 10-Q for the fiscal quarter ended July 31, 2022, Exhibit 10.1 |
| Fiscal 2023 Form 10-K | 71 | |
| Fiscal 2023 Form 10-K | 72 | |
| Fiscal 2023 Form 10-K | 73 | |
| Exhibit | Description | Reference | ||||||||||||||||||||||||
| 101.INS | * | XBRL Instance Document - the instance document does not appear in the Interactive Data file because its XBRL tags are embedded within the Inline XBRL document | ||||||||||||||||||||||||
| 101.SCH | * | XBRL Taxonomy Extension Schema Document | ||||||||||||||||||||||||
| 101.CAL | * | XBRL Taxonomy Extension Calculation Linkbase Document | ||||||||||||||||||||||||
| 101.DEF | * | XBRL Taxonomy Extension Definition Linkbase Document | ||||||||||||||||||||||||
| 101.LAB | * | XBRL Taxonomy Extension Label Linkbase Document | ||||||||||||||||||||||||
| 101.PRE | * | XBRL Taxonomy Extension Presentation Linkbase Document | ||||||||||||||||||||||||
| 104 | Cover Page Interactive Data File (formatted as inline XBRL and contained in Exhibit 101) |
—————
† Management contract or compensatory plan or arrangement
- Filed herewith
‡ Furnished (and not filed) herewith pursuant to Item 601(b)(32)(ii) of the SEC’s Regulation S-K
Item 16. Form 10-K Summary.
None.
| Fiscal 2023 Form 10-K | 74 | |
SIGNATURES
Pursuant to the requirements of Section 13 or 15(d) of the Securities Exchange Act of 1934, the registrant has duly caused this report to be signed on its behalf by the undersigned, thereunto duly authorized.
| THE HOME DEPOT, INC. (Registrant) | ||||||||
| By: | /s/ EDWARD P. DECKER | |||||||
| Edward P. Decker, Chair, President and Chief Executive Officer | ||||||||
| Date: | March 13, 2024 |
Pursuant to the requirements of the Securities Exchange Act of 1934, this report has been signed below by the following persons on behalf of the registrant and in the capacities indicated as of March 13, 2024.
| Signature | Title | |||||||||||||
| /s/ EDWARD P. DECKER | Chair, President and Chief Executive Officer (Principal Executive Officer) | |||||||||||||
| Edward P. Decker | ||||||||||||||
| /s/ RICHARD V. MCPHAIL | Executive Vice President and Chief Financial Officer (Principal Financial Officer) | |||||||||||||
| Richard V. McPhail | ||||||||||||||
| /s/ KIMBERLY R. SCARDINO | Senior Vice President — Finance, Chief Accounting Officer and Controller (Principal Accounting Officer) | |||||||||||||
| Kimberly R. Scardino | ||||||||||||||
| /s/ GERARD J. ARPEY | Director | |||||||||||||
| Gerard J. Arpey | ||||||||||||||
| /s/ ARI BOUSBIB | Director | |||||||||||||
| Ari Bousbib | ||||||||||||||
| /s/ JEFFERY H. BOYD | Director | |||||||||||||
| Jeffery H. Boyd | ||||||||||||||
| /s/ GREGORY D. BRENNEMAN | Director | |||||||||||||
| Gregory D. Brenneman | ||||||||||||||
| /s/ J. FRANK BROWN | Director | |||||||||||||
| J. Frank Brown | ||||||||||||||
| /s/ ALBERT P. CAREY | Director | |||||||||||||
| Albert P. Carey | ||||||||||||||
| /s/ LINDA R. GOODEN | Director | |||||||||||||
| Linda R. Gooden | ||||||||||||||
| /s/ WAYNE M. HEWETT | Director | |||||||||||||
| Wayne M. Hewett | ||||||||||||||
| /s/ MANUEL KADRE | Director | |||||||||||||
| Manuel Kadre | ||||||||||||||
| /s/ STEPHANIE C. LINNARTZ | Director | |||||||||||||
| Stephanie C. Linnartz | ||||||||||||||
| /s/ PAULA A. SANTILLI | Director | |||||||||||||
| Paula A. Santilli | ||||||||||||||
| /s/ CARYN SEIDMAN-BECKER | Director | |||||||||||||
| Caryn Seidman-Becker |
| Fiscal 2023 Form 10-K | 75 | |