 filings.tools
Hilton Worldwide Holdings 10-K 2022-12-31
Filed 2023-02-09. 23 sections, 542K characters. Original on sec.gov · Markdown · JSON
Cover and table of contents
UNITED STATES
SECURITIES AND EXCHANGE COMMISSION
Washington, D.C. 20549
Form 10-K
(Mark One)
| ☒ | ANNUAL REPORT PURSUANT TO SECTION 13 OR 15(d) OF THE SECURITIES EXCHANGE ACT OF 1934 |
For the fiscal year ended December 31, 2022
or
| ☐ | TRANSITION REPORT PURSUANT TO SECTION 13 OR 15(d) OF THE SECURITIES EXCHANGE ACT OF 1934 |
For the transition period from to
Commission File Number 001-36243
Hilton Worldwide Holdings Inc.
(Exact name of registrant as specified in its charter)
| Delaware | 27-4384691 | |||||||
| (State or other jurisdiction of incorporation or organization) | (I.R.S. Employer Identification No.) | |||||||
| 7930 Jones Branch Drive, Suite 1100, McLean, VA | 22102 | |||||||
| (Address of Principal Executive Offices) | (Zip Code) |
Registrant’s telephone number, including area code: (703) 883-1000
Securities registered pursuant to Section 12(b) of the Act:
| Title of each class | Trading symbol(s) | Name of each exchange on which registered | ||||||||||||
| Common Stock, $0.01 par value per share | HLT | New York Stock Exchange |
Securities registered pursuant to Section 12(g) of the Act: None
Indicate by check mark if the registrant is a well-known seasoned issuer, as defined in Rule 405 of the Securities Act. Yes ☒ No ☐
Indicate by check mark if the registrant is not required to file reports pursuant to Section 13 or Section 15(d) of the Act. Yes ☐ No ☒
Indicate by check mark whether the registrant (1) has filed all reports required to be filed by Section 13 or 15(d) of the Securities Exchange Act of 1934 during the preceding 12 months (or for such shorter period that the registrant was required to file such reports), and (2) has been subject to such filing requirements for the past 90 days. Yes ☒ No ☐
Indicate by check mark whether the registrant has submitted electronically every Interactive Data File required to be submitted pursuant to Rule 405 of Regulation S-T during the preceding 12 months (or for such shorter period that the registrant was required to submit such files). Yes ☒ No ☐
Indicate by check mark whether the registrant is a large accelerated filer, an accelerated filer, a non-accelerated filer, a smaller reporting company or emerging growth company. See the definitions of "large accelerated filer," "accelerated filer," "smaller reporting company" and "emerging growth company" in Rule 12b-2 of the Exchange Act.
Large accelerated filer ☒ Accelerated filer ☐
Non-accelerated filer ☐ Smaller reporting company ☐
Emerging growth company ☐
If an emerging growth company, indicate by check mark if the registrant has elected not to use the extended transition period for complying with any new or revised financial accounting standards provided pursuant to Section 13(a) of the Exchange Act. ☐
Indicate by check mark whether the registrant has filed a report on and attestation to its management's assessment of the effectiveness of its internal control over financial reporting under Section 404(b) of the Sarbanes-Oxley Act (15 U.S.C. 7262(b)) by the registered public accounting firm that prepared or issued its audit report. ☒
If securities are registered pursuant to Section 12(b) of the Act, indicate by check mark whether the financial statements of the registrant included in the filing reflect the correction of an error to previously issued financial statements. ☐
Indicate by check mark whether any of those error corrections are restatements that required a recovery analysis of incentive-based compensation received by any of the registrant’s executive officers during the relevant recovery period pursuant to § 240.10D-1(b). ☐
Indicate by check mark whether the registrant is a shell company (as defined in Rule 12b-2 of the Exchange Act). Yes ☐ No ☒
As of June 30, 2022, the last business day of the registrant's most recently completed second fiscal quarter, the aggregate market value of the registrant’s common stock held by non-affiliates of the registrant was approximately $30,145 million (based upon the closing sale price of the common stock on that date on the New York Stock Exchange). The number of shares of common stock outstanding on February 3, 2023 was 266,450,664.
DOCUMENTS INCORPORATED BY REFERENCE
Items 10, 11, 12, 13 and 14 of Part III incorporate information by reference from the registrant's definitive proxy statement relating to its 2023 annual meeting of stockholders to be filed with the Securities and Exchange Commission within 120 days after the close of the registrant's fiscal year.
HILTON WORLDWIDE HOLDINGS INC.
FORM 10-K TABLE OF CONTENTS
YEAR ENDED DECEMBER 31, 2022
PART I
Forward-Looking Statements
This Annual Report on Form 10-K contains forward-looking statements within the meaning of Section 27A of the Securities Act of 1933, as amended (the "Securities Act") and Section 21E of the Securities Exchange Act of 1934, as amended (the "Exchange Act"). These statements include, but are not limited to, statements related to our expectations regarding the recovery of the travel and hospitality industry from the coronavirus ("COVID-19") pandemic (the "COVID-19 pandemic" or the "pandemic"), the performance of our business, our future financial results, liquidity and capital resources and other non-historical statements. In some cases, you can identify these forward-looking statements by the use of words such as "outlook," "believes," "expects," "potential," "continues," "may," "will," "should," "could," "seeks," "projects," "predicts," "intends," "plans," "estimates," "anticipates" or the negative version of these words or other comparable words. Such forward-looking statements are subject to various risks and uncertainties that could cause actual outcomes or results to differ materially from those indicated in these statements, including, among others, those described under "Part I—Item 1A. Risk Factors" and under "Summary of Risk Factors" below. These factors should not be construed as exhaustive and should be read in conjunction with the other cautionary statements that are included in this Annual Report on Form 10-K. We undertake no obligation to publicly update or review any forward-looking statement, whether as a result of new information, future developments or otherwise, except as required by law.
Summary of Risk Factors
In addition to the other information in this Annual Report on Form 10-K, the following risk factors should be considered carefully in evaluating our company and our business. A summary of the principal factors that create risk in investing in our securities and might cause actual results to differ from expectations is set forth below:
-
We are subject to the business, financial and operating risks inherent to the hospitality industry, any of which could reduce our revenues and limit opportunities for growth;
-
Macroeconomic and other factors beyond our control can adversely affect and reduce demand for our products and services;
-
The COVID-19 pandemic negatively affected our business, financial condition and results of operations and COVID-19 or other outbreaks of contagious diseases or other adverse public health developments may negatively affect future results;
-
Because we operate in a highly competitive industry, our revenues or profits could be harmed if we are unable to compete effectively;
-
Our business is subject to risks related to doing business with third-party property owners that could adversely affect our reputation, operational results or prospects for growth;
-
Failures in, material damage to or interruptions in our information technology systems, software or websites, including as a result of cyber-attacks on our systems or systems operated by third parties that provide operational and technical services to us, costs associated with protecting the integrity and security of personal data and other sensitive information and difficulties in updating our existing software or developing or implementing new software could have a material adverse effect on our business or results of operations;
-
The growth of internet reservation channels could adversely affect our business and profitability;
-
Because we derive a portion of our revenues from operations outside the United States ("U.S."), the risks of doing business internationally could lower our revenues, increase our costs, reduce our profits or disrupt our business;
-
Labor shortages could restrict our ability to operate our properties or grow our business or result in increased labor costs that could adversely affect our results of operations;
-
Our business is subject to evolving corporate governance and public disclosure regulations and expectations, including with respect to environmental, social and governance ("ESG") matters, that could expose us to numerous risks; and
-
Our substantial indebtedness and other contractual obligations could adversely affect our financial condition, our ability to raise additional capital to fund our operations, our ability to operate our business, our ability to react to changes in the economy or our industry and our ability to pay our debts, and could require us to divert our cash flows from operations to make required debt or interest payments.
These risk factors do not identify all risks that we face, and our business, financial condition and results of operations could also be affected by factors, events or uncertainties that are not presently known to us or that we currently do not consider to present material risks.
Terms Used and Basis of Presentation in this Annual Report on Form 10-K
Except where the context requires otherwise, references in this Annual Report on Form 10-K to "Hilton," "the Company," "we," "us" and "our" refer to Hilton Worldwide Holdings Inc., together with all of its consolidated subsidiaries. Except where the context requires otherwise, references to our "properties" refer to the hotels, resorts and timeshare properties that are managed, franchised, owned or leased by us, while references to "hotels" exclude timeshare properties.
On January 3, 2017, we completed the spin-offs of a portfolio of hotels and resorts, as well as our timeshare business, into two independent, publicly traded companies: Park Hotels & Resorts Inc. ("Park") and Hilton Grand Vacations Inc. ("HGV"), respectively, (the "spin-offs"). Hilton did not retain any interest in Park or HGV, but did enter into long-term management and franchise contracts with Park for the portfolio of hotels and resorts that it held at the time of the spin-offs and a 100-year license agreement with HGV for the timeshare business.
Refer to "Part II—Item 7. Management's Discussion and Analysis of Financial Condition and Results of Operations—Key Business and Financial Metrics Used by Management" for additional information on our financial and performance metrics.
Social Media
We use our website at newsroom.hilton.com, our Facebook page at facebook.com/hiltonnewsroom and our corporate Twitter account at twitter.com/hiltonnewsroom as channels of distribution of company information. The information we post through these channels may be deemed material. Accordingly, investors should monitor these channels, in addition to following our press releases, our filings with the U.S. Securities and Exchange Commission (the "SEC") and our webcasts. The contents of our website and social media channels are not, however, part of this report.
Item 1. Business
Overview
Hilton is one of the largest hospitality companies in the world, with 7,165 properties comprising 1,127,430 rooms in 123 countries and territories as of December 31, 2022. Founded in 1919, Hilton has been an innovator in the industry for more than 100 years, driven by the vision of founder Conrad Hilton, "to fill the earth with the light and warmth of hospitality." Our premier brand portfolio includes: our luxury hotel brands, Waldorf Astoria Hotels & Resorts, LXR Hotels & Resorts and Conrad Hotels & Resorts; our lifestyle hotel brands, Canopy by Hilton, Curio Collection by Hilton, Tapestry Collection by Hilton, Tempo by Hilton and Motto by Hilton; our full service hotel brands, Signia by Hilton, Hilton Hotels & Resorts and DoubleTree by Hilton; our focused service hotel brands, Hilton Garden Inn, Hampton by Hilton and Tru by Hilton; our all-suites hotel brands, Embassy Suites by Hilton, Homewood Suites by Hilton and Home2 Suites by Hilton; our new premium economy brand, Spark by Hilton, launched in January 2023; and our timeshare brand, Hilton Grand Vacations. As of December 31, 2022, we had 152 million members in our award-winning guest loyalty program, Hilton Honors, a 19 percent increase from December 31, 2021; refer to "—Our Brand Portfolio" and "—Our Guest Loyalty Program" below for additional information on our brands, including Hilton Honors.
The COVID-19 pandemic significantly affected the global economy and strained the hospitality industry beginning in 2020. Since the beginning of the pandemic, the pervasiveness and severity of travel restrictions and stay-at-home directives have varied by country and state; however, as of December 31, 2022, most of the countries we operate in had eased or completely lifted such restrictions. While the pandemic negatively affected certain of our results for the years ended December 31, 2022 and 2021, we have experienced strong signs of recovery since early 2021, with comparable system-wide RevPAR in the third and fourth quarters of 2022 exceeding levels achieved in the same periods in 2019. Although all periods included in
our consolidated financial statements presented in this Form 10-K were impacted by the COVID-19 pandemic, none of these periods are considered comparable, and no periods affected by the pandemic are expected to be comparable to future periods.
We operate our business through: (i) a management and franchise segment; and (ii) an ownership segment, each of which is reported as a segment based on (a) delivering a similar set of products and services and (b) being managed separately given its distinct economic characteristics. The management and franchise segment includes all of the hotels we manage for third-party owners, as well as all franchised hotels that license our intellectual property ("IP"), including our brand names, trademarks and service marks, and where we provide other contracted services to third-party owners, but the day-to-day services of the hotels are operated or managed by someone other than us. Revenues from this segment include: (i) management and franchise fees charged to third-party hotel owners; (ii) licensing fees from our strategic partners, including co-branded credit card providers, and HGV for the right to use our IP; and (iii) fees for managing hotels in our ownership segment. The ownership segment primarily derives revenues from nightly hotel room sales, food and beverage sales and other services at our consolidated owned and leased hotels. For more information regarding our segments, refer to "—Our Business—Management and Franchise" and "—Our Business—Ownership" below.
In addition to our current hotel portfolio, we are focused on the growth of our business by expanding our global hotel network through our development pipeline, which represents hotels that we expect to add to our system in the future. The following table summarizes our development activity:
| As of or for the Year Ended December 31, 2022 | |||||||||||
| Hotels | Rooms**(1)** | ||||||||||
| Hotel system | |||||||||||
| Openings | 355 | 58,200 | |||||||||
| Net additions(2) | 308 | 48,300 | |||||||||
| Development pipeline(3) | |||||||||||
| Additions | 664 | 89,900 | |||||||||
| Count as of period end(4) | 2,821 | 416,400 |
(1)Rounded to the nearest hundred.
(2)Represents room additions, net of rooms removed from our system, during the period, which contributed to net unit growth for the year ended December 31, 2022 of 4.7 percent.
(3)Hotels in our system were under development throughout 118 countries and territories, including 30 countries and territories where we did not currently have any existing hotels.
(4)In our development pipeline, as of December 31, 2022, 205,400 of the rooms were under construction and 243,500 of the rooms were located outside of the U.S. Nearly all of the rooms in our development pipeline will be in our management and franchise segment. We do not consider any individual development project to be material to us.
Overall, we believe that our experience in the hospitality industry, which spans more than a century of customer service and entrepreneurship, and continues to evolve to meet the tastes, preferences and demands of our hotel guests; our strong, well-defined brands that operate throughout the hospitality industry chain scales; our diverse, inclusive workforce, built to focus on providing exceptional customer experiences; and our commercial service offerings will continue to drive customer loyalty, including participation in our Hilton Honors guest loyalty program. We believe that satisfied customers will generate additional business at our properties, yielding strong overall hotel performance for us and our hotel owners. Strong results at our existing properties will encourage further development of additional hotels under our brands and conversions of existing hotels to our brands with both (i) owners who currently have properties in our system and (ii) new owners who sign management or franchise contracts with us in the future, which further supports our growth and future financial performance. We believe that our existing hotel system and development pipeline, which will require minimal capital investment from us, positions us to further improve our business, allocate capital effectively and meet our customers' demands and preferences in the future.
Our Brand Portfolio
The goal of each of our brands is to deliver exceptional customer experiences and superior operating performance.
| December 31, 2022 | ||||||||||||||||||||||||||||||||||||||
| Brand**(1)** | Chain Scale | Countries/ Territories | Properties | Rooms | Percentage of Total Rooms | Selected Competitors**(1)** | ||||||||||||||||||||||||||||||||
 | Luxury | 17 | 34 | 9,401 | 0.8% | Four Seasons, Mandarin Oriental, Peninsula, Ritz Carlton, Rosewood Hotels & Resorts, St. Regis | ||||||||||||||||||||||||||||||||
| , H1N1 (swine flu) and Middle East Respiratory Syndrome (MERS);
-
geo-political activity, political and social unrest and governmental action and uncertainty resulting from U.S. and global political and social trends and policies, including potential barriers to travel, trade and immigration;
-
wars, such as Russia's invasion of Ukraine, political instability or civil unrest, terrorist activities or threats and resulting heightened travel security measures, any of which may foreclose travel to certain locales or decrease the appeal of travel among the general population;
-
the impact of U.S. Federal government shutdowns and other similar governmental budgetary impasses or reductions;
-
decreased corporate or government travel-related budgets and spending, as well as cancellations, deferrals or renegotiations of group business, such as industry conventions;
-
statements, actions or interventions by governmental officials related to travel and corporate travel-related activities and the resulting negative public perception of such travel and activities;
-
the financial and general business condition of the airline, automotive and other transportation-related industries and its effect on travel, including decreased airline capacity and routes and increased travel costs;
-
perceived negative impacts of tourism on local cultures, human rights and the environment;
-
cyber-attacks;
-
the impact of climate change or availability of natural resources;
-
natural, climate-related or man-made disasters and extreme weather conditions, including earthquakes, tsunamis, tornadoes, hurricanes, typhoons, floods, wildfires, volcanic eruptions, oil spills and nuclear incidents;
-
labor shortages, which could restrict our ability to efficiently operate or grow our business and/or increase our costs;
-
organized labor activities, which could cause a diversion of business from hotels involved in labor negotiations and loss of business for our hotels generally as a result of certain labor tactics; and
-
other changes in the overall demand for what we offer, including the desirability of particular locations or travel patterns of customers.
Any one or more of these factors could limit or reduce overall demand for our products and services or could negatively affect our revenue sources, which could adversely affect our business, financial condition and results of operations.
Contraction in the global economy or low levels of economic growth could adversely affect our revenues and profitability, as well as limit or slow our future growth.
Consumer demand for our services is closely linked to the performance of the general economy and is sensitive to business and personal discretionary spending levels. Decreased global or regional demand for hospitality products and services can be especially pronounced during periods of economic contraction or low levels of economic growth, and the recovery period in our industry may lag overall economic improvement. Declines in demand for our products and services due to general economic conditions could negatively affect our business by limiting the amount of fee revenues we are able to generate from our managed and franchised properties and decreasing the revenues and profitability of our owned and leased properties. In addition, many of the expenses associated with our business, including personnel costs, interest, rent, property taxes, insura
Showing the first 8K of 94K characters. Open the full section
Item 1B. Unresolved Staff Comments
None.
Item 2. Properties
Hotel Properties
Joint Venture Hotels
As of December 31, 2022, we had a minority or noncontrolling financial interest in the entities that own or lease the following 5 properties, representing 2,244 rooms, and we manage each of the hotels for these entities. We have a right of first refusal to purchase additional equity interests in certain of these joint ventures.
| Property | Location | Ownership Percentage | Rooms | |||||||||||||||||
| Conrad Hotels & Resorts | ||||||||||||||||||||
| Conrad Cairo | Cairo, Egypt | 10% | 614 | |||||||||||||||||
| Hilton Hotels & Resorts | ||||||||||||||||||||
| Hilton Tokyo Bay | Urayasu-shi, Japan | 24% | 828 | |||||||||||||||||
| Hilton Nagoya | Nagoya, Japan | 24% | 460 | |||||||||||||||||
| Hilton Mauritius Resort & Spa | Flic-en-Flac, Mauritius | 20% | 193 | |||||||||||||||||
| Hilton Imperial Dubrovnik | Dubrovnik, Croatia | 18% | 149 |
Leased Hotels
As of December 31, 2022, we leased the following 47 hotels, representing 15,368 rooms.
| Property | Location | Rooms | ||||||||||||
| Waldorf Astoria Hotels & Resorts | ||||||||||||||
| Rome Cavalieri, Waldorf Astoria Hotels & Resorts | Rome, Italy | 370 | ||||||||||||
| Waldorf Astoria Amsterdam | Amsterdam, Netherlands | 93 | ||||||||||||
| Conrad Hotels & Resorts | ||||||||||||||
| Conrad Osaka | Osaka, Japan | 164 | ||||||||||||
| Hilton Hotels & Resorts | ||||||||||||||
| Hilton Tokyo(1) | (Shinjuku-ku) Tokyo, Japan | 830 | ||||||||||||
| Ramses Hilton | Cairo, Egypt | 811 | ||||||||||||
| Hilton Vienna | Vienna, Austria | 663 | ||||||||||||
| Hilton London Kensington | London, United Kingdom | 601 | ||||||||||||
| Hilton Osaka(1) | Osaka, Japan | 562 | ||||||||||||
| Hilton Tel Aviv | Tel Aviv, Israel | 560 | ||||||||||||
| Hilton Istanbul Bosphorus | Istanbul, Turkiye | 500 | ||||||||||||
| Hilton Munich Park | Munich, Germany | 484 | ||||||||||||
| Hilton Munich City | Munich, Germany | 483 | ||||||||||||
| London Hilton on Park Lane | London, United Kingdom | 453 | ||||||||||||
| Hilton Diagonal Mar Barcelona | Barcelona, Spain | 433 | ||||||||||||
| Hilton Mainz | Mainz, Germany | 431 | ||||||||||||
| Hilton Trinidad & Conference Centre | Port of Spain, Trinidad | 405 | ||||||||||||
| Hilton London Heathrow Airport | London, United Kingdom | 398 | ||||||||||||
| Hilton Addis Ababa | Addis Ababa, Ethiopia | 372 | ||||||||||||
| Hilton Vienna Danube Waterfront | Vienna, Austria | 367 | ||||||||||||
| Hilton Frankfurt | Frankfurt, Germany | 342 | ||||||||||||
| Hilton Sandton | Sandton, South Africa | 329 | ||||||||||||
| Hilton Glasgow | Glasgow, United Kingdom | 322 | ||||||||||||
| Hilton Milan | Milan, Italy | 320 | ||||||||||||
| Hilton Brisbane | Brisbane, Australia | 319 | ||||||||||||
| The Waldorf Hilton, London | London, United Kingdom | 298 | ||||||||||||
| Hilton Cologne | Cologne, Germany | 296 |
(continued on next page)
| Property | Location | Rooms | ||||||||||||
| Hilton Stockholm Slussen | Stockholm, Sweden | 289 | ||||||||||||
| Hilton Madrid Airport | Madrid, Spain | 284 | ||||||||||||
| Hilton London Canary Wharf | London, United Kingdom | 282 | ||||||||||||
| Hilton Amsterdam | Amsterdam, Netherlands | 271 | ||||||||||||
| Hilton Newcastle Gateshead | Newcastle Upon Tyne, United Kingdom | 254 | ||||||||||||
| Hilton Vienna Plaza | Vienna, Austria | 254 | ||||||||||||
| Hilton London Tower Bridge | London, United Kingdom | 248 | ||||||||||||
| Hilton Antwerp Old Town | Antwerp, Belgium | 210 | ||||||||||||
| Hilton Reading | Reading, United Kingdom | 210 | ||||||||||||
| Hilton Leeds City | Leeds, United Kingdom | 208 | ||||||||||||
| Hilton Watford | Watford, United Kingdom | 200 | ||||||||||||
| Hilton Nottingham | Nottingham, United Kingdom | 176 | ||||||||||||
| Hilton London Croydon | Croydon, United Kingdom | 168 | ||||||||||||
| Hilton Cobham | Cobham, United Kingdom | 158 | ||||||||||||
| Hilton Paris La Defense | Paris, France | 153 | ||||||||||||
| Hilton East Midlands Airport | Derby, United Kingdom | 152 | ||||||||||||
| Hilton Northampton | Northampton, United Kingdom | 139 | ||||||||||||
| Hilton London Hyde Park | London, United Kingdom | 136 | ||||||||||||
| Hilton York | York, United Kingdom | 131 | ||||||||||||
| Hilton Mainz City | Mainz, Germany | 127 | ||||||||||||
| Hilton Puckrup Hall, Tewkesbury | Tewkesbury, United Kingdom | 112 |
(1)We own a controlling financial interest, but less than a 100 percent interest, in the entity that leases the property.
Corporate Headquarters and Regional Offices
Our corporate headquarters is located at 7930 Jones Branch Drive, McLean, Virginia 22102, which is under a lease agreement that expires in April 2037. We also own or lease corporate offices or centralized operations centers in Memphis, Tennessee; Glasgow, Scotland (Europe); Watford, England (Europe); Dubai, United Arab Emirates (Middle East and Africa); Singapore (Asia Pacific); Tokyo, Japan; Shanghai, China; and Mexico City, Mexico. Additionally, we have support operations and other commercial services at a leased office in Addison, Texas. We believe that our existing office properties are in good condition and are sufficient and suitable for the conduct of our business. In the event we need to expand our operations, or upon expiration of our current leases, we believe that suitable space will be available on commercially reasonable terms.
Item 3. Legal Proceedings
We are involved in various claims and lawsuits arising in the ordinary course of business, some of which include claims for substantial sums, including proceedings involving tort and other general liability claims, employee claims, consumer protection claims and claims related to our management of certain hotels. We recognize a liability when we believe the loss is probable and can be reasonably estimated. Most occurrences involving liability, claims of negligence and employees are covered by policies that we hold with solvent insurance carriers. The ultimate results of claims and litigation cannot be predicted with certainty. We believe we have adequate reserves against such matters. We currently believe that the ultimate outcome of such lawsuits and proceedings will not, individually or in the aggregate, have a material adverse effect on our consolidated financial position, results of operations or cash flows. However, depending on the amount and timing, an unfavorable resolution of some or all of these matters could materially affect our future results of operations in a particular period.
Item 4. Mine Safety Disclosures
Not applicable.
PART II
Item 5. Market for Registrant's Common Equity, Related Stockholder Matters and Issuer Purchases of Equity
Securities
Market Information and Dividends
Our common stock is listed for trading on the NYSE under the symbol "HLT." As of December 31, 2022, there were seven holders of record of our common stock, which does not include a substantially greater number of beneficial holders whose shares are held of record by banks, brokers and other financial institutions.
In June 2022, we resumed payment of our regular quarterly cash dividends, which we had suspended in 2020 as a result of the COVID-19 pandemic, and we expect to continue paying regular cash dividends on a quarterly basis. Any decision to declare and pay dividends in the future will be made at the sole discretion of our board of directors, whose decision will depend on, among other things, our results of operations, cash requirements, financial condition, contractual restrictions and other factors that our board of directors may deem relevant. Because we are a holding company and have no direct operations, we will only be able to pay dividends from funds we receive from our subsidiaries.
Performance Graph
The following graph compares Hilton's cumulative total stockholder return since December 31, 2017 with the Standard and Poor's ("S&P") 500 Index ("S&P 500") and the S&P Hotels, Resorts & Cruise Lines Index ("S&P Hotel"). The graph assumes that the value of the investment in our common stock and each index was $100 on December 31, 2017 and that all dividends and other distributions were reinvested. The comparisons in the graph below are based on historical data and are not indicative of, or intended to forecast, future performance of our common stock.
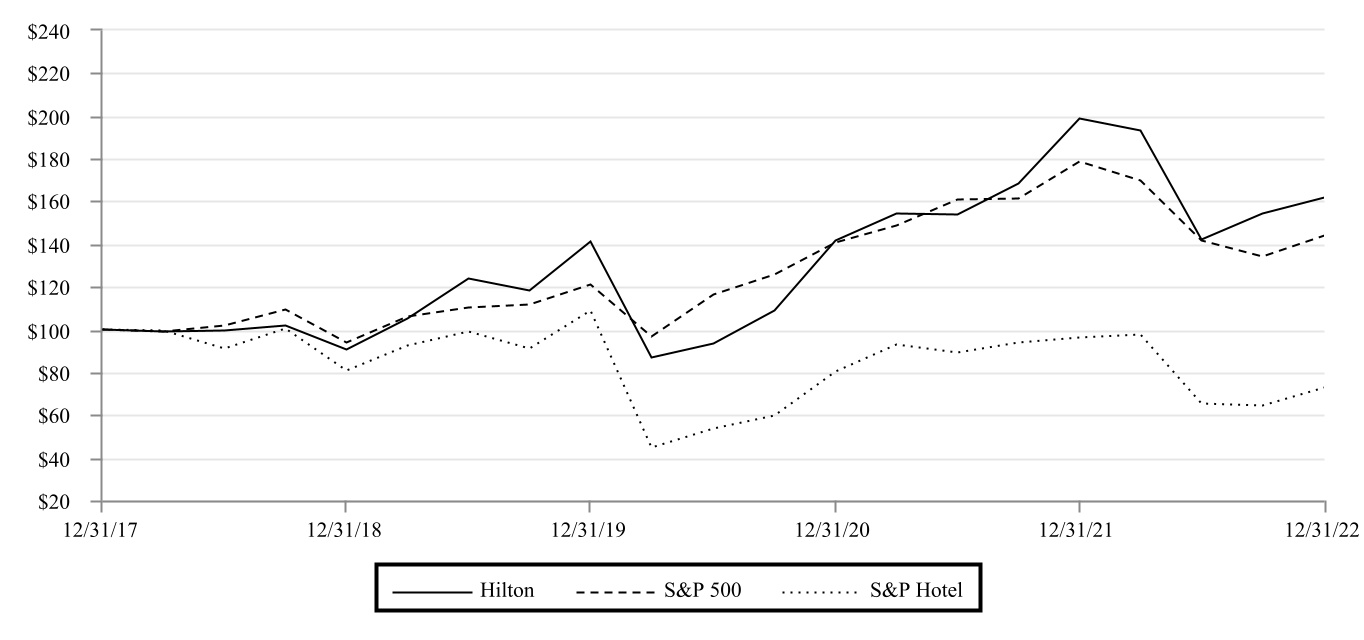
| 12/31/2017 | 12/31/2018 | 12/31/2019 | 12/31/2020 | 12/31/2021 | 12/31/2022 | ||||||||||||||||||||||||||||||
| Hilton | $ | 100.00 | $ | 90.61 | $ | 140.84 | $ | 141.59 | $ | 198.51 | $ | 161.40 | |||||||||||||||||||||||
| S&P 500 | 100.00 | 93.76 | 120.84 | 140.49 | 178.27 | 143.61 | |||||||||||||||||||||||||||||
| S&P Hotel | 100.00 | 80.63 | 108.59 | 80.08 | 95.97 | 72.56 |
Recent Sales of Unregistered Securities
None.
Issuer Purchases of Equity Securities
The following table sets forth information regarding our purchases of shares of our common stock during the three months ended December 31, 2022:
| Total Number of Shares Purchased | Average Price Paid per Share**(1)** | Total Number of Shares Purchased as Part of Publicly Announced Program**(2)** | Maximum Approximate Dollar Value of Shares that May Yet Be Purchased Under the Program**(2)** (in millions) | ||||||||||||||||||||
| October 1, 2022 to October 31, 2022 | 1,253,085 | $ | 125.71 | 1,253,085 | $ | 972 | |||||||||||||||||
| November 1, 2022 to November 30, 2022 | 1,157,159 | 136.13 | 1,157,159 | 3,314 | |||||||||||||||||||
| December 1, 2022 to December 31, 2022 | 1,404,298 | 132.47 | 1,404,298 | 3,128 | |||||||||||||||||||
| Total | 3,814,542 | 131.36 | 3,814,542 |
(1)Includes commissions paid.
(2)In November 2022, our board of directors authorized the repurchase of an additional $2.5 billion of our common stock under our stock repurchase program, which was initially announced in February 2017 and subsequently increased in November 2017, February 2019 and March 2020. As such, our stock repurchase program allows for the repurchase of up to a total of $8 billion of our common stock. Under this publicly announced program, we are authorized to repurchase shares through open market purchases, privately-negotiated transactions or otherwise in accordance with applicable federal securities laws, including through Rule 10b5-1 trading plans and under Rule 10b-18 of the Exchange Act. The repurchase program does not have an expiration date and may be suspended or discontinued at any time.
Item 6. [Reserved]
Item 7. Management's Discussion and Analysis of Financial Condition and Results of Operations
The following discussion and analysis of our financial condition and results of operations should be read in conjunction with our consolidated financial statements and related notes included elsewhere in this Annual Report on Form 10-K.
For the discussion of the financial condition and results of operations for the year ended December 31, 2021 compared to the year ended December 31, 2020, refer to "Part II—Item 7. Management's Discussion and Analysis of Financial Condition and Results of Operations" in our Annual Report on Form 10-K for the fiscal year ended December 31, 2021 filed with the SEC on February 16, 2022, which is incorporated herein by reference.
COVID-19 Pandemic
The COVID-19 pandemic significantly affected the global economy and strained the hospitality industry beginning in 2020. Since the beginning of the pandemic, the pervasiveness and severity of travel restrictions and stay-at-home directives have varied by country and state; however, as of December 31, 2022, most of the countries we operate in had eased or completely lifted such restrictions. While the pandemic negatively affected certain of our results for the years ended December 31, 2022 and 2021, we have experienced strong signs of recovery since early 2021, with comparable system-wide RevPAR in the third and fourth quarters of 2022 exceeding levels achieved in the same periods in 2019. Although all periods included in our consolidated financial statements presented in this Form 10-K were impacted by the COVID-19 pandemic, none of these periods are considered comparable, and no periods affected by the pandemic are expected to be comparable to future periods.
Overview
Our Business
Hilton is one of the largest hospitality companies in the world, with 7,165 properties comprising 1,127,430 rooms in 123 countries and territories as of December 31, 2022. Our premier brand portfolio includes: our luxury hotel brands, Waldorf Astoria Hotels & Resorts, LXR Hotels & Resorts and Conrad Hotels & Resorts; our lifestyle hotel brands, Canopy by Hilton, Curio Collection by Hilton, Tapestry Collection by Hilton, Tempo by Hilton and Motto by Hilton; our full service hotel brands, Signia by Hilton, Hilton Hotels & Resorts and DoubleTree by Hilton; our focused service hotel brands, Hilton Garden Inn, Hampton by Hilton and Tru by Hilton; our all-suites hotel brands, Embassy Suites by Hilton, Homewood Suites by Hilton and Home2 Suites by Hilton; our new premium economy brand, Spark by Hilton, launched in January 2023; and our timeshare brand, Hilton Grand Vacations. As of December 31, 2022, we had 152 million members in our award-winning guest loyalty program, Hilton Honors, a 19 percent increase from December 31, 2021.
Segments and Regions
We analyze our operations and business by both operating segments and geographic regions. Our operations consist of two reportable segments that are based on similar products and services: (i) management and franchise; and (ii) ownership. The management and franchise segment provides services, including hotel management and licensing of our IP. Revenues from this segment include: (i) management and franchise fees charged to third-party hotel owners; (ii) licensing fees from our strategic partners, including co-branded credit card providers, and HGV for the right to use our IP; and (iii) fees for managing hotels in our ownership segment. As a manager of hotels, we typically are responsible for supervising or operating the hotel in exchange for management fees. As a franchisor of hotels, we charge franchise fees in exchange for the use of one of our brand names and related commercial services, such as our reservation system, marketing and information technology services, while a third party manages or operates such franchised hotels. The ownership segment primarily derives revenues from nightly hotel room sales, food and beverage sales and other services at our consolidated owned and leased hotels.
Geographically, we conduct business through three distinct geographic regions: (i) the Americas; (ii) EMEA; and (iii) Asia Pacific. The Americas region includes North America, South America and Central America, including all Caribbean nations. Although the U.S., which represented 69 percent of our system-wide hotel rooms as of December 31, 2022, is included in the Americas region, it is often analyzed separately and apart from the Americas region and, as such, it is presented separately within the analysis herein. The EMEA region includes Europe, which represents the western-most peninsula of Eurasia stretching from Iceland in the west to Russia in the east, and the Middle East and Africa ("MEA"), which represents the Middle East region and all African nations, including the Indian Ocean island nations. Europe and MEA are often analyzed separately and, as such, are presented separately within the analysis herein. The Asia Pacific region includes the eastern and southeastern nations of Asia, as well as India, Australia, New Zealand and the Pacific Island nations.
System Growth and Development Pipeline
Our strategic objectives include the continued expansion of our global hotel network, as well as of our fee-based business. As we enter into new management and franchise contracts, we expand our business with limited or no capital investment by us as the manager or franchisor, since the capital required to build and maintain hotels is typically provided by the third-party owner of the hotel with whom we contract to provide management services or license our IP. Prior to approving the addition of new hotels to our management and franchise development pipeline, we evaluate the economic viability of the hotel based on its geographic location, the credit quality of the third-party owner and other factors. By increasing the number of management and franchise contracts with third-party owners, over time we expect to increase revenues, overall return on invested capital and cash available to support our business needs. See further discussion on our cash management policy, as detailed in "—Liquidity and Capital Resources." While these objectives have not changed as a result of the COVID-19 pandemic, the current economic environment has posed certain challenges to the execution of our growth strategy, which have included and may continue to include delays in openings and new development.
In addition to our current hotel portfolio, we are focused on the growth of our business by expanding our global hotel network through our development pipeline, which represents hotels that we expect to add to our system in the future. The following table summarizes our development activity:
| As of or for the Year Ended December 31, 2022 | |||||||||||
| Hotels | Rooms**(1)** | ||||||||||
| Hotel system | |||||||||||
| Openings | 355 | 58,200 | |||||||||
| Net additions(2) | 308 | 48,300 | |||||||||
| Development pipeline(3) | |||||||||||
| Additions | 664 | 89,900 | |||||||||
| Count as of period end(4) | 2,821 | 416,400 |
(1)Rounded to the nearest hundred.
(2)Represents room additions, net of rooms removed from our system, during the period, which contributed to net unit growth for the year ended December 31, 2022 of 4.7 percent.
(3)Hotels in our system were under development throughout 118 countries and territories, including 30 countries and territories where we did not currently have any existing hotels.
(4)In our development pipeline, as of December 31, 2022, 205,400 of the rooms were under construction and 243,500 of the ro
Showing the first 8K of 73K characters. Open the full section
Item 7A. Quantitative and Qualitative Disclosures About Market Risk
We are exposed to market risk primarily from changes in interest rates and foreign currency exchange rates. These rate changes may affect future income, cash flows and the fair value of the Company, its assets and its liabilities. In certain situations, we may seek to reduce volatility associated with changes in interest rates and foreign currency exchange rates by entering into derivative financial instruments intended to provide a hedge against a portion of the risks associated with such volatility. We continue to have exposure to such risks to the extent they are not hedged. We enter into derivative financial instruments to the extent they meet the objectives described above, and we do not use derivatives for speculative purposes.
Interest Rate Risk
We are exposed to interest rate risk on our variable-rate indebtedness. Our primary sensitivity in 2022 was to changes in one-month LIBOR, as the interest rate on our Term Loan, which represents the majority of our variable-rate indebtedness, was based on this benchmark rate until we amended the credit agreement that governs our Term Loan in December 2022 to adjust our LIBOR-based variable rate to a SOFR-based variable rate. We use an interest rate swap in order to maintain what we believe to be an appropriate level of exposure to interest rate variability. As of December 31, 2022, we held an interest rate swap for a portion of the Term Loan, for which we executed an amendment concurrent with the amendment for our Term Loan, through which we receive one-month term SOFR and pay a fixed rate. We elected to designate this interest rate swap as a cash flow hedge for accounting purposes and applied the practical expedient as prescribed in ASU No. 2020-04, Reference Rate Reform (Topic 848): Facilitation of the Effects of Reference Rate Reform on Financial Reporting that allowed us to maintain hedge accounting with the transition to SOFR.
The following table sets forth the current carrying values of our contractual maturities, total fair values and interest rates as of December 31, 2022 for our financial instruments that are materially affected by interest rate risk, including long-term debt and our interest rate swap:
| Maturities by Period | |||||||||||||||||||||||||||||||||||||||||||||||
| 2023 | 2024 | 2025 | 2026 | 2027 | Thereafter | Carrying Value | Fair Value | ||||||||||||||||||||||||||||||||||||||||
| (dollars in millions) | |||||||||||||||||||||||||||||||||||||||||||||||
| Long-term debt(1): | |||||||||||||||||||||||||||||||||||||||||||||||
| Fixed-rate long-term debt | $ | — | $ | — | $ | 500 | $ | — | $ | 600 | $ | 4,900 | $ | 6,000 | $ | 5,292 | |||||||||||||||||||||||||||||||
| Weighted average fixed interest rate(2) | 4.37 | % | |||||||||||||||||||||||||||||||||||||||||||||
| Variable-rate long-term debt | $ | — | $ | — | $ | — | $ | 2,619 | $ | — | $ | — | $ | 2,619 | $ | 2,616 | |||||||||||||||||||||||||||||||
| Variable interest rate(2)(3) | 6.17 | % | |||||||||||||||||||||||||||||||||||||||||||||
| Interest rate swap(4): | |||||||||||||||||||||||||||||||||||||||||||||||
| Variable to fixed | $ | — | $ | — | $ | — | $ | 1,600 | $ | — | $ | — | $ | 1,600 | $ | 108 | |||||||||||||||||||||||||||||||
| Variable interest rate receivable(3) | 4.32 | % | |||||||||||||||||||||||||||||||||||||||||||||
| Fixed interest rate payable | 1.76 | % |
(1)The carrying values exclude the deduction for unamortized deferred financing costs and any applicable discounts, as well as all finance lease liabilities and other debt of consolidated VIEs totaling $164 million and $37 million, respectively, as of December 31, 2022.
(2)The fixed interest rate is the weighted average of actual rates, and the variable interest rate is based on the market rate prevailing as of December 31, 2022.
(3)The variable interest rate receivable on the interest rate swap does not include fixed components of the overall variable interest rate, including applicable spreads.
(4)The carrying value reflects the notional amount and the variable interest rate receivable is based on the market rate prevailing as of December 31, 2022. We measure our derivative instruments at fair value and, as of December 31, 2022, our interest rate swap was in an asset position.
Refer to Note 10: "Fair Value Measurements" in our consolidated financial statements for additional information on the fair value measurements of our long-term debt and interest rate swap.
Foreign Currency Exchange Rate Risk
We conduct business in various currencies and are exposed to earnings and cash flow volatility associated with changes in foreign currency exchange rates. Our principal exposure results from management and franchise fees earned in foreign currencies, as well as revenues and expenses from our international leased hotels. The value of these revenues and expenses could change materially in relation to the functional currencies of the exposed entities and to our reporting currency, USD. We also have exposure from our international financial assets and liabilities, including certain intercompany financing arrangements
not deemed to be permanently invested, the value of which could change materially in relation to the functional currencies of the exposed entities. As of December 31, 2022, our largest net exposures were to GBP and EUR.
We use forward contracts designated as cash flow hedges to offset exposure from foreign currency exchange rate risks associated with certain of our management, franchise and other fees denominated in certain foreign currencies. We use forward contracts not designated as hedging instruments to offset exposure to foreign currency exchange rate fluctuations in certain cash and intercompany loan balances. We do not consider the fair value or earnings effect of these forward contracts to be material to our consolidated financial statements.
Item 8. Financial Statements and Supplementary Data
INDEX TO CONSOLIDATED FINANCIAL STATEMENTS
| Page No. | |||||
| Management’s Report on Internal Control Over Financial Reporting | 65 | ||||
| Report of Independent Registered Public Accounting Firm – Internal Control Over Financial Reporting | 66 | ||||
| Report of Independent Registered Public Accounting Firm – Financial Statements | 67 | ||||
| Consolidated Financial Statements: | |||||
| Consolidated Balance Sheets as of December 31, 2022 and 2021 | 70 | ||||
| Consolidated Statements of Operations for the years ended December 31, 2022, 2021 and 2020 | 71 | ||||
| Consolidated Statements of Comprehensive Income (Loss) for the years ended December 31, 2022, 2021 and 2020 | 72 | ||||
| Consolidated Statements of Cash Flows for the years ended December 31, 2022, 2021 and 2020 | 73 | ||||
| Consolidated Statements of Stockholders' Equity (Deficit) for the years ended December 31, 2022, 2021 and 2020 | 74 | ||||
| Notes to Consolidated Financial Statements | 75 |
Management's Report on Internal Control Over Financial Reporting
Management of Hilton Worldwide Holdings Inc. (the "Company") is responsible for establishing and maintaining adequate internal control over financial reporting as such term is defined in Rules 13a-15(f) and 15d-15(f) under the Securities Exchange Act of 1934, as amended. The Company’s internal control over financial reporting is designed to provide reasonable assurance regarding the reliability of financial reporting and the preparation of financial statements for external purposes in accordance with United States generally accepted accounting principles ("GAAP"). The Company's internal control over financial reporting includes those policies and procedures that: (i) pertain to the maintenance of records that, in reasonable detail, accurately and fairly reflect the transactions and dispositions of the assets of the Company; (ii) provide reasonable assurance that transactions are recorded as necessary to permit preparation of financial statements in accordance with GAAP, and that receipts and expenditures of the Company are being made only in accordance with authorizations of the Company’s management and directors; and (iii) provide reasonable assurance regarding prevention or timely detection of unauthorized acquisition, use or disposition of assets of the Company that could have a material effect on the financial statements.
Because of its inherent limitations, internal control over financial reporting may not prevent or detect misstatements. Also, projections of any evaluation of effectiveness to future periods are subject to the risk that controls may become inadequate because of changes in conditions, or that the degree of compliance with the policies or procedures may deteriorate.
Management has assessed the effectiveness of the Company’s internal control over financial reporting as of December 31, 2022. In making this assessment, management used the criteria established in the Internal Control-Integrated Framework issued by the Committee of Sponsoring Organizations of the Treadway Commission (2013 framework). Based on this assessment, management determined that the Company maintained effective internal control over financial reporting as of December 31, 2022.
Ernst & Young LLP (PCAOB ID: 42), the independent registered public accounting firm that has audited the consolidated financial statements included in this Annual Report on Form 10-K, has issued an attestation report on the Company’s internal control over financial reporting as of December 31, 2022. The report is included herein.
Report of Independent Registered Public Accounting Firm
To the Stockholders and the Board of Directors of
Hilton Worldwide Holdings Inc.
Opinion on Internal Control Over Financial Reporting
We have audited Hilton Worldwide Holdings Inc.'s internal control over financial reporting as of December 31, 2022, based on criteria established in Internal Control—Integrated Framework issued by the Committee of Sponsoring Organizations of the Treadway Commission (2013 framework) (the COSO criteria). In our opinion, Hilton Worldwide Holdings Inc. (the Company) maintained, in all material respects, effective internal control over financial reporting as of December 31, 2022, based on the COSO criteria.
We also have audited, in accordance with the standards of the Public Company Accounting Oversight Board (United States) (PCAOB), the consolidated balance sheets of the Company as of December 31, 2022 and 2021, the related consolidated statements of operations, comprehensive income (loss), cash flows and stockholders' equity (deficit) for each of the three years in the period ended December 31, 2022 and the related notes, and our report dated February 9, 2023 expressed an unqualified opinion thereon.
Basis for Opinion
The Company's management is responsible for maintaining effective internal control over financial reporting and for its assessment of the effectiveness of internal control over financial reporting included in the accompanying Management's Report on Internal Control Over Financial Reporting. Our responsibility is to express an opinion on the Company's internal control over financial reporting based on our audit. We are a public accounting firm registered with the PCAOB and are required to be independent with respect to the Company in accordance with the U.S. federal securities laws and the applicable rules and regulations of the Securities and Exchange Commission and the PCAOB.
We conducted our audit in accordance with the standards of the PCAOB. Those standards require that we plan and perform the audit to obtain reasonable assurance about whether effective internal control over financial reporting was maintained in all material respects.
Our audit included obtaining an understanding of internal control over financial reporting, assessing the risk that a material weakness exists, testing and evaluating the design and operating effectiveness of internal control based on the assessed risk, and performing such other procedures as we considered necessary in the circumstances. We believe that our audit provides a reasonable basis for our opinion.
Definition and Limitations of Internal Control Over Financial Reporting
A company's internal control over financial reporting is a process designed to provide reasonable assurance regarding the reliability of financial reporting and the preparation of financial statements for external purposes in accordance with generally accepted accounting principles. A company's internal control over financial reporting includes those policies and procedures that (1) pertain to the maintenance of records that, in reasonable detail, accurately and fairly reflect the transactions and dispositions of the assets of the company; (2) provide reasonable assurance that transactions are recorded as necessary to permit preparation of financial statements in accordance with generally accepted accounting principles, and that receipts and expenditures of the company are being made only in accordance with authorizations of management and directors of the company; and (3) provide reasonable assurance regarding prevention or timely detection of unauthorized acquisition, use, or disposition of the company’s assets that could have a material effect on the financial statements.
Because of its inherent limitations, internal control over financial reporting may not prevent or detect miss
Showing the first 8K of 189K characters. Open the full section
Item 9. Changes in and Disagreements with Accountants on Accounting and Financial Disclosure
None.
Item 9A. Controls and Procedures
Disclosure Controls and Procedures
The Company maintains a set of disclosure controls and procedures as that term is defined in Rules 13a-15(e) and 15d-15(e) under the Exchange Act, that are designed to ensure that information required to be disclosed by the Company in reports that it files or submits under the Exchange Act, is recorded, processed, summarized and reported within the time periods specified in SEC rules and forms, and that such information is accumulated and communicated to the Company's management, including its Chief Executive Officer and Chief Financial Officer, as appropriate, to allow timely decisions regarding required disclosures. The design of any disclosure controls and procedures is based in part upon certain assumptions about the likelihood of future events, and there can be no assurance that any design will succeed in achieving its stated goals under all potential future conditions. Any controls and procedures, no matter how well designed and operated, can provide only reasonable, not absolute, assurance of achieving the desired control objectives. In accordance with Rule 13a-15(b) of the Exchange Act, as of the end of the period covered by this annual report, an evaluation was carried out under the supervision and with the participation of the Company’s management, including its Chief Executive Officer and Chief Financial Officer, of the effectiveness of its disclosure controls and procedures. Based on that evaluation, the Company’s Chief Executive Officer and Chief Financial Officer concluded that the Company’s disclosure controls and procedures, as of the end of the period covered by this annual report, were effective to provide reasonable assurance that information required to be disclosed by the Company in reports that it files or submits under the Exchange Act is recorded, processed, summarized and reported within the time periods specified in SEC rules and forms and is accumulated and communicated to the Company’s management, including the Chief Executive Officer and Chief Financial Officer, as appropriate to allow timely decisions regarding required disclosure.
Management’s Annual Report on Internal Control Over Financial Reporting
We have set forth management's report on internal control over financial reporting and the attestation report of our independent registered public accounting firm on the effectiveness of our internal control over financial reporting in Item 8 of this Annual Report on Form 10-K. Management's report on internal control over financial reporting is incorporated in this Item 9A by reference.
Changes in Internal Control Over Financial Reporting
There has been no change in the Company’s internal control over financial reporting during the Company’s most recent fiscal quarter that has materially affected, or is reasonably likely to materially affect, the Company’s internal control over financial reporting.
Item 9B. Other Information
None.
Item 9C. Disclosure Regarding Foreign Jurisdictions that Prevent Inspections
Not applicable.
PART III
Item 10. Directors, Executive Officers and Corporate Governance
The information required by this item is incorporated by reference to our definitive proxy statement for the 2023 Annual Meeting of Stockholders to be filed with the SEC within 120 days of the fiscal year ended December 31, 2022.
Item 11. Executive Compensation
The information required by this item is incorporated by reference to our definitive proxy statement for the 2023 Annual Meeting of Stockholders to be filed with the SEC within 120 days of the fiscal year ended December 31, 2022.
Item 12. Security Ownership of Certain Beneficial Owners and Management and Related Stockholder Matters
Securities Authorized for Issuance Under Equity Compensation Plans
The following table provides certain information about common stock that may be issued under our existing equity compensation plans. The only plan pursuant to which the Company may grant new equity-based awards is the Hilton 2017 Omnibus Incentive Plan, which replaced the Company's 2013 Omnibus Incentive Plan. The number of securities to be issued upon exercise of outstanding options, warrants and rights reflected in the table below includes shares underlying equity-based awards granted, and that remained outstanding as of December 31, 2022 under the equity compensation plans.
| As of December 31, 2022 | |||||||||||||||||
| Number of securities to be issued upon exercise of outstanding options, warrants and rights**(1)** | Weighted average exercise price per share of outstanding options | Number of securities remaining available for future issuance under equity compensation plans | |||||||||||||||
| Equity compensation plans approved by stockholders | 5,584,421 | $ | 87.61 | 11,433,578 |
(1)Includes shares issuable upon exercise of stock options and 2,564,151 shares that may be issued upon the vesting of certain share-based compensation awards. The number of shares to be issued in respect of performance shares has been calculated based on the assumption that the maximum levels of performance applicable to the performance shares will be achieved. The RSUs and performance shares cannot be exercised for consideration.
The remaining information required by this item is incorporated by reference to our definitive proxy statement for the 2023 Annual Meeting of Stockholders to be filed with the SEC within 120 days of the fiscal year ended December 31, 2022.
Item 13. Certain Relationships and Related Transactions, and Director Independence
The information required by this item is incorporated by reference to our definitive proxy statement for the 2023 Annual Meeting of Stockholders to be filed with the SEC within 120 days of the fiscal year ended December 31, 2022.
Item 14. Principal Accounting Fees and Services
The information required by this item is incorporated by reference to our definitive proxy statement for the 2023 Annual Meeting of Stockholders to be filed with the SEC within 120 days of the fiscal year ended December 31, 2022.
PART IV
Item 15. Exhibits and Financial Statement Schedules
The following documents are filed as part of this report:
(a)Financial Statements
We include this portion of Item 15 under Item 8 of this Annual Report on Form 10-K.
(b)Financial Statement Schedules
All schedules are omitted as the required information is either not present, not present in material amounts or presented within the consolidated financial statements or related notes.
(c)Exhibits:
| Exhibit Number | Exhibit Description | |||||||
| 31.2 | Certificate of Kevin J. Jacobs, Executive Vice President and Chief Financial Officer, pursuant to Section 302 of the Sarbanes-Oxley Act of 2002. | |||||||
| 32.1 | Certificate of Christopher J. Nassetta, President and Chief Executive Officer, pursuant to Section 18 U.S.C. Section 1350, as adopted pursuant to Section 906 of the Sarbanes-Oxley Act of 2002 (furnished herewith). | |||||||
| 32.2 | Certificate of Kevin J. Jacobs, Executive Vice President and Chief Financial Officer, pursuant to Section 18 U.S.C. Section 1350, as adopted pursuant to Section 906 of the Sarbanes-Oxley Act of 2002 (furnished herewith). | |||||||
| 101.INS | Inline XBRL Instance Document - this instance document does not appear in the Interactive Data File because its XBRL tags are embedded within the Inline XBRL document. | |||||||
| 101.SCH | Inline XBRL Taxonomy Extension Schema Document. | |||||||
| 101.CAL | Inline XBRL Taxonomy Extension Calculation Linkbase Document. | |||||||
| 101.DEF | Inline XBRL Taxonomy Definition Linkbase Document. | |||||||
| 101.LAB | Inline XBRL Taxonomy Extension Label Linkbase Document. | |||||||
| 101.PRE | Inline XBRL Taxonomy Extension Presentation Linkbase Document. | |||||||
| 104 | Cover Page Interactive Data File (embedded within the Inline XBRL document). |
*This document has been identified as a management contract or compensatory plan or arrangement.
The agreements and other documents filed as exhibits to this report are not intended to provide factual information or other disclosure other than with respect to the terms of the agreements or other documents themselves, and you should not rely on them for that purpose. In particular, any representations and warranties made by us in these agreements or other documents were made solely within the specific context of the relevant agreement or document and may not describe the actual state of affairs as of the date they were made or at any other time.
Item 16. Form 10-K Summary
None.
Signatures
Pursuant to the requirements of Section 13 or 15(d) of the Securities Exchange Act of 1934, the Registrant has duly caused this report to be signed on its behalf by the undersigned, thereunto duly authorized, in McLean, Virginia, on the 9th day of February 2023.
| HILTON WORLDWIDE HOLDINGS INC. | ||||||||
| By: | /s/ Christopher J. Nassetta | |||||||
| Name: | Christopher J. Nassetta | |||||||
| Title: | President and Chief Executive Officer |
Pursuant to the requirements of the Securities Exchange Act of 1934, this report has been signed by the following persons in the capacities indicated on the 9th day of February 2023.
| Signature | Title | |||||||
| /s/ Christopher J. Nassetta | President, Chief Executive Officer and Director | |||||||
| Christopher J. Nassetta | (principal executive officer) | |||||||
| /s/ Jonathan D. Gray | Chairman of the Board of Directors | |||||||
| Jonathan D. Gray | ||||||||
| /s/ Charlene T. Begley | Director | |||||||
| Charlene T. Begley | ||||||||
| /s/ Chris Carr | Director | |||||||
| Chris Carr | ||||||||
| /s/ Melanie L. Healey | Director | |||||||
| Melanie L. Healey | ||||||||
| /s/ Raymond E. Mabus, Jr. | Director | |||||||
| Raymond E. Mabus, Jr. | ||||||||
| /s/ Judith A. McHale | Director | |||||||
| Judith A. McHale | ||||||||
| /s/ Elizabeth A. Smith | Director | |||||||
| Elizabeth A. Smith | ||||||||
| /s/ Douglas M. Steenland | Director | |||||||
| Douglas M. Steenland | ||||||||
| /s/ Kevin J. Jacobs | Chief Financial Officer and President, Global Development | |||||||
| Kevin J. Jacobs | (principal financial officer) | |||||||
| /s/ Michael W. Duffy | Senior Vice President, Chief Accounting and Risk Officer | |||||||
| Michael W. Duffy | (principal accounting officer) |