 filings.tools
Item 7. Management’s Discussion and Analysis of Financial Condition and Results of Operations
35K characters. Original on sec.gov ·
Item 7. Management’s Discussion and Analysis of Financial Condition and Results of Operations
MANAGEMENT'S DISCUSSION AND ANALYSIS OF FINANCIAL CONDITION AND RESULTS OF OPERATIONS
(Dollars in tables and graphs in millions)
The following Management’s Discussion and Analysis of Financial Condition and Results of Operations is intended to help the reader understand the results of operations and financial condition of Honeywell International Inc. and its consolidated subsidiaries (Honeywell or the Company) for the three years ended December 31, 2020. All references to Notes relate to Notes to Consolidated Financial Statements in the section titled Financial Statements and Supplementary Data.
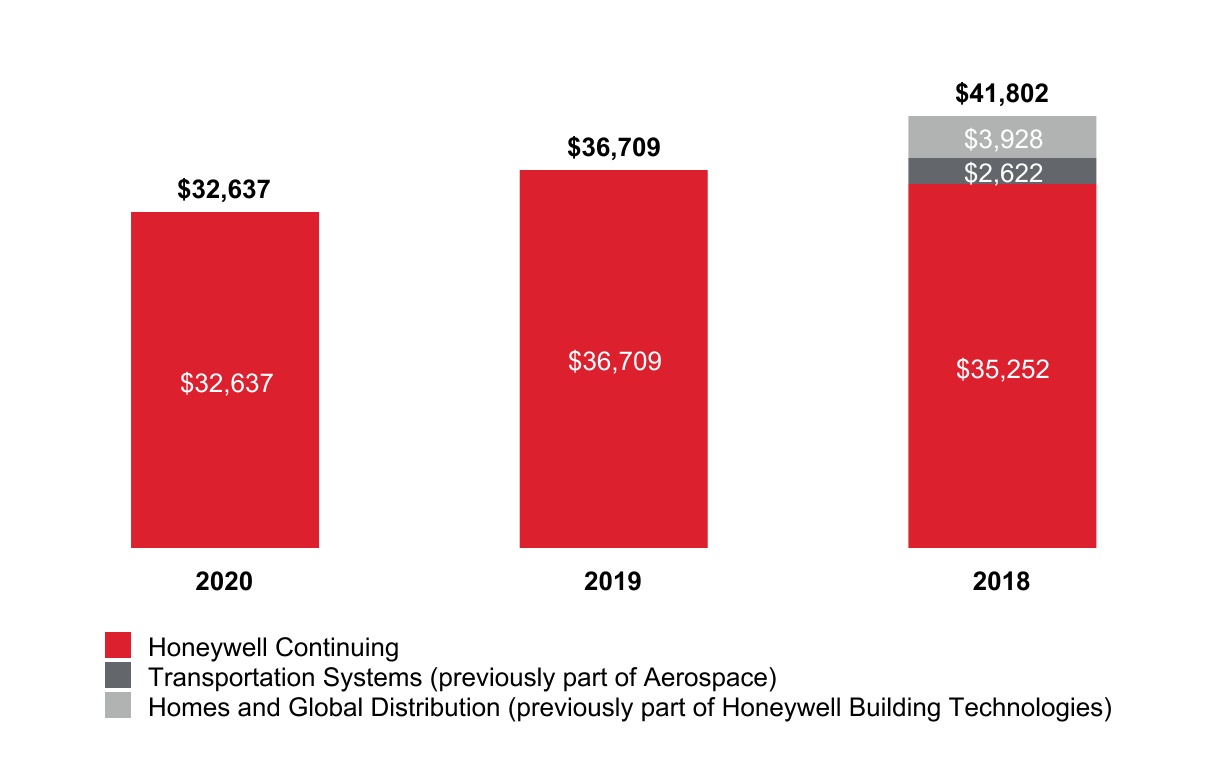
On October 1, 2018, we completed the tax-free spin-off to Honeywell shareowners of our Transportation Systems business, previously part of Aerospace, into a standalone publicly-traded company, Garrett Motion Inc. (Garrett).
On October 29, 2018, we completed the tax-free spin-off to Honeywell shareowners of our Homes and Global Distribution business, previously part of Home and Building Technologies (renamed Honeywell Building Technologies following the spin-off), into a standalone publicly-traded company, Resideo Technologies, Inc. (Resideo).
We removed the assets and liabilities associated with Garrett and Resideo from our Consolidated Balance Sheet as of the effective dates of the respective spin-offs. We included the results of operations for Garrett and Resideo in our Consolidated Statement of Operations through the effective dates of the respective spin-offs. Total sales attributable to these spin-offs were $6.6 billion for the year ended December 31, 2018.
A detailed discussion of the prior year 2019 to 2018 year-over-year changes are not included herein and can be found in the Management's Discussion and Analysis of Financial Condition and Results of Operations section in the 2019 Annual Report on Form 10-K filed February 14, 2020.
COVID-19 UPDATE
In December 2019, a novel strain of coronavirus (COVID-19) was identified in Asia. Over the next several months, COVID-19 quickly spread across the world. In March 2020, the World Health Organization declared COVID-19 a worldwide pandemic. As of December 31, 2020, the virus continues to spread and many countries are experiencing a resurgence in infection rates. Although vaccines have recently been made available, the availability and distribution of the vaccines continue to provide challenges.
Governments took unprecedented actions to contain the spread of COVID-19, temporarily shutting down non-essential businesses, issuing stay at home or “shelter in place” orders and asking citizens to avoid all non-essential travel. In certain situations, governments closed borders and issued mandatory quarantines. Companies were asked, and in many cases were required, to allow non-essential employees to work remotely. Consumer spending declined, global travel demand declined significantly, and the world entered a global recession.
These events impacted our business operations in multiple ways. In the first quarter of 2020, we quickly responded to the changing environment. In January 2020, we implemented policies in select countries within Asia to restrict travel and require employees to work from home for all roles that allow for remote work. In March 2020, we expanded this work from home policy to include our employees worldwide. We introduced appropriate safety and hygiene protocols to enable our manufacturing employees to operate safely through the pandemic. We actively monitored the changing government rules and regulations for each of our locations worldwide.
We remain cautious as many factors remain unpredictable, including the increasing rate of COVID-19 infections. We continue to monitor COVID-19 infection rates globally and acknowledge the risk of new surges in COVID-19 infections.
We prepared procedures for the phased return of our employees to office sites and trained our local site leaders in the appropriate safety and hygiene protocols. As of December 31, 2020, all of our manufacturing sites continue to operate and, outside of India, most of our employees in Asia have returned to the workplace in some capacity. We also returned small numbers of workers to select office sites within Europe and North America. In many countries, including the U.S., most of our non-manufacturing employees continue to work from home (for all roles that allow for remote work).
9 Honeywell International, Inc.
The global recession resulted in a slow-down in demand for many of the products and services that we offer. The impact on each of our businesses is outlined below:
-
Aerospace** – The decline in global travel negatively impacted many of our customers, resulting in lower demand for our products from OEMs and negatively impacted demand for our commercial aftermarket businesses. As a result, this segment's sales and profits declined for the year ended December 31, 2020, compared to the year ended December 31, 2019.
-
Performance Materials and Technologies** – Many of our customers operate in the oil and gas industry. The decline in global travel, coupled with excessive oil and gas supply, negatively impacted many of our customers and resulted in lower demand for our products. As a result, this segment's sales and profits declined for the year ended December 31, 2020, compared to the year ended December 31, 2019.
-
Honeywell Building Technologies** – Our customers own or manage buildings in a variety of industries including commercial real estate, hospitality, government, healthcare, banking and education. The global recession impacted many of these industries, resulting in a reduction of discretionary spending. As a result, this segment's sales and profits declined for the year ended December 31, 2020, compared to the year ended December 31, 2019.
-
Safety and Productivity Solutions** – The global pandemic created significant demand for our respiratory PPE and warehouse automation driving increases in this segment's sales and profits for the year ended December 31, 2020, compared to the year ended December 31, 2019.
As a result of the slowdown in demand for our products, we implemented several cost reduction programs across our enterprise. We canceled our 2020 merit increases and reduced executive and Board of Director compensation. We initiated reduced work schedules across the company and implemented permanent census reductions.
We also took several steps to secure additional liquidity. In March 2020, we entered into a $6.0 billion Delayed Draw Term Loan Agreement. In May 2020, we completed a public Senior Notes offering, which provided $3.0 billion of available liquidity and permanently reduced the undrawn commitments under the Delayed Draw Term Loan Agreement by $3.0 billion. In June 2020, we drew on the remaining $3.0 billion of commitments under the Delayed Draw Term Loan Agreement. In August 2020, we completed a public Senior Notes offering, which provided $3.0 billion of available liquidity and was used to repay the outstanding principal amount of $3.0 billion under the Delayed Draw Term Loan Agreement. As of December 31, 2020, there are no outstanding borrowings or commitments remaining under the Delayed Draw Term Loan Agreement. Further, we held $15.2 billion of available cash and cash equivalents, including short-term investments.
We continue to monitor and respond to the changing conditions created by the pandemic.
Employee Health, Safety, and Economic Wellness
We continue to monitor the COVID-19 situation and its impacts globally. We are prioritizing the health and safety of our employees. Out of an abundance of caution for the health of our employees and to support local government initiatives to stem the spread of the virus, we implemented several precautions at various sites around the world at all times in compliance with local government requirements and Centers for Disease Control and Prevention (CDC) guidelines. These include, but are not limited to:
-
Limiting visitor site access to business-essential purposes;
-
Introducing screening checks at certain sites where permissible or mandated;
-
Enabling employees to work from home wherever and whenever required or appropriate;
-
Continuously updating travel guidance, according to latest developments; and
-
Complying with all local health authority guidance or regulations and our own protocols, including requesting employees to comply with self-quarantine requirements whenever advisable.
We have taken a number of measures to support our employees during these difficult times. We extended medical benefits globally to cover out-of-pocket costs associated with testing for coronavirus, and for those on our U.S. company medical plans, we are also covering treatment costs. In Mexico, we introduced a medical benefit for employees at lower compensation levels to ensure access to private medical treatment. In the U.S., we changed our sick leave plan for non-exempt employees to make more sick time available earlier in the year if it is needed. We established a $10 million company-funded relief fund targeting employees worldwide at lower compensation levels, especially those on reduced work hours who did not receive high levels of income replacement from unemployment or other government assistance.
10 Honeywell International, Inc.
In addition to the measures to assist our employees, Honeywell contributed $2 million to establish a Small Business Innovation Fund in Charlotte to help our local economy. The fund helps storefront businesses with 50 or fewer employees make investments in new technologies and business models to adjust to the realities of operating in the COVID-19 environment. The fund prioritizes businesses owned by women, minorities and veterans.
Our Commitment to Public Health
In a partnership with the State of North Carolina and other local businesses, we announced a goal to deliver 1 million COVID-19 vaccines in North Carolina by July 4, 2021. In Phoenix, where our Aerospace business is headquartered, we will sponsor a week-long vaccination program in February 2021. In addition, Honeywell funded the provision of approximately 10 million meals and a month’s supply of hygiene kits to families in India suffering hardships due to the crisis.
As we produce critical worker safety gear such as face masks, gloves, goggles, safety suits, and protective footwear, we play an essential role in the health and well-being of people and economies. To date, Honeywell has donated more than 2 million masks to frontline workers across multiple regions. Our customers and communities are depending on us more than ever to deliver for them and we are committed to supporting the safety of our employees, customers and fellow citizens around the world.
We are investing in new production facilities and continue to expand existing facilities to increase production of essential PPE products. We will bring these products to market as quickly as possible. We are committed to healthcare professionals, first responders, distributors and other stakeholders in an effort to ensure our PPE products are being placed quickly and cost-effectively in the hands of those most in need.
We announced our new capacity in the U.S. to make N95 masks, with production lines added in Rhode Island and Arizona that will collectively produce 40 million masks each month to support health, safety, and response workers globally. In addition, we are expanding our non-U.S. capacity with a new mask manufacturing line in the UK that is expected to produce 4.5 million masks each month, and a new line in India that is expected to produce 2 million masks each month. Separately, we are collaborating with Mubadala Investment Company's subsidiary, Strata Manufacturing, in the UAE to produce 30 million masks annually.
We have communicated the following principles to our authorized distributor network:
-
Our expectation that, at a minimum, all of our partners will comply with all applicable laws prohibiting price gouging and apply appropriate diligence to the greatest extent possible to understand how our products are being purchased so that they are placed quickly and cost-effectively in the hands of those most in need - including first responders and medical professionals.
-
While we do not control the prices that third parties set, we expect our partners to fairly price PPE used in the COVID-19 response effort.
-
If we find that one of our partners is not upholding the letter or spirit of these principles, we reserve the right not to fulfill that partner’s orders and terminate our relationship with that party.
We are also investing in developing and bringing to market a wide array of new COVID-related products, including but not limited to Healthy Buildings solutions, remote operations offerings, automation technologies to help speed vaccine development, vaccine packaging solutions, an ultraviolet cleaning system for aircraft, innovative dual-layer face covers and safety packs.
Plant Productivity and Safety
In situations where our businesses were deemed essential, we worked with local officials to determine how to safely operate our manufacturing facilities. We successfully operated these manufacturing facilities with minimal disruption in our productivity. In the second quarter of 2020, we repurposed certain manufacturing facilities to produce PPE that was in short supply around the world. As of December 31, 2020, more than 95% of our manufacturing sites were operating at normal production levels.
We continue to provide essential services and produce essential goods around the world. We employ standards such as screening checks, use of masks, face coverings and other safety equipment and social distancing practices along production lines in our production facilities at all times in compliance with local government requirements and CDC guidelines. We take appropriate actions including disinfecting and quarantine procedures when a suspected COVID-19 case is identified.
11 Honeywell International, Inc.
Customers and Suppliers
Current global economic conditions due to COVID-19 have adversely affected and may continue to adversely affect our customers’ and suppliers’ ability to operate or obtain financing, particularly in our airline, oil and gas, and automotive end markets. Customer or supplier bankruptcies, delays in their ability to obtain financing, or the unavailability of financing could adversely affect our cash flow or results of operations. We continue to actively monitor both supplier and customer financial health and take measures to manage our supply chain disruptions and limit our exposure.
See section titled Risk Factors for discussion of risks associated to the COVID-19 pandemic.
12 Honeywell International, Inc.
RESULTS OF OPERATIONS
Consolidated Financial Results

Net Sales by Segment
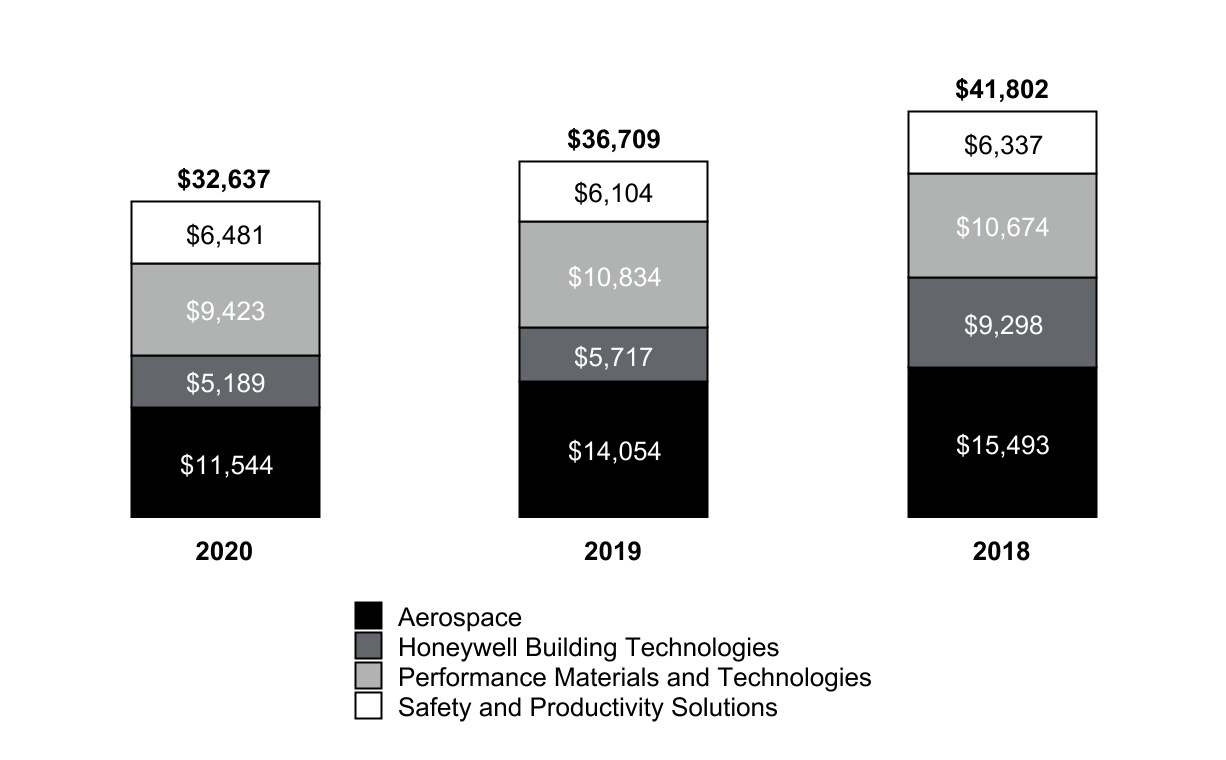
13 Honeywell International, Inc.
Net Sales Attributable to Spun-Off Entities
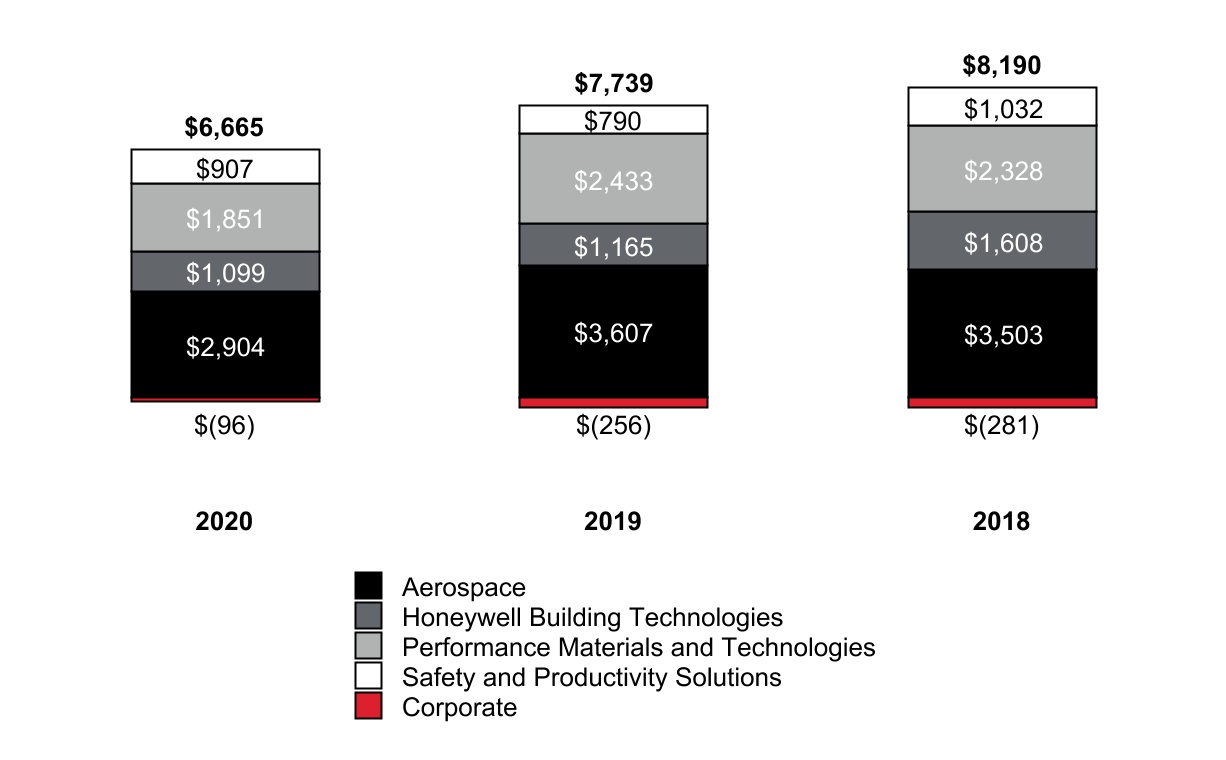
Segment Profit by Segment
14 Honeywell International, Inc.
CONSOLIDATED OPERATING RESULTS
Net Sales
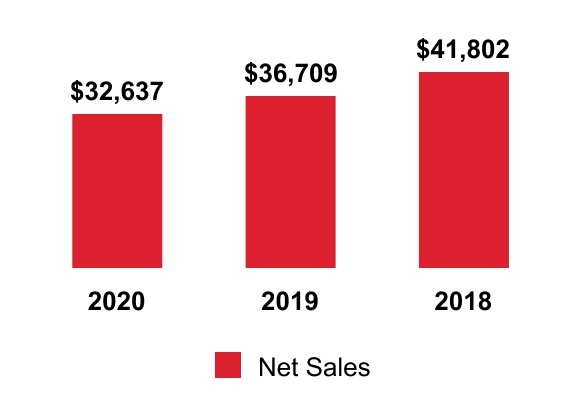
The change in net sales was attributable to the following:
| 2020 Versus 2019 | 2019 Versus 2018 | ||||||||||
| Volume | (12) | % | 3 | % | |||||||
| Price | 1 | % | 2 | % | |||||||
| Foreign Currency Translation | — | % | (1) | % | |||||||
| Acquisitions/Divestitures | — | % | (16) | % | |||||||
| (11) | % | (12) | % |
2020 compared with 2019
A discussion of net sales by segment can be found in the Review of Business Segments section of this Management Discussion and Analysis.
The unfavorable volume in 2020 was driven by:
-
Lower sales across our businesses due to the impact of the global recession attributable to COVID-19 and volatility in the oil and gas industry,
-
Partially offset by strength in respiratory PPE products, warehouse automation projects, and defense and space.
15 Honeywell International, Inc.
Cost of Products and Services Sold
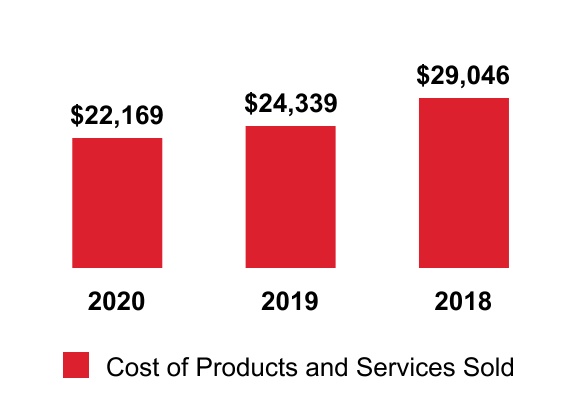
2020 compared with 2019
Cost of products and services sold decreased in 2020 primarily due to the following:
-
Lower direct and indirect material costs by approximately $1,130 million and $310 million,
-
Lower labor costs by approximately $800 million, driven by lower sales volumes and other cost actions to improve productivity.
Gross Margin
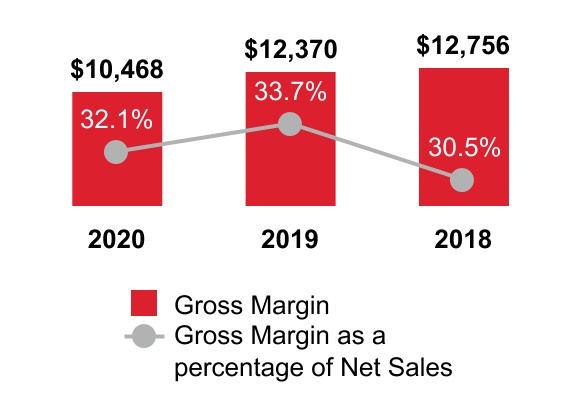
2020 compared with 2019
Gross margin percentage decreased in 2020 primarily due to the following:
-
Lower gross margin in the Performance Materials and Technologies, Aerospace, and Safety and Productivity Solutions segments,
-
Partially offset by higher Honeywell Building Technologies gross margin.
16 Honeywell International, Inc.
Selling, General and Administrative Expenses
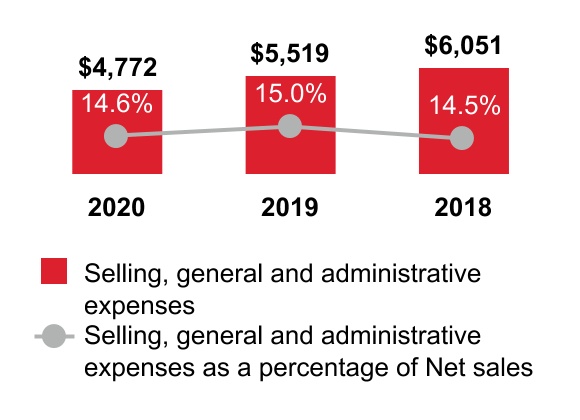
2020 compared with 2019
Selling, general and administrative expenses decreased due to higher productivity, including lower costs resulting from repositioning actions.
Other (Income) Expense
| 2020 | 2019 | 2018 | |||||||||||||||
| Other (income) expense | $ | (675) | $ | (1,065) | $ | (1,149) |
2020 compared with 2019
Other (income) expense changed due to the following:
-
Non-cash charges associated with the reduction in value of reimbursement receivables due from Garrett,
-
Lower interest income, and
-
Lower foreign exchange income,
-
Partially offset by higher pension income, higher equity income of affiliated companies and higher other postretirement income.
17 Honeywell International, Inc.
Tax Expense
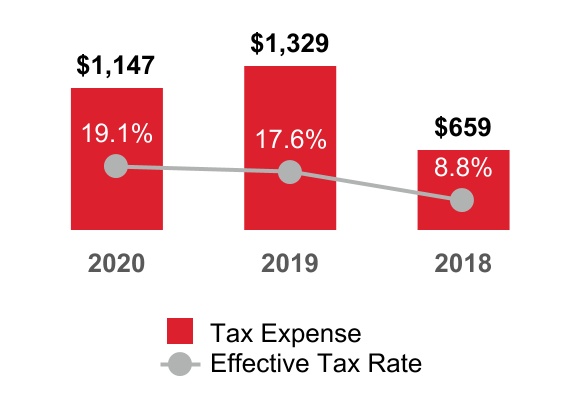
2020 compared with 2019
The effective tax rate for 2020 was lower than the U.S. federal statutory rate of 21% primarily due to the favorable resolution of a foreign tax matter related to the previously completed spin-off transactions, tax impact of restructuring, tax law changes in India, and the resolution of certain U.S. tax matters offset by accrued withholding taxes related to unremitted foreign earnings and non-cash charges related to the reduction of the aggregate carrying value of certain receivables with no corresponding tax benefit.
The effective tax rate for 2019 was lower than the U.S. federal statutory rate of 21% primarily resulting from the impacts of revised guidance related to U.S. Tax Cuts and Jobs Act and internal restructuring initiatives that resulted in a $281 million reduction of accrued withholding taxes related to unremitted foreign earnings.
For further discussion of changes in the effective tax rate, see Note 5 Income Taxes of Notes to Consolidated Financial Statements.
Net Income Attributable to Honeywell

2020 compared with 2019
Earnings per share of common stock–assuming dilution decreased due to the following:
-
Lower segment profit due to the impact of the global recession attributable to COVID-19 and volatility in the oil and gas industry,
-
Non-cash charges associated with the reduction in value of reimbursement receivables due from Garrett, and
-
Lower interest income, lower foreign exchange income, and higher repositioning costs,
-
Partially offset by lower income taxes, higher pension income, and the favorable impact of lower outstanding share count resulting from the Company's stock repurchases.
18 Honeywell International, Inc.
REVIEW OF BUSINESS SEGMENTS
We globally manage our business operations through four segments: Aerospace, Honeywell Building Technologies, Performance Materials and Technologies, and Safety and Productivity Solutions.
AEROSPACE
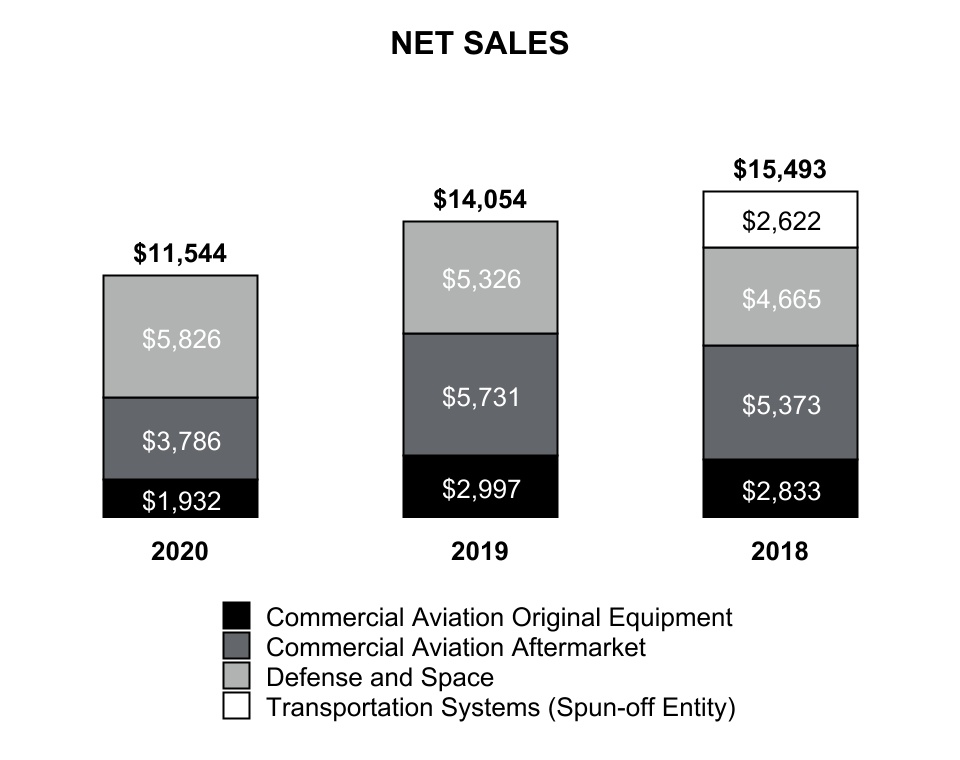
| 2020 | 2019 | Change 2020 vs 2019 | 2018 | Change 2019 vs 2018 | |||||||||||||||||||||||||
| Net sales | $ | 11,544 | $ | 14,054 | (18) | % | $ | 15,493 | (9) | % | |||||||||||||||||||
| Cost of products and services sold | 7,813 | 9,398 | 10,837 | ||||||||||||||||||||||||||
| Selling, general and administrative and other expenses | 827 | 1,049 | 1,153 | ||||||||||||||||||||||||||
| Segment profit | $ | 2,904 | $ | 3,607 | (19) | % | $ | 3,503 | 3 | % |
| Factors Contributing to Year-Over-Year Change | 2020 vs. 2019 | 2019 vs. 2018 | |||||||||||||||||||||
| Net Sales | Segment Profit | Net Sales | Segment Profit | ||||||||||||||||||||
| Organic | (18) | % | (20) | % | 9 | % | 21 | % | |||||||||||||||
| Foreign currency translation | — | % | — | % | — | % | — | % | |||||||||||||||
| Acquisitions, divestitures and other, net | — | % | 1 | % | (18) | % | (18) | % | |||||||||||||||
| Total % Change | (18) | % | (19) | % | (9) | % | 3 | % |
19 Honeywell International, Inc.
2020 compared with 2019
Aerospace Net sales decreased due to lower sales volumes as the decline in global travel resulting form COVID-19 negatively impacted many of our customers, resulting in lower demand for our products from OEMs and reduced demand for our aftermarket products and services.
-
Commercial Aviation Original Equipment sales decreased 36% (decreased 35% organic) due to lower demand from air transport and regional and business aviation OEMs.
-
Commercial Aviation Aftermarket sales decreased 34% (decreased 34% organic) due to lower demand in air transport and regional and business aviation.
-
Defense and Space sales increased 9% (increased 10% organic) driven by growth in U.S. and international defense.
Aerospace segment profit decreased due to lower sales volume and lower sales of higher margin products and services, partially offset by favorable pricing. Cost of products and services sold decreased due to lower sales volumes.
HONEYWELL BUILDING TECHNOLOGIES
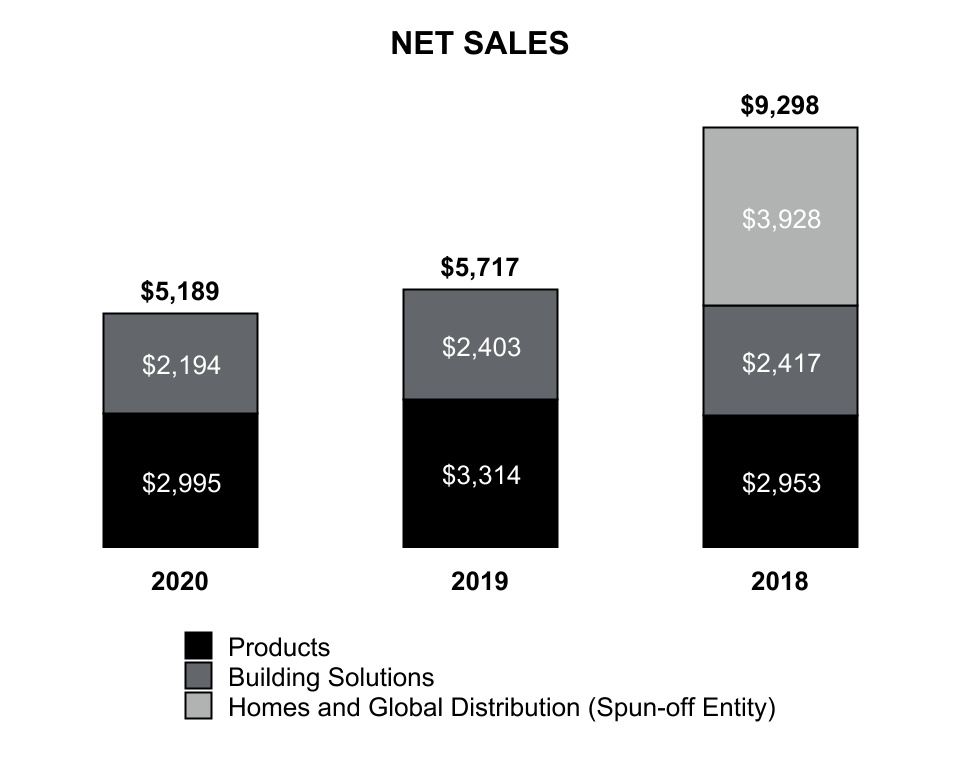
| 2020 | 2019 | Change 2020 vs. 2019 | 2018 | Change 2019 vs. 2018 | |||||||||||||||||||||||||
| Net sales | $ | 5,189 | $ | 5,717 | (9) | % | $ | 9,298 | (39) | % | |||||||||||||||||||
| Cost of products and services sold | 3,067 | 3,444 | 6,066 | ||||||||||||||||||||||||||
| Selling, general and administrative and other expenses | 1,023 | 1,108 | 1,624 | ||||||||||||||||||||||||||
| Segment profit | $ | 1,099 | $ | 1,165 | (6) | % | $ | 1,608 | (28) | % |
20 Honeywell International, Inc.
| Factors Contributing to Year-Over-Year Change | 2020 vs. 2019 | 2019 vs. 2018 | |||||||||||||||||||||
| Net Sales | Segment Profit | Net Sales | Segment Profit | ||||||||||||||||||||
| Organic | (9) | % | (5) | % | 5 | % | 8 | % | |||||||||||||||
| Foreign currency translation | — | % | (1) | % | (2) | % | (2) | % | |||||||||||||||
| Acquisitions, divestitures and other, net | — | % | — | % | (42) | % | (34) | % | |||||||||||||||
| Total % Change | (9) | % | (6) | % | (39) | % | (28) | % |
2020 compared with 2019
Honeywell Building Technologies Net sales decreased due to lower organic sales. Our customers own or manage buildings in a variety of industries including commercial real estate, hospitality, airports and other government buildings, healthcare and education. The global recession resulting from the COVID-19 pandemic impacted many of these industries, resulting in a reduction of discretionary spending and demand for our products and services.
-
Sales in Products decreased 10% (decreased 10% organic) primarily due to lower sales volumes.
-
Sales in Building Solutions decreased 9% (decreased 8% organic) primarily due to lower sales volumes and the unfavorable impact of foreign currency translation.
Honeywell Building Technologies segment profit decreased primarily due to lower sales volumes and the unfavorable impact of foreign currency translation, partially offset by favorable pricing. Cost of products and services sold decreased due to lower sales volumes.
PERFORMANCE MATERIALS AND TECHNOLOGIES

21 Honeywell International, Inc.
| 2020 | 2019 | Change 2020 vs. 2019 | 2018 | Change 2019 vs. 2018 | |||||||||||||||||||||||||
| Net sales | $ | 9,423 | $ | 10,834 | (13) | % | $ | 10,674 | 1 | % | |||||||||||||||||||
| Cost of products and services sold | 6,331 | 6,989 | 6,948 | ||||||||||||||||||||||||||
| Selling, general and administrative and other expenses | 1,241 | 1,412 | 1,398 | ||||||||||||||||||||||||||
| Segment profit | $ | 1,851 | $ | 2,433 | (24) | % | $ | 2,328 | 5 | % |
| Factors Contributing to Year-Over-Year Change | 2020 vs. 2019 | 2019 vs. 2018 | |||||||||||||||||||||
| Net Sales | Segment Profit | Net Sales | Segment Profit | ||||||||||||||||||||
| Organic | (13) | % | (24) | % | 4 | % | 6 | % | |||||||||||||||
| Foreign currency translation | — | % | — | % | (3) | % | (1) | % | |||||||||||||||
| Acquisitions, divestitures and other, net | — | — | — | % | — | % | |||||||||||||||||
| Total % Change | (13) | % | (24) | % | 1 | % | 5 | % |
2020 compared with 2019
Performance Materials and Technologies Net sales decreased primarily due to lower sales volumes. Many of our customers operate in the oil and gas industry. The decline in global travel, coupled with excessive oil and gas supply, negatively impacted many of our customers, resulting in lower demand for our products and services.
-
UOP sales decreased 25% (decreased 25% organic) driven primarily by decreases in catalyst volumes, licensing, and engineering sales volumes.
-
Process Solutions sales decreased 11% (decreased 10% organic) primarily due to lower sales volumes in products businesses, automation projects and migration services.
-
Advanced Materials sales decreased 5% (decreased 6% organic) driven primarily by decreased sales volumes in fluorine products due to lower demand in automotive refrigerants, partially offset by increased sales volumes in specialty products.
Performance Materials and Technologies segment profit decreased primarily due to operating leverage on lower sales volumes and lower sales of higher margin products and services, partially offset by other productivity actions. Cost of products and services sold decreased primarily due to lower sales volumes.
22 Honeywell International, Inc.
SAFETY AND PRODUCTIVITY SOLUTIONS

| 2020 | 2019 | Change 2020 vs. 2019 | 2018 | Change 2019 vs. 2018 | |||||||||||||||||||||||||
| Net sales | $ | 6,481 | $ | 6,104 | 6 | % | $ | 6,337 | (4) | % | |||||||||||||||||||
| Cost of products and services sold | 4,532 | 4,158 | 4,205 | ||||||||||||||||||||||||||
| Selling, general and administrative and other expenses | 1,042 | 1,156 | 1,100 | ||||||||||||||||||||||||||
| Segment profit | $ | 907 | $ | 790 | 15 | % | $ | 1,032 | (23) | % |
| Factors Contributing to Year-Over-Year Change | 2020 vs. 2019 | 2019 vs. 2018 | |||||||||||||||||||||
| Net Sales | Segment Profit | Net Sales | Segment Profit | ||||||||||||||||||||
| Organic | 6 | % | 16 | % | (4) | % | (23) | % | |||||||||||||||
| Foreign currency translation | — | % | (1) | % | (2) | % | (2) | % | |||||||||||||||
| Acquisitions, divestitures and other, net | — | % | — | % | 2 | % | 2 | % | |||||||||||||||
| Total % Change | 6 | % | 15 | % | (4) | % | (23) | % |
23 Honeywell International, Inc.
2020 compared with 2019
Safety and Productivity Solutions Net sales increased primarily due to higher organic sales. The global pandemic has created significant increased demand for our respiratory PPE and additional demand for online shopping services, bolstering demand for our warehouse automation services.
-
Sales in Safety and Retail increased 9% (increased 9% organic) primarily due to a significant increase in order volume for respiratory PPE due to the global pandemic, partially offset by lower demand for gas sensing and detection equipment.
-
Sales in Productivity Solutions and Services decreased 1% (flat organic) due to the unfavorable impact of foreign currency translation.
-
Sales in Warehouse and Workflow Solutions increased 14% (increased 14% organic) primarily due to strong demand for our warehouse automation services.
-
Sales in Sensing & IoT decreased 6% (decreased 6% organic) due to lower organic sales volumes.
Safety and Productivity Solutions segment profit increased as a result of higher productivity, higher sales volumes, and favorable pricing, partially offset by higher sales of lower margin products and the unfavorable impact of foreign currency translation. Cost of products and services sold increased primarily due to higher organic sales volumes, partially offset by higher productivity.
REPOSITIONING CHARGES
See Note 4 Repositioning and Other Charges of Notes to Consolidated Financial Statements for a discussion of our repositioning actions and related charges incurred in 2020, 2019 and 2018. Cash spending related to our repositioning actions was $564 million, $249 million and $285 million in 2020, 2019 and 2018, and was funded through operating cash flows.
Previous: Item 6. Selected Financial Data · Next: Item 1A. Risk Factors