 filings.tools
Honeywell International 10-Q 2023-09-30
Filed 2023-10-26. 8 sections, 220K characters. Original on sec.gov · Markdown · JSON
Cover and table of contents
UNITED STATES
SECURITIES AND EXCHANGE COMMISSION
Washington, D.C. 20549
Form 10-Q
☒ QUARTERLY REPORT PURSUANT TO SECTION 13 OR 15(d)
OF THE SECURITIES EXCHANGE ACT OF 1934
For the quarterly period ended September 30, 2023
OR
☐ TRANSITION REPORT PURSUANT TO SECTION 13 OR 15(d)
OF THE SECURITIES EXCHANGE ACT OF 1934
For the transition period from ______ to _____
Commission file number 1-8974

Honeywell International Inc.
(Exact name of registrant as specified in its charter)
| Delaware | 22-2640650 | ||||||||||
| (State or other jurisdiction of incorporation or organization) | (I.R.S. Employer Identification No.) | ||||||||||
| 855 South Mint Street | 28202 | ||||||||||
| Charlotte, | North Carolina | ||||||||||
| (Address of principal executive offices) | (Zip Code) |
| (704) | 627-6200 | ||||||||||
| (Registrant’s telephone number, including area code) |
Securities registered pursuant to Section 12(b) of the Act:
| Title of each class | Trading Symbol(s) | Name of each exchange on which registered | ||||||||||||
| Common Stock, par value $1 per share | HON | The Nasdaq Stock Market LLC | ||||||||||||
| 0.000% Senior Notes due 2024 | HON 24A | The Nasdaq Stock Market LLC | ||||||||||||
| 3.500% Senior Notes due 2027 | HON 27 | The Nasdaq Stock Market LLC | ||||||||||||
| 2.250% Senior Notes due 2028 | HON 28A | The Nasdaq Stock Market LLC | ||||||||||||
| 0.750% Senior Notes due 2032 | HON 32 | The Nasdaq Stock Market LLC | ||||||||||||
| 3.750% Senior Notes due 2032 | HON 32A | The Nasdaq Stock Market LLC | ||||||||||||
| 4.125% Senior Notes due 2034 | HON 34 | The Nasdaq Stock Market LLC |
Indicate by check mark whether the Registrant (1) has filed all reports required to be filed by Section 13 or 15(d) of the Securities Exchange Act of 1934 during the preceding 12 months (or for such shorter period that the Registrant was required to file such reports), and (2) has been subject to such filing requirements for the past 90 days. Yes x No ☐
Indicate by check mark whether the Registrant has submitted electronically every Interactive Data File required to be submitted pursuant to Rule 405 of Regulation S-T (§232.405 of this chapter) during the preceding 12 months (or for such shorter period that the Registrant was required to submit such files). Yes x No ☐
Indicate by check mark whether the Registrant is a large accelerated filer, an accelerated filer, a non-accelerated filer, a smaller reporting company, or an emerging growth company. See definitions of “large accelerated filer,” “accelerated filer,” “smaller reporting company,” and “emerging growth company” in Rule 12b-2 of the Exchange Act.
| Large accelerated filer | x | Accelerated filer | ☐ | ||||||||
| Non-accelerated filer | ☐ | Smaller reporting company | ☐ | ||||||||
| Emerging growth company | ☐ |
If an emerging growth company, indicate by check mark if the Registrant has elected not to use the extended transition period for complying with any new or revised financial accounting standards provided pursuant to Section 13(a) of the Exchange Act. ☐
Indicate by check mark whether the Registrant is a shell company (as defined in Rule 12b-2 of the Exchange Act). Yes ☐ No x
There were 659,250,644 shares of Common Stock outstanding at September 30, 2023.
TABLE OF CONTENTS
| Cautionary Statement about Forward-Looking Statements | 1 | |||||||||||||
| About Honeywell | 2 | |||||||||||||
| PART I | Financial Information | |||||||||||||
| ITEM 1 | Financial Statements and Supplementary Data (unaudited): | 3 | ||||||||||||
| Consolidated Statement of Operations (unaudited) – Three and Nine Months Ended September 30, 2023, and 2022 | 3 | |||||||||||||
| Consolidated Statement of Comprehensive Income (unaudited) – Three and Nine Months Ended September 30, 2023, and 2022 | 4 | |||||||||||||
| Consolidated Balance Sheet (unaudited) – September 30, 2023, and December 31, 2022 | 5 | |||||||||||||
| Consolidated Statement of Cash Flows (unaudited) – Nine Months Ended September 30, 2023, and 2022 | 6 | |||||||||||||
| Consolidated Statement of Shareowners' Equity (unaudited) – Three and Nine Months Ended September 30, 2023, and 2022 | 7 | |||||||||||||
| Note 1 – Basis of Presentation | 8 | |||||||||||||
| Note 2 – Summary of Significant Accounting Policies | 8 | |||||||||||||
| Note 3 – Acquisitions and Divestitures | 9 | |||||||||||||
| Note 4 – Revenue Recognition and Contracts with Customers | 10 | |||||||||||||
| Note 5 – Repositioning and Other Charges | 13 | |||||||||||||
| Note 6 – Income Taxes | 15 | |||||||||||||
| Note 7 – Inventories | 16 | |||||||||||||
| [Note 8 – Long-term Debt and Cred |
Showing the first 8K of 163K characters. Open the full section
Item 2. MANAGEMENT'S DISCUSSION AND ANALYSIS OF FINANCIAL CONDITION AND RESULTS OF OPERATIONS
(Dollars in tables and graphs in millions, except per share amounts)
The following Management's Discussion and Analysis of Financial Condition and Results of Operations is intended to help the reader understand the results of operations and financial condition of Honeywell International Inc. and its consolidated subsidiaries (Honeywell, we, us, our, or the Company) for the three and nine months ended September 30, 2023. The financial information as of September 30, 2023, should be read in conjunction with the Consolidated Financial Statements for the year ended December 31, 2022, contained in our 2022 Annual Report on Form 10-K. See Note 3 Acquisitions and Divestitures of Notes to Consolidated Financial Statements for a discussion of acquisition and divestiture activity during the nine months ended September 30, 2023. Certain prior year amounts are reclassified to conform to the current year presentation.
BUSINESS UPDATE
Historically, we included Company-sponsored costs and costs that relate to contracts with customers for research and development projects as a component of Cost of products and services sold on the Consolidated Statement of Operations. Effective January 1, 2023, we began classifying Company-sponsored costs for research and development projects as a separate financial statement line item, titled Research and development expenses, on the Consolidated Statement of Operations, and recast prior period results for this reclassification. This reclassification had no impact on net income, earnings per share, cash flows, segment reporting, or financial position. We revised historical periods to reflect this change in presentation.
In October 2023, the Company announced a realignment, expected to be effective in the first quarter of 2024, of its business units comprising its Performance Materials and Technologies and Safety and Productivity Solutions reportable business segments by forming two new reportable business segments: Industrial Automation and Energy and Sustainability Solutions. Industrial Automation will include Sensing and Safety Technologies, Productivity Solutions and Services, and Warehouse and Workflow Solutions, which are currently included in Safety and Productivity Solutions, in addition to Process Solutions, which is currently included in Performance Materials and Technologies. Energy and Sustainability Solutions will include UOP and Advanced Materials, which are currently included in Performance Materials and Technologies. Further, as part of the realignment, the Company will rename its Aerospace and Honeywell Building Technologies reportable business segments to Aerospace Technologies and Building Automation, respectively. Following the realignment, the Company’s reportable business segments will be Aerospace Technologies, Industrial Automation, Building Automation, and Energy and Sustainability Solutions. The realignment will not impact the Company’s historical consolidated financial position, results of operations, or cash flows. The Company expects to report its financial performance based on this realignment effective with the first quarter of 2024.
MACROECONOMIC CONDITIONS
We continue to monitor the impacts of ongoing macroeconomic conditions and geopolitical events. In the third quarter of 2023, material inflation continued to moderate. While we see signs of relief in supply chains for semiconductors and logistics, we continue to experience supply chain constraints, including labor shortages in the Aerospace supply base, and inflationary cost pressures in manufacturing labor. We continue to leverage previously implemented short-term and long-term mitigation strategies.
Our mitigation strategies include pricing actions, longer term planning for constrained materials, material supply tracking tools, and direct engagement with key suppliers to meet customer demand. Our relationships with primary and secondary suppliers allow us to reliably source key components and raw materials. Where we cannot procure key components or raw materials, we consider altering existing products and develop new products to satisfy customer needs. Alterations to existing products and the development of new products undergo product quality controls and engineering qualification, prior to releasing to our customers. In addition, we assist our suppliers facing manufacturing challenges by committing our own resources to their sites and facilities. We believe these mitigation strategies enable us to reduce supply risk, accelerate new product innovation, and expand our penetration in the markets we serve. Additionally, due to the strenuous quality controls and product qualification we perform on a new or altered product, we do not expect these mitigation strategies to impact product quality or reliability.
The Russia-Ukraine conflict continues to create volatility in global financial and energy markets and contribute to supply chain shortages adding to the inflationary pressures in the global economy. We actively collaborate with our suppliers to minimize impacts of supply shortages on our manufacturing capabilities and implement strategies to reduce our reliance on natural gas at critical sites in Europe.
32 Honeywell International Inc.
To date, our strategies successfully mitigated our exposure to these conditions. However, if we are not successful in sustaining these strategies, these macroeconomic conditions could have a material adverse effect on our consolidated results of operations, or operating cash flows.
33 Honeywell International Inc.
RESULTS OF OPERATIONS
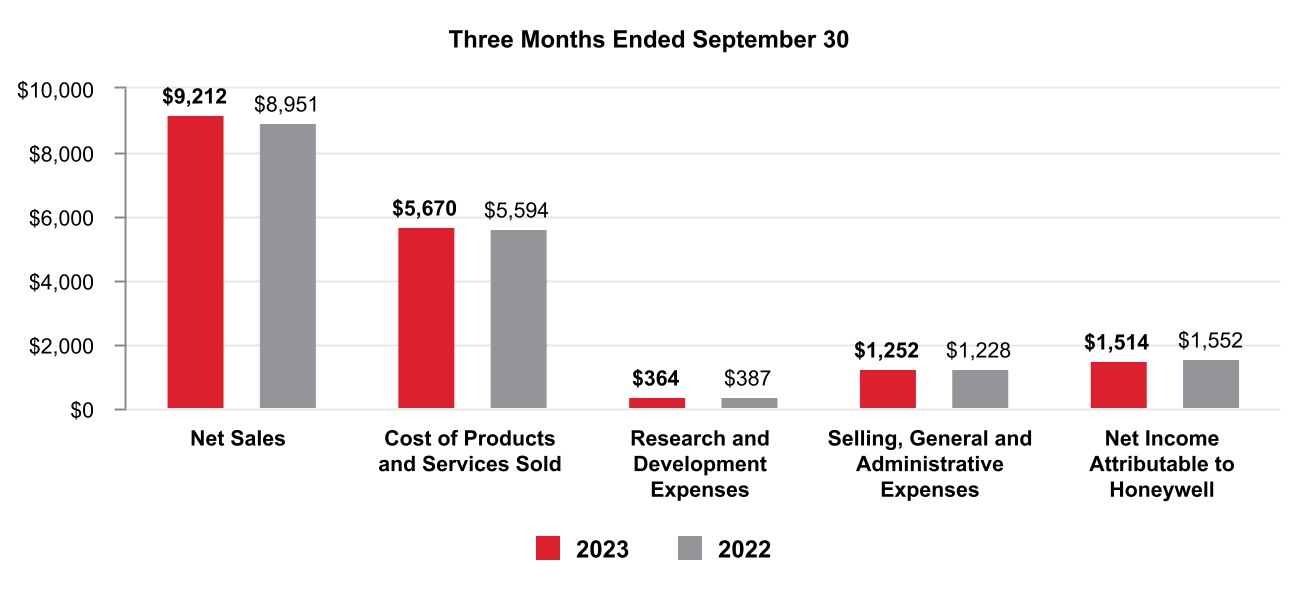
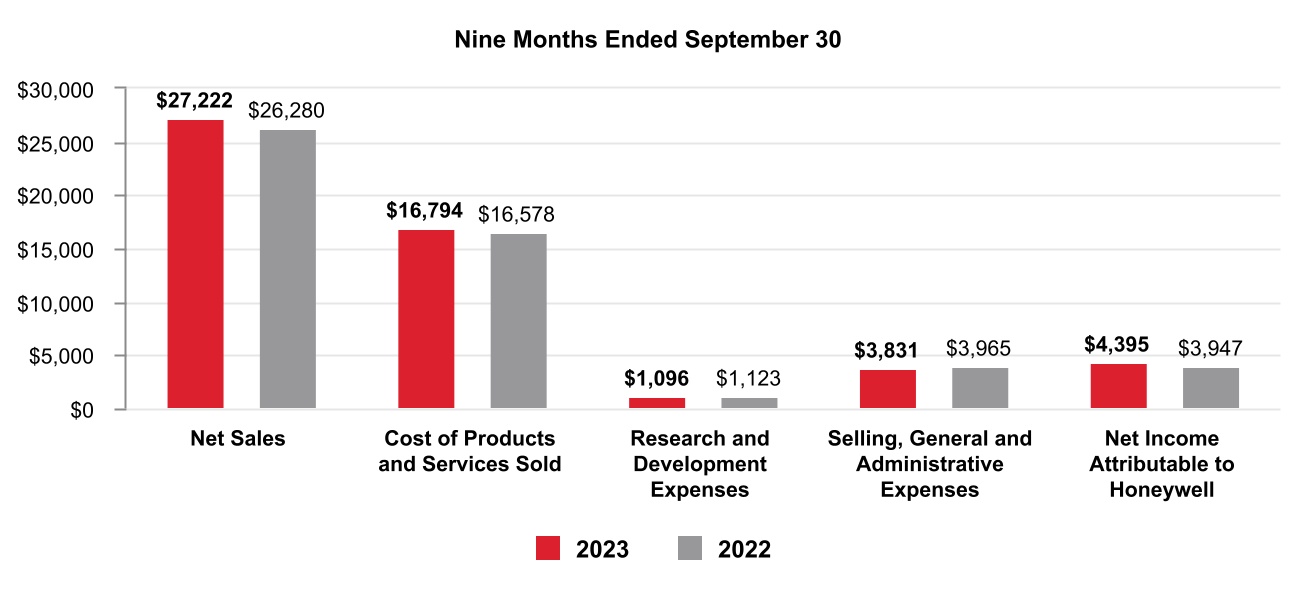
Consolidated Financial Results
34 Honeywell International Inc.
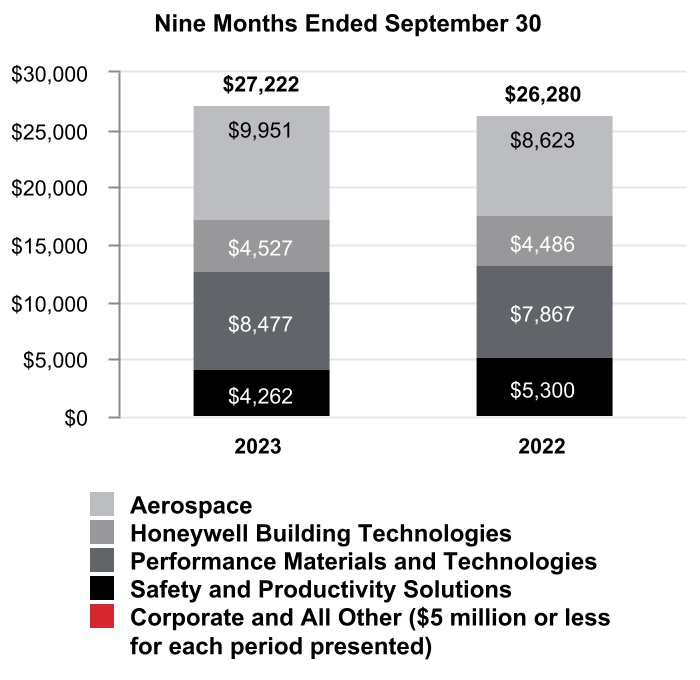
Net Sales by Segment

35 Honeywell International Inc.
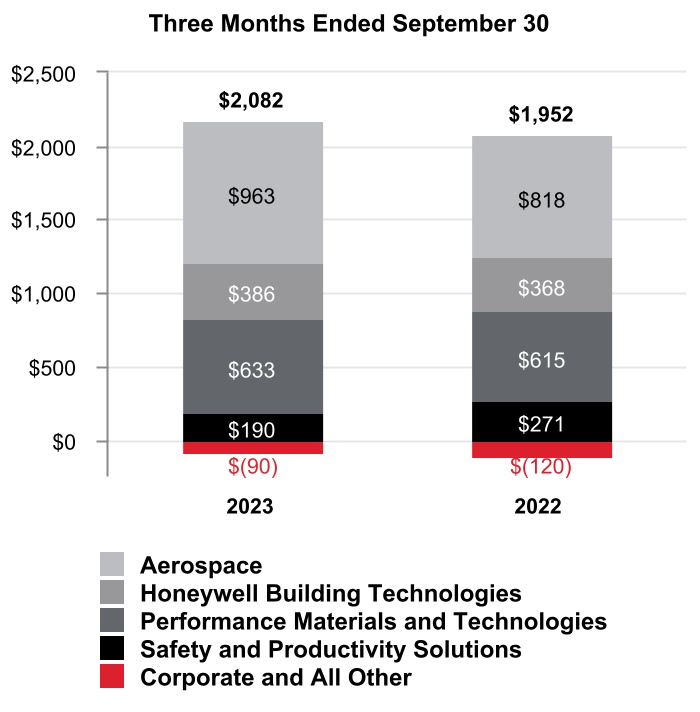
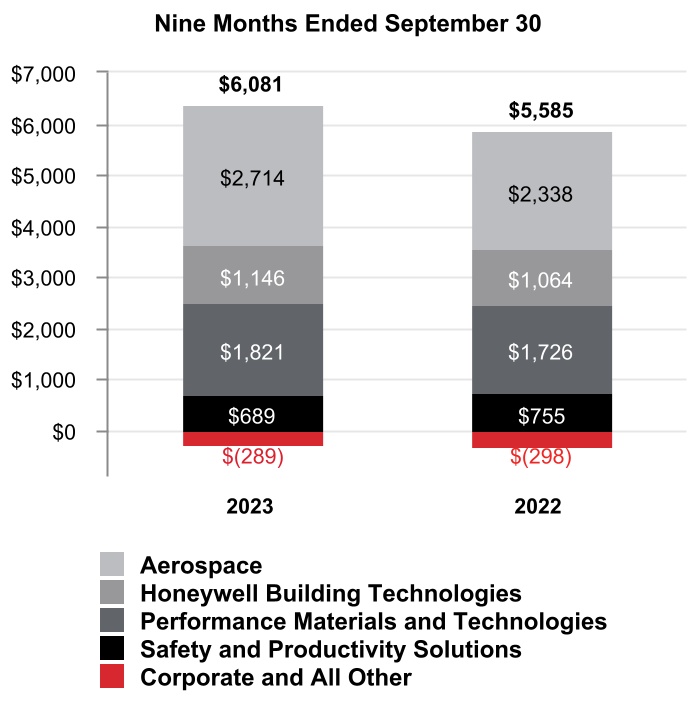
Segment Profit by Segment
36 Honeywell International Inc.
CONSOLIDATED OPERATING RESULTS
Net Sales
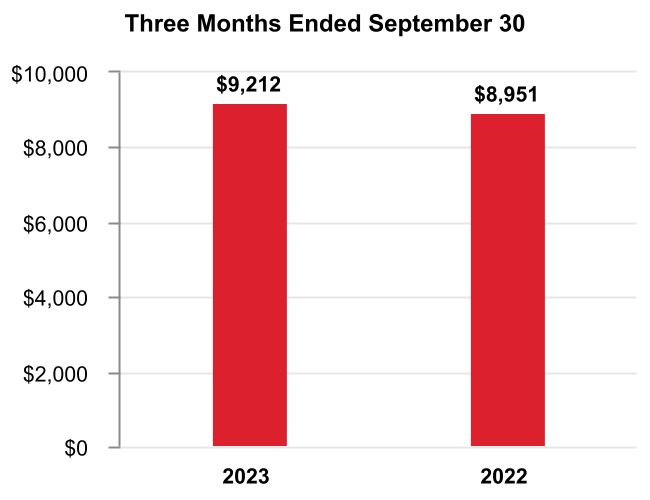
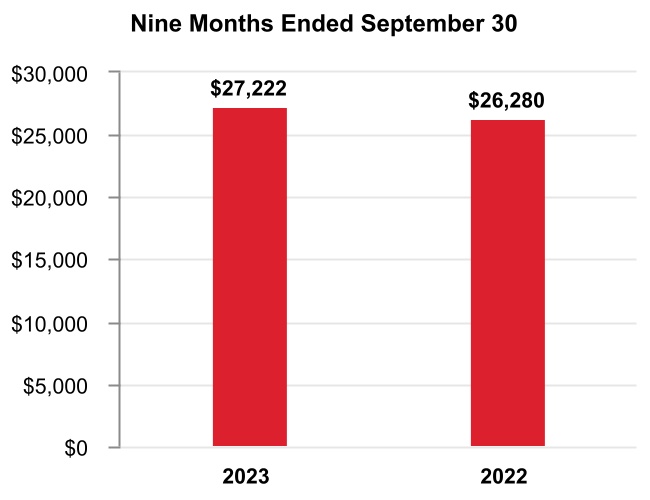
The change in Net sales was attributable to the following:
| Q3 2023 vs. Q3 2022 | Year to Date 2023 vs. 2022 | |||||||||||||||||||||||||
| Volume | (1)% | 1% | ||||||||||||||||||||||||
| Price | 3% | 4% | ||||||||||||||||||||||||
| Foreign currency translation | —% | (1)% | ||||||||||||||||||||||||
| Acquisitions, divestitures, and other, net | 1% | —% | ||||||||||||||||||||||||
| Total % change in Net sales | 3% | 4% |
A discussion of Net sales by reportable business segment can be found in the Review of Business Segments section of this Management's Discussion and Analysis.
Q3 2023 compared with Q3 2022
Net sales increased due to the following:
-
Increased pricing, and
-
The acquisition of Compressor Controls Corporation during the second quarter 2023,
-
Partially offset by lower sales volumes.
YTD 2023 compared with YTD 2022
Net sales increased due to the following:
-
Increased pricing, and
-
Higher sales volumes,
-
Partially offset by the unfavorable impact of foreign currency translation, driven by the strengthening of the U.S. Dollar against the currencies in certain of our international markets, primarily the Chinese Renminbi, Canadian Dollar, Turkish Lira, Egyptian Pound, and Australian Dollar.
37 Honeywell International Inc.
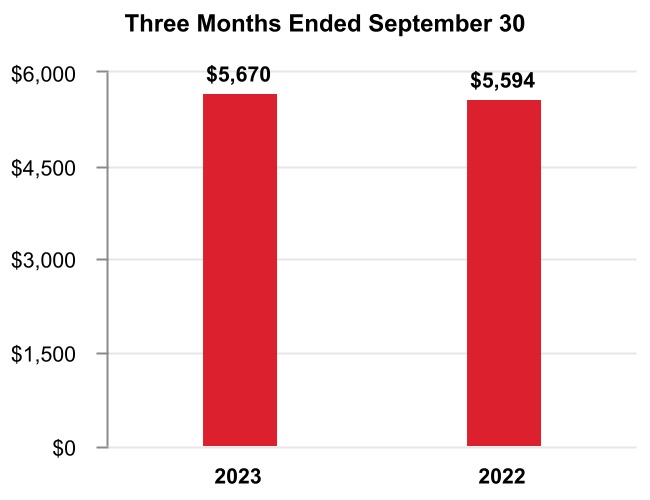
Cost of Products and Services Sold
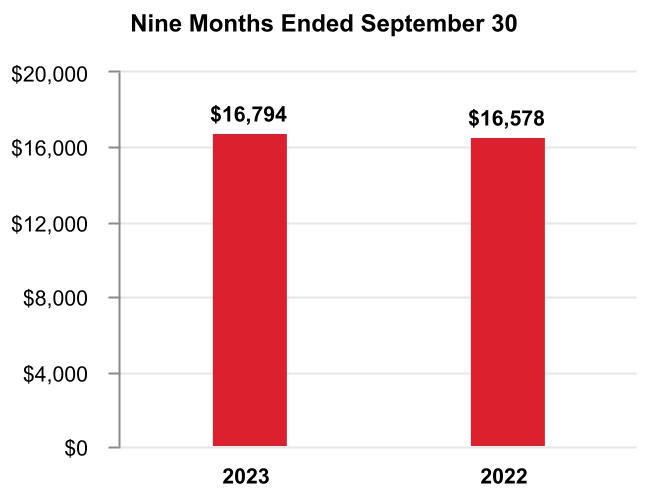
Q3 2023 compared with Q3 2022
Cost of products and services sold increased due to the following:
-
Higher direct and indirect material costs and higher labor costs of approximately $0.2 billion or 4%,
-
Partially offset by higher productivity of approximately $0.1 billion or 2%.
YTD 2023 compared with YTD 2022
Cost of products and services sold increased due to the following:
-
Higher direct and indirect material costs and higher labor costs of approximately $0.6 billion or 4%,
-
Partially offset by lower sales volumes of higher margin products of approximately $0.3 billion or 2%, and lower repositioning and other charges of approximately $0.2 billion or 1%, which included prior year charges attributable to suspending and winding down our businesses and operations in Russia.
Gross Margin


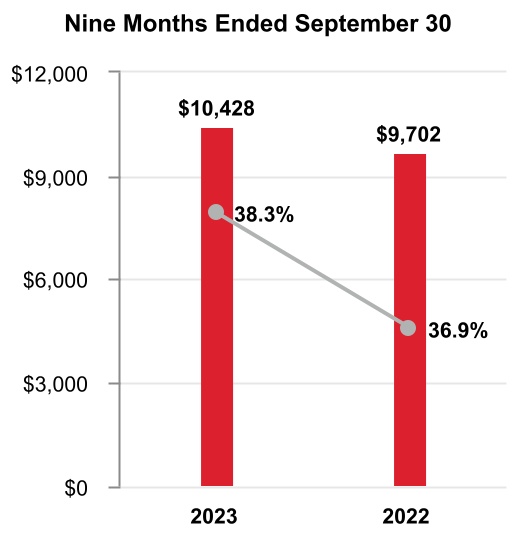
Q3 2023 compared with Q3 2022
Gross margin increased by approximately $0.2 billion and gross margin percentage increased 90 basis points to 38.4% compared to 37.5% for the same period of 2022.
YTD 2023 compared with YTD 2022
Gross margin increased by approximately $0.7 billion and gross margin percentage increased 140 basis points to 38.3% compared to 36.9% for the same period of 2022.
38 Honeywell International Inc.
Research and Development Expenses
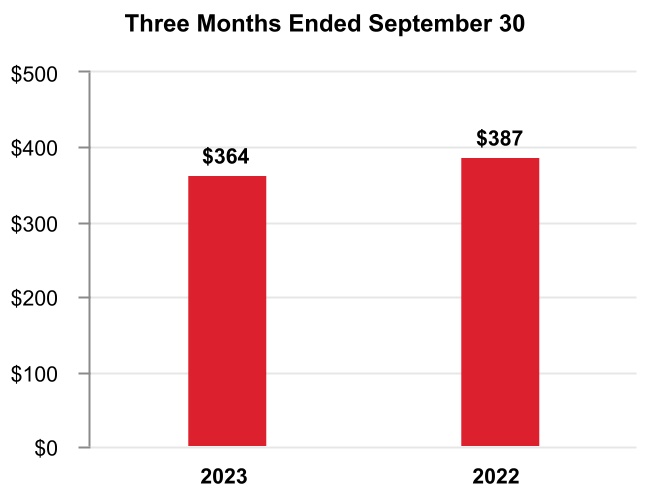

Q3 2023 compared with Q3 2022
Research and development expenses slightly decreased.
YTD 2023 compared with YTD 2022
Research and development expenses were flat.
Selling, General and Administrative Expenses

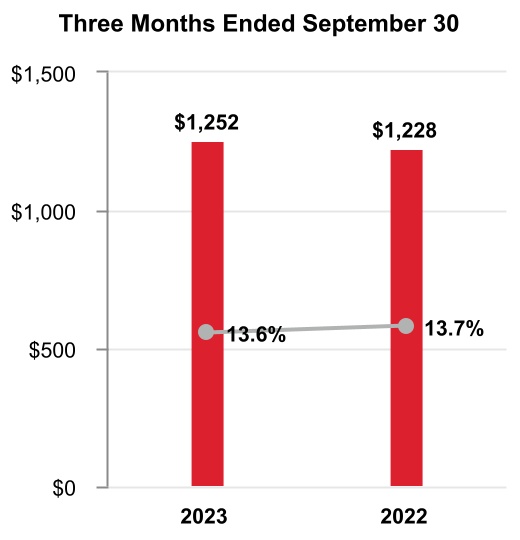
Q3 2023 compared with Q3 2022
Selling, general and administrative expenses increased due to the following:
-
Higher labor costs of approximately $0.1 billion or 8%,
-
Partially offset by higher productivity of approximately $0.1 billion or 8%.
YTD 2023 compared to YTD 2022
Selling, general and administrative expenses decreased due to the following:
-
Lower repositioning and other charges of approximately $0.1 billion or 3%, which included prior year charges attributable to suspending and winding down our businesses and operations in Russia, and
-
Higher productivity of approximately $0.1 billion or 3%,
-
Partially offset by higher labor costs of approximately $0.1 billion or 3%.
39 Honeywell International Inc.
Other (Income) Expense
| Three Months Ended September 30, | Nine Months Ended September 30, | ||||||||||||||||||||||
| 2023 | 2022 | 2023 | 2022 | ||||||||||||||||||||
| Other (income) expense | $ | (247) | $ | (337) | $ | (715) | $ | (846) |
Q3 2023 compared with Q3 2022
Other income decreased due to the following:
- Lower pension and other postretirement income.
YTD 2023 compared with YTD 2022
Other income decreased due to the following:
-
Lower pension and other postretirement income of approximately $0.4 billion,
-
Partially offset by higher interest income of approximately $0.2 billion and prior year charges attributable to suspending and winding down our businesses and operations in Russia and UOP Matters of approximately $0.1 billion.
Tax Expense
Q3 2023 compared with Q3 2022
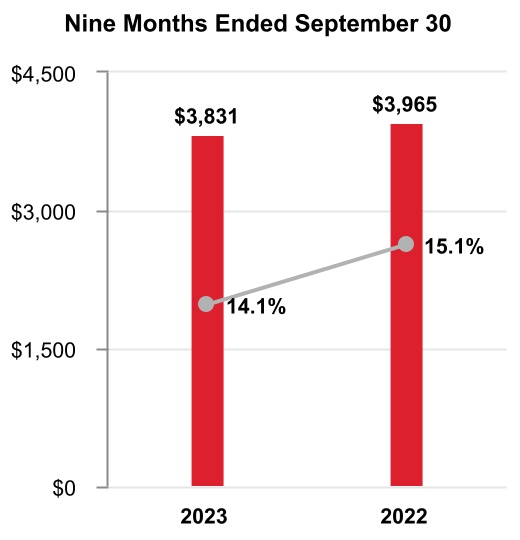
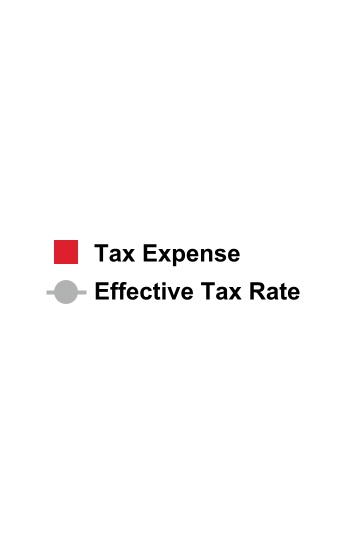
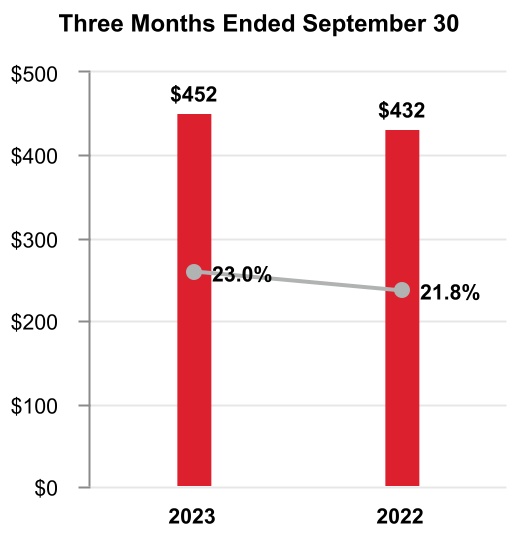
The effective tax rate increased due to lower benefits resulting from the resolution of foreign tax matters, increased valuation allowance expense, and other accrued tax expense, partially offset by benefits of taxes on non-U.S. earnings representing an aggregate 120 basis point increase.
YTD 2023 compared with YTD 2022
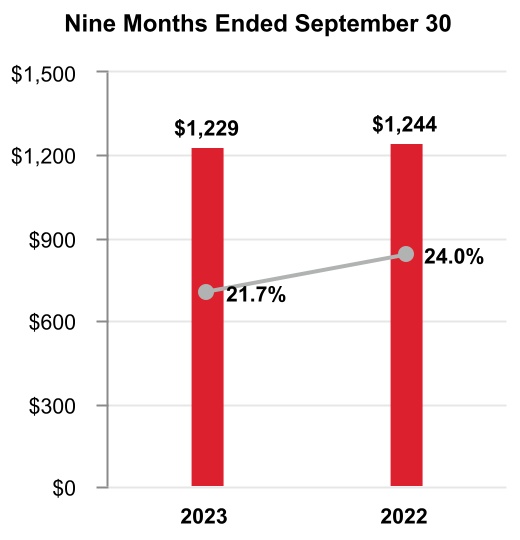
The effective tax rate decreased due to benefits of taxes on non-U.S. earnings and lower repositioning related expenses, partially offset by other accrued taxes representing an aggregate 230 basis point decrease.
40 Honeywell International Inc.
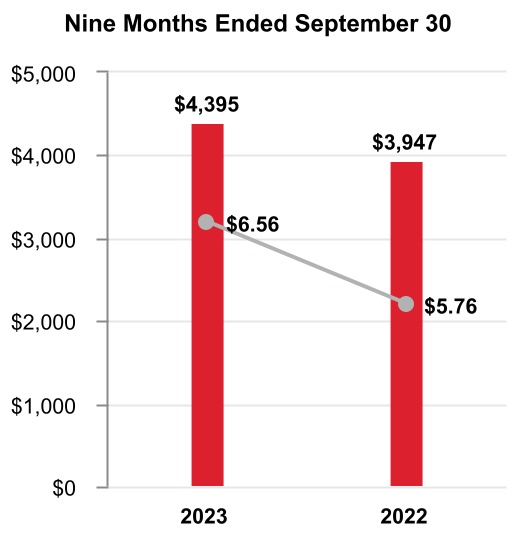
Net Income Attributable to Honeywell
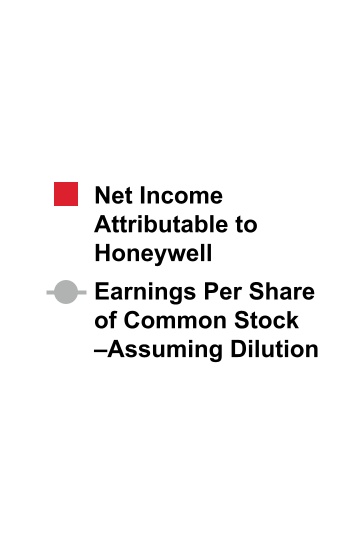
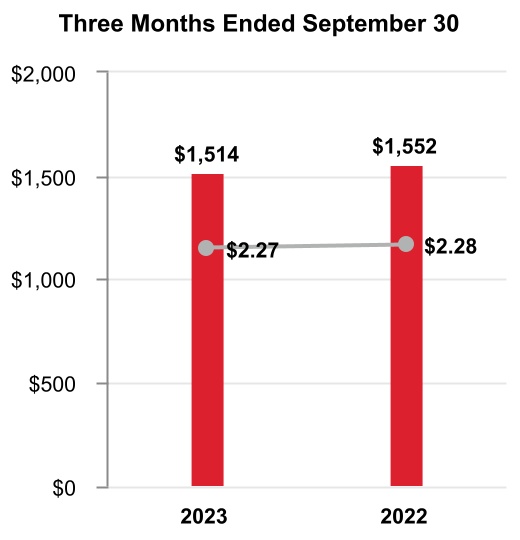
Q3 2023 compared to Q3 2022
Earnings per share of common stock–assuming dilution decreased due to the following:
-
Lower pension and other postretirement income which impacted earnings per share by $0.14 after tax, and
-
Higher interest expense which impacted earnings per share by $0.13 after tax,
-
Partially offset by higher segment profit which impacted earnings per share by $0.15 after tax, higher interest income which impacted earnings per share by $0.06 after tax, and the favorable impact of lower share count which impacted earnings per share by $0.04 after tax.
YTD 2023 compared to YTD 2022
Earnings per share of common stock–assuming dilution increased due to the following:
-
Higher segment profit which impacted earnings per share by $0.55 after tax,
-
Lower repositioning and other charges, including charges attributable to suspending and winding down our businesses and operations in Russia, which impacted earnings per share by $0.53 after tax,
-
Higher interest income which impacted earnings per share by $0.18 after tax,
-
The favorable impact of lower share count which impacted earnings per share by $0.14 after tax, and
-
Partially offset by lower pension and other postretirement income which impacted earnings per share by $0.41 after tax, and higher interest expense which impacted earnings per share by $0.32 after tax.
41 Honeywell International Inc.
REVIEW OF BUSINESS SEGMENTS
We globally manage our business operations through four reportable business segments: Aerospace, Honeywell Building Technologies, Performance Materials and Technologies, and Safety and Productivity Solutions.
AEROSPACE
Net Sales

| Three Months Ended September 30, | Nine Months Ended September 30, | ||||||||||||||||||||||||||||||||||
| 2023 | 2022 | % Change | 2023 | 2022 | % Change | ||||||||||||||||||||||||||||||
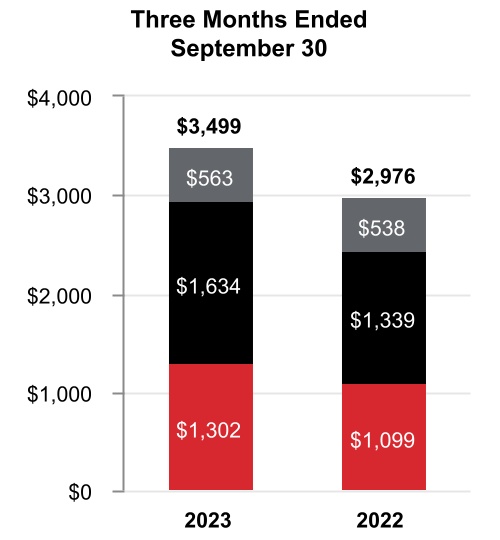
| Net sales | $ | 3,499 | $ | 2,976 | 18 | % | $ | 9,951 | $ | 8,623 | 15 | % | |||||||||||||||||||||||
| Cost of products and services sold | 2,145 | 1,818 | 6,122 | 5,230 | |||||||||||||||||||||||||||||||
| Selling, general and administrative and other expenses | 391 | 340 | 1,115 | 1,055 | |||||||||||||||||||||||||||||||
| Segment profit | $ | 963 | $ | 818 | 18 | % | $ | 2,714 | $ | 2,338 | 16 | % |
| 2023 vs. 2022 | |||||||||||||||||||||||
| Three Months Ended September 30, | Nine Months Ended September 30, | ||||||||||||||||||||||
| Factors Contributing to Year-Over-Year Change | Net Sales | Segment Profit | Net Sales | Segment Profit | |||||||||||||||||||
| Organic1 | 18 | % | 18 | % | 16 | % | 17 | % | |||||||||||||||
| Foreign currency translation | — | % | — | % | (1) | % | (1) | % | |||||||||||||||
| Acquisitions, divestitures, and other, net | — | % | — | % | — | % | — | % | |||||||||||||||
| Total % change | 18 | % | 18 | % | 15 | % | 16 | % |
| 1 | Organic sales % change, presented for all of our reportable business segments, is defined as the change in Net sales, excluding the impact on sales from foreign currency translation and acquisitions, net of divestitures, for the first 12 months following the transaction date. We believe this non-GAAP measure is useful to investors and management in understanding the ongoing operations and analysis of ongoing operating trends. |
Q3 2023 compared to Q3 2022
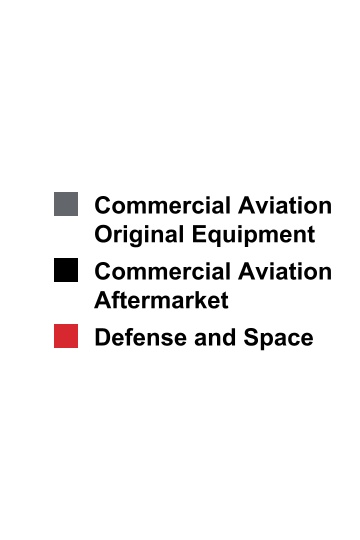
Sales increased $523 million due to higher organic sales of $298 million in Commercial Aviation Aftermarket driven by higher sales volumes in air transport due to an increase in flight hours and higher organic sales of $202 million in Defense and Space driven by higher sales volumes due to increased shipments.
Segment profit increased $145 million and segment margin percentage was flat at 27.5% compared to the same period of 2022.
42 Honeywell International Inc.
YTD 2023 compared to YTD 2022
Sales increased $1,328 million due to higher organic sales of $890 million in Commercial Aviation Aftermarket driven by higher sales volumes in air transport due to an increase in flight hours and higher organic sales of $292 million in Defense and Space driven by higher sales volumes due to increased shipments.
Segment profit increased $376 million and segment margin percentage increased 20 basis points to 27.3% compared to 27.1% for the same period of 2022.
HONEYWELL BUILDING TECHNOLOGIES
Net Sales
| Three Months Ended September 30, | Nine Months Ended September 30, | ||||||||||||||||||||||||||||||||||
| 2023 | 2022 | % Change | 2023 | 2022 | % Change | ||||||||||||||||||||||||||||||
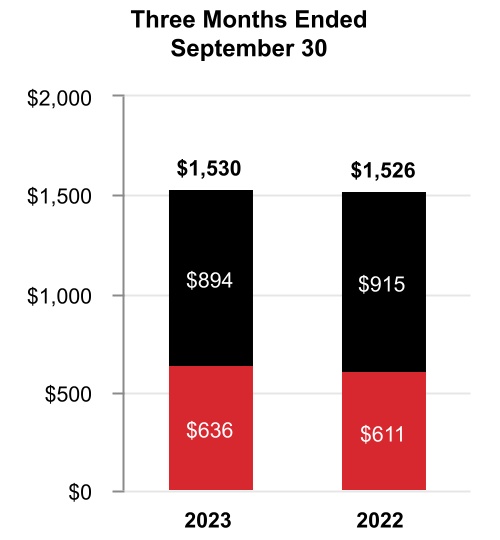
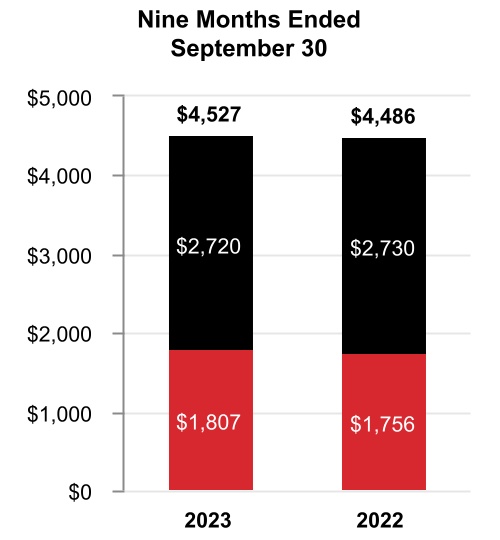
| Net sales | $ | 1,530 | $ | 1,526 | — | % | $ | 4,527 | $ | 4,486 | 1 | % | |||||||||||||||||||||||
| Cost of products and services sold | 829 | 835 | 2,430 | 2,447 | |||||||||||||||||||||||||||||||
| Selling, general and administrative and other expenses | 315 | 323 | 951 | 975 | |||||||||||||||||||||||||||||||
| Segment profit | $ | 386 | $ | 368 | 5 | % | $ | 1,146 | $ | 1,064 | 8 | % |
| 2023 vs. 2022 | |||||||||||||||||||||||
| Three Months Ended September 30, | Nine Months Ended September 30, | ||||||||||||||||||||||
| Factors Contributing to Year-Over-Year Change | Net Sales | Segment Profit | Net Sales | Segment Profit | |||||||||||||||||||
| Organic | — | % | 3 | % | 3 | % | 9 | % | |||||||||||||||
| Foreign currency translation | — | % | 2 | % | (2) | % | (1) | % | |||||||||||||||
| Acquisitions, divestitures, and other, net | — | % | — | % | — | % | — | % | |||||||||||||||
| Total % change | — | % | 5 | % | 1 | % | 8 | % |
Q3 2023 compared to Q3 2022
Sales were flat due to higher organic sales of $27 million in Building Solutions driven by increased pricing in building projects and services, offset by lower organic sales of $27 million in Products driven by lower sales volumes.
Segment profit increased $18 million and segment margin percentage increased 110 basis points to 25.2% compared to 24.1% for the same period of 2022.
43 Honeywell International Inc.
YTD 2023 compared to YTD 2022
Sales increased $41 million due to higher organic sales of $111 million in Building Solutions driven by increased pricing in building projects and services and higher organic sales of $25 million in Products driven by increased pricing, partially offset by the unfavorable impact of foreign currency translation of $97 million.
Segment profit increased $82 million and segment margin percentage increased 160 basis points to 25.3% compared to 23.7% for the same period of 2022.
PERFORMANCE MATERIALS AND TECHNOLOGIES
Net Sales
| Three Months Ended September 30, | Nine Months Ended September 30, | ||||||||||||||||||||||||||||||||||
| 2023 | 2022 | % Change | 2023 | 2022 | % Change | ||||||||||||||||||||||||||||||
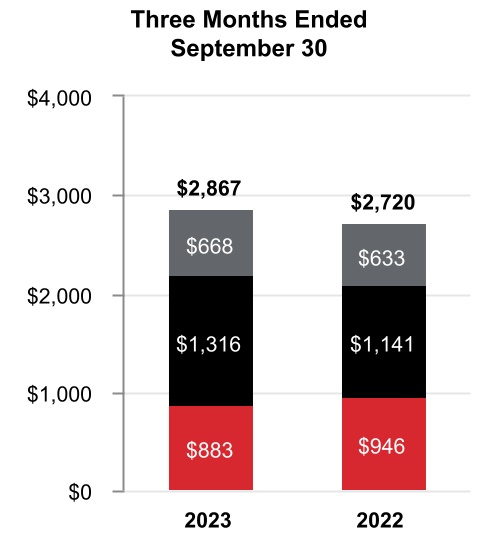
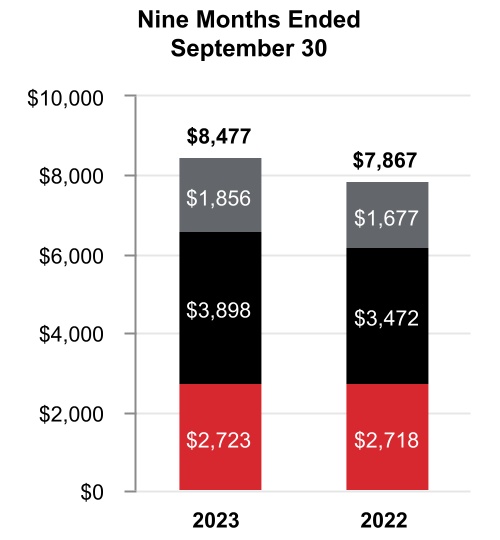
| Net sales | $ | 2,867 | $ | 2,720 | 5 | % | $ | 8,477 | $ | 7,867 | 8 | % | |||||||||||||||||||||||
| Cost of products and services sold | 1,787 | 1,694 | 5,314 | 4,860 | |||||||||||||||||||||||||||||||
| Selling, general and administrative and other expenses | 447 | 411 | 1,342 | 1,281 | |||||||||||||||||||||||||||||||
| Segment profit | $ | 633 | $ | 615 | 3 | % | $ | 1,821 | $ | 1,726 | 6 | % |
| 2023 vs. 2022 | |||||||||||||||||||||||
| Three Months Ended September 30, | Nine Months Ended September 30, | ||||||||||||||||||||||
| Factors Contributing to Year-Over-Year Change | Net Sales | Segment Profit | Net Sales | Segment Profit | |||||||||||||||||||
| Organic | 3 | % | 1 | % | 8 | % | 6 | % | |||||||||||||||
| Foreign currency translation | 1 | % | 1 | % | (1) | % | (1) | % | |||||||||||||||
| Acquisitions, divestitures, and other, net | 1 | % | 1 | % | 1 | % | 1 | % | |||||||||||||||
| Total % change | 5 | % | 3 | % | 8 | % | 6 | % |
Q3 2023 compared to Q3 2022
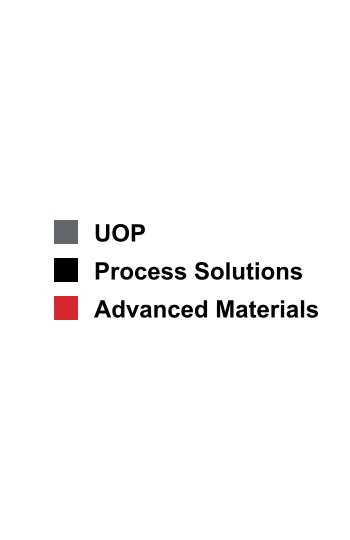
Sales increased $147 million due to higher organic sales of $127 million in Process Solutions driven by increased demand in projects and lifecycle solutions and services and higher organic sales of $37 million in UOP driven by increased pricing, partially offset by lower organic sales of $71 million in Advanced Materials driven by lower sales volumes.
Segment profit increased $18 million and segment margin percentage decreased 50 basis points to 22.1% compared to 22.6% for the same period of 2022.
44 Honeywell International Inc.
YTD 2023 compared to YTD 2022
Sales increased $610 million due to higher organic sales of $435 million in Process Solutions driven by increased demand in projects and lifecycle solutions and services and higher organic sales of $187 million in UOP driven by growth in gas processing and refining catalyst shipments, partially offset by the unfavorable impact of foreign currency translation of $68 million.
Segment profit increased $95 million and segment margin percentage decreased 40 basis points to 21.5% compared to 21.9% for the same period of 2022.
SAFETY AND PRODUCTIVITY SOLUTIONS
Net Sales
| Three Months Ended September 30, | Nine Months Ended September 30, | ||||||||||||||||||||||||||||||||||
| 2023 | 2022 | % Change | 2023 | 2022 | % Change | ||||||||||||||||||||||||||||||
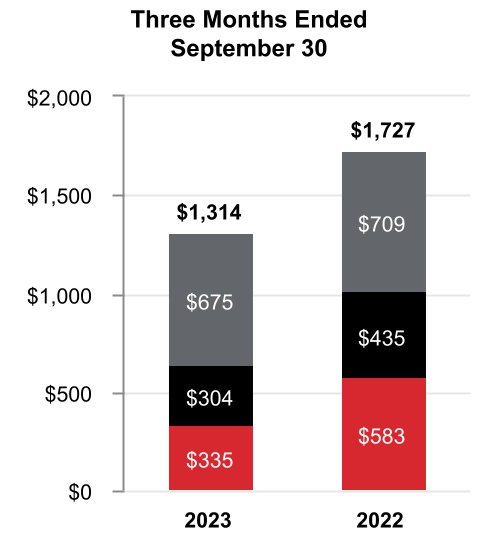
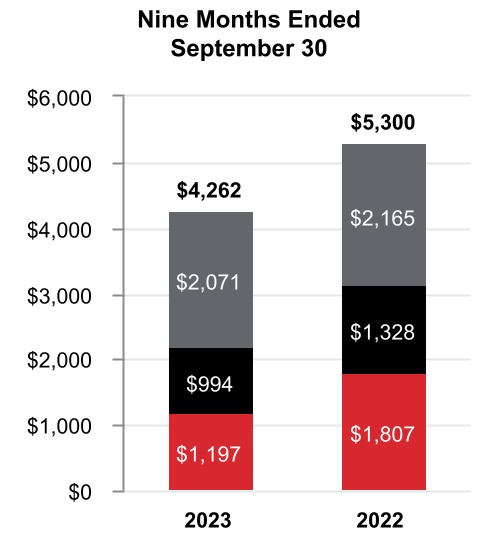
| Net sales | $ | 1,314 | $ | 1,727 | (24) | % | $ | 4,262 | $ | 5,300 | (20) | % | |||||||||||||||||||||||
| Cost of products and services sold | 827 | 1,134 | 2,661 | 3,519 | |||||||||||||||||||||||||||||||
| Selling, general and administrative and other expenses | 297 | 322 | 912 | 1,026 | |||||||||||||||||||||||||||||||
| Segment profit | $ | 190 | $ | 271 | (30) | % | $ | 689 | $ | 755 | (9) | % |
| 2023 vs. 2022 | |||||||||||||||||||||||
| Three Months Ended September 30, | Nine Months Ended September 30, | ||||||||||||||||||||||
| Factors Contributing to Year-Over-Year Change | Net Sales | Segment Profit | Net Sales | Segment Profit | |||||||||||||||||||
| Organic | (25) | % | (31) | % | (19) | % | (8) | % | |||||||||||||||
| Foreign currency translation | 1 | % | 1 | % | (1) | % | (1) | % | |||||||||||||||
| Acquisitions, divestitures, and other, net | — | % | — | % | — | % | — | % | |||||||||||||||
| Total % change | (24) | % | (30) | % | (20) | % | (9) | % |
Q3 2023 compared to Q3 2022
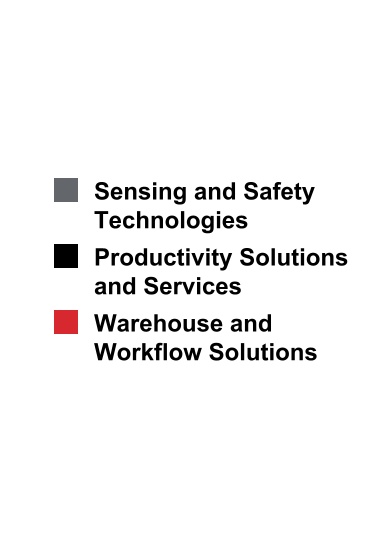
Sales decreased $413 million due to lower organic sales of $250 million in Warehouse and Workflow Solutions driven by lower demand for projects and lower organic sales of $136 million in Productivity Solutions and Services driven by lower demand for products.
Segment profit decreased $81 million and segment margin percentage decreased 120 basis points to 14.5% compared to 15.7% for the same period in 2022.
45 Honeywell International Inc.
YTD 2023 compared to YTD 2022
Sales decreased $1,038 million due to lower organic sales of $610 million in Warehouse and Workflow Solutions driven by lower demand for projects and lower organic sales of $329 million in Productivity Solutions and Services driven by lower demand for products.
Segment profit decreased $66 million and segment margin percentage increased 200 basis points to 16.2% compared to 14.2% for the same period in 2022.
CORPORATE AND ALL OTHER
Corporate and All Other primarily includes unallocated corporate costs, interest expense on holding-company debt, and the controlling majority-owned interest in Quantinuum. Corporate and All Other is not a separate reportable business segment as segment reporting criteria is not met. The Company continues to monitor the activities in Corporate and All Other to determine the need for further reportable business segment disaggregation.
REPOSITIONING CHARGES
See Note 5 Repositioning and Other Charges of Notes to Consolidated Financial Statements for a discussion of our repositioning actions and related charges incurred in the nine months ended September 30, 2023, and 2022. Cash spending related to our repositioning actions was $218 million in the nine months ended September 30, 2023, and was funded through operating cash flows.
46 Honeywell International Inc.
LIQUIDITY AND CAPITAL RESOURCES
(Dollars in tables in millions)
We manage our businesses to maximize operating cash flows as the primary source of liquidity. Each of our businesses is focused on increasing operating cash flows through revenue growth, margin expansion, and improved working capital turnover. Additional sources of liquidity include U.S. cash balances, and the ability to access non-U.S. cash balances, short-term debt from the commercial paper market, long-term borrowings, committed credit lines, and access to the public debt and equity markets.
CASH
As of September 30, 2023, and December 31, 2022, we held $7.9 billion and $10.1 billion, respectively, of cash and cash equivalents, including our short-term investments. We monitor the third-party depository institutions that hold our cash and cash equivalents on a daily basis. Our emphasis is primarily safety of principal and secondarily maximizing yield of those funds. We diversify our cash and cash equivalents among counterparties to minimize exposure to any one counterparty.
As of September 30, 2023, $5.4 billion of the Company’s cash, cash equivalents, and short-term investments were held by non-U.S. subsidiaries. We do not have material amounts related to any jurisdiction subject to currency control restrictions that impact our ability to access and repatriate such amounts. Under current laws, we do not expect taxes on repatriation or restrictions on amounts held outside of the U.S. to have a material effect on our overall liquidity.
CASH FLOW SUMMARY
Our cash flows from operating, investing, and financing activities, as reflected in the Consolidated Statement of Cash Flows, are summarized as follows:
| Nine Months Ended September 30, | |||||||||||||||||
| 2023 | 2022 | Variance | |||||||||||||||
| Cash and cash equivalents at beginning of period | $ | 9,627 | $ | 10,959 | $ | (1,332) | |||||||||||
| Operating activities | |||||||||||||||||
| Net income attributable to Honeywell | 4,395 | 3,947 | 448 | ||||||||||||||
| Noncash adjustments | 1,112 | 1,202 | (90) | ||||||||||||||
| Changes in working capital | (696) | (1,415) | 719 | ||||||||||||||
| NARCO Buyout payment | (1,325) | — | (1,325) | ||||||||||||||
| Other operating activities | (1,101) | (826) | (275) | ||||||||||||||
| Net cash provided by operating activities | 2,385 | 2,908 | (523) | ||||||||||||||
| Net cash provided by (used for) investing activities | (754) | 540 | (1,294) | ||||||||||||||
| Net cash used for financing activities | (3,427) | (6,609) | 3,182 | ||||||||||||||
| Effect of exchange rate changes on cash and cash equivalents | (61) | (349) | 288 | ||||||||||||||
| Net decrease in cash and cash equivalents | (1,857) | (3,510) | 1,653 | ||||||||||||||
| Cash and cash equivalents at end of period | $ | 7,770 | $ | 7,449 | $ | 321 |
Cash related to operating activities decreased by $523 million driven by the payment pursuant to the North American Refractories Company (NARCO) Amended Buyout Agreement and payment for the settlement of UOP Matters. This was partially offset by cash generated from operations, which included a favorable impact of working capital and the HWI Net Sale Proceeds. The favorable impact of working capital was driven by a $461 million increase in Accounts payable, due to increased material receipts and lower disbursements, and a $316 million decrease in Accounts receivable, due to higher cash receipts. See Note 14 Commitments and Contingencies of Notes to the Consolidated Financial Statements for additional information on the NARCO Amended Buyout Agreement, HWI Net Sale Proceeds, and UOP Matters.
Cash related to investing activities decreased by $1,294 million due to a $561 million decrease in cash receipts from settlements of derivative contracts related to foreign exchange risk management activities, $538 million increase in cash paid for acquisitions, and $409 million cash receipts from Garrett Motion Inc. (Garrett) in 2022, partially offset by $354 million net decrease in investments, as maturing short-term investments were moved into cash deposits.
47 Honeywell International Inc.
Cash related to financing activities increased by $3,182 million due to a $2,983 million increase in proceeds from the issuance of long-term debt, $640 million decrease in repurchases of common stock, and $408 million decrease in payments of long-term debt, partially offset by $743 million decrease in net proceeds from the issuance of commercial paper and $116 million increase in cash dividends paid.
CASH REQUIREMENTS AND ASSESSMENT OF CURRENT LIQUIDITY
In addition to our normal operating cash requirements, we expect our principal future cash requirements will be to fund capital expenditures, share repurchases, dividends, strategic acquisitions, and debt repayments. On April 24, 2023, the Board of Directors authorized the repurchase of up to $10 billion of Honeywell common stock, including approximately $2.1 billion of remaining availability under the previously announced $10 billion share repurchase authorization. During the nine months ended September 30, 2023, we repurchased common stock of $2,187 million. Refer to the section titled Liquidity and Capital Resources of our 2022 Form 10-K for a discussion of our expected capital expenditures, share repurchases, and dividends for 2023.
We continually seek opportunities to improve our liquidity and working capital efficiency, which includes the extension of payment terms with our suppliers and transfer of our trade receivables to unaffiliated financial institutions on a true sale basis. The impact of these programs is not material to our overall liquidity.
We continue to assess the relative strength of each business in our portfolio as to strategic fit, market position, profit, and cash flow contribution in order to identify target investment and acquisition opportunities in order to upgrade our combined portfolio. We identify acquisition candidates that will further our strategic plan and strengthen our existing core businesses. We also identify businesses that do not fit into our long-term strategic plan based on their market position, relative profitability, or growth potential. These businesses are considered for potential divestiture, restructuring, or other repositioning actions, subject to regulatory constraints.
In early 2023, we made payments of approximately $1.5 billion in connection with the NARCO Buyout and UOP Matters. Pursuant to the NARCO Amended Buyout Agreement, we are entitled to receive proceeds related to the HWI Sale. During the nine months ended September 30, 2023, we received proceeds from the HWI Sale in the amount of $275 million. These payments and receipts have not materially impacted our liquidity position. See Note 11 Fair Value Measurements of Notes to Consolidated Financial Statements for additional discussion related to the fair value of future proceeds from the HWI Sale.
Based on past performance and current expectations, we believe that our operating cash flows will be sufficient to meet our future operating cash needs. Our available cash, committed credit lines, and access to the public debt and equity markets provide additional sources of short-term and long-term liquidity to fund current operations, debt maturities, and future investment opportunities.
See Note 8 Long-term Debt and Credit Agreements of Notes to Consolidated Financial Statements for additional discussion of items impacting our liquidity.
BORROWINGS
We leverage a variety of debt instruments to manage our overall borrowing costs. As of September 30, 2023, and December 31, 2022, our total borrowings were $20.3 billion and $19.6 billion, respectively.
| September 30, 2023 | December 31, 2022 | |||||||||||||
| Commercial paper | $ | 1,931 | $ | 2,715 | ||||||||||
| Variable rate notes | 22 | 22 | ||||||||||||
| Fixed rate notes | 18,677 | 17,086 | ||||||||||||
| Other | 230 | 267 | ||||||||||||
| Fair value of hedging instruments | (323) | (287) | ||||||||||||
| Debt issuance costs | (251) | (233) | ||||||||||||
| Total borrowings | $ | 20,286 | $ | 19,570 |
A primary source of liquidity is our ability to access the corporate bond markets. Through these markets, we issue a variety of long-term fixed rate notes, in a variety of currencies, to manage our overall funding costs.
Another primary source of liquidity is our ability to access the commercial paper market. Commercial paper notes are sold at a discount or premium and have a maturity of not more than 365 days from date of issuance. Borrowings under the commercial paper program are available for general corporate purposes as well as for financing acquisitions.
48 Honeywell International Inc.
We also have the following revolving credit agreements:
-
A $1.5 billion 364-day credit agreement (the 364-Day Credit Agreement) with a syndicate of banks, dated as of March 20, 2023. Amounts borrowed under the 364-Day Credit Agreement are required to be repaid no later than March 18, 2024, unless (i) we elect to convert all then outstanding amounts into a term loan, upon which such amounts shall be repaid in full on March 18, 2025, or (ii) the 364-Day Credit Agreement is terminated earlier pursuant to its terms. The 364-Day Credit Agreement replaced the previously reported $1.5 billion 364-day credit agreement dated as of March 24, 2022, which was terminated in accordance with its terms effective March 20, 2023. As of September 30, 2023, there were no outstanding borrowings under our 364-Day Credit Agreement.
-
A $4.0 billion five-year credit agreement (the 5-Year Credit Agreement) with a syndicate of banks, dated as of March 20, 2023. Commitments under the 5-Year Credit Agreement can be increased pursuant to the terms of the 5-Year Credit Agreement to an aggregate amount not to exceed $4.5 billion. The 5-Year Credit Agreement amended and restated the previously reported $4.0 billion amended and restated five-year credit agreement dated as of March 24, 2022. As of September 30, 2023, there were no outstanding borrowings under our 5-Year Credit Agreement.
We also have a current shelf registration statement filed with the Securities and Exchange Commission (SEC) under which we may issue additional debt securities, common stock, and preferred stock that may be offered in one or more offerings on terms to be determined at the time of the offering. We anticipate that net proceeds of any offering would be used for general corporate purposes, including repayment of existing indebtedness, share repurchases, capital expenditures, and acquisitions.
CREDIT RATINGS
Our ability to access the global debt capital markets and the related cost of these borrowings is affected by the strength of our credit rating and market conditions. Our credit ratings are periodically reviewed by the major independent debt-rating agencies. As of September 30, 2023, S&P Global Inc. (S&P), Fitch Ratings Inc. (Fitch), and Moody’s Investor Service (Moody's) have ratings on our debt set forth in the table below:
| S&P | Fitch | Moody's | |||||||||||||||
| Outlook | Stable | Stable | Positive | ||||||||||||||
| Short-term | A-1 | F1 | P1 | ||||||||||||||
| Long-term | A | A | A2 |
On September 20, 2023, Moody's affirmed all credit ratings of the Company and revised their credit rating outlook from stable to positive.
OTHER MATTERS
LITIGATION
We are subject to a number of lawsuits, investigations, and claims (some of which involve substantial amounts) arising out of the conduct of our business. See Note 14 Commitments and Contingencies of Notes to Consolidated Financial Statements for further discussion of environmental, asbestos, and other litigation matters.
CRITICAL ACCOUNTING ESTIMATES
There have been no material changes to our Critical Accounting Estimates presented in our 2022 Annual Report on Form 10-K. For a discussion of the Company’s Critical Accounting Estimates, see the section titled Critical Accounting Estimates in our 2022 Annual Report on Form 10-K.
RECENT ACCOUNTING PRONOUNCEMENTS
See Note 2 Summary of Significant Accounting Policies of Notes to Consolidated Financial Statements for a discussion of recent accounting pronouncements.
49 Honeywell International Inc.
Item 3. QUANTITATIVE AND QUALITATIVE DISCLOSURES ABOUT MARKET RISKS
For a discussion of the Company’s quantitative and qualitative disclosures about market risks, see the section titled Quantitative and Qualitative Disclosures About Market Risks in our 2022 Annual Report on Form 10-K. As of September 30, 2023, there has been no material change in this information.
Item 4. CONTROLS AND PROCEDURES
Honeywell management, including the Chief Executive Officer and Chief Financial Officer, conducted an evaluation of the effectiveness of our disclosure controls and procedures (as defined in Rules 13a-15(e) or 15d-15(e) promulgated under the Securities Exchange Act of 1934, as amended (Exchange Act)) as of the end of the period covered by this Quarterly Report on Form 10-Q. Based upon that evaluation, the Chief Executive Officer and the Chief Financial Officer concluded that such disclosure controls and procedures were effective as of the end of the period covered by this Quarterly Report on Form 10-Q to ensure information required to be disclosed in the reports that Honeywell files or submits under the Exchange Act is recorded, processed, summarized, and reported within the time periods specified in the SEC's rules and forms, and that it is accumulated and communicated to our management, including our Chief Executive Officer, our Chief Financial Officer, and our Controller, as appropriate, to allow timely decisions regarding required disclosure. There were no changes that materially affected, or are reasonably likely to materially affect, Honeywell’s internal control over financial reporting that occurred during the period covered by this Quarterly Report on Form 10-Q.
50 Honeywell International Inc.
PART II. OTHER INFORMATION
Item 1. LEGAL PROCEEDINGS
We are subject to a number of lawsuits, investigations, and claims (some of which involve substantial amounts) arising out of the conduct of our business. See a discussion of environmental, asbestos, and other litigation matters in Note 14 Commitments and Contingencies of Notes to Consolidated Financial Statements.
There were no matters requiring disclosure pursuant to the requirement to disclose certain environmental matters involving potential monetary sanctions in excess of $300,000.
Item 1A. RISK FACTORS
There have been no material changes to our Risk Factors presented in our 2022 Annual Report on Form 10-K under the section titled Risk Factors. For further discussion of our Risk Factors, refer to the section titled Risk Factors in our 2022 Annual Report on Form 10-K.
ITEM 2. UNREGISTERED SALES OF EQUITY SECURITIES, USE OF PROCEEDS, AND ISSUER PURCHASES OF EQUITY SECURITIES
On April 24, 2023, the Board of Directors authorized the repurchase of up to $10 billion of Honeywell common stock, including approximately $2.1 billion of remaining availability under the previously announced $10 billion share repurchase authorization. The repurchase authorization does not have an expiration date and may be amended or terminated by the Board of Directors at any time without prior notice.
Repurchases may be made through a variety of methods, which could include open market purchases, accelerated share repurchase transactions, negotiated block transactions, 10b5-1 plans, other transactions that may be structured through investment banking institutions or privately negotiated, or a combination of the foregoing. Honeywell presently expects to repurchase outstanding shares from time to time (i) to offset the dilutive impact of employee stock-based compensation plans, including option exercises, restricted unit vesting, and matching contributions under our savings plans, and (ii) to reduce share count via share repurchases as and when attractive opportunities arise. The amount and timing of future repurchases may vary depending on market conditions and the level of operating, financing, and other investing activities.
During the quarter ended September 30, 2023, Honeywell purchased 5,267,030 shares of its common stock, par value $1 per share. As of September 30, 2023, $8.6 billion remained available for additional share repurchases. The following table summarizes our purchases of Honeywell's common stock for the quarter ended September 30, 2023:
| Issuer Purchases of Equity Securities | ||||||||||||||||||||||||||
| Period | Total Number of Shares Purchased | Average Price Paid per Share | Total Number of Shares Purchased as Part of Publicly Announced Plans or Programs | Approximate Dollar Value of Shares that May Yet Be Purchased Under Plans or Programs (Dollars in millions) | ||||||||||||||||||||||
| July 1-31, 2023 | 733,713 | $207.14 | 733,713 | $9,490 | ||||||||||||||||||||||
| August 1-31, 2023 | 2,631,818 | $189.40 | 2,631,818 | $8,992 | ||||||||||||||||||||||
| September 1-30, 2023 | 1,901,499 | $189.30 | 1,901,499 | $8,632 |
51 Honeywell International Inc.
ITEM 4. MINE SAFETY DISCLOSURES
One of our wholly-owned subsidiaries has a placer claim for and operates a chabazite ore surface mine in Arizona. Information concerning mine safety and other regulatory matters associated with this mine is required by Section 1503(a) of the Dodd-Frank Wall Street Reform and Consumer Protection Act and Item 104 of Regulation S-K and is included in Exhibit 95 to this quarterly report.
Item 5. OTHER INFORMATION
EQUITY TRADING PLAN ELECTIONS
Certain executive officers and directors of the Company may execute purchases and sales of the Company's common stock through Rule 10b5-1 and non-Rule 10b5-1 equity trading plans.
During the three months ended September 30, 2023, none of our executive officers or directors adopted, terminated, or modified a Rule 10b5-1 equity trading plan, or adopted, terminated, or modified any "non-Rule 10b5-1 trading arrangement" (as defined in Item 408(c) of Regulation S-K).
52 Honeywell International Inc.
Item 6. EXHIBITS
| Exhibit No. | Description | |||||||
| 31.1 | Certification of Principal Executive Officer Pursuant to Section 302 of the Sarbanes-Oxley Act of 2002 (filed herewith) | |||||||
| 31.2 | Certification of Principal Financial Officer Pursuant to Section 302 of the Sarbanes-Oxley Act of 2002 (filed herewith) | |||||||
| 32.1 | Certification of Principal Executive Officer Pursuant to 18 U.S.C. Section 1350, as Adopted Pursuant to Section 906 of the Sarbanes-Oxley Act of 2002 (furnished herewith) | |||||||
| 32.2 | Certification of Principal Financial Officer Pursuant to 18 U.S.C. Section 1350, as Adopted Pursuant to Section 906 of the Sarbanes-Oxley Act of 2002 (furnished herewith) | |||||||
| 95 | Mine Safety Disclosures (filed herewith) | |||||||
| 101.INS | Inline XBRL Instance Document (the instance document does not appear in the Interactive Data File because its XBRL tags are embedded within the Inline XBRL document) | |||||||
| 101.SCH | Inline XBRL Taxonomy Extension Schema (filed herewith) | |||||||
| 101.CAL | Inline XBRL Taxonomy Extension Calculation Linkbase (filed herewith) | |||||||
| 101.DEF | Inline XBRL Taxonomy Extension Definition Linkbase (filed herewith) | |||||||
| 101.LAB | Inline XBRL Taxonomy Extension Label Linkbase (filed herewith) | |||||||
| 101.PRE | Inline XBRL Taxonomy Extension Presentation Linkbase (filed herewith) | |||||||
| 104 | Cover Page Interactive Data File (formatted as inline XBRL and contained in Exhibit 101) |
53 Honeywell International Inc.
SIGNATURES
Pursuant to the requirements of the Securities Exchange Act of 1934, the Registrant has duly caused this report to be signed on its behalf by the undersigned thereunto duly authorized.
| HONEYWELL INTERNATIONAL INC. | ||||||||
| Date: October 26, 2023 | By: | /s/ Robert D. Mailloux | ||||||
| Robert D. Mailloux Vice President and Controller (on behalf of the Registrant and as the Registrant’s Principal Accounting Officer) |
54 Honeywell International Inc.