 filings.tools
Hewlett Packard Enterprise 10-K 2019-10-31
Filed 2019-12-13. 21 sections, 661K characters. Original on sec.gov · Markdown · JSON
Cover and table of contents
UNITED STATES
SECURITIES AND EXCHANGE COMMISSION
Washington, D.C. 20549
FORM 10-K
| (Mark One) | ||
| ☒ | ANNUAL REPORT PURSUANT TO SECTION 13 OR 15(d) OF THE SECURITIES EXCHANGE ACT OF 1934 |
For the fiscal year ended October 31, 2019
Or
| ☐ | TRANSITION REPORT PURSUANT TO SECTION 13 OR 15(d) OF THE SECURITIES EXCHANGE ACT OF 1934 |
For the transition period from to
Commission file number 001-37483
HEWLETT PACKARD ENTERPRISE CO****MPANY
(Exact name of registrant as specified in its charter)
| Delaware | 47-3298624 | |
| (State or other jurisdiction of incorporation or organization) | (I.R.S. employer identification no.) |
| 6280 America Center Drive, | San Jose, | California | 95002 | |
| (Address of principal executive offices) | (Zip code) |
Registrant's telephone number, including area code: (650) 687-5817
Securities registered pursuant to Section 12(b) of the Act:
| Title of each class | Trading Symbol(s) | Name of each exchange on which registered |
| Common stock, par value $0.01 per share | HPE | New York Stock Exchange |
Securities registered pursuant to Section 12(g) of the Act:
None
Indicate by check mark if the registrant is a well-known seasoned issuer as defined in Rule 405 of the Securities Act. Yes x No ¨
Indicate by check mark if the registrant is not required to file reports pursuant to Section 13 or Section 15(d) of the Act. Yes ¨ No x
Indicate by check mark whether the registrant (1) has filed all reports required to be filed by Section 13 or 15(d) of the Securities Exchange Act of 1934 during the preceding 12 months (or for such shorter period that the registrant was required to file such reports), and (2) has been subject to such filing requirements for the past 90 days. Yes x No ¨
Indicate by check mark whether the registrant has submitted electronically every Interactive Data File required to be submitted pursuant to Rule 405 of Regulation S-T (§ 232.405 of this chapter) during the preceding 12 months (or for such shorter period that the registrant was required to submit such files). Yes x No ¨
Indicate by check mark whether the registrant is a large accelerated filer, an accelerated filer, a non-accelerated filer, a smaller reporting company, or an emerging growth company. See the definitions of "large accelerated filer," "accelerated filer", "smaller reporting company" and "emerging growth company" in Rule 12b-2 of the Exchange Act. (Check one):
| Large accelerated filer | ☒ | Accelerated filer | ☐ | Non-accelerated filer (Do not check if a smaller reporting company) | ☐ | Smaller reporting company | ☐ | |||
| Emerging growth company | ☐ |
If an emerging growth company, indicate by check mark if the registrant has elected not to use the extended transition period for complying with any new or revised financial accounting standards provided pursuant to Section 13(a) of the Exchange Act. ¨
Indicate by check mark whether the registrant is a shell company (as defined in Rule 12b-2 of the Act). Yes ☐ No x
The aggregate market value of the registrant's common stock held by non-affiliates was $21,263,421,512 based on the last sale price of common stock on April 30, 2019.
The number of shares of Hewlett Packard Enterprise Company common stock outstanding as of November 30, 2019 was 1,292,925,893 shares.
| DOCUMENTS INCORPORATED BY REFERENCE | ||
| DOCUMENT DESCRIPTION | 10-K PART | |
| Portions of the Registrant's proxy statement related to its 2020 Annual Meeting of Stockholders to be filed pursuant to Regulation 14A within 120 days after Registrant's fiscal year end of October 31, 2019 are incorporated by reference into Part III of this Report. | III |
Hewlett Packard Enterprise Company
Form 10-K
For the Fiscal Year ended October 31, 2019
Table of Contents
Forward-Looking Statements
This Annual Report on Form 10-K, including "Management's Discussion and Analysis of Financial Condition and Results of Operations" in Item 7, contains forward-looking statements that involve risks, uncertainties and assumptions. If the risks or uncertainties ever materialize or the assumptions prove incorrect, the results of Hewlett Packard Enterprise Company and its consolidated subsidiaries ("Hewlett Packard Enterprise") may differ materially from those expressed or implied by such forward-looking statements and assumptions. The words "believe", "expect", "anticipate", "optimistic", "intend", "aim", "will", "should" and similar expressions are intended to identify such forward-looking statements. All statements other than statements of historical fact are statements that could be deemed forward-looking statements, including but not limited to any projections of revenue, margins, expenses, effective tax rates, the impact of the U.S. Tax Cuts and Jobs Act of 2017, earnings, net earnings, net earnings per share, cash flows, benefit plan funding, deferred tax assets, share repurchases, currency exchange rates or other financial items; any projections of the amount, timing or impact of cost savings or restructuring charges; any statements of the plans, strategies and objectives of management for future operations, as well as the execution of corporate transactions or contemplated acquisitions, transformation and restructuring plans and any resulting benefit, cost savings, revenue or profitability improvements; any statements concerning the expected development, performance, market share or competitive performance relating to products or services; any statements regarding current or future macroeconomic trends or events and the impact of those trends and events on Hewlett Packard Enterprise and its financial performance; any statements regarding pending investigations, claims or disputes; any statements of expectation or belief; and any statements or assumptions underlying any of the foregoing. Risks, uncertainties and assumptions include the need to address the many challenges facing Hewlett Packard Enterprise's businesses; the competitive pressures faced by Hewlett Packard Enterprise's businesses; risks associated with executing Hewlett Packard Enterprise's strategy; the impact of macroeconomic and geopolitical trends and events; the need to manage third-party suppliers and the distribution of Hewlett Packard Enterprise's products and the delivery of Hewlett Packard Enterprise's services effectively; the protection of Hewlett Packard Enterprise's intellectual property assets, including intellectual property licensed from third parties and intellectual property shared with its former Parent; risks associated with Hewlett Packard Enterprise's international operations; the development and transition of new products and services and the enhancement of existing products and services to meet customer needs and respond to emerging technological trends; the execution and performance of contracts by Hewlett Packard Enterprise and its suppliers, customers, clients and partners; the hiring and retention of key employees; integration and other risks associated with business combination and investment transactions; the execution, timing and results of any transformation or restructuring plans, including estimates and assumptions related to the costs (including any possible disruption of Hewlett Packard Enterprise's business) and anticipated benefits of implementing the transformation and restructuring plans; the effects of the U.S. Tax Cuts and Jobs Act and related guidance and regulations that may be implemented; the resolution of pending investigations, claims and disputes; and other risks that are described herein, including but not limited to the items discussed in "Risk Factors" in Item 1A of Part I of this report and that are otherwise described or updated from time to time in Hewlett Packard Enterprise's reports filed with the Securities and Exchange Commission. Hewlett Packard Enterprise assumes no obligation and does not intend to update these forward-looking statements.
PART I
Item 1. Business
We are a global technology leader focused on developing intelligent solutions that allow customers to capture, analyze and act upon data seamlessly from edge to cloud. We enable customers to accelerate business outcomes by driving new business models, creating new customer and employee experiences, and increasing operational efficiency today and into the future. Our legacy dates back to a partnership founded in 1939 by William R. Hewlett and David Packard, and we strive every day to uphold and enhance that legacy through our dedication to providing innovative technological solutions to our customers.
On November 1, 2015, HP Inc. ("former Parent"), formerly known as Hewlett-Packard Company ("HP Co.") spun-off Hewlett Packard Enterprise Company ("we", "us", "our", "Hewlett Packard Enterprise", "HPE", or "the Company") pursuant to a separation agreement (the "Separation and Distribution Agreement") (collectively the "Separation"). To effect the spin-off, HP Inc. distributed all of the shares of Hewlett Packard Enterprise Company ("HPE") common stock owned by HP Inc. to its stockholders on November 1, 2015. Holders of HP Inc. common stock received one share of Hewlett Packard Enterprise Company stock for every share of HP Inc. stock held as of the record date. As a result of the Separation, we now operate as an independent, publicly-traded company.
Separation Transactions
On April 1, 2017, we completed the separation and merger of our Enterprise Services business with Computer Sciences Corporation (“CSC”) (collectively, the “Everett Transaction”). The Everett Transaction was accomplished by a series of transactions among CSC, HPE, Everett SpinCo, Inc. (a wholly-owned subsidiary of HPE) (“Everett”), and New Everett Merger Sub Inc., a wholly-owned subsidiary of Everett (“Merger Sub”). We transferred the Enterprise Services business to Everett and distributed all of the shares of Everett to HPE stockholders. Following the distribution of shares, the Merger Sub merged with and into CSC, which became a wholly-owned subsidiary of Everett. At the time of the merger, Everett changed its name to DXC Technology Company (“DXC”).
On September 1, 2017, we completed the separation and merger of our Software business segment with Micro Focus International plc (“Micro Focus”) (collectively, the “Seattle Transaction”). The Seattle Transaction was accomplished by a series of transactions among HPE, Micro Focus, Seattle SpinCo, Inc. (a wholly-owned subsidiary of HPE) (“Seattle”), and Seattle MergerSub, Inc., an indirect wholly-owned subsidiary of Micro Focus (“Merger Sub”). We transferred the Software business to Seattle and distributed all of the shares of Seattle to HPE stockholders. Following the distribution of shares, the Merger Sub merged with and into Seattle which became an indirect, wholly-owned subsidiary of Micro Focus.
Upon the completion of the Everett and Seattle Transactions, we reclassified the historical financial results of our former Enterprise Services segment ("former ES segment") and our former Software segment to Net loss from discontinued operations in our Consolidated Statements of Earnings, and to assets and liabilities of discontinued operations in our Consolidated Balance Sheets.
HPE Next
During the third quarter of fiscal 2017, we launched an initiative called HPE Next, through which we are in the process of putting in place a purpose-built company designed to compete and win in the markets where we participate. Through this initiative, we are simplifying our operating model and the way we work, streamlining our offerings and business processes to improve our execution. More importantly, we will continue to shift our investments in innovation towards high growth and higher-margin solutions and services.
This initiative includes consolidating our manufacturing and support services locations, streamlining our business systems and reducing the number of countries in which we have a direct sales presence, while simultaneously migrating to a channel-only model in the remaining countries.
The HPE Next initiative is expected to be implemented through fiscal 2020. During the remaining implementation period, we expect to incur expenses for workforce reductions, to upgrade and simplify our IT infrastructure, and for other non-labor actions. These expenses will be partially offset by proceeds received from the remaining real estate sales.
Our Strategy
Digital transformation is creating countless possibilities in a world where billions of users and devices and trillions of things are connected. The applications and data that create and run our enterprises, live everywhere - in the cloud, on- and off-premises, and increasingly at the edge.
As the edge-to-cloud platform-as-a-Service company, HPE’s strategy is to help enterprises accelerate outcomes by unlocking value from all of their data, everywhere. Built on decades of re-imagining the future and innovating to advance the way we live and work, HPE delivers unique, open and intelligent technology solutions, with a consistent experience across all clouds and edges, to help customers develop new business models, engage in new ways, and increase operational performance.
No matter what stage of digital transformation, HPE has the expertise, the right tools and solutions with a flexible delivery model to help enterprises harness the power of their data across all their clouds and edges.
| • | Through HPE Pointnext Services, we have the expertise to assess, design, implement, optimize and manage our customers’ digital transformation. |
| • | We have the right tools to help customers accelerate their business - be it automation, AI, security or predictive analytics. |
| • | We have the as-a-Service consumption model to provide flexibility and optimize IT investments. |
| • | Through Financial Services, we can help customers manage and monetize their existing assets in new ways and free up capital for innovation. |
At HPE, we help our customers thrive, from every edge to any cloud.
Our Business Segments, Products and Services
We organize our business into the following four segments:
| • | Hybrid IT provides a broad portfolio of services-led and software-enabled infrastructure and solutions including secure, software-defined servers, storage and HPE Pointnext services, thereby combining HPE's hardware, software and services capabilities to make Hybrid IT simple for its customers. |
| • | Intelligent Edge provides a portfolio of secure Edge-to-Cloud solutions operating under the Aruba brand that include wireless local area network ("LAN"), campus and data center switching, software-defined wide-area-networking, security, and associated services to enable secure connectivity for businesses of any size. |
| • | Financial Services ("FS") enables flexible IT consumption models, financial architectures and customized investment solutions for our customers. |
| • | Corporate Investments includes Communication and Media Solutions ("CMS"), Hewlett Packard Labs and certain business incubation projects. |
A summary of our net revenue, earnings from operations and assets for our segments can be found in Note 3, "Segment Information", to our Consolidated Financial Statements in Item 8 of Part II. A discussion of certain factors potentially affecting our operations is set forth in Item 1A, "Risk Factors."
Hybrid IT
Hybrid IT provides a broad portfolio of services-led and software-enabled infrastructure and solutions including secure, software-defined servers, storage, and HPE Pointnext services, thereby combining HPE's hardware, software and services capabilities to make Hybrid IT simple for its customers. Described below are the business unit capabilities within Hybrid IT.
| • | Hybrid IT Product includes Compute and Storage. |
| ◦ | Compute. We offer both Industry Standard Servers ("ISS"), which are general purpose servers for multi-workload computing, as well as Mission Critical Servers ("MCS"), which are servers optimized for particular workloads, to address the full array of the customers' computing needs. Our general purpose servers include the HPE ProLiant, secure and versatile rack and tower servers; HPE BladeSystem, a modular infrastructure that converges server, storage and networking; and HPE Synergy, a composable infrastructure for traditional and cloud-native applications. Our workload optimized server portfolio includes the HPE Apollo and products from the acquisition of Cray, for high performance computing and artificial intelligence, HPE Cloudline for cloud data centers, HPE Edgeline for computing at the network edge and HPE Integrity for mission-critical applications. |
| ◦ | Storage. With storage offerings that are AI-driven and built for cloud environments with as-a-service consumption and flexible investment options, HPE provides the right workload optimized destinations for data. Powered by HPE InfoSight advanced analytics and machine learning and HPE Cloud Volumes data mobility, HPE delivers intelligent storage for hybrid cloud environments so that customers can unlock data’s full potential and derive business insights. Key solutions include HPE SimpliVity, a hyper-converged platform for virtualization, |
technology from the Blue Data and MapR acquisitions for expertise in artificial intelligence, machine learning and analytics data management, HPE 3PAR Storage and HPE Nimble Storage all-flash arrays for mission critical workloads and general purpose workloads, respectively, and big data solutions running on HPE Apollo Servers. Storage also provides comprehensive data protection with HPE StoreOnce and HPE Recovery Manager Central, solutions for secondary workloads and traditional tape, storage networking and disk products, such as HPE Modular Storage Arrays ("MSA") and HPE XP.
| • | HPE Pointnext Services creates preferred IT experiences that power the digital business. The HPE Pointnext Services team and our extensive partner network provide value across the IT life cycle delivering advice, transformation projects, professional services, support services and operational services for Hybrid IT and the Intelligent Edge. HPE Pointnext Services is also a provider of on-premises flexible consumption models, such as HPE GreenLake, that enable IT agility, simplify operations and align cost to business value. HPE Pointnext Services offerings includes Operational Services and Advisory and Professional Services. |
Intelligent Edge
The Intelligent Edge business is comprised of a portfolio of secure edge-to-cloud solutions operating under the Aruba brand that include wireless LAN, campus and data center switching, software-defined wide-area-networking, security, and associated services to enable secure connectivity for businesses of any size. The primary business drivers for Intelligent Edge solutions are mobility and IoT.
| ◦ | HPE Aruba Product includes wired and wireless LAN, wide area network ("WAN"), data center networking such as Wi-Fi access points, switches, routers, sensors, and software products that include cloud-based management, network management, network access control, analytics and assurance, and location services. |
| ◦ | HPE Aruba Services includes professional and support services, as well as as-a-Service ("aaS") and consumption models for the Intelligent Edge portfolio of products. |
Financial Services
Financial Services provides flexible investment solutions, such as leasing, financing, IT consumption, and utility programs and asset management services, for customers that facilitate unique technology deployment models and the acquisition of complete IT solutions, including hardware, software and services from Hewlett Packard Enterprise and others. In order to provide flexible services and capabilities that support the entire IT life cycle, FS partners with customers globally to help build investment strategies that enhance their business agility and support their business transformation. FS offers a wide selection of investment solution capabilities for large enterprise customers and channel partners, along with an array of financial options to SMBs and educational and governmental entities.
Corporate Investments
Corporate Investments includes CMS, Hewlett Packard Labs and certain business incubation projects.
Pending Segment Realignments
In order to align our segment financial reporting more closely with our current business structure, bring more visibility and transparency to Hybrid IT and further align to the evolving market landscape, effective November 1, 2019, we will report the following four new reportable segments: Compute; High Performance Compute ("HPC") & Mission Critical Servers ("MCS"); Storage; and Advisory & Professional Services ("A&PS"). As a result of this change, Operational Services, which was previously reported within HPE Pointnext Services, will be reported within each of the related individual new segments. The Intelligent Edge, Financial Services and Corporate Investments segments will remain largely unchanged.
Our Strengths
We believe that we possess a number of competitive advantages that distinguish us from our competitors, including:
| • | Strong solutions portfolio that spans edge to cloud. We combine our software-defined infrastructure and services capabilities to provide what we believe is the strongest portfolio of enterprise solutions in the IT industry. Our ability to deliver a comprehensive IT strategy, and connect our customers’ data from edge to cloud, through our high-quality products and high-value consulting and support services in a single package-is one of our principal differentiators. |
| • | Multi-year innovation roadmap. We have been in the technology and innovation business for over 75 years. Our vast intellectual property portfolio and global research and development capabilities are part of a broader innovation roadmap designed to help organizations take advantage of the expanding amount of data available and leverage the latest technology |
developments like cloud, artificial intelligence, and cybersecurity to drive business outcomes now and in the future. We also have a strong balance sheet that provides the flexibility and speed to take advantage of acquisition opportunities.
| • | Ability to deliver flexible consumption-based IT solutions. We have developed IT consumption models to facilitate the delivery of our products and services to our customers that includes pay-per-use or subscription-based options with a sophisticated set of metering, financial and managed services components. We have a head start over other companies that has allowed us to build capabilities and partnerships that are unique in the industry including the ability to deliver our as-a-Service portfolio in more than 50 countries and with over 500 channel partners that can sell the as-a-Service portfolio. |
| • | Global distribution and partner ecosystem. We are experts in delivering innovative technological solutions to our customers in complex multi-country, multi-vendor and/or multi-language environments. We have one of the largest go-to-market capabilities in our industry, including a large ecosystem of channel partners, which enables us to market and deliver our product offerings to customers located virtually anywhere in the world. |
| • | Custom financial solutions. Through Financial Services we can help customers manage and monetize their existing assets in new ways and free up capital for innovation. Financial Services is unique in its ability to help customers address the entire product lifecycle to reduce the cost and resource demands of IT, in what we call the “circular economy.” Through Financial Services’ Global Asset Recovery Centers, we are processing more than 4 million assets every year, which also helps our customers achieve their own sustainability goals. |
| • | Experienced leadership team with track record of successful performance. Our management team has an extensive track record of performance and execution. We are led by our President and Chief Executive Officer, Antonio Neri, who has proven experience in developing transformative business models, building global brands and driving sustained growth and expansion in the technology industry. Mr. Neri's experience includes over 20 years combined at HPE and HP Co. in various leadership positions. Our senior management team has many years of experience in our industry and possesses extensive knowledge of and experience in the enterprise IT business and the markets in which we compete. Moreover, we have a deep bench of management and technology talent that we believe provides us with an unparalleled pipeline of future leaders and innovators. |
| • | Open Platforms. Many of our competitors want to lock customers into one flavor of cloud and cloud stack. We believe that the cloud experience should be open and seamless across all our customers’ clouds - and the best cloud transformation partner is one who is unbiased, offers choice, neutral without an agenda. We are unique in our ability to enable any hybrid cloud strategy and a consistent experience that is open to any cloud and differentiated with our partner integrations. |
Sales, Marketing and Distribution
We manage our business and report our financial results based on the segments described above. Our customers are organized by commercial and large enterprise groups, including business and public sector enterprises, and purchases of our products, solutions and services may be fulfilled directly by us or indirectly through a variety of partners, including:
| • | resellers that sell our products and services, frequently with their own value-added products or services, to targeted customer groups; |
| • | distribution partners that supply our solutions to resellers; |
| • | original equipment manufacturers ("OEMs") that integrate our products and services with their own products and services, and sell the integrated solution; |
| • | independent software vendors that provide their clients with specialized software products and often assist us in selling our products and services to clients purchasing their products; |
| • | systems integrators that provide expertise in designing and implementing custom IT solutions and often partner with us to extend their expertise or influence the sale of our products and services; and |
| • | advisory firms that provide various levels of management and IT consulting, including some systems integration work, and typically partner with us on client solutions that require our unique products and services. |
The mix of our business conducted by direct sales or channel differs substantially by business and region. We believe that customer buying patterns and different regional market conditions require us to tailor our sales, marketing and distribution efforts accordingly. We are focused on driving the depth and breadth of our coverage, in addition to identifying efficiencies and productivity gains, in both our direct and indirect businesses. For example, through our HPE Next initiative, we have reduced the number of countries in which we have a direct sales presence, while simultaneously migrating to a channel-only model in the remaining countries. We typically assign an account manager to manage relationships across our business with large enterprise customers.
The account manager is supported by a team of specialists with product and services expertise. For other customers and for consumers, our businesses collaborate to manage relationships with commercial resellers targeting SMBs where appropriate.
Manufacturing and Materials
We utilize a significant number of outsourced and contract manufacturers around the world to manufacture products that we design. The use of outsourced and contract manufacturers is intended to generate cost efficiencies and reduce time to market for our products as well as create manufacturing flexibility in our supply chain and processes. In some circumstances, third-party OEMs produce products that we purchase and resell under our brand. In addition to our use of outsourced and contract manufacturers, we currently manufacture a limited number of finished products from components and subassemblies that we acquire from a wide range of vendors.
Historically, we have utilized two primary methods of fulfilling demand for products: building products to order and configuring products to order. We build products to order to maximize manufacturing and logistics efficiencies by producing high volumes of basic product configurations. Alternatively, configuring products to order enables units to match a customer's particular hardware and software customization requirements. Our inventory management and distribution practices in both building products to order and configuring products to order seek to minimize inventory holding periods by taking delivery of the inventory and manufacturing shortly before the sale or distribution of products to our customers.
We purchase materials, supplies and product subassemblies from a substantial number of vendors. For most of our products, we have existing alternate sources of supply or such alternate sources of supply are readily available. However, we do rely on sole sources for certain customized parts (although some of these sources have operations in multiple locations in the event of a disruption). We are dependent upon Intel and AMD as suppliers of x86 processors; however, we believe that disruptions with these suppliers would result in industry-wide dislocations and therefore would not disproportionately disadvantage us relative to our competitors.
Like other participants in the IT industry, we ordinarily acquire materials and components through a combination of blanket and scheduled purchase orders to support our demand requirements for periods averaging 90 to 120 days. From time to time, we may experience significant price volatility or supply constraints for certain components that are not available from multiple sources due to certain events taking place where our suppliers are geographically concentrated. When necessary, we are often able to obtain scarce components for somewhat higher prices on the open market, which may have an impact on our gross margin, but does not generally disrupt production. We may also acquire component inventory in anticipation of supply constraints, or enter into longer-term pricing commitments with vendors to improve the priority, price and availability of supply. See "Risk Factors—We depend on third-party suppliers, and our financial results could suffer if we fail to manage our suppliers properly."
International
Our products and services are available worldwide. We believe geographic diversity allows us to meet demand on a worldwide basis for our customers, draws on business and technical expertise from a worldwide workforce, provides stability to our operations, provides revenue streams that may offset geographic economic trends, and offers us an opportunity to access new markets for maturing products.
A summary of our domestic and international results is set forth in Note 3, "Segment Information", to our Consolidated Financial Statements in Item 8 of Part II. Approximately 67% of our overall net revenue in fiscal 2019 came from outside the United States.
For a discussion of certain risks attendant to our international operations, see "Risk Factors—Due to the international nature of our business, political or economic changes or other factors could harm our future revenue, costs and expenses, and financial condition," and "—We are exposed to fluctuations in foreign currency exchange rates" in Item 1A, "Quantitative and Qualitative Disclosure about Market Risk" in Item 7A and Note 14, "Financial Instruments", to our Consolidated Financial Statements in Item 8 of Part II, which are incorporated herein by reference.
Research and Development
Innovation is a key element of our culture and critical to our success. Our research and development efforts are focused on designing and developing products, services and solutions that anticipate customers' changing needs and desires and emerging technological trends. Our efforts also are focused on identifying the areas where we believe we can make a unique contribution and where partnering with other leading technology companies will leverage our cost structure and maximize our customers' experiences.
Expenditures for research and development were $1.8 billion in fiscal 2019, $1.7 billion in fiscal 2018 and $1.5 billion in fiscal 2017. We anticipate that we will continue to have significant research and development expenditures in the future to support the design and development of innovative, high-quality products, services and solutions to maintain and enhance our competitive
position. For a discussion of risks attendant to our research and development activities, see "Risk Factors—If we cannot successfully execute our go-to-market strategy and continue to develop, manufacture and market innovative products, services and solutions, our business and financial performance may suffer" in Item 1A.
Patents
Our general policy is to seek patent protection for those inventions likely to be incorporated into our products and services or where obtaining such proprietary rights will improve our competitive position. At present, our worldwide patent portfolio includes approximately 15,000 issued and pending patents.
Patents generally have a term of up to 20 years from the date they are filed. As our patent portfolio has been built over time, the remaining terms of the individual patents across our patent portfolio vary. We believe that our patents and patent applications are important for maintaining the competitive differentiation of our products and services, enhancing our freedom of action to sell our products and services in markets in which we choose to participate, and maximizing our return on research and development investments. No single patent is in itself essential to our company as a whole or to any of our business segments.
In addition to developing our patent portfolio, we license intellectual property from third parties as we deem appropriate. We have also granted and continue to grant to others licenses and other rights under our patents when we consider these arrangements to be in our interest. These license arrangements include a number of cross-licenses with third parties.
For a discussion of risks attendant to intellectual property rights, see "Risk Factors—Our financial performance may suffer if we cannot continue to develop, license or enforce the intellectual property rights on which our businesses depend" and "—Our products and services depend in part on intellectual property and technology licensed from third parties" in Item 1A.
Backlog
We believe that our backlog is not a meaningful indicator of our future business prospects due to our diverse product and service portfolio, including the large volume of products delivered from finished goods or channel partner inventories and the shortening of product life cycles. Therefore, we believe that backlog information is not material to an understanding of our overall business.
Seasonality
General economic conditions have an impact on our business and financial results. From time to time, the markets in which we sell our products, services and solutions experience weak economic conditions that may negatively affect sales. We experience some seasonal trends in the sale of our products and services. For example, European sales are often weaker in the summer months. See Item 1A, "Risk Factors—Our uneven sales cycle makes planning and inventory management difficult and future financial results less predictable."
Competition
We have a broad technology portfolio of enterprise IT infrastructure products, solutions and services. We encounter strong competition in all areas of our business. We compete primarily on the basis of technology, innovation, performance, price, quality, reliability, brand, reputation, distribution, range of products and services, ease of use of our products, account relationships, customer training, service and support, security, and the availability of our IT infrastructure offerings.
The markets in which we compete are characterized by strong competition among major corporations with long-established positions and a large number of new and rapidly growing firms. Most product life cycles are relatively short, and to remain competitive we must develop new products and services, continuously enhance our existing products and services and compete effectively on the basis of the factors listed above, among others. In addition, we compete with many of our current and potential partners, including OEMs that design, manufacture and market their products under their own brand names. Our successful management of these competitive partner relationships is critical to our future success. Moreover, we anticipate that we will have to continue to adjust prices on many of our products and services to stay competitive.
The competitive environments in which each segment operates are described below:
Hybrid IT operates in the highly competitive data center infrastructure market, which is characterized by rapid and ongoing technological innovation and price competition. Our primary competitors include technology vendors such as Dell Technologies Inc., Cisco Systems, Inc., NetApp, Inc., Lenovo Group Ltd., International Business Machines Corporation, Huawei Technologies Co. Ltd., Amazon.com, Inc., Oracle Corporation, Fujitsu Limited, Juniper Networks, Inc., Inspur Co., Ltd., Hitachi Ltd., Extreme Networks, Inc., Pure Storage, Inc., VMware, Nutanix, Inc., Google Inc., and Rackspace Inc. In certain regions, we also experience competition from local companies and from generically branded or "white-box" manufacturers. Our strategy is to deliver superior products, high-value technology support services and differentiated integrated solutions that combine our infrastructure, software and services capabilities. Our competitive advantages include our broad end-to-end solutions portfolio, supported by our strong intellectual property portfolio and research and development capabilities, coupled with our global reach and partner ecosystem.
Intelligent Edge operates in the highly competitive networking and connectivity infrastructure market, which is characterized by rapid and ongoing technological innovation and price competition. Our primary competitors include technology vendors such as Cisco Systems, Inc., Extreme Networks, Inc., Juniper Networks, Inc., Fortinet, Inc., Ruckus Wireless, Inc., Arista Networks, Inc., Dell Technologies Inc., and Huawei Technologies Co. Ltd. Our strategy is to deliver superior enterprise wired and wireless local-area networking components and software, high-value technology support services and differentiated integrated solutions that combine our infrastructure, software and services capabilities. Our competitive advantages include our broad end-to-end solutions portfolio, supported by our strong intellectual property portfolio and research and development capabilities, coupled with our global reach and partner ecosystem.
Financial Services. In our financing business, our primary competitors are captive financing companies, such as IBM Global Financing, Dell Financial Services, and Cisco Capital, as well as banks and other financial institutions. Our primary IT Asset Disposition (ITAD) competitors are ERI, Ingram Micro, Sage Sustainable Electronics, and Sims Recycling Solutions. We believe our competitive advantage over banks, other financial institutions, and ITAD providers is our ability to bring together our investment solutions with our expertise in managing technology assets. Not only are we able to deliver investment solutions that help customers create unique technology deployments based on specific business needs, but we also help them extract value from existing IT investments while more efficiently managing the retirement of those assets. All of these solutions can help customers accelerate digital transformation, create new budget streams, and meet Circular Economy objectives.
For a discussion of certain risks attendant to these competitive environments, see "Risk Factors—We operate in an intensely competitive industry and competitive pressures could harm our business and financial performance" in Item 1A.
Environment
Our operations are subject to regulation under various federal, state, local, and foreign laws concerning the environment, including laws addressing the discharge of pollutants into the air and water, the management, movement, and disposal of hazardous substances and wastes and the clean-up of contaminated sites. We could incur substantial costs, including clean-up costs, fines and civil or criminal sanctions and third-party damage or personal injury claims, if we were to violate or become liable under environmental laws.
Many of our products are subject to various federal, state, local, and foreign laws governing chemical substances in products and their safe use, including laws restricting the presence of certain substances in electronics products and in some cases, laws regulating the manufacture and distribution of chemical substances. Some of our products and services also are, or may in the future be, subject to requirements applicable to their energy consumption. In addition, we face increasing complexity in our product design, procurement operations, and transportation and shipping infrastructure as we adjust to new and future requirements relating to recycling and reuse of materials as part of the transition to a circular economy, the chemical and materials composition of our products, appropriate product packaging and labeling, their safe use and their energy efficiency, including requirements relating to climate change. We are also subject to legislation in an increasing number of jurisdictions that makes producers of electrical goods, including servers and networking equipment, financially responsible for specified collection, recycling, treatment, and disposal of past and future covered products (sometimes referred to as "product take-back legislation"). In the event our products become non-compliant with these laws, our products could be restricted from entering certain jurisdictions and we could face other sanctions, including fines.
Our operations, services and ultimately our products are expected to become increasingly subject to federal, state, local, and foreign laws, regulations and international treaties relating to climate change. As these laws, regulations, treaties, and similar initiatives and programs are adopted and implemented throughout the world, we will be required to comply or potentially face market access limitations or other sanctions, including fines. However, we believe that technology will be fundamental to finding solutions to achieve compliance with and manage those requirements, and we are collaborating with industry, business groups and governments to find and promote ways that our technology can be used to address climate change and to facilitate compliance
with related laws, regulations and treaties. See "Risk Factors-Our business is subject to various federal, state, local and foreign laws and regulations that could result in costs or other sanctions that adversely affect our business and results of operations" in Item 1A.
We are committed to maintaining compliance with all environmental laws applicable to our operations, products and services, and to reducing our environmental impact across all aspects of our business. We meet this commitment with a comprehensive environmental, health and safety policy, strict environmental management of our operations and worldwide environmental programs and services.
Environmental costs and accruals are presently not material to our operations, cash flows or financial position. Although there is no assurance that existing or future environmental laws applicable to our operations, services or products will not have a material adverse effect on our operations, cash flows or financial condition, we do not currently anticipate material capital expenditures for environmental control facilities.
Employees
We had approximately 61,600 employees as of October 31, 2019.
Additional Information
Intel® and Itanium® are trademarks of Intel Corporation in the United States and other countries. AMD is a trademark of Advanced Micro Devices, Inc.
Information about our Executive Officers
The following are our current executive officers:
| Name | Age | Position |
| Antonio Neri | 52 | President and Chief Executive Officer |
| Philip Davis | 52 | President, Hybrid IT |
| Kirt P. Karros | 50 | Senior Vice President, Finance and Treasurer |
| Alan May | 61 | Executive Vice President and Chief People Officer |
| Keerti Melkote | 49 | President, Intelligent Edge |
| Jeff T. Ricci | 58 | Senior Vice President, Controller and Principal Accounting Officer |
| Tarek Robbiati | 54 | Executive Vice President and Chief Financial Officer |
| Irv Rothman | 73 | President and Chief Executive Officer, HPE Financial Services |
| John Schultz | 55 | Executive Vice President, Chief Legal and Administrative Officer and Secretary |
Antonio Neri; President and Chief Executive Officer
Mr. Neri has served as our President and Chief Executive Officer since June 2017 and February 2018, respectively. Mr. Neri previously served as Executive Vice President and General Manager of our Enterprise Group from November 2015 to June 2017. Prior to that, Mr. Neri served in a similar role for HP Co.’s Enterprise Group from October 2014 to November 2015. Mr. Neri served as Senior Vice President and General Manager of the HP Servers business unit from September 2013 to October 2014 and concurrently as Senior Vice President and General Manager of the HP Networking business unit from May 2014 to October 2014. Prior to that, Mr. Neri served as Senior Vice President and General Manager of the HP Technology Services business segment from August 2011 to September 2013 and as Vice President, Customer Services for the HP Personal Systems Group from 2007 to August 2011, having first joined HP Co. in 1996. From March 2012 to February 2013, Mr. Neri served as a director of MphasiS Limited, an India-based technology company.
Philip Davis; President, Hybrid IT
Mr. Davis has served as President of our Hybrid IT business segment since August 2018 and concurrently as our Chief Sales Officer from November 2017 to October 2019. Prior to that, Mr. Davis served as Senior Vice President and Regional Managing Director of our Enterprise Group in the Asia Pacific Japan region, from November 2016 to October 2017. Mr. Davis previously served as Vice President and General Manager, Storage of our Enterprise Group in the Asia Pacific Japan region from November 2015 to October 2016. Prior to that, Mr. Davis served in a similar role at HP Co. from September 2014 to November 2015. Before joining HP Co., Mr. Davis served as Vice President and General Manager of Dell’s Enterprise Solutions Group in the Asia Pacific Japan region from January 2008 to September 2014.
Kirt P. Karros; Senior Vice President, Finance and Treasurer
Mr. Karros has served as our Senior Vice President, Finance and Treasurer since November 2015. Prior to that, Mr. Karros served in a similar role at HP Co. and led its Investor Relations from May 2015 to October 2015. Mr. Karros previously served as Principal and Managing Director of Research for Relational Investors LLC, an investment fund, from 2001 to May 2015 and concurrently as a director of PMC-Sierra, a semiconductor company, from August 2013 to May 2015.
Alan May; Executive Vice President and Chief People Officer
Mr. May has served as our Executive Vice President, Chief People Officer since June 2015. Before joining Hewlett Packard Enterprise, Mr. May served as Vice President, Human Resources at Boeing Commercial Aircraft, a division of The Boeing Company, from April 2013 to June 2015. Prior to that, Mr. May served as Vice President, Human Resources for Boeing Defense, Space and Security at Boeing from April 2011 to June 2015 and as Vice President, Compensation, Benefits and Strategy at Boeing from August 2007 to April 2011. Mr. May has also served in senior human resources roles at Cerberus Capital Management and PepsiCo.
Keerti Melkote; President, Intelligent Edge
Mr. Melkote has served as President of our Intelligent Edge business segment since January 2017. Mr. Melkote previously served as Chief Technology Officer of Intelligent Edge from May 2015 to December 2016. Prior to that, Mr. Melkote performed a similar role as Chief Technology Officer and Co-Founder of Aruba Networks from February 2009 until our acquisition of Aruba Networks in May 2015. Previously, Mr. Melkote served as Co-Founder and Vice President, Products at Aruba Networks from February 2002 to January 2009.
Jeff T. Ricci; Senior Vice President, Controller and Principal Accounting Officer
Mr. Ricci has served as our Senior Vice President, Controller and Principal Accounting Officer since November 2015. Prior to that, Mr. Ricci performed a similar role at HP Co. from April 2014 to November 2015. Mr. Ricci served as Controller and Principal Accounting Officer at HP Co. on an interim basis from November 2013 to April 2014. Previously, Mr. Ricci served as Vice President, Finance for several of HP Co.'s organizations, including Technology and Operations from May 2012 to November 2013, Global Accounts and HP Financial Services from March 2011 to May 2012, and HP Software from March 2009 to March 2011.
Tarek Robbiati; Executive Vice President and Chief Financial Officer
Mr. Robbiati has served as our Executive Vice President, Chief Financial Officer since September 2018. Before joining Hewlett Packard Enterprise, Mr. Robbiati served as Chief Financial Officer of Sprint Corporation from August 2015 to February 2018. Mr. Robbiati previously served as Chief Executive Officer and Managing Director of FlexiGroup Limited in Australia from January 2013 to August 2015. Prior to that, from December 2009 to December 2012, Mr. Robbiati was Group Managing Director and President of Telstra International Group in Hong Kong and Executive Chairman of Hong Kong CSL Limited (“CSL”), a subsidiary of Telstra Corporation Limited. From July 2007 to May 2010, Mr. Robbiati served as the Chief Executive Officer of CSL in Hong Kong.
Irv Rothman; President and Chief Executive Officer, HPE Financial Services
Mr. Rothman has served as President and Chief Executive Officer of our Financial Services business segment, our IT investment and financing subsidiary, since November 2015. Prior to that, Mr. Rothman served in a similar role at HP Co. from May 2002 to November 2015. Prior to joining HP Co., Mr. Rothman was President and Chief Executive Officer of Compaq Financial Services Corporation from January 1997 to April 2002.
John F. Schultz; Executive Vice President, Chief Legal and Administrative Officer and Secretary
Mr. Schultz has served as our Executive Vice President, Chief Legal and Administrative Officer and Secretary since December 2017. Prior to that, Mr. Schultz served as our Executive Vice President, General Counsel and Secretary from November 2015 to December 2017, performing a similar role at HP Co. from April 2012 to November 2015. Mr. Schultz previously served as Deputy General Counsel for Litigation, Investigations and Global Functions at HP Co. from September 2008 to April 2012. Prior to joining HP Co., Mr. Schultz was a partner in the litigation practice at Morgan, Lewis & Bockius LLP, a law firm, from March 2005 to September 2008, where, among other clients, he supported HP Co. as external counsel on a variety of litigation and regulatory matters.
Available Information
Our Annual Report on Form 10-K, Quarterly Reports on Form 10-Q, Current Reports on Form 8-K, and amendments to reports filed or furnished pursuant to Sections 13(a) and 15(d) of the Securities Exchange Act of 1934, as amended, are available on our website at http://investors.hpe.com, as soon as reasonably practicable after we electronically file such reports with, or furnish those reports to, the Securities and Exchange Commission. Hewlett Packard Enterprise's Corporate Governance Guidelines, Board of Directors' committee charters (including the charters of the Audit Committee, Finance and Investment Committee, HR and Compensation Committee, Technology Committee, and Nominating, Governance and Social Responsibility Committee) and code of ethics entitled "Standards of Business Conduct" are also available at that same location on our website. Stockholders may request free printed copies of these documents from:
Hewlett Packard Enterprise Company
Attention: Investor Relations
6280 America Center Dr
San Jose, CA 95002
http://investors.hpe.com/financial/requested-printed-reports
Item 1A. Risk Factors.
You should carefully consider the following risks and other information in this Form 10-K in evaluating Hewlett Packard Enterprise and its common stock. Any of the following risks could materially and adversely affect our results of operations or financial condition. The following risk factors should be read in conjunction with Part II, Item 7, "Management's Discussion and Analysis of Financial Condition and Results of Operation" and the Consolidated Financial Statements and related notes in Part II, Item 8, "Financial Statements and Supplementary Data" of this Form 10-K.
Risks Related to Our Business
If we cannot successfully execute our go-to-market strategy and continue to develop, manufacture and market innovative products, services and solutions, our business and financial performance may suffer.
Our long-term strategy is focused on leveraging our portfolio of hardware, software and services as we deliver global edge to cloud platform-as-a-service to help customers accelerate outcomes by unlocking value from all of their data, everywhere. HPE delivers unique, open and intelligent technology solutions, with a consistent experience across all clouds and edge computing platforms. To successfully execute this strategy, we must address business model shifts and optimize go-to-market execution by improving cost structure, aligning sales coverage with strategic goals, improving channel execution and strengthening our capabilities in our areas of strategic focus, while continuing to pursue new product innovation that builds on our strategic capabilities in areas such as cloud and data center computing, software-defined networking, converged storage, high-performance compute, and wireless networking. Any failure to successfully execute this strategy, including any failure to invest sufficiently in strategic growth areas, could adversely affect our business, results of operations and financial condition.
The process of developing new high-technology products, software, services and solutions and enhancing existing hardware and software products, services and solutions is complex, costly and uncertain, and any failure by us to anticipate customers' changing needs and emerging technological trends accurately could significantly harm our market share, results of operations and financial condition. For example, as the transition to an environment characterized by cloud-based computing and software being delivered as a service progresses, we must continue to successfully develop and deploy cloud-based solutions for our customers. We must make long-term investments, develop or obtain and protect appropriate intellectual property, and commit significant research and development and other resources before knowing whether our predictions will accurately reflect customer demand for our products, services and solutions. Any failure to accurately predict technological and business trends, control research and development costs or execute our innovation strategy could harm our business and financial performance. Our research and development initiatives may not be successful in whole or in part, including research and development projects which we have prioritized with respect to funding and/or personnel.
After we develop a product, we must be able to manufacture appropriate volumes quickly while also managing costs and preserving margins. To accomplish this, we must accurately forecast volumes, mixes of products and configurations that meet customer requirements, and we may not succeed at doing so within a given product's life cycle or at all. Any delay in the development, production or marketing of a new product, service or solution could result in us not being among the first to market, which could further harm our competitive position.
We operate in an intensely competitive industry and competitive pressures could harm our business and financial performance.
We encounter aggressive competition from numerous and varied competitors in all areas of our business, and our competitors have targeted and are expected to continue targeting our key market segments. We compete primarily on the basis of our technology, innovation, performance, price, quality, reliability, brand, reputation, distribution, product range and ease of use, account relationships, customer training, service and support, and security of our offerings. If our products, services, support and cost structure do not enable us to compete successfully based on any of those criteria, our results of operations and business prospects could be harmed.
We have a large portfolio of products and services and must allocate our financial, personnel and other resources across all of our products and services while competing with companies that have smaller portfolios or specialize in one or more of our product or service lines. As a result, we may invest less in certain areas of our business than our competitors do, and our competitors may have greater financial, technical and marketing resources available to them compared to the resources allocated to our products and services that compete against their products and services. Industry consolidation may also affect competition by creating larger, more homogeneous and potentially stronger competitors in the markets in which we operate. Additionally, our competitors may affect our business by entering into exclusive arrangements with our existing or potential customers or suppliers.
Companies with whom we have alliances in certain areas may be or become our competitors in other areas. In addition, companies with whom we have alliances also may acquire or form alliances with our competitors, which could reduce their business with us. If we are unable to effectively manage these complicated relationships with alliance partners, our business and results of operations could be adversely affected.
We face aggressive price competition and may have to continue lowering the prices of many of our products and services to stay competitive, while simultaneously seeking to maintain or improve our revenue and gross margin. In addition, competitors who have a greater presence in some of the lower-cost markets in which we compete, or who can obtain better pricing, more favorable contractual terms and conditions or more favorable allocations of products and components during periods of limited supply may be able to offer lower prices than we are able to offer. Our cash flows, results of operations and financial condition may be adversely affected by these and other industry-wide pricing pressures.
Because our business model is based on providing innovative and high-quality products, we may spend a proportionately greater amount of our revenues on research and development than some of our competitors. If we cannot proportionately decrease our cost structure (apart from research and development expenses) on a timely basis in response to competitive price pressures, our gross margin and, therefore, our profitability could be adversely affected. In addition, if our pricing and other facets of our offerings are not sufficiently competitive, or if there is an adverse reaction to our product decisions, we may lose market share in certain areas, which could adversely affect our financial performance and business prospects.
Even if we are able to maintain or increase market share for a particular product, its financial performance could decline because the product is in a maturing industry or market segment or contains technology that is becoming obsolete. For example, our Storage business unit is experiencing the effects of a market transition towards converged products and solutions, which has led to a decline in demand for our traditional storage products. Financial performance could decline due to increased competition from other types of products. For example, the development of cloud-based solutions has reduced demand for some of our existing hardware products.
Showing the first 8K of 86K characters. Open the full section
Item 1B. Unresolved Staff Comments.
None.
Item 2. Properties.
As of October 31, 2019, we owned or leased approximately 17 million square feet of space worldwide. A summary of the Company's operationally utilized space is provided below.
| As of October 31, 2019 | ||||||||
| Owned | Leased | Total | ||||||
| (Square feet in millions) | ||||||||
| Administration and support | 4 | 7 | 11 | |||||
| (Percentage) | 38 | % | 62 | % | 100 | % | ||
| Core data centers, manufacturing plants, research and development facilities, and warehouse operations | 1 | 1 | 2 | |||||
| (Percentage) | 48 | % | 52 | % | 100 | % | ||
| Total | 5 | 8 | 13 | |||||
| (Percentage) | 40 | % | 60 | % | 100 | % |
We believe that our existing properties are in good condition and are suitable for the conduct of our business. Substantially all of our properties are utilized in whole or in part by our Hybrid IT and Intelligent Edge segments.
In connection with the HPE Next initiative, we continue to anticipate changes in our real estate portfolio over the next year. These changes may include reductions in overall space, and an increase in leased space as a percentage of total space.
Principal Executive Offices
Our principal executive offices, including our global headquarters, are located at 6280 America Center Drive, San Jose, California, 95002, United States of America ("U.S.").
Product Development, Services and Manufacturing
The locations of our major product development, services, manufacturing, and Hewlett Packard Labs facilities are as follows:
| Americas Puerto Rico—Aguadilla United States—Alpharetta, Andover, Austin, Carrollton, Chippewa Falls, Colorado Springs, Fremont, Fort Collins, Houston, Milpitas, Palo Alto, Roseville, San Jose, Santa Clara, Sunnyvale | Europe, Middle East, Africa United Kingdom—Bristol, Erskine | |
| Asia Pacific China—Beijing, Shanghai India—Bangalore Japan—Tokyo *Singapore—*Singapore *Taiwan—*Taipei |
Item 3. Legal Proceedings.
Information with respect to this item may be found in Note 18, "Litigation and Contingencies", to the Consolidated Financial Statements in Item 8 of Part II, which is incorporated herein by reference.
Item 4. Mine Safety Disclosures.
Not applicable.
PART II
Item 5. Market for Registrant's Common Equity, Related Stockholder Matters and Issuer Purchases of Equity Securities.
The common stock of Hewlett Packard Enterprise is listed on the New York Stock Exchange ("NYSE") with the ticker symbol "HPE". There were 56,291 stockholders of record of Hewlett Packard Enterprise common stock as of November 29, 2019. The high and low common stock sales prices per share for fiscal 2019 and 2018 were as follows:
| Market Price Per Share | ||||||||||||||||
| 2019 | 2018 | |||||||||||||||
| Fiscal Quarter | High | Low | High | Low | ||||||||||||
| First quarter | $ | 16.52 | $ | 12.09 | $ | 17.07 | $ | 12.82 | ||||||||
| Second quarter | $ | 16.97 | $ | 15.05 | $ | 19.48 | $ | 14.66 | ||||||||
| Third quarter | $ | 16.07 | $ | 13.55 | $ | 17.82 | $ | 14.46 | ||||||||
| Fourth quarter | $ | 16.55 | $ | 12.52 | $ | 17.59 | $ | 14.36 |
Dividends declared and paid per share by fiscal quarter in 2019 were as follows:
| 2019 | ||||||||||||||||
| Q1 | Q2 | Q3 | Q4 | |||||||||||||
| Dividends declared | $ | 0.1125 | $ | 0.1125 | $ | 0.1125 | $ | 0.1200 | ||||||||
| Dividends paid | $ | 0.1125 | $ | 0.1125 | $ | 0.1125 | $ | 0.1125 |
Dividends declared and paid per share by fiscal quarter in 2018 were as follows:
| 2018 | ||||||||||||||||
| Q1 | Q2 | Q3 | Q4 | |||||||||||||
| Dividends declared | $ | 0.1500 | $ | 0.1125 | $ | 0.1125 | $ | 0.1125 | ||||||||
| Dividends paid | $ | 0.0750 | $ | 0.0750 | $ | 0.1125 | $ | 0.1125 |
On October 23, 2019, the Company announced an increase to the regular quarterly dividend from $0.1125 per share to $0.1200 per share, which was effective in the fourth quarter of fiscal 2019. The payment of any dividends in the future, and the timing and amount thereof, is within the discretion of our Board of Directors. Our Board of Directors' decisions regarding the payment of dividends will depend on many factors, such as our financial condition, earnings, capital requirements, debt service obligations, restrictive covenants in our debt, industry practice, legal requirements, regulatory constraints, and other factors that our Board of Directors deems relevant. Our ability to pay dividends will depend on our ongoing ability to generate cash from operations and on our access to the capital markets. We cannot guarantee that we will continue to pay a dividend in any future period.
Issuer Purchases of Equity Securities
| Fourth Quarter of Fiscal 2019 | Total Number of Shares Purchased | Average Price Paid per Share | Total Number of Shares Purchased as Part of Publicly Announced Plans or Programs | Approximate Dollar Value of Shares that May Yet Be Purchased under the Plans or Programs | ||||||||||
| In thousands, except per share amounts | ||||||||||||||
| Month 1 (August 2019) | 7,601 | $ | 13.38 | 7,601 | $ | 2,647,056 | ||||||||
| Month 2 (September 2019) | 5,805 | $ | 14.57 | 5,805 | $ | 2,562,469 | ||||||||
| Month 3 (October 2019) | 6,448 | $ | 15.09 | 6,448 | $ | 2,465,162 | ||||||||
| Total | 19,854 | $ | 14.28 | 19,854 |
During the fiscal year ended October 31, 2019, the Company repurchased and settled 150 million shares of the Company's common stock, which included 2.4 million shares that were unsettled open market purchases as of October 31, 2018. Additionally, the Company had unsettled open market repurchases of 0.5 million shares as of October 31, 2019. Shares repurchased during fiscal 2019 were recorded as a $2.2 billion reduction to stockholders' equity. As of October 31, 2019, the Company had a remaining authorization of $2.5 billion for future share repurchases.
On October 13, 2015, the Company's Board of Directors approved a share repurchase program with a $3.0 billion authorization, which was refreshed with additional share repurchase authorizations of $3.0 billion, $5.0 billion and $2.5 billion on May 24, 2016, October 16, 2017 and February 21, 2018, respectively. The Company may choose to repurchase shares when sufficient liquidity exists and the shares are trading at a discount relative to estimated intrinsic value. This program, which does not have a specific expiration date, authorizes repurchases in the open market or in private transactions. Share repurchases settled in the fourth quarter of fiscal 2019 were open market repurchases.
Stock Performance Graph and Cumulative Total Return
The graph below shows the cumulative total stockholder return, the S&P 500 Index and the S&P Information Technology Index. This graph covers the period from November 2, 2015 (the first day HPE's common stock began trading "regular-way" on the NYSE) through October 31, 2019. This graph assumes the investment of $100 in the stock or the index on November 2, 2015 (and the reinvestment of dividends thereafter). On April 1, 2017, we completed the separation and merger of our Enterprise Services business with Computer Sciences Corporation (“CSC”) (collectively, the “Everett Transaction”). HPE stockholders received 0.085904 shares of common stock in the new company for every one share of HPE common stock held at the close of business on the record date. On September 1, 2017, we completed the separation and merger of our Software business segment with Micro Focus International plc (“Micro Focus”) (collectively, the “Seattle Transaction”). HPE stockholders received 0.13732611 American Depository Shares (“Micro Focus ADSs”) in the new company, each of which represents one ordinary share of Micro Focus, for every one share of HPE common stock held at the close of business on the record date. The effect of the Everett and Seattle Transactions are reflected in the cumulative total return as reinvested dividends. The comparisons in the graph below are based on historical data and are not indicative of, or intended to forecast, future performance of our common stock.
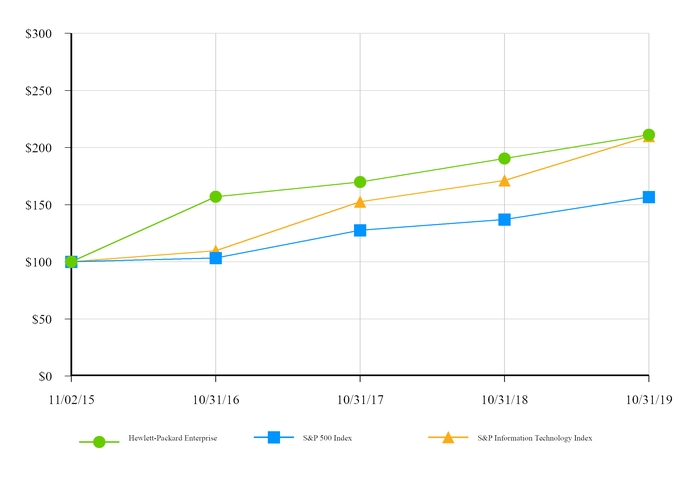
| 11/2015 | 10/2016 | 10/2017 | 10/2018 | 10/2019 | |||||||||||||||
| Hewlett Packard Enterprise | $ | 100.00 | $ | 157.00 | $ | 169.80 | $ | 190.36 | $ | 211.12 | |||||||||
| S&P 500 Index | $ | 100.00 | $ | 103.27 | $ | 127.67 | $ | 137.04 | $ | 156.66 | |||||||||
| S&P Information Technology Index | $ | 100.00 | $ | 109.74 | $ | 152.49 | $ | 171.25 | $ | 209.93 |
Item 6. Selected Financial Data.
The following table presents selected consolidated and combined financial data, which should be read in conjunction with our Consolidated Financial Statements and accompanying notes and "Management's Discussion and Analysis of Financial Condition and Results of Operations" included elsewhere in this Form 10-K. The Statement of Earnings data for each of the three fiscal years ended October 31, 2019, 2018 and 2017, and the Balance Sheets data as of October 31, 2019 and 2018 set forth below are derived from our audited Consolidated Financial Statements included elsewhere in this Form 10-K. The Statement of Earnings data for fiscal years ended October 31, 2016 and 2015, and the Balance Sheets data as of October 31, 2017, 2016 and 2015 are derived from our audited Consolidated and Combined Financial Statements that are not included in this Form 10-K.
With the completion of the Everett and Seattle Transactions on April 1, 2017 and September 1, 2017, respectively, the Company has reclassified the historical financial results of the former Enterprise Services segment ("former ES segment") and the former Software segment to Net loss from discontinued operations in its Consolidated Statements of Earnings,.
Prior to October 31, 2015, the Combined and Consolidated Statements of Earnings for the Company reflect allocations of general corporate expenses from HP Co. including, but not limited to, executive management, finance, legal, information technology, employee benefits administration, treasury, risk management, procurement, and other shared services. These allocations were made on a direct usage basis when identifiable, with the remainder allocated on the basis of revenue, expenses, headcount, or other relevant measures. Management of the Company and HP Co. consider these allocations to be a reasonable reflection of the utilization of services by, or the benefits provided to, the Company. The allocations may not, however, reflect the expense the Company would have incurred as a standalone company for the periods presented. Actual costs that may have been incurred if the Company had been a standalone company would depend on a number of factors, including the chosen organizational structure, what functions were outsourced or performed by employees and strategic decisions made in areas such as information technology and infrastructure.
The information set forth below is not necessarily indicative of future results of operations and should be read in conjunction with Item 7, "Management's Discussion and Analysis of Financial Condition and Results of Operations," and the Consolidated Financial Statements and notes thereto included in Item 8, "Financial Statements and Supplementary Data," of this Annual Report on Form 10-K, which are incorporated herein by reference, in order to understand further the factors that may affect the comparability of the financial data presented below.
HEWLETT PACKARD ENTERPRISE COMPANY AND SUBSIDIARIES
Selected Financial Data
| For the fiscal years ended October 31, | |||||||||||||||||||
| 2019 | 2018 | 2017 | 2016 | 2015 | |||||||||||||||
| In millions, except per share amounts | |||||||||||||||||||
| Statements of Earnings: | |||||||||||||||||||
| Net revenue | $ | 29,135 | $ | 30,852 | $ | 28,871 | $ | 30,280 | $ | 31,077 | |||||||||
| Earnings from continuing operations(1) | $ | 1,274 | $ | 1,737 | $ | 564 | $ | 3,741 | $ | 1,903 | |||||||||
| Net earnings from continuing operations | $ | 1,049 | $ | 2,012 | $ | 436 | $ | 3,237 | $ | 2,640 | |||||||||
| Net loss from discontinued operations | — | (104 | ) | (92 | ) | (76 | ) | (179 | ) | ||||||||||
| Net earnings | $ | 1,049 | $ | 1,908 | $ | 344 | $ | 3,161 | $ | 2,461 | |||||||||
| Net earnings (loss) per share | |||||||||||||||||||
| Basic | |||||||||||||||||||
| Continuing operations | $ | 0.78 | $ | 1.32 | $ | 0.26 | $ | 1.89 | $ | 1.46 | |||||||||
| Discontinued operations | — | (0.07 | ) | (0.05 | ) | (0.05 | ) | (0.10 | ) | ||||||||||
| Total basic net earnings per share | $ | 0.78 | $ | 1.25 | $ | 0.21 | $ | 1.84 | $ | 1.36 | |||||||||
| Diluted | |||||||||||||||||||
| Continuing operations | $ | 0.77 | $ | 1.30 | $ | 0.26 | $ | 1.86 | $ | 1.44 | |||||||||
| Discontinued operations | — | (0.07 | ) | (0.05 | ) | (0.04 | ) | (0.10 | ) | ||||||||||
| Total diluted net earnings per share | $ | 0.77 | $ | 1.23 | $ | 0.21 | $ | 1.82 | $ | 1.34 | |||||||||
| Cash dividends declared per share | $ | 0.4575 | $ | 0.4875 | $ | 0.2600 | $ | 0.2200 | $ | — | |||||||||
| Basic shares outstanding | 1,353 | 1,529 | 1,646 | 1,715 | 1,804 | ||||||||||||||
| Diluted shares outstanding | 1,366 | 1,553 | 1,674 | 1,739 | 1,834 | ||||||||||||||
| Balance Sheets: | |||||||||||||||||||
| At year-end: | |||||||||||||||||||
| Total assets | $ | 51,803 | $ | 55,493 | $ | 61,406 | $ | 79,629 | $ | 79,862 | |||||||||
| Long-term debt | $ | 9,395 | $ | 10,136 | $ | 10,182 | $ | 12,168 | $ | 14,679 | |||||||||
| Total debt | $ | 13,820 | $ | 12,141 | $ | 14,032 | $ | 15,693 | $ | 15,353 |
| (1) | Effective at the beginning of the first quarter of fiscal 2019, in connection with the adoption of the accounting standards update for retirement benefits (Topic 715), the Company reclassified its non-service net periodic benefit credit from operating expense to other income and expense in its Consolidated Statements of Earnings. The Company reflected these changes retrospectively, by transferring the non-service net periodic benefit credit, a portion of which was previously allocated to the segments, and the remainder of which was reported within Unallocated corporate costs and eliminations, Restructuring charges, Transformation costs, Separation costs and Defined benefit plan remeasurement benefit. |
Item 7. Management's Discussion and Analysis of Financial Condition and Results of Operations.
HEWLETT PACKARD ENTERPRISE COMPANY AND SUBSIDIARIES
Management's Discussion and Analysis of
Financial Condition and Results of Operations
This Management's Discussion and Analysis of Financial Condition and Results of Operations ("MD&A") is organized as follows:
| • | Overview. A discussion of our business and overall analysis of financial and other highlights affecting the Company to provide context for the remainder of MD&A. The overview analysis compares fiscal 2019 to fiscal 2018. |
| • | Critical Accounting Policies and Estimates. A discussion of accounting policies and estimates that we believe are important to understanding the assumptions and judgments incorporated in our reported financial results. |
| • | Results of Operations. An analysis of our financial results comparing fiscal 2019 and fiscal 2018 to the prior-year periods. A discussion of the results of operations at the consolidated level is followed by a discussion of the results of operations at the segment level. |
| • | Liquidity and Capital Resources. An analysis of changes in our cash flows and a discussion of our financial condition and liquidity. |
| • | Contractual and Other Obligations. An overview of contractual obligations, retirement and post-retirement benefit plan funding, restructuring plans, uncertain tax positions, off-balance sheet arrangements, cross-indemnifications with HP Inc. (formerly known as "Hewlett-Packard Company" and also referred to in this Annual Report as "former Parent"), and cross-indemnifications with DXC Technology Company ("DXC") and Micro Focus International plc (“Micro Focus”). |
We intend the discussion of our financial condition and results of operations that follows to provide information that will assist the reader in understanding our Consolidated Financial Statements, the changes in certain key items in those financial statements from year to year, and the primary factors that accounted for those changes, as well as how certain accounting principles, policies and estimates affect our Consolidated Financial Statements. This discussion should be read in conjunction with our Consolidated Financial Statements and the related notes that appear elsewhere in this document.
Former Parent Separation Transaction
On November 1, 2015, the Company became an independent publicly-traded company through a pro rata distribution by HP Inc. ("former Parent" or "HPI"), formerly known as Hewlett-Packard Company ("HP Co."), of 100% of the outstanding shares of Hewlett Packard Enterprise Company to HP Inc.'s stockholders (collectively, the "Separation"). Each HP Inc. stockholder of record received one share of Hewlett Packard Enterprise common stock for each share of HP Inc. common stock held on the record date. Following the Separation, the Company became an independent publicly-traded company.
Discontinued Operations
On April 1, 2017, HPE completed the separation and merger of its Enterprise Services business with Computer Sciences Corporation (“CSC”) (collectively, the “Everett Transaction”). HPE transferred its Enterprise Services business to Everett SpinCo, Inc. (a wholly-owned subsidiary of HPE) ("Everett") and distributed all of the shares of Everett to HPE stockholders. Following the distribution, New Everett Merger Sub Inc., a wholly-owned subsidiary of Everett, merged with and into CSC and Everett changed its name to DXC Technology Company ("DXC").
On September 1, 2017, HPE completed the separation and merger of its Software business segment with Micro Focus International plc (“Micro Focus”) (collectively, the “Seattle Transaction”). HPE transferred its Software business segment to Seattle SpinCo, Inc. (a wholly-owned subsidiary of HPE) ("Seattle"), and distributed all of the shares of Seattle to HPE stockholders. Following the share distribution, Seattle MergerSub, Inc., an indirect, wholly-owned subsidiary of Micro Focus, merged with and into Seattle.
The following Overview, Results of Operations and Liquidity discussions and analysis compare fiscal 2019 to fiscal 2018 and fiscal 2018 to fiscal 2017, unless otherwise noted. The Capital Resources and Contractual and Other Obligations discussions present information as of October 31, 2019, unless otherwise noted.
For purposes of this MD&A section, we use the terms "Hewlett Packard Enterprise", "HPE", "the Company", "we", "us", and "our" to refer to Hewlett Packard Enterprise Company. References in this MD&A section to "former Parent" refer to HP Inc.
HEWLETT PACKARD ENTERPRISE COMPANY AND SUBSIDIARIES
Management's Discussion and Analysis of
Financial Condition and Results of Operations (Continued)
OVERVIEW
We are a global technology leader focused on developing intelligent solutions that allow customers to capture, analyze and act upon data seamlessly from edge to cloud. We enable customers to accelerate business outcomes by driving new business models, creating new customer and employee experiences, and increasing operational efficiency today and into the future. Our legacy dates back to a partnership founded in 1939 by William R. Hewlett and David Packard, and we strive every day to uphold and enhance that legacy through our dedication to providing innovative technological solutions to our customers.
We organize our business into four segments for financial reporting purposes: Hybrid IT, Intelligent Edge, Financial Services ("FS") and Corporate Investments. The following provides an overview of our key financial metrics by segment for fiscal 2019, as compared to fiscal 2018:
| HPE Consolidated | Hybrid IT | Intelligent Edge | Financial Services | Corporate Investments | |||||||||||||||
| Dollars in millions, except for per share amounts | |||||||||||||||||||
| Net revenue(1) | $ | 29,135 | $ | 22,825 | $ | 2,837 | $ | 3,581 | $ | 507 | |||||||||
| Year-over-year change % | (5.6 | ) % | (6.8 | ) % | (2.8 | ) % | (2.5 | ) % | (6.6 | ) % | |||||||||
| Earnings (loss) from continuing operations(2) | $ | 1,274 | $ | 2,804 | $ | 95 | $ | 305 | $ | (108 | ) | ||||||||
| Earnings (loss) from continuing operations as a % of net revenue | 4.4 | % | 12.3 | % | 3.3 | % | 8.5 | % | (21.3 | ) % | |||||||||
| Year-over-year change percentage points | (1.2 | )pts | 2.1 | pts | (6.2 | )pts | 0.7 | pts | (4.5 | )pts | |||||||||
| Net earnings from continuing operations | $ | 1,049 | |||||||||||||||||
| Net earnings per share | |||||||||||||||||||
| Basic net EPS from continuing operations | $ | 0.78 | |||||||||||||||||
| Diluted net EPS from continuing operations | $ | 0.77 |
| (1) | HPE consolidated net revenue excludes intersegment net revenue. |
| (2) | Segment earnings from operations exclude certain unallocated corporate costs and eliminations, stock-based compensation expense related to corporate and certain global functions, transformation costs, amortization of intangible assets, acquisition, dispositions and other related charges, restructuring charges, separation costs, impairment of goodwill and disaster recoveries. |
Net revenue decreased by $1.7 billion, or 5.6% (decreased 4.3% on a constant currency basis), in fiscal 2019 as compared to fiscal 2018 as we conti
Showing the first 8K of 116K characters. Open the full section
Item 7A. Quantitative and Qualitative Disclosures About Market Risk.
In the normal course of business, we are exposed to foreign currency exchange rate and interest rate risks that could impact our financial position and results of operations. Our risk management strategy with respect to these market risks may include the use of derivative financial instruments. We use derivative contracts only to manage existing underlying exposures. Accordingly, we do not use derivative contracts for speculative purposes. Our risks, risk management strategy and a sensitivity analysis estimating the effects of changes in fair value for each of these exposures is outlined below.
Actual gains and losses in the future may differ materially from the sensitivity analyses based on changes in the timing and amount of foreign currency exchange rate and interest rate movements and our actual exposures and derivatives in place at the time of the change, as well as the effectiveness of the derivative to hedge the related exposure.
Foreign currency exchange rate risk
We are exposed to foreign currency exchange rate risk inherent in our sales commitments, anticipated sales, anticipated purchases, and assets and liabilities denominated in currencies other than the U.S. dollar. We transact business in over 50 currencies worldwide, of which the most significant foreign currencies to our operations for fiscal 2019 were the euro, Japanese yen, British pound, and Chinese yuan (renminbi). For most currencies, we are a net receiver of the foreign currency and therefore benefit from a weaker U.S. dollar and are adversely affected by a stronger U.S. dollar relative to the foreign currency. Even where we are a net receiver of the foreign currency, a weaker U.S. dollar may adversely affect certain expense figures, if taken alone.
We use a combination of forward contracts and, from time to time, options designated as cash flow hedges to protect against the foreign currency exchange rate risks inherent in our forecasted net revenue and, to a lesser extent, cost of sales, operating expenses, and intercompany loans denominated in currencies other than the U.S. dollar. In addition, when debt is denominated in a foreign currency, we may use swaps to exchange the foreign currency principal and interest obligations for U.S. dollar-denominated amounts to manage the exposure to changes in foreign currency exchange rates. We also use other derivatives not designated as hedging instruments, consisting primarily of forward contracts, to hedge foreign currency balance sheet exposures. Alternatively, we may choose not to hedge the risk associated with our foreign currency exposures, primarily if such exposure acts as a natural hedge for offsetting amounts denominated in the same currency or if the currency is too difficult or too expensive to hedge.
We have performed sensitivity analyses as of October 31, 2019 and 2018, using a modeling technique that measures the change in the fair values arising from a hypothetical 10% adverse movement in the levels of foreign currency exchange rates relative to the U.S. dollar, with all other variables held constant. The analyses cover all of our foreign currency derivative contracts offset by underlying exposures. The foreign currency exchange rates we used in performing the sensitivity analysis were based on market rates in effect at October 31, 2019 and 2018. The sensitivity analyses indicated that a hypothetical 10% adverse movement in foreign currency exchange rates would result in a foreign exchange fair value loss of $31 million and $36 million at October 31, 2019 and 2018, respectively.
Interest rate risk
We also are exposed to interest rate risk related to debt we have issued, our investment portfolio and financing receivables. We issue long-term debt in either U.S. dollars or foreign currencies based on market conditions at the time of financing.
We often use interest rate and/or currency swaps to modify the market risk exposures in connection with the debt to achieve U.S. dollar based floating or fixed interest expense. The swap transactions generally involve the exchange of fixed for floating interest payments. However, in circumstances where we believe additional fixed-rate debt would be beneficial, we may choose to terminate a previously executed swap, or swap certain floating interest payments to fixed.
In order to hedge the fair value of certain fixed-rate investments, we may enter into interest rate swaps that convert fixed interest returns into variable interest returns. We may use cash flow hedges to hedge the variability of LIBOR-based interest income received on certain variable-rate investments, by entering into interest rate swaps that convert variable rate interest returns into fixed-rate interest returns.
We have performed sensitivity analyses as of October 31, 2019 and 2018, using a modeling technique that measures the change in the fair values arising from a hypothetical 10% adverse movement in the levels of interest rates across the entire yield curve, with all other variables held constant. The analyses cover our debt, investments, financing receivables, and interest rate swaps. The analyses use actual or approximate maturities for the debt, investments, financing receivables, and interest rate swaps. The discount rates used were based on the market interest rates in effect at October 31, 2019 and 2018. The sensitivity analyses indicated that a hypothetical 10% adverse movement in interest rates would result in a loss in the fair values of our debt, investments and financing receivables, net of interest rate swaps, of $39 million and $29 million at October 31, 2019 and 2018, respectively.
Item 8. Financial Statements and Supplementary Data.
Table of Contents
Report of Independent Registered Public Accounting Firm
To the Board of Directors and Stockholders of Hewlett Packard Enterprise Company
Opinion on the Financial Statements
We have audited the accompanying consolidated balance sheets of Hewlett Packard Enterprise Company and subsidiaries (the Company) as of October 31, 2019 and 2018, the related consolidated statements of earnings, comprehensive income, stockholders' equity and cash flows for each of the three years in the period ended October 31, 2019, and the related notes (collectively referred to as the “consolidated financial statements”). In our opinion, the consolidated financial statements present fairly, in all material respects, the financial position of the Company at October 31, 2019 and 2018, and the results of its operations and its cash flows for each of the three years in the period ended October 31, 2019, in conformity with U.S. generally accepted accounting principles.
We also have audited, in accordance with the standards of the Public Company Accounting Oversight Board (United States) (PCAOB), the Company's internal control over financial reporting as of October 31, 2019, based on criteria established in Internal Control-Integrated Framework issued by the Committee of Sponsoring Organizations of the Treadway Commission (2013 framework) and our report dated December 12, 2019 expressed an unqualified opinion thereon.
Basis for Opinion
These financial statements are the responsibility of the Company's management. Our responsibility is to express an opinion on the Company’s financial statements based on our audits. We are a public accounting firm registered with the PCAOB and are required to be independent with respect to the Company in accordance with the U.S. federal securities laws and the applicable rules and regulations of the Securities and Exchange Commission and the PCAOB.
We conducted our audits in accordance with the standards of the PCAOB. Those standards require that we plan and perform the audit to obtain reasonable assurance about whether the financial statements are free of material misstatement, whether due to error or fraud. Our audits included performing procedures to assess the risks of material misstatement of the financial statements, whether due to error or fraud, and performing procedures that respond to those risks. Such procedures included examining, on a test basis, evidence regarding the amounts and disclosures in the financial statements. Our audits also included evaluating the accounting principles used and significant estimates made by management, as well as evaluating the overall presentation of the financial statements. We believe that our audits provide a reasonable basis for our opinion.
Critical Audit Matters
The critical audit matters communicated below are matters arising from the current period audit of the financial statements that were communicated or required to be communicated to the audit committee and that: (1) relate to accounts or disclosures that are material to the financial statements and (2) involved our especially challenging, subjective or complex judgments. The communication of critical audit matters does not alter in any way our opinion on the consolidated financial statements, taken as a whole, and we are not, by communicating the critical audit matters below, providing separate opinions on the critical audit matters or on the accounts or disclosures to which they relate.
| Deferred Tax Asset Valuation Allowance | ||
| Description of the matter | At October 31, 2019, the Company had gross deferred assets relating to deductible temporary differences and loss and credit carryforwards of $10.0 billion with an offsetting valuation allowance of $8.2 billion. As discussed in Note 8, the Company reduces its deferred tax assets by a valuation allowance if, based upon the weight of all available evidence, it is more likely than not that some portion, or all, of the deferred tax assets will not be realized. Auditing management's analysis of the realizability of the deferred tax assets was complex and highly judgmental because the assessment process involves significant judgment and subjective evaluation of |
Showing the first 8K of 341K characters. Open the full section
Item 9. Changes in and Disagreements with Accountants on Accounting and Financial Disclosure.
None.
Item 9A. Controls and Procedures.
Evaluation of Disclosure Controls and Procedures
Under the supervision and with the participation of our management, including our principal executive officer and principal financial officer, we conducted an evaluation of the effectiveness of the design and operation of our disclosure controls and procedures, as defined in Rules 13a-15(e) and 15d-15(e) under the Exchange Act as of the end of the period covered by this report (the "Evaluation Date"). Based on this evaluation, our principal executive officer and principal financial officer concluded as of the Evaluation Date that our disclosure controls and procedures were effective such that the information relating to Hewlett Packard Enterprise, including our consolidated subsidiaries, required to be disclosed in our SEC reports (i) is recorded, processed, summarized and reported within the time periods specified in SEC rules and forms, and (ii) is accumulated and communicated to Hewlett Packard Enterprise's management, including our principal executive officer and principal financial officer, as appropriate to allow timely decisions regarding required disclosure.
Management's Report on Internal Control Over Financial Reporting
See Management’s Report of Internal Control Over Financial Reporting and the Report of Independent Registered Public Accounting Firm on our internal control over financial reporting in Item 8, which are incorporated herein by reference.
Changes in Internal Control Over Financial Reporting
Under the supervision and with the participation of our management, including our principal executive officer and principal financial officer, we conducted an evaluation of any changes in our internal control over financial reporting (as such term is defined in Rules 13a-15(f) and 15d-15(f) under the Exchange Act) that occurred during our most recently completed fiscal quarter. Based on that evaluation, our principal executive officer and principal financial officer concluded that there has not been any change in our internal control over financial reporting during that quarter that has materially affected, or is reasonably likely to materially affect, our internal control over financial reporting.
Item 9B. Other Information.
None.
PART III
Item 10. Directors, Executive Officers and Corporate Governance.
The names of the executive officers of Hewlett Packard Enterprise and their ages, titles and biographies as of the date hereof are incorporated by reference from Part I, Item 1, above.
The following information is included in Hewlett Packard Enterprise's Proxy Statement related to its 2020 Annual Meeting of Stockholders to be filed within 120 days after Hewlett Packard Enterprise's fiscal year end of October 31, 2019 (the "Proxy Statement") and is incorporated herein by reference:
| • | Information regarding directors of Hewlett Packard Enterprise including those who are standing for reelection and any persons nominated to become directors of Hewlett Packard Enterprise is set forth under "Corporate Governance—Board Leadership Structure" and/or "Proposals to be Voted On—Proposal No. 1—Election of Directors". |
| • | Information regarding Hewlett Packard Enterprise's Audit Committee and designated "audit committee financial experts" is set forth under "Board Structure and Committee Composition—Audit Committee". |
| • | Information on Hewlett Packard Enterprise's code of business conduct and ethics for directors, officers and employees, also known as the "Standards of Business Conduct," and on Hewlett Packard Enterprise's Corporate Governance Guidelines is set forth under "Corporate Governance Principles and Board Matters". |
Item 11. Executive Compensation.
The following information is included in the Proxy Statement and is incorporated herein by reference:
| • | Information regarding Hewlett Packard Enterprise's compensation of its named executive officers is set forth under "Executive Compensation". |
| • | Information regarding Hewlett Packard Enterprise's compensation of its directors is set forth under "Director Compensation and Stock Ownership Guidelines". |
| • | The report of Hewlett Packard Enterprise's HR and Compensation Committee is set forth under "HR and Compensation Committee Report on Executive Compensation". |
Item 12. Security Ownership of Certain Beneficial Owners and Management and Related Stockholder Matters.
The following information is included in the Proxy Statement and is incorporated herein by reference:
| • | Information regarding security ownership of certain beneficial owners, directors and executive officers is set forth under "Common Stock Ownership of Certain Beneficial Owners and Management". |
| • | Information regarding Hewlett Packard Enterprise's equity compensation plans, including both stockholder approved plans and non-stockholder approved plans, is set forth in the section entitled "Equity Compensation Plan Information". |
Item 13. Certain Relationships and Related Transactions, and Director Independence.
The following information is included in the Proxy Statement and is incorporated herein by reference:
| • | Information regarding transactions with related persons is set forth under "Transactions with Related Persons". |
| • | Information regarding director independence is set forth under "Corporate Governance Principles and Board Matters—Director Independence". |
Item 14. Principal Accounting Fees and Services.
Information regarding principal accounting fees and services is set forth under "Principal Accounting Fees and Services" in the Proxy Statement, which information is incorporated herein by reference.
PART IV
Item 15. Exhibits, Financial Statement Schedules.
| (a) | The following documents are filed as part of this report: |
- All Financial Statements:
The following financial statements are filed as part of this report under Item 8—"Financial Statements and Supplementary Data."
- Financial Statement Schedules:
All schedules are omitted as the required information is not applicable or the information is presented in the Consolidated Financial Statements and notes thereto in Item 8 above.
- Exhibits:
A list of exhibits filed or furnished with this Annual Report on Form 10-K (or incorporated by reference to exhibits previously filed or furnished by Hewlett Packard Enterprise) is provided in the accompanying Exhibit Index. Hewlett Packard Enterprise will furnish copies of exhibits for a reasonable fee (covering the expense of furnishing copies) upon request. Stockholders may request exhibits copies by contacting:
Hewlett Packard Enterprise Company
Attn: Investor Relations
6280 America Center Drive
San Jose, CA 95002
HEWLETT PACKARD ENTERPRISE COMPANY AND SUBSIDIARIES
EXHIBIT INDEX
HEWLETT PACKARD ENTERPRISE COMPANY AND SUBSIDIARIES
HEWLETT PACKARD ENTERPRISE COMPANY AND SUBSIDIARIES
HEWLETT PACKARD ENTERPRISE COMPANY AND SUBSIDIARIES
HEWLETT PACKARD ENTERPRISE COMPANY AND SUBSIDIARIES
- Indicates management contract or compensation plan, contract or arrangement
‡ Filed herewith
† Furnished herewith
The registrant agrees to furnish to the Commission supplementally upon request a copy of (1) any instrument with respect to long-term debt not filed herewith as to which the total amount of securities authorized thereunder does not exceed 10% of the total assets of the registrant and its subsidiaries on a consolidated basis and (ii) schedules or exhibits omitted pursuant to Item 601(b)(2) of Regulation S-K of any material plan of acquisition, disposition or reorganization set forth above.
SIGNATURES
Pursuant to the requirements of Section 13 or 15(d) of the Securities Exchange Act of 1934, the registrant has duly caused this report to be signed on its behalf by the undersigned, thereunto duly authorized.
| Date: | December 12, 2019 | HEWLETT PACKARD ENTERPRISE COMPANY | ||
| By: | /s/ Tarek A. Robbiati | |||
| Tarek A. Robbiati Executive Vice President and Chief Financial Officer |
POWER OF ATTORNEY
KNOW ALL PERSONS BY THESE PRESENTS, that each person whose signature appears below constitutes and appoints Tarek A. Robbiati, John F. Schultz and Rishi Varma, or any of them, his or her attorneys-in-fact, for such person in any and all capacities, to sign any amendments to this report and to file the same, with exhibits thereto, and other documents in connection therewith, with the Securities and Exchange Commission, hereby ratifying and confirming all that either of said attorneys-in-fact, or substitute or substitutes, may do or cause to be done by virtue hereof.
Pursuant to the requirements of the Securities Exchange Act of 1934, this report has been signed below by the following persons on behalf of the registrant and in the capacities and on the dates indicated
| Signature | Title(s) | Date | ||
| /s/ Antonio F. Neri | President and Chief Executive Officer (Principal Executive Officer) | December 12, 2019 | ||
| Antonio F. Neri | ||||
| /s/ Tarek A. Robbiati | Executive Vice President and Chief Financial Officer (Principal Financial Officer) | December 12, 2019 | ||
| Tarek A. Robbiati | ||||
| /s/ Jeff T. Ricci | Senior Vice President and Controller (Principal Accounting Officer) | December 12, 2019 | ||
| Jeff T. Ricci | ||||
| /s/ Patricia F. Russo | Chairman | December 12, 2019 | ||
| Patricia F. Russo | ||||
| /s/ Daniel L. Ammann | Director | December 12, 2019 | ||
| Daniel L. Ammann | ||||
| /s/ Michael J. Angelakis | Director | December 12, 2019 | ||
| Michael J. Angelakis | ||||
| /s/ Pamela L. Carter | Director | December 12, 2019 | ||
| Pamela L. Carter | ||||
| /s/ Jean M. Hobby | Director | December 12, 2019 | ||
| Jean M. Hobby | ||||
| /s/ George R. Kurtz | Director | December 12, 2019 | ||
| George R. Kurtz | ||||
| /s/ Raymond J. Lane | Director | December 12, 2019 | ||
| Raymond J. Lane | ||||
| /s/ Ann M. Livermore | Director | December 12, 2019 | ||
| Ann M. Livermore | ||||
| /s/ Raymond E. Ozzie | Director | December 12, 2019 | ||
| Raymond E. Ozzie | ||||
| /s/ Gary M. Reiner | Director | December 12, 2019 | ||
| Gary M. Reiner | ||||
| /s/ Lip-Bu Tan | Director | December 12, 2019 | ||
| Lip-Bu Tan | ||||
| /s/ Mary Agnes Wilderotter | Director | December 12, 2019 | ||
| Mary Agnes Wilderotter |