 filings.tools
Item 5. MARKET FOR REGISTRANT’S COMMON EQUITY, RELATED STOCKHOLDER MATTERS AND ISSUER PURCHASES OF EQUITY SECURITIES
2K characters. Original on sec.gov · Markdown
Item 5. MARKET FOR REGISTRANT’S COMMON EQUITY, RELATED STOCKHOLDER MATTERS AND ISSUER PURCHASES OF EQUITY SECURITIES
Market information
Hormel Foods Corporation’s common stock is traded on the New York Stock Exchange under the symbol HRL. The CUSIP number is 440452100.
Holders
There are approximately 12,600 record stockholders and 126,900 stockholders whose shares are held in street name by brokerage firms and financial institutions.
Issuer purchases of equity securities in the fourth quarter of fiscal 2018 are shown below:
| Period | Total Number of Shares Purchased | Average Price Paid Per Share | Total Number of Shares Purchased as Part of Publicly Announced Plans or Programs(1) | Maximum Number of Shares that May Yet Be Purchased Under the Plans or Programs (1) | ||||
| July 30, 2018 – September 2, 2018 | - | - | - | 9,121,823 | ||||
| September 3, 2018 – September 30, 2018 | - | - | - | 9,121,823 | ||||
| October 1, 2018 – October 28, 2018 | 54,667 | $39.45 | 54,667 | 9,067,156 | ||||
| Total | 54,667 | $39.45 | 54,667 |
(1) On January 31, 2013, the Company announced its Board of Directors had authorized the repurchase of 10,000,000 shares of its common stock with no expiration date. The repurchase program was authorized at a meeting of the Company’s Board of Directors on January 29, 2013. On November 23, 2015, the Board of Directors authorized a two-for-one split of the Company’s common stock. As part of the resolution to approve that stock split, the number of shares remaining to be repurchased was adjusted proportionately. The stock split was subsequently approved by stockholders at the Company’s Annual Meeting on January 26, 2016, and effected January 27, 2016. All numbers in the table above reflect the impact of this stock split.
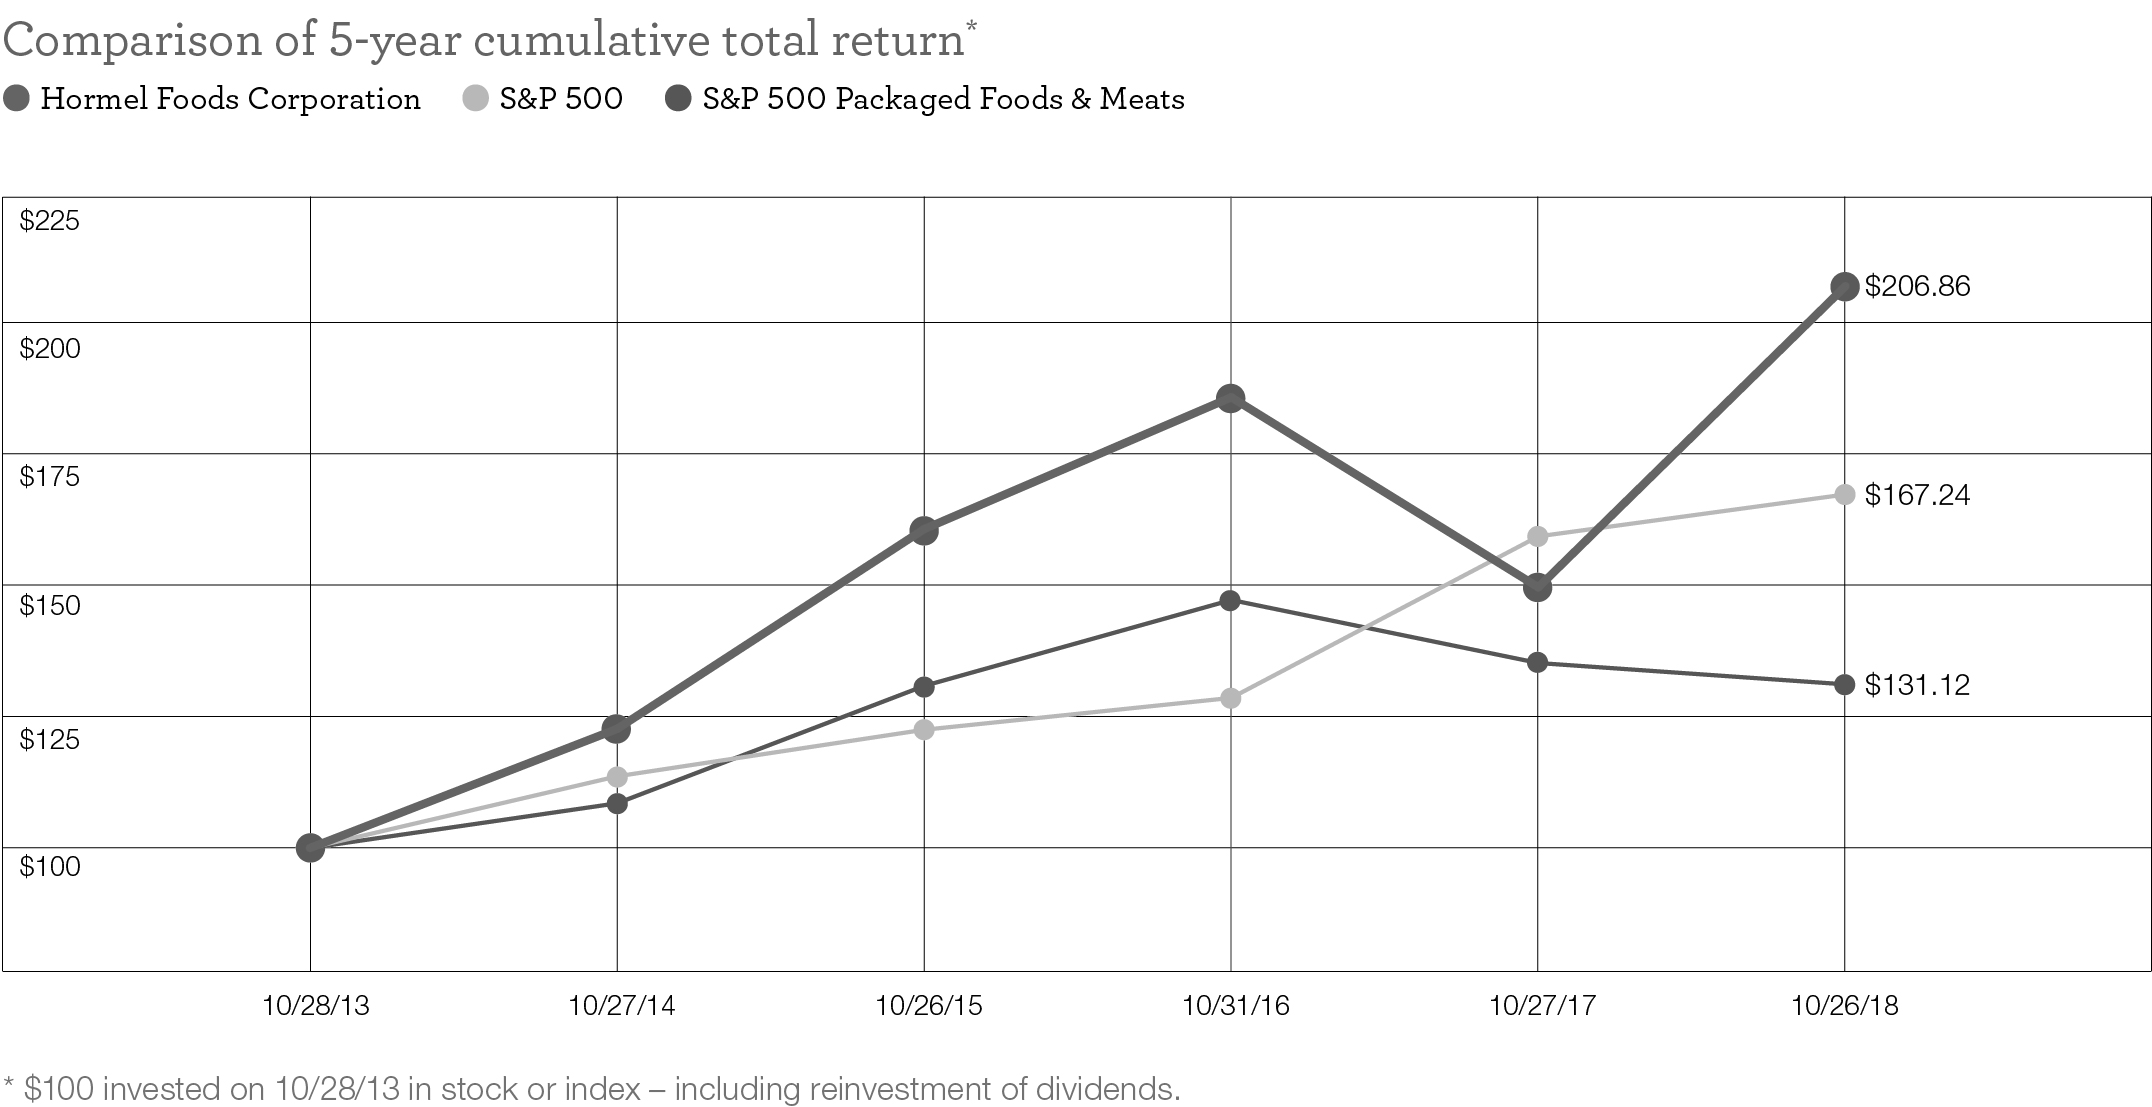
Shareholder return performance graph
The following graph shows a comparison of cumulative total shareholder return, calculated on a dividend-reinvested basis, for the Company, the S&P 500 Index, and the S&P 500 Packaged Foods & Meats Index for the five years ended October 26, 2018. The graph assumes $100 was invested in each, as of the market close on October 28, 2013. Note that historic stock price performance is not necessarily indicative of future stock price performance.
Previous: Item 4. MINE SAFETY DISCLOSURES · Next: Item 6. SELECTED FINANCIAL DATA