 filings.tools
Hershey 10-K 2022-12-31
Filed 2023-02-17. 23 sections, 502K characters. Original on sec.gov · Markdown · JSON
Cover and table of contents
UNITED STATES
SECURITIES AND EXCHANGE COMMISSION
WASHINGTON, D.C. 20549
FORM 10-K
| ☒ | ANNUAL REPORT PURSUANT TO SECTION 13 OR 15(d) OF THE SECURITIES EXCHANGE ACT OF 1934 |
For the fiscal year ended December 31, 2022
OR
| ☐ | TRANSITION REPORT PURSUANT TO SECTION 13 OR 15(d) OF THE SECURITIES EXCHANGE ACT OF 1934 |
For the transition period from to_
Commission file number 1-183

THE HERSHEY COMPANY
(Exact name of registrant as specified in its charter)
| Delaware | 23-0691590 | |||||||
| (State or other jurisdiction of incorporation or organization) | (I.R.S. Employer Identification No.) |
19 East Chocolate Avenue, Hershey, PA 17033
(Address of principal executive offices and Zip Code)
(717) 534-4200
(Registrant’s telephone number, including area code)
Securities registered pursuant to Section 12(b) of the Act:
| Title of each class | Trading Symbol(s) | Name of each exchange on which registered | ||||||||||||
| Common Stock, one dollar par value | HSY | New York Stock Exchange |
Securities registered pursuant to Section 12(g) of the Act: Class B Common Stock, one dollar par value
Indicate by check mark if the registrant is a well-known seasoned issuer, as defined in Rule 405 of the Securities Act. Yes ☒ No ☐
Indicate by check mark if the registrant is not required to file reports pursuant to Section 13 or Section 15(d) of the Act. Yes ☐ No ☒
Indicate by check mark whether the registrant (1) has filed all reports required to be filed by Section 13 or 15(d) of the Securities Exchange Act of 1934 during the preceding 12 months (or for such shorter period that the registrant was required to file such reports), and (2) has been subject to such filing requirements for the past 90 days. Yes ☒ No ☐
Indicate by check mark whether the registrant has submitted electronically every Interactive Data File required to be submitted pursuant to Rule 405 of Regulation S-T (§232.405 of this chapter) during the preceding 12 months (or for such shorter period that the registrant was required to submit such files). Yes ☒ No ☐
Indicate by check mark whether the registrant is a large accelerated filer, an accelerated filer, a non-accelerated filer, a smaller reporting company, or an emerging growth company. See the definitions of “large accelerated filer,” “accelerated filer,” “smaller reporting company” and “emerging growth company” in Rule 12b-2 of the Exchange Act.
| Large accelerated filer | ☒ | Accelerated filer | ☐ | Non-accelerated filer | ☐ | Smaller reporting company | ☐ | Emerging growth company | ☐ |
If an emerging growth company, indicate by check mark if the registrant has elected not to use the extended transition period for complying with any new or revised financial accounting standards provided pursuant to Section 13(a) of the Exchange Act. ¨
Indicate by check mark whether the registrant has filed a report on and attestation to its management’s assessment of the effectiveness of its internal control over financial reporting under Section 404(b) of the Sarbanes-Oxley Act (15 U.S.C. 7262(b)) by the registered public accounting firm that prepared or issued its audit report. ☒
If securities are registered pursuant to Section 12(b) of the Act, indicate by check mark whether the financial statements of the registrant included in the filing reflect the correction of an error to previously issued financial statements. ¨
Indicate by check mark whether any of those error corrections are restatements that required a recovery analysis of incentive-based compensation received by any of the registrant’s executive officers during the relevant recovery period pursuant to § 240.10D-1(b). ¨
Indicate by check mark whether the registrant is a shell company (as defined in Rule 12b-2 of the Exchange Act). Yes ☐ No ☒
As of July 1, 2022 (the last business day of the registrant’s most recently completed second fiscal quarter), the aggregate market value of the voting and non-voting common equity held by non-affiliates was $32,207,985,953. Class B Common Stock is not listed for public trading on any exchange or market system. However, Class B shares are convertible into shares of Common Stock at any time on a share-for-share basis. Determination of aggregate market value assumes all outstanding shares of Class B Common Stock held by non-affiliates were converted to Common Stock as of July 1, 2022. The market value indicated is calculated based on the closing price of the Common Stock on the New York Stock Exchange on July 1, 2022 ($221.00 per share).
Indicate the number of shares outstanding of each of the registrant’s classes of common stock, as of the latest practicable date.
Common Stock, one dollar par value—146,922,179 shares, as of February 15, 2023.
Class B Common Stock, one dollar par value—57,113,777 shares, as of February 15, 2023.
DOCUMENTS INCORPORATED BY REFERENCE
Portions of the Company’s Proxy Statement for the 2023 Annual Meeting of Stockholders are incorporated by reference into Part III of this Annual Report on Form 10-K.
THE HERSHEY COMPANY
Annual Report on Form 10-K
For the Fiscal Year Ended December 31, 2022
TABLE OF CONTENTS
Cautionary Note Regarding Forward-Looking Statements
This Annual Report on Form 10-K, including the exhibits hereto and the information incorporated by reference herein, contains “forward-looking statements” within the meaning of the Private Securities Litigation Reform Act of 1995. Many of these forward-looking statements can be identified by the use of words such as “anticipate,” “assume,” “believe,” “continue,” “estimate,” “expect,” “forecast,” “future,” “intend,” “plan,” “potential,” “predict,” “project,” “strategy,” “target” and similar terms, and future or conditional tense verbs like “could,” “may,” “might,” “should,” “will” and “would,” among others. Forward-looking statements are predictions only and actual results could differ materially from management’s expectations due to a variety of factors, including those described below in Item 1A. “Risk Factors” and in Item 7. “Management’s Discussion and Analysis of Financial Condition and Results of Operations.” All forward-looking statements attributable to us or persons working on our behalf are expressly qualified in their entirety by such risk factors. Given these risks and uncertainties, you should not rely on forward-looking statements as a prediction of actual results. The forward-looking statements that we make in this Annual Report on Form 10-K are based on management’s current views and assumptions regarding future events and speak only as of their dates. We assume no obligation to update developments of these risk factors or to announce publicly any revisions to any of the forward-looking statements that we make, or to make corrections to reflect future events or developments, except as required by the federal securities laws.
| Table of Contents | The Hershey Company | 2022 Form 10-K | Page 1 |  |
PART I
Item 1. BUSINESS
The Hershey Company was incorporated under the laws of the State of Delaware on October 24, 1927 as a successor to a business founded in 1894 by Milton S. Hershey. In this report, the terms “Hershey,” “Company,” “we,” “us” or “our” mean The Hershey Company and its wholly-owned subsidiaries and entities in which it has a controlling financial interest, unless the context indicates otherwise.
Hershey is a global confectionery leader known for making more moments of goodness through chocolate, sweets, mints and other great tasting snacks. We are the largest producer of quality chocolate in North America, a leading snack maker in the United States and a global leader in chocolate and non-chocolate confectionery. We market, sell and distribute our products under more than 100 brand names in approximately 80 countries worldwide.
Reportable Segments
The Company reports its operations through three segments: (i) North America Confectionery, (ii) North America Salty Snacks and (iii) International. This organizational structure aligns with how our Chief Operating Decision Maker (“CODM”) manages our business, including resource allocation and performance assessment, and further aligns with our product categories and the key markets we serve.
-
North America Confectionery – This segment is responsible for our traditional chocolate and non-chocolate confectionery market position in the United States and Canada. This includes our business in chocolate and non-chocolate confectionery, gum and refreshment products, protein bars, spreads, snack bites and mixes, as well as pantry and food service lines. This segment also includes our retail operations, including Hershey’s Chocolate World stores in Hershey, Pennsylvania; New York, New York; Las Vegas, Nevada; Niagara Falls (Ontario) and Singapore, as well as operations associated with licensing the use of certain of the Company’s trademarks and products to third parties around the world.
-
North America Salty Snacks – This segment is responsible for our salty snacking products in the United States. This includes ready-to-eat popcorn, baked and trans fat free snacks, pretzels and other snacks.
-
International – International is a combination of all other operating segments that are not individually material, including those geographic regions where we operate outside of North America. We currently have operations and manufacture product in Mexico, Brazil, India and Malaysia, primarily for consumers in these regions, and also distribute and sell confectionery products in export markets of Asia, Latin America, Middle East, Europe, Africa and other regions.
Financial and other information regarding our segments is provided in our Management’s Discussion and Analysis and Note 13 to the Consolidated Financial Statements.
Business Acquisitions and Divestitures
In December 2021, we completed the acquisition of Pretzels Inc. (“Pretzels”), previously a privately held company that manufactures and sells pretzels and other salty snacks for other branded products and private labels in the United States. Pretzels is an industry leader in the pretzel category with a product portfolio that includes filled, gluten free and seasoned pretzels, as well as extruded snacks that complements Hershey’s snacks portfolio. Based in Bluffton, Indiana, Pretzels operates three manufacturing locations in Indiana and Kansas. Pretzels provides Hershey deep pretzel category and product expertise and the manufacturing capabilities to support brand growth and future pretzel innovation. Additionally in December 2021, we completed the acquisition of Dot’s Pretzels, LLC (“Dot’s”), previously a privately held company that produces and sells pretzels and other snack food products to retailers and distributors in the United States, with Dot’s Homestyle Pretzels snacks as its primary product. Dot’s is the fastest-growing scale brand in the pretzel category and complements Hershey’s snacks portfolio.
In June 2021, we completed the acquisition of Lily’s Sweets, LLC (“Lily’s”), previously a privately held company that sells a line of sugar-free and low-sugar confectionery foods to retailers and distributors in the United States and Canada. Lily’s products include dark and milk chocolate style bars, baking chips, peanut butter cups and other confection products that complement Hershey’s confectionery and confectionery-based portfolio.
| Table of Contents | The Hershey Company | 2022 Form 10-K | Page 2 | |
In January 2021, we completed the divestiture of Lotte Shanghai Foods Co., Ltd. (“LSFC”), which was previously included within the International segment results in our consolidated financial statements. Total proceeds from the divestiture and the impact on our consolidated financial statements were immaterial.
During the second quarter of 2020, we completed the divestitures of KRAVE Pure Foods, Inc. (“Krave”), which was previously included within the North America Salty Snacks segment, and the Scharffen Berger and Dagoba brands, both of which were previously included within the North America Confectionery segment results in our consolidated financial statements. Total proceeds from the divestitures and the impact on our Consolidated Statements of Income, both individually and on an aggregate basis, were immaterial.
Products and Brands
Our principal product offerings include chocolate and non-chocolate confectionery products; gum and mint refreshment products and protein bars; snack items such as popcorn, pretzels, spreads, snack bites and mixes; and pantry items, such as baking ingredients, toppings and beverages.
-
Within our North America Confectionery segment, our product portfolio includes a wide variety of chocolate offerings marketed and sold under the renowned brands of Hershey’s, Reese’s and Kisses, along with other popular chocolate and non-chocolate confectionery brands such as Jolly Rancher, Almond Joy, Brookside, barkTHINS, Cadbury, Good & Plenty, Heath, Kit Kat*®, Payday, Rolo®*, Twizzlers, Whoppers and York. Our protein bar products include ONE bar and our gum and mint products include Ice Breakers mints and chewing gum, Breath Savers mints and Bubble Yum bubble gum. We also have pantry items, including baking products, toppings and sundae syrups sold under the Hershey’s, Reese’s, Heath and Lily’s brands, as well as Hershey’s and Reese’s chocolate spreads and snack bites and mixes.
-
Within our North America Salty Snacks segment, we have our salty snack items. This includes ready-to-eat SkinnyPop popcorn, baked and trans fat free Pirates Booty snacks, Dot’s Homestyle Pretzels snacks and other snack brands such as Paqui.
-
Within our International segment, we manufacture, market and sell many of these same brands, as well as other brands that are marketed regionally, such as Pelon Pelo Rico confectionery products in Mexico, IO-IO snack products in Brazil and Sofit beverage products in India.
Principal Customers and Marketing Strategy
Our customers are mainly wholesale distributors, chain grocery stores, mass merchandisers, chain drug stores, vending companies, wholesale clubs, convenience stores, dollar stores, concessionaires and department stores. The majority of our customers, with the exception of wholesale distributors, resell our products to end-consumers in retail outlets in North America and other locations worldwide.
In 2022, approximately 28% of our consolidated net sales were made to McLane Company, Inc., one of the largest wholesale distributors in the United States (“U.S.”) to convenience stores, drug stores, wholesale clubs and mass merchandisers and the primary distributor of our products to Wal-Mart Stores, Inc.
The foundation of our marketing strategy is our strong brand equities, product innovation and the consistently superior quality of our products. We devote considerable resources to the identification, development, testing, manufacturing and marketing of new products. We utilize a variety of promotional programs directed towards our customers, as well as advertising and promotional programs for consumers of our products, to stimulate sales of certain products at various times throughout the year.
In conjunction with our sales and marketing efforts, our efficient product distribution network helps us maintain sales growth and provide superior customer service by facilitating the shipment of our products from our manufacturing plants to strategically located distribution centers. We primarily use common carriers to deliver our products from these distribution points to our customers.
| Table of Contents | The Hershey Company | 2022 Form 10-K | Page 3 | |
Raw Materials and Pricing
Cocoa products, including cocoa liquor, cocoa butter and cocoa powder processed from cocoa beans, are the most significant raw materials we use to produce our chocolate products. These cocoa products are purchased directly from third-party suppliers, who source cocoa beans that are grown principally in Far Eastern, West African, Central and South American regions. West Africa accounts for approximately 70% of the world’s supply of cocoa beans.
Adverse changes in climate or extreme weather, crop disease, political unrest and other problems in cocoa-producing countries have caused price fluctuations in the past, but have never resulted in the total loss of a particular producing country’s cocoa crop and/or exports. In the event that a significant disruption occurs in any given country, we believe cocoa from other producing countries and from current physical cocoa stocks in consuming countries would provide a significant supply buffer.
Our trading company in Switzerland performs all aspects of cocoa procurement, including price risk management, physical supply procurement and sustainable sourcing oversight. The trading company optimizes the supply chain for our cocoa requirements, with a strategic focus on gaining real time access to cocoa market intelligence. It also provides us with the ability to recruit and retain world class commodities traders and procurement professionals and enables enhanced collaboration with commodities trade groups, the global cocoa community and sustainable sourcing resources.
We also use substantial quantities of sugar, corn products, Class II and IV dairy products, wheat products, peanuts, almonds and energy in our production process. Most of these inputs for our domestic and Canadian operations are purchased from suppliers in the United States. For our international operations, inputs not locally available may be imported from other countries.
We change prices and weights of our products when necessary to accommodate changes in input costs, the competitive environment and profit objectives, while at the same time maintaining consumer value. Price increases and weight changes help to offset increases in our input costs, including raw and packaging materials, fuel, utilities, transportation costs and employee benefits. When we implement price increases, there is usually a time lag between the effective date of the list price increases and the impact of the price increases on net sales, in part because we typically honor previous commitments to planned consumer and customer promotions and merchandising events subsequent to the effective date of the price increases. In addition, promotional allowances may be increased subsequent to the effective date, delaying or partially offsetting the impact of price increases on net sales.
Competition
Many of our confectionery and salty snack brands enjoy wide consumer acceptance and are among the leading brands sold in the marketplace in North America and certain international markets. We sell our brands in highly competitive markets with many other global multinational, national, regional and local firms. Some of our competitors are large companies with significant resources and substantial international operations. Competition in our product categories is based on product innovation, product quality, price, brand recognition and loyalty, effectiveness of marketing and promotional activity, the ability to identify and satisfy consumer preferences, as well as convenience and service. We have also experienced increased competition from other snack items, and through innovation and acquisitions, we are continuing to expand the boundaries of our brands to capture new snacking occasions.
Working Capital, Seasonality and Backlog
Our sales are typically higher during the third and fourth quarters of the year, representing seasonal and holiday-related sales patterns. We manufacture primarily for stock and typically fill customer orders within a few days of receipt. Therefore, the backlog of any unfilled orders is not material to our total annual sales. Additional information relating to our cash flows from operations and working capital practices is provided in our Management’s Discussion and Analysis.
| Table of Contents | The Hershey Company | 2022 Form 10-K | Page 4 | |
Trademarks, Service Marks and License Agreements
We own various registered and unregistered trademarks and service marks. The trademarks covering our key product brands are of material importance to our business. Depending on the country, trademarks remain valid for as long as they are in use or their registration status is maintained. Trademark registrations generally are renewable for fixed terms. We follow a practice of seeking trademark protection in the United States and other key international markets where our products are sold. We also grant trademark licenses to third parties to produce and sell pantry items, flavored milks and various other products primarily under the Hershey’s and Reese’s brand names.
Furthermore, we have rights under license agreements with several companies to manufacture and/or sell and distribute certain products. Our rights under these agreements are extendible on a long-term basis at our option. Our most significant licensing agreements are as follows:
| Company | Brand | Location | Requirements | |||||||||||||||||
| Kraft Foods Ireland Intellectual Property Limited/Cadbury UK Limited | York Peter Paul Almond Joy Peter Paul Mounds | Worldwide | None | |||||||||||||||||
| Cadbury UK Limited | Cadbury Caramello | United States | Minimum sales requirement exceeded in 2022 | |||||||||||||||||
| Société des Produits Nestlé SA | Kit Kat*®* Rolo*®* | United States | Minimum unit volume sales exceeded in 2022 | |||||||||||||||||
| Iconic IP Interests, LLC | Good & Plenty Heath Jolly Rancher Milk Duds Payday Whoppers | Worldwide | None |
Research and Development
We engage in a variety of research and development activities in a number of countries, including the U.S., Mexico, Brazil, India and Malaysia. We develop new products, improve the quality of existing products, improve and modernize production processes and develop and implement new technologies to enhance the quality and value of both current and proposed product lines. Information concerning our research and development expense is contained in Note 1 to the Consolidated Financial Statements.
Food Quality and Safety Regulation
The manufacture and sale of consumer food products is highly regulated. In the U.S., our activities are subject to regulation by various government agencies, including the Food and Drug Administration, the Department of Agriculture, the Federal Trade Commission, the Department of Commerce and the Environmental Protection Agency, as well as various state and local agencies. Similar agencies also regulate our businesses outside of the U.S.
We believe our Product Excellence Program provides us with an effective product quality and safety program. This program is integral to our global supply chain platform and is intended to ensure that all products we purchase, manufacture and distribute are safe, are of high quality and comply with applicable laws and regulations.
Through our Product Excellence Program, we evaluate our supply chain including ingredients, packaging, processes, products, distribution and the environment to determine where product quality and safety controls are necessary. We identify risks and establish controls intended to ensure product quality and safety. Various government agencies and third-party firms, as well as our quality assurance staff, conduct audits of all facilities that manufacture our products to assure effectiveness and compliance with our program and applicable laws and regulations.
| Table of Contents | The Hershey Company | 2022 Form 10-K | Page 5 | |
Environmental Considerations
Beyond ordinary operating and capital expenditures that we make to comply with government regulations, including environmental laws and regulations, we have made a number of voluntary commitments to protect and reduce our environmental impacts in recent years, including efforts to eliminate commodity-driven deforestation and reduce greenhouse gas (“GHG”) emissions across our own operations and supply chain. Our climate change related investments and expenditures primarily focus on achieving a 50% absolute reduction in our Scope 1 and 2 GHG emissions and a 25% absolute reduction in our Scope 3 GHG emissions by 2030 (compared to a 2018 baseline), as well as having 100% of plastic packaging be recyclable, reusable or compostable and 25 million pounds of packaging be eliminated by 2030. The annual operating and capital expenditures associated with these ordinary course payments and additional climate change commitments are not material with respect to our results of operations, capital expenditures or competitive position.
Sustainability
The Company’s commitment to sustainability started with our founder’s belief in responsible citizenship. He was a purpose-driven leader who believed we could use chocolate to Make More Moments of Goodness in the world for our consumers today and for many generations to come. This belief resulted in a strong investment in local communities and the establishment of Milton Hershey School for disadvantaged kids. We continue that legacy today through our holistic environmental, social and governance (“ESG”) strategy: our Shared Goodness Promise, which guides how we empower the remarkable people who make and sell our brands, interact with farming communities that grow our ingredients, deliver on our commitments to consumers, customers, and external stakeholders, protect the environment and support children and youth.
To learn more about our ESG-related goals, progress and initiatives, as well as review our annual ESG Report and accompanying suite of ESG reporting frameworks, policies, and disclosures, access the Sustainability section of our website at: https://www.thehersheycompany.com/en_us/sustainability.html. Information found on the Company’s website is not part of this Annual Report on Form 10-K or any other report filed with the United States Securities and Exchange Commission (“SEC”).
Financial Information by Geographic Area
Our principal operations and markets are located in the United States. The percentage of total consolidated net sales for our businesses outside of the United States was 12.5% for 2022, 13.0% for 2021 and 13.6% for 2020. The percentage of total long-lived assets outside of the United States was 17.9% as of December 31, 2022 and 18.8% as of December 31, 2021.
Human Capital
As of December 31, 2022, the Company employed approximately 18,075 full-time and 1,790 part-time employees worldwide. Collective bargaining agreements covered approximately 6,470 employees, or approximately 33% of the Company’s employees worldwide. During 2023, agreements are expected to be negotiated for certain employees at five facilities, four of which are outside of the United States, comprising approximately 67% of total employees under collective bargaining agreements. We believe our efforts in managing our workforce have been effective, as evidenced by a strong culture and a good relationship between the Company and our employees.
We are a purpose-driven company and for more than a century, our iconic brands have been built on a foundation of community investment and connections between people around the world. We could not have achieved this without our remarkable employees who make our purpose a reality. As a result, our human capital strategies are material to our operations and core to the long-term success of the Company.
- Our People, Safety and Employee Engagement. Our employees are among our most important resources and are critical to our continued success. We provide a workplace that develops, supports and motivates our people. The overall well-being and safety of our employees remains one of our top priorities. We continue to invest in training, workplace resources and leading systems and processes to ensure the responsible management of all facilities. Additionally, continuous listening surveys are distributed throughout the year to all employees globally. These short and fast surveys reach all of our employees around the world to hear their thoughts on the Company’s direction and their place in it. These continuous touchpoints allow for real-time feedback and action from the Company. These surveys are further supplemented with quarterly and
| Table of Contents | The Hershey Company | 2022 Form 10-K | Page 6 | |
informative enterprise and team town halls, which, in conjunction with the continuous listening surveys, generate stronger employee engagement with the Company’s strategy, initiatives and leadership. Further, in June 2022, the Company conducted its first annual Ethics and Compliance Survey to assess employees’ perception of the health of ethics and compliance at Hershey.
-
Talent Acquisition, Development and Training. Hiring and developing our employees is critically important to our operations and we are focused on creating experiences and programs that foster growth and performance. We provide all employees the chance to learn, grow and own their work. We have partnered with leading online content experts and increased internal learning development to expand our catalog of online and classroom courses. Additionally, we have co-created a culture of development with the enthusiastic support of our employees. Through individual development plans, learning opportunities, feedback and coaching, employees can build careers at The Hershey Company, as evidenced by the fact that the majority of our eight executive officers were promoted from within the organization (see Information about Our Executive Officers).
-
Compensation, Benefits and Wellness. In addition to offering competitive, fair and transparent compensation, we also offer a suite of benefits, including comprehensive health and meaningful retirement benefits to eligible employees, tying incentive compensation to both business and individual performance, offering parental leave and adoption benefits and maintaining an employee stock purchase plan. We also provide a number of innovative programs designed to promote physical and emotional well-being, including ergonomic workspaces, a state-of-the-art fitness center at our Hershey, Pennsylvania campus and private rooms designed for quiet reflection, prayer or wellness breaks. The Company also offers SmartFlex benefits which is our suite of policies that allows individuals to create their own balance between work and personal life, including flexing work time based on work priorities or personal commitments, such as caring for children or family members. We believe that this flexibility improves productivity, job satisfaction and increases employee engagement. Additionally, the Company offers a “Best of Both” flexible work model for corporate and commercial employees to balance work and personal well-being. This model allows employees the option to work either remote, in-office, or both, depending on individual needs, personal schedules and work demands. This offers the benefits of flexibility and in-person collaboration, while maintaining productivity and overall job satisfaction.
-
Diversity, Equity and Inclusion. Our diverse and inclusive culture makes the difference across all areas of the business around the world. Our gender representation includes women occupying many of the top positions in the Company, including Chief Executive Officer and Chairman of the Board, Chief Accounting Officer and President, Salty Snacks, and approximately 50% representation across the Company. Additionally, five of our 12 Board members are women (42% representation). In 2022, we maintained fair and equitable pay achievements, including 1:1 aggregate people of color pay equity for salaried employees in the United States (2021) and 1:1 aggregate gender pay (2020). Further, our eight employee-led Business Resource Groups, which include Abilities First, African American, Asian, GenH (Generations), Latino, Prism (LGBTQ), Veteran’s and Women’s, play a critical role in attracting diverse talent, providing mentoring and career development opportunities, delivering commercial business insights and connecting people to the Company and the communities where we do business. In 2022, the Company was ranked #6 on DiversityInc’s Top 50 Companies for Diversity and was ranked as a top 50 company on Forbes Top Female Friendly Companies. Additionally, the Company also ranked as a top 30 company on Wall Street Journal’s Top 250 Best-Managed Companies of 2022.
-
Community and Social Impact. Our philanthropy and volunteerism efforts reflect how we live out the Company’s value of making moments of goodness, from supporting causes our employees care about to investing in the long-term success of the communities where we live and work. We work closely with counterparts in each of our plant and office locations across the United States and globally to identify local community needs and craft tailored approaches to provide support. This work includes forging partnerships with local non-governmental organizations, providing grants and contributions and organizing volunteer service activities and employee fundraisers.
| Table of Contents | The Hershey Company | 2022 Form 10-K | Page 7 | |
Available Information
The Company's website address is www.thehersheycompany.com. We file or furnish annual, quarterly and current reports, proxy statements and other information, including amendments to these reports, with the SEC. You may obtain a copy of any of these reports, free of charge, from the Investors section of our website as soon as reasonably practicable after we electronically file such material with, or furnish it to, the SEC. The SEC maintains an Internet site that also contains these reports at www.sec.gov. In addition, copies of the Company’s annual report will be made available, free of charge, on written request to the Company.
We have a Code of Conduct that applies to our Board of Directors (“Board”) and all Company officers and employees, including, without limitation, our Chief Executive Officer and “senior financial officers” (including the Chief Financial Officer, Chief Accounting Officer and persons performing similar functions). You can obtain a copy of our Code of Conduct, as well as our Corporate Governance Guidelines and charters for each of the Board’s standing committees, from the Investors section of our website at: https://www.thehersheycompany.com/en_us/investors.html. If we change or waive any portion of the Code of Conduct that applies to any of our directors, executive officers or senior financial officers, we will post that information on our website. Information found on the Company’s website is not part of this Annual Report on Form 10-K or any other report filed with the SEC.
| Table of Contents | The Hershey Company | 2022 Form 10-K | Page 8 | |
Item 1A. RISK FACTORS
You should carefully read the following discussion of significant factors, events and uncertainties when evaluating our business and the forward-looking information contained in this Annual Report on Form 10-K. The events and consequences discussed in these risk factors could materially and adversely affect our business, operating results, liquidity and financial condition. While we believe we have identified and discussed below the key risk factors affecting our business, these risk factors do not identify all the risks we face, and there may be additional risks and uncertainties that we do not presently know or that we do not currently believe to be significant that may have a material adverse effect on our business, performance or financial condition in the future.
Risks Related to Our Business and Operations
Our Company’s reputation or brand image might be impacted as a result of issues or concerns relating to the quality and safety of our products, ingredients or packaging, human and workplace rights, and other environmental, social or governance matters, which in turn could result in litigation or otherwise negatively impact our operating results.
In order to sell our iconic, branded products, we need to maintain a good reputation with our customers, consumers, suppliers, vendors and employees, among others. Issues related to the quality and safety of our products, ingredients or packaging could jeopardize our Company’s image and reputation. We have in the past and may in the future need to recall products if any of our products become unfit for consumption. Negative publicity related to these types of concerns, or related to product contamination or product tampering, whether valid or not, could decrease demand for our products or cause production and delivery disruptions. In addition, negative publicity related to our environmental, social or governance practices could also impact our reputation with customers, consumers, suppliers and vendors.
We have been in the past and in the future could potentially be subject to litigation or government actions as a result of issues or concerns relating to the quality and safety of our products, ingredients or packaging, human and workplace rights, and other environmental, social or governance matters, which could result in payments of fines or damages. Costs associated with these potential actions, as well as the potential impact on our reputation or ability to sell our products, could negatively affect our operating results.
Disruption to our manufacturing operations or supply chain could impair our ability to produce or deliver finished products, resulting in a negative impact on our operating results.
Approximately 70% of our manufacturing capacity is located in the United States. Disruption to our global manufacturing operations or our supply chain could result from, among other factors, the following:
-
Natural disaster;
-
Pandemic outbreak of disease (such as the coronavirus disease 2019 (“COVID-19”) global pandemic);
-
Climate change and severity of extreme weather;
-
Fire or explosion;
-
Terrorism or other acts of violence;
-
Labor strikes or other labor activities;
-
Unavailability of raw or packaging materials;
-
Operational and/or financial instability of key suppliers, and other vendors or service providers; and
-
Suboptimal production planning which could impact our ability to cost-effectively meet product demand.
We believe that we take adequate precautions to mitigate the impact of possible disruptions. We have strategies and plans in place to manage disruptive events if they were to occur, including our global supply chain strategies and our principle-based global labor relations strategy. If we are unable, or find that it is not financially feasible, to effectively plan for, mitigate or manage operational stability and business resiliency, particularly within our international markets and snacks portfolio, due to the potential impacts of such disruptive events on our manufacturing operations or supply chain, our financial condition and results of operations could be negatively impacted if such events were to occur.
| Table of Contents | The Hershey Company | 2022 Form 10-K | Page 9 | |
We might not be able to hire, engage and retain the talented global human capital we need to drive our growth strategies.
Our future success depends upon our ability to identify, hire, develop, engage and retain talented personnel across the globe. Competition for global talent is intense, and we might not be able to identify and hire the personnel we need to continue to evolve and grow our business. In particular, if we are unable to hire the right individuals to fill new or existing senior management positions as vacancies arise, our business performance may be impacted.
Activities related to identifying, recruiting, hiring and integrating qualified individuals require significant time and attention. We may also need to invest significant amounts of cash and equity to attract talented new employees, and we may never realize returns on these investments.
In addition to hiring new employees, we must continue to focus on retaining and engaging the talented individuals we need to sustain our core business and lead our developing businesses into new markets, channels and categories. This may require significant investments in training, coaching and other career development and retention activities. If we are not able to effectively retain and grow our talent, our ability to achieve our strategic objectives will be adversely affected, which may impact our financial condition and results of operations.
Risks associated with climate change and other environmental impacts, and increased focus and evolving views of our customers, stockholders and other stakeholders on climate change issues, could negatively affect our business and operations.
Climate-related changes can increase variability in, or otherwise impact, natural disasters, including weather patterns, with the potential for increased frequency and severity of significant weather events, natural hazards, rising mean temperature and sea levels, and long-term changes in precipitation patterns. Climate change or weather-related disruptions to our supply chain can impact the availability and cost of materials needed for manufacturing and could increase insurance and other operating costs.
Increased focus on climate change has led to legislative and regulatory efforts to combat both potential causes and adverse impacts of climate change, including regulation of GHG emissions. New or increasing laws and regulations related to GHG emissions and other climate change related concerns may adversely affect us, our suppliers and our customers, and may require additional capital investments. Our value chain faces similar challenges as our products rely on agricultural ingredients and a global supply chain. Climate change poses a significant and increasing risk to global food production systems and to the safety and resilience of the communities where we live, work and source our ingredients. The GHG impacts of land-use change are most pronounced in our cocoa supply chain, where we have already been working for several years to prevent deforestation. Additionally, any non-compliance with legislative and regulatory requirements could negatively impact our reputation and ability to do business.
Investors, customers, advisory services, government regulators and other market participants have increasingly focused on the environmental or sustainability practices of companies, including Hershey. Shareholders and financial institutions have increasingly evaluated a company’s ESG practices, disclosures and performance before making investments or other financial decisions. We believe our practices, disclosures and performance are strong and growing. However, if our environmental goals do not meet investor or other external stakeholder expectations and standards, our access to capital may be negatively impacted. An enforcement action could harm our reputation, financial position and ability to grow. A failure to meet expectations may adversely affect our results of operations, ability to manage our liquidity, or implement our strategies.
The Company publishes its environmental goals, with a particular focus on achieving a 50% absolute reduction in our Scope 1 and 2 GHG emissions and a 25% absolute reduction in our Scope 3 GHG emissions by 2030 (compared to a 2018 baseline), as well as having 100% of plastic packaging be reusable, recyclable or compostable and 25 million pounds of packaging be eliminated by 2030. The costs of these voluntary commitments may be greater than expected, and there can be no assurance the Company will achieve its goals, or meet the evolving sustainability expectations and standards of our investors or other external stakeholders. Any failure to achieve our goals, a perception of our failure to act responsibly with respect to the environment, or failure to respond to new or evolving legal and regulatory requirements or other sustainability concerns could adversely affect our business, reputation and increase risk of litigation.
| Table of Contents | The Hershey Company | 2022 Form 10-K | Page 10 | |
The effects and costs of climate change, or any failure to meet related requirements and expectations, could have a negative impact on our reputation, financial condition and results of operations.
Risks Related to the Industry in Which We Operate
Increases in raw material and energy costs along with the availability of adequate supplies of raw materials could affect future financial results.
We use many different commodities for our business, including cocoa products, sugar, corn products, dairy products, wheat products, peanuts, almonds, natural gas and diesel fuel.
Commodities are subject to price volatility and changes in supply caused by numerous factors, including:
-
Commodity market fluctuations;
-
Currency exchanges rates;
-
Imbalances between supply and demand;
-
Rising levels of inflation and interest rates related to domestic and global economic conditions or supply chain issues;
-
The effects of climate change and extreme weather on crop yield and quality;
-
Speculative influences;
-
Trade agreements among producing and consuming nations;
-
Supplier compliance with commitments;
-
Import/export requirements for raw materials and finished goods;
-
Political unrest in producing countries;
-
Introduction of living income premiums or similar requirements;
-
Changes in governmental agricultural programs and energy policies; and
-
Other events beyond our control such as the impacts on the business or supply chain arising from the conflict between Russia and Ukraine.
Although we use forward contracts and commodity futures and options contracts where possible to hedge commodity prices, commodity price increases ultimately result in corresponding increases in our raw material and energy costs. If we are unable to offset cost increases for major raw materials and energy, there could be a negative impact on our financial condition and results of operations.
Price increases may not be sufficient to offset cost increases and maintain profitability or may result in sales volume declines associated with pricing elasticity.
We may be able to pass some or all raw material, energy and other input cost increases to customers by increasing the selling prices of our products or decreasing the size of our products; however, higher product prices or decreased product sizes may also result in a reduction in sales volume and/or consumption. If we are not able to increase our selling prices or reduce product sizes (including if inflation outpaces our pricing elasticity) sufficiently, or in a timely manner, to offset increased raw material, energy or other input costs, including packaging, freight, direct labor, overhead and employee benefits, or if our sales volume decreases significantly, there could be a negative impact on our financial condition and results of operations.
Market demand for new and existing products could decline.
We operate in highly competitive markets and rely on continued demand for our products. To generate revenues and profits, we must sell products that appeal to our customers and to consumers. Our continued success is impacted by many factors, including the following:
-
Effective retail execution;
-
Appropriate advertising campaigns and marketing programs;
-
Our ability to secure adequate shelf space at retail locations;
-
Our ability to drive sustainable innovation and maintain a strong pipeline of new products in the confectionery and broader snacking categories;
-
Changes in product category consumption;
-
Our response to consumer demographics and trends, including but not limited to, trends relating to store trips and the impact of the growing digital commerce channel; and
| Table of Contents | The Hershey Company | 2022 Form 10-K | Page 11 | |
- Consumer health concerns, including obesity and the consumption of certain ingredients.
There continues to be competitive product and pricing pressures in the markets where we operate, as well as challenges in maintaining profit margins. We must maintain mutually beneficial relationships with our key customers, including retailers and distributors, to compete effectively. Our largest customer, McLane Company, Inc., accounted for approximately 28% of our total net sales in 2022. McLane Company, Inc. is one of the largest wholesale distributors in the United States to convenience stores, drug stores, wholesale clubs and mass merchandisers, including Wal-Mart Stores, Inc.
Increased marketplace competition could hurt our business.
The global confectionery and snacks packaged goods industry is intensely competitive and consolidation in this industry continues. Some of our competitors are large companies that have significant resources and substantial international operations. We continue to experience increased levels of in-store activity for other snack items, which has pressured confectionery category growth. In order to protect our existing market share or capture increased market share in this highly competitive retail environment, we may be required to increase expenditures for promotions and advertising, and must continue to introduce and establish new products. Due to inherent risks in the marketplace associated with advertising and new product introductions, including uncertainties about trade and consumer acceptance, increased expenditures may not prove successful in maintaining or enhancing our market share and could result in lower sales and profits. In addition, we may incur increased credit and other business risks because we operate in a highly competitive retail environment.
Risks Related to Strategic Initiatives
Our financial results may be adversely impacted by the failure to successfully execute or integrate acquisitions, divestitures and joint ventures.
From time to time, we may evaluate potential acquisitions, divestitures or joint ventures that align with our strategic objectives. The success of such activity depends, in part, upon our ability to identify suitable buyers, sellers or business partners; perform effective assessments prior to contract execution; negotiate contract terms; and, if applicable, obtain government approval. These activities may present certain financial, managerial, staffing and talent, and operational risks, including diversion of management’s attention from existing core businesses; difficulties integrating or separating businesses from existing operations; and challenges presented by acquisitions or joint ventures which may not achieve sales levels and profitability that justify the investments made. If the acquisitions, divestitures or joint ventures are not successfully implemented or completed, there could be a negative impact on our financial condition, results of operations and cash flows.
In 2021, we successfully completed the divestiture of LSFC as we better prioritize resources against assets and brands that fit our business model and scale capabilities. Additionally, we completed the acquisitions of Lily’s in June 2021 and Dot’s and Pretzels in December 2021. While we believe significant operating synergies can be obtained in connection with these acquisitions, achievement of these synergies will be driven by our ability to successfully leverage Hershey’s resources, expertise, capability-building, distribution locations and customer base. In addition, the acquisitions of Dot’s and Pretzels are important steps in our journey to expand our breadth in snacking, as they should enable us to bring scale and category management capabilities to a key sub-segment of the warehouse snack aisle. If we are unable to successfully couple Hershey’s scale and expertise in brand building with Lily’s, Dot’s and Pretzels’ existing operations, it may impact our ability to expand our snacking footprint at our desired pace.
| Table of Contents | The Hershey Company | 2022 Form 10-K | Page 12 | |
Our international operations may not achieve projected growth objectives, which could adversely impact our overall business and results of operations.
In 2022, 2021 and 2020, respectively, we derived approximately 12.5%, 13.0% and 13.6% of our net sales from customers located outside of the United States. Additionally, approximately 18% of our total long-lived assets were located outside of the United States as of December 31, 2022. As part of our strategy, we have made investments outside of the United States, particularly in Canada, Malaysia, Mexico, Brazil and India. As a result, we are subject to risks and uncertainties relating to international sales and operations, including:
-
The inability to manage operational stability and business resiliency within our international markets due to unforeseen global economic and environmental changes resulting in business interruption, supply constraints, inflation, deflation or decreased demand;
-
The inability to establish, develop and achieve market acceptance of our global brands in international markets;
-
Difficulties and costs associated with compliance and enforcement of remedies under a wide variety of complex laws, treaties and regulations;
-
Unexpected changes in regulatory environments;
-
Political and economic instability, including the possibility of civil unrest, terrorism, mass violence or armed conflict;
-
Nationalization of our properties by foreign governments;
-
Tax rates that may exceed those in the United States and earnings that may be subject to withholding requirements and incremental taxes upon repatriation;
-
Potentially negative consequences from changes in tax laws;
-
The imposition of tariffs, quotas, trade barriers, other trade protection measures and import or export licensing requirements;
-
Increased costs, disruptions in shipping or reduced availability of freight transportation;
-
The impact of currency exchange rate fluctuations between the U.S. dollar and foreign currencies;
-
Failure to gain sufficient profitable scale in certain international markets resulting in an inability to cover manufacturing fixed costs or resulting in losses from impairment or sale of assets; and
-
Failure to recruit, retain and build a talented and engaged global workforce.
If we are not able to achieve our projected international growth objectives and mitigate the numerous risks and uncertainties associated with our international operations, there could be a negative impact on our financial condition and results of operations.
We may not fully realize the expected cost savings and/or operating efficiencies associated with our strategic initiatives or restructuring programs, which may have an adverse impact on our business.
We depend on our ability to evolve and grow, and as changes in our business environment occur, we may adjust our business plans by introducing new strategic initiatives or restructuring programs to meet these changes. Recently introduced strategic initiatives include our efforts to continue to expand our presence in digital commerce, to transform our manufacturing, commercial and corporate operations through digital technologies and to enhance our data analytics capabilities to develop new commercial insights. If we are not able to capture our share of the expanding digital commerce market, if we do not adequately leverage technology to improve operating efficiencies or if we are unable to develop the data analytics capabilities needed to generate actionable commercial insights, our business performance may be impacted, which may negatively impact our financial condition and results of operations.
Additionally, from time to time we implement business realignment activities to support key strategic initiatives designed to maintain long-term sustainable growth, such as the International Optimization Program, which we commenced in the fourth quarter of 2020. This program is intended to increase our operating effectiveness and efficiency, to reduce our costs and/or to generate savings that can be reinvested in other areas of our business. We cannot guarantee that we will be able to successfully implement these strategic initiatives and restructuring programs, that we will achieve or sustain the intended benefits under these programs, or that the benefits, even if achieved, will be adequate to meet our long-term growth and profitability expectations, which could in turn adversely affect our business.
| Table of Contents | The Hershey Company | 2022 Form 10-K | Page 13 | |
Risks Related to Governmental and Regulatory Changes
Changes in governmental laws and regulations could increase our costs and liabilities or impact demand for our products.
Changes in laws and regulations and the manner in which they are interpreted or applied may alter our business environment. These negative impacts could result from changes in food and drug laws, laws related to advertising and marketing practices, accounting standards, taxation compliance and requirements, competition laws, employment laws, import/export requirements and environmental laws, among others. It is possible that we could become subject to additional liabilities in the future resulting from changes in laws and regulations that could result in an adverse effect on our financial condition and results of operations.
Political, economic and/or financial market conditions, including impacts on our business arising from the conflict between Russia and Ukraine, could negatively impact our financial results.
Our operations are impacted by consumer spending levels and impulse purchases, which are affected by general macroeconomic conditions, consumer confidence, employment levels, the availability of consumer credit and interest rates on that credit, consumer debt levels, energy costs and other factors. Volatility in food and energy costs, sustained global recessions, broad political instability, rising unemployment, pandemic outbreak of disease (such as COVID-19), climate change, weather, natural and other disasters and declines in personal spending could adversely impact our revenues, profitability and financial condition.
Changes in financial market conditions may make it difficult to access credit markets on commercially acceptable terms, which may reduce liquidity or increase borrowing costs for our Company, our customers and our suppliers. A significant reduction in liquidity could increase counterparty risk associated with certain suppliers and service providers, resulting in disruption to our supply chain and/or higher costs, and could impact our customers, resulting in a reduction in our revenue, or a possible increase in bad debt expense.
Additionally, in February 2022, Russia invaded Ukraine and this conflict is still ongoing. In response, the U.S. and other countries have imposed sanctions on Russia and may impose further sanctions that could damage or disrupt international commerce and the global economy. With respect to the conflict between Russia and Ukraine, the situation remains dynamic and subject to rapid and possibly material change. The Company’s efforts to manage and mitigate any direct or indirect effects from this conflict may ultimately be unsuccessful, and the effectiveness of these efforts depends on factors beyond our control, including the duration of the conflict and potential governmental actions. The potential effects of the ongoing conflict between Russia and Ukraine may also impact many of the other risk factors described herein.
Risks Related to Digital Transformation, Cybersecurity and Data Privacy
Disruptions, failures or security breaches of our information technology infrastructure could have a negative impact on our operations.
Information technology is critically important to our business operations. We use information technology to manage all business processes including manufacturing, financial, logistics, sales, marketing and administrative functions. These processes collect, interpret and distribute business data and communicate internally and externally with employees, suppliers, customers and other third parties.
We are regularly the target of cyber, ransomware and other security threats. Therefore, we continuously monitor and update our information technology networks and infrastructure to prevent, detect, address and mitigate the risk of unauthorized access, misuse, computer viruses and other events that could have a security impact. We invest in industry standard security technology to protect the Company’s data and business processes against risk of data security breach and cyber attack. Our data security management program includes identity, trust, vulnerability and threat management business processes as well as adoption of standard data protection policies. We measure our data security effectiveness through industry-accepted methods and remediate significant findings. Additionally, we certify our major technology suppliers and any outsourced services through accepted security certification standards. We maintain and routinely test backup systems and disaster recovery, along with external network security penetration testing by an independent third party as part of our business resiliency preparedness. We also have processes in place to prevent disruptions resulting from our implementation of new software and systems.
| Table of Contents | The Hershey Company | 2022 Form 10-K | Page 14 | |
While we have been subject to cyber attacks, ransomware and other security breaches, these incidents did not have a significant impact on our business operations. We believe our security technology tools and processes provide adequate measures of protection against security and data breaches and in reducing cybersecurity risks. Nevertheless, despite continued vigilance in these areas, disruptions in or failures of information technology systems are possible and could have a negative impact on our operations or business reputation. Failure of our systems, including failures due to cyber attacks that would prevent the ability of systems to function as intended, could cause transaction errors, loss of customers and sales, and could have negative consequences to our Company, our employees and those with whom we do business. This in turn could have a negative impact on our financial condition and results or operations. In addition, the cost to remediate any damages to our information technology systems suffered as a result of a cyber attack could be significant.
Complications with the design or implementation of our new enterprise resource planning system could adversely impact our business and operations.
We rely extensively on information systems and technology to manage our business and summarize operating results. We are in the process of a multi-year implementation of a new global enterprise resource planning (“ERP”) system. This ERP system will replace our existing operating and financial systems. The ERP system is designed to accurately maintain the Company’s financial records, enhance operational functionality and provide timely information to the Company’s management team related to the operation of the business. The ERP system implementation process has required, and will continue to require, the investment of significant personnel and financial resources. We may not be able to successfully implement the ERP system without experiencing further delays, increased costs and other difficulties. If we are unable to successfully design and implement the new ERP system as planned, our financial positions, results of operations and cash flows could be negatively impacted. Additionally, if we do not effectively implement the ERP system as planned or the ERP system does not operate as intended, the effectiveness of our internal control over financial reporting could be adversely affected or our ability to assess those controls adequately could be further delayed.
Item 1B. UNRESOLVED STAFF COMMENTS
None.
| Table of Contents | The Hershey Company | 2022 Form 10-K | Page 15 | |
Item 2. PROPERTIES
Our principal properties include the following:
| Country | Location | Type | Status (Own/Lease) | |||||||||||||||||
| United States | Hershey, Pennsylvania (2 principal plants) | Manufacturing—confectionery products and pantry items | Own | |||||||||||||||||
| Lancaster, Pennsylvania | Manufacturing—confectionery products | Own | ||||||||||||||||||
| Hazleton, Pennsylvania | Manufacturing—confectionery products | Own | ||||||||||||||||||
| Robinson, Illinois | Manufacturing—confectionery products and pantry items | Own | ||||||||||||||||||
| Stuarts Draft, Virginia | Manufacturing—confectionery products and pantry items | Own | ||||||||||||||||||
| Edgerton, Kansas | Manufacturing—salty snack products | Own | ||||||||||||||||||
| Bluffton, Indiana | Manufacturing—salty snack products | Lease | ||||||||||||||||||
| Plymouth, Indiana | Manufacturing—salty snack products | Lease | ||||||||||||||||||
| Lawrence, Kansas | Manufacturing—salty snack products | Lease | ||||||||||||||||||
| Annville, Pennsylvania | Distribution | Own | ||||||||||||||||||
| Palmyra, Pennsylvania | Distribution | Own | ||||||||||||||||||
| Edwardsville, Illinois | Distribution | Own | ||||||||||||||||||
| Ogden, Utah | Distribution | Own | ||||||||||||||||||
| Kennesaw, Georgia | Distribution | Lease | ||||||||||||||||||
| Whitestown, Indiana | Distribution | Lease | ||||||||||||||||||
| Hershey, Pennsylvania | Corporate administrative | Lease | ||||||||||||||||||
| New York, New York | Retail | Lease | ||||||||||||||||||
| Canada | Brantford, Ontario | Distribution | Own | |||||||||||||||||
| Mexico | Monterrey, Mexico | Manufacturing—confectionery products | Own | |||||||||||||||||
| El Salto, Mexico | Manufacturing—confectionery products and pantry items | Own | ||||||||||||||||||
| Malaysia | Johor, Malaysia | Manufacturing—confectionery products | Own |
In addition to the locations indicated above, we also own or lease several other properties and buildings worldwide which we use for manufacturing, sales, distribution and administrative functions. Our facilities are well maintained and generally have adequate capacity to accommodate seasonal demands, changing product mixes and certain additional growth. We regularly improve our facilities to incorporate the latest technologies. The largest facilities are located in Hershey, Lancaster and Hazleton, Pennsylvania; Monterrey and El Salto, Mexico; and Stuarts Draft, Virginia. The U.S., Canada and Mexico facilities in the table above primarily support our North America Confectionery and North America Salty Snacks segments, while the Malaysia facility primarily serves our International segment. As discussed in Note 13 to the Consolidated Financial Statements, we do not manage our assets on a segment basis given the integration of certain manufacturing, warehousing, distribution and other activities in support of our global operations.
Item 3. LEGAL PROCEEDINGS
Information on legal proceedings is included in Note 15 to the Consolidated Financial Statements.
Item 4. MINE SAFETY DISCLOSURES
Not applicable.
| Table of Contents | The Hershey Company | 2022 Form 10-K | Page 16 | |
SUPPLEMENTAL ITEM. INFORMATION ABOUT OUR EXECUTIVE OFFICERS
The executive officers of the Company, their positions and, as of February 15, 2023, their ages are set forth below.
| Name | Age | Positions Held During the Last Five Years | ||||||||||||
| Michele G. Buck | 61 | Chairman of the Board, President and Chief Executive Officer (October 2019); President and Chief Executive Officer (March 2017) | ||||||||||||
| Jennifer L. McCalman (1) | 45 | Vice President, Chief Accounting Officer (February 2021); Senior Director, Global Controller (March 2019) | ||||||||||||
| Charles R. Raup | 55 | President, U.S. Confection (November 2022); President, U.S. (January 2020); Vice President, U.S. CMG (June 2018); Vice President and General Manager, Chocolate (August 2017) | ||||||||||||
| Jason R. Reiman | 51 | Senior Vice President, Chief Supply Chain Officer (June 2019); Vice President, Supply Chain Operations (August 2018); Vice President, US Supply Chain Operations (July 2017); Vice President, International Operations (May 2017) | ||||||||||||
| Kristen J. Riggs | 44 | President, Salty Snacks (November 2022); Senior Vice President, Chief Growth Officer (January 2020); Vice President, Innovation and Strategic Growth Platforms (September 2019); Vice President, Commercial Planning (June 2018); Vice President, Brand Commercialization (July 2017) | ||||||||||||
| Christopher M. Scalia | 47 | Senior Vice President, Chief Human Resources Officer (January 2020); Vice President, Global Human Resources (March 2018); Vice President, Talent, HR Operations and Analytics (December 2014) | ||||||||||||
| James Turoff | 46 | Senior Vice President, General Counsel and Secretary (May 2021); Acting General Counsel (December 2020); Vice President, Deputy General Counsel (March 2019); Vice President, SEC, Corporate Governance & Compliance (March 2018); Associate General Counsel, Securities & Governance and Business Transformation (May 2017) | ||||||||||||
| Steven E. Voskuil (2) | 54 | Senior Vice President, Chief Financial Officer (February 2021); Senior Vice President, Chief Financial Officer and Chief Accounting Officer (November 2019); Senior Vice President, Chief Financial Officer (May 2019) |
There are no family relationships among any of the above-named officers of our Company.
(1) Ms. McCalman was appointed Vice President, Chief Accounting Officer effective February 23, 2021. Prior to joining our Company she was Senior Director and Assistant Controller for Keurig Dr. Pepper (formerly Keurig Green Mountain) (May 2017).
(2) Mr. Voskuil was appointed Senior Vice President, Chief Financial Officer effective May 13, 2019. Prior to joining our Company he was Senior Vice President and Chief Financial Officer at Avanos Medical, Inc. (November 2014).
Our Executive Officers are generally appointed each year at the organization meeting of the Board in May.
| Table of Contents | The Hershey Company | 2022 Form 10-K | Page 17 | |
PART II
Item 5. MARKET FOR THE REGISTRANT’S COMMON EQUITY, RELATED STOCKHOLDER MATTERS AND ISSUER PURCHASES OF EQUITY SECURITIES
Our Common Stock is listed and traded principally on the New York Stock Exchange under the ticker symbol “HSY.” The Class B Common Stock (“Class B Stock”) is not publicly traded.
The closing price of our Common Stock on December 30, 2022 (the last business day of the of the fiscal year) was $231.57. There were 24,076 stockholders of record of our Common Stock and 5 stockholders of record of our Class B Stock as of December 31, 2022.
We paid $775.0 million in cash dividends on our Common Stock and Class B Stock in 2022 and $686.0 million in 2021. The annual dividend rate on our Common Stock in 2022 was $3.874 per share.
On January 31, 2023, our Board declared a quarterly dividend of $1.036 per share of Common Stock payable on March 15, 2023, to stockholders of record as of February 17, 2023. It is the Company’s 373rd consecutive quarterly Common Stock dividend. A quarterly dividend of $0.942 per share of Class B Stock also was declared.
Unregistered Sales of Equity Securities and Use of Proceeds
None.
Issuer Purchases of Equity Securities
The following table shows the purchases of shares of Common Stock made by or on behalf of Hershey, or any “affiliated purchaser” (as defined in Rule 10b-18(a)(3) under the Securities Exchange Act of 1934, as amended) of Hershey, for each fiscal month in the three months ended December 31, 2022:
| Period | Total Number of Shares Purchased (1) | Average Price Paid per Share | Total Number of Shares Purchased as Part of Publicly Announced Plans or Programs (2) | Approximate Dollar Value of Shares that May Yet Be Purchased Under the Plans or Programs (2) | ||||||||||||||||||||||
| (in thousands of dollars) | ||||||||||||||||||||||||||
| October 3 through October 30 | — | $ | — | — | $ | 609,983 | ||||||||||||||||||||
| October 31 through November 27 | 145,701 | $ | 231.25 | — | $ | 609,983 | ||||||||||||||||||||
| November 28 through December 31 | — | $ | — | — | $ | 609,983 | ||||||||||||||||||||
| Total | 145,701 | $ | — | — |
(1) During the three months ended December 31, 2022, 145,701 shares of Common Stock were purchased in open market transactions in connection with our standing authorization to buy back shares sufficient to offset those issued under incentive compensation plans, which authorization does not have a dollar or share limit and is not included in our share repurchase authorizations described in the following note (2).
(2) In July 2018, our Board of Directors approved a $500 million share repurchase authorization. As of December 31, 2022, approximately $110 million remained available for repurchases of our Common Stock under this program. In May 2021, our Board of Directors approved an additional $500 million share repurchase authorization. This program is to commence after the existing 2018 authorization is completed and is to be utilized at management’s discretion. These share repurchase programs do not have an expiration date.
In February 2023, the Company entered into a Stock Purchase Agreement with Hershey Trust Company, as trustee for the Milton Hershey School Trust (the “School Trust”), pursuant to which the Company purchased 1,000,000 shares of the Company’s Common Stock from the School Trust at a price equal to $239.91 per share, for a total purchase price of $239.9 million. As a result of this repurchase, our July 2018 share repurchase authorization program was completed in February 2023, and approximately $370 million remains available for repurchases under our May 2021 share repurchase authorization.
| Table of Contents | The Hershey Company | 2022 Form 10-K | Page 18 | |
In February 2022, the Company entered into a Stock Purchase Agreement with Hershey Trust Company, as trustee for the School Trust, pursuant to which the Company purchased 1,000,000 shares of the Company’s Common Stock from the School Trust at a price equal to $203.35 per share, for a total purchase price of $203.4 million.
Stockholder Return Performance Graph
The following graph compares our cumulative total stockholder return (Common Stock price appreciation plus dividends, on a reinvested basis) over the last five fiscal years with the Standard & Poor’s 500 Index and the Standard & Poor’s 500 Packaged Foods Index.
Comparison of 5 Year Cumulative Total Return*
Among The Hershey Company, the S&P 500 Index,
and the S&P 500 Packaged Foods Index
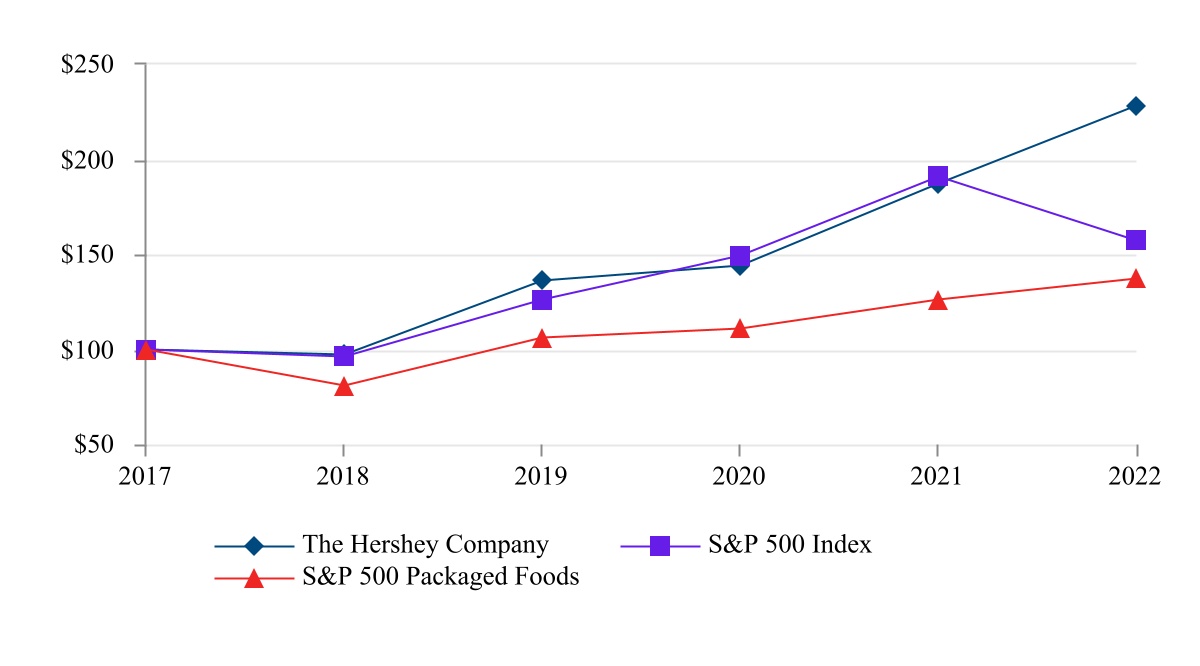
*$100 invested on December 31, 2017 in stock or index, assuming reinvestment of dividends.
| December 31, | ||||||||||||||||||||||||||||||||||||||
| Company/Index | 2017 | 2018 | 2019 | 2020 | 2021 | 2022 | ||||||||||||||||||||||||||||||||
| The Hershey Company | $ | 100 | $ | 97 | $ | 136 | $ | 144 | $ | 187 | $ | 228 | ||||||||||||||||||||||||||
| S&P 500 Index | $ | 100 | $ | 96 | $ | 126 | $ | 149 | $ | 191 | $ | 157 | ||||||||||||||||||||||||||
| S&P 500 Packaged Foods Index | $ | 100 | $ | 81 | $ | 106 | $ | 111 | $ | 126 | $ | 137 |
The stock price performance included in this graph is not necessarily indicative of future stock price performance.
Item 6. [RESERVED]
| Table of Contents | The Hershey Company | 2022 Form 10-K | Page 19 | |
Item 7. MANAGEMENT’S DISCUSSION AND ANALYSIS OF FINANCIAL CONDITION AND RESULTS OF OPERATIONS
This Management’s Discussion and Analysis (“MD&A”) is intended to provide an understanding of Hershey’s financial condition, results of operations and cash flows by focusing on changes in certain key measures from year to year. The MD&A should be read in conjunction with our Consolidated Financial Statements and accompanying Notes included in Item 8 of this Annual Report on Form 10-K. This discussion contains forward-looking statements that involve risks and uncertainties. Our actual results could differ materially from those anticipated in these forward-looking statements as a result of various factors, including those discussed elsewhere in this Annual Report on Form 10-K, particularly in Item 1A. “Risk Factors.”
The MD&A is organized in the following sections:
BUSINESS MODEL AND GROWTH STRATEGY
We are the largest producer of quality chocolate in North America, a leading snack maker in the United States and a global leader in chocolate and non-chocolate confectionery. We report our operations through three segments: (i) North America Confectionery, (ii) North America Salty Snacks and (iii) International, as discussed in Note 13 to the Consolidated Financial Statements.
Our vision is to be a leading snacking powerhouse. We aspire to be a leader in meeting consumers’ evolving snacking needs while strengthening the capabilities that drive our growth. We are focused on four strategic imperatives to ensure the Company’s success now and in the future:
- Drive Core Confection Business and Broaden Participation in Snacking. We continue to be the undisputed leader in U.S. confection by taking actions to deepen our consumer connections and utilize our beloved brands to deliver meaningful innovation, while also diversifying our portfolio to capture profitable and incremental growth across the broader snacking continuum.
◦Our products frequently play an important role in special moments among family and friends. Seasons are an important part of our business model and for consumers, as they are highly anticipated, cherished times, centered around traditions. For us, it’s an opportunity for our brands to be part of many connections during the year when family and friends gather.
◦Innovation is an important lever in this variety-seeking category and we are leveraging work from our proprietary demand landscape analytical tool to shape our future innovation and make it more impactful. We are becoming more disciplined in our focus on platform innovation, which should enable sustainable growth over time and significant extensions to our core.
◦To expand our breadth in snacking, we are focused on expanding the boundaries of our core confection brands to capture new snacking occasions and increasing our exposure into new snack categories through acquisitions. Our expansion into snacking recently has been fueled by the acquisitions of Dot’s and Pretzels in December 2021, which are included in our North America Salty Snacks segment.
- Deliver Profitable International Growth. We are focused on ensuring that we efficiently allocate our resources to the areas with the highest potential for profitable growth. We have reset our international investment strategy, while holding fast to our belief that our targeted emerging market strategy will deliver long-term, profitable growth. The uncertain macroeconomic environment in many of these markets is expected to continue and we aim to ensure our investments in these international markets are appropriate relative to the size of the opportunity.
| Table of Contents | The Hershey Company | 2022 Form 10-K | Page 20 | |
*•*Expand Competitive Advantage through Differentiated Capabilities. In order to generate actionable insights, we must acquire, integrate, access and utilize vast sources of the right data in an effective manner. We are working to leverage our advanced data and analytical techniques to gain a deep understanding of our consumers, our customers, our shoppers, our end-to-end supply chain, our retail environment and key economic drivers at both a macro and precision level, including digital transformation and new media models. In addition, we are in the process of transforming our supply chain capabilities and enterprise resource planning system, which will enable employees to work more efficiently and effectively.
*•*Responsibly Manage Our Operations to Ensure the Long-Term Sustainability of Our Business, Our Planet and Our People. We are a purpose-driven company and for more than a century, our iconic brands have been built on a foundation of community investment and connections between people around the world. We could not have achieved this without our remarkable employees who make our purpose a reality. We believe our long-standing values make our Company a special place to work.
◦We believe our employees are among our most important resources and are critical to our continued success. We utilize continuous listening surveys that are distributed throughout the year to all employees globally. These short and fast surveys reach all of our employees around the world to hear their thoughts on the Company’s direction and their place in it. These continuous touchpoints allow for real-time feedback and action from the Company. These surveys are further supplemented with quarterly and informative enterprise and team town halls, which, in conjunction with the continuous listening surveys, generate stronger employee engagement with the Company’s strategy, initiatives and leadership.
◦Our diverse and inclusive culture makes the difference across all areas of the business. Our gender representation includes women occupying many of the top positions in the Company, including Chief Executive Officer and Chairman of the Board, Chief Accounting Officer and President, Salty Snacks, and approximately 50% representation across the Company. In 2022, we maintained fair and equitable pay achievements, including 1:1 aggregate people of color pay equity for salaried employees in the United States (2021) and 1:1 aggregate gender pay (2020).
◦We have made strong progress on our ESG priorities and continue to elevate these ESG initiatives for a greater global impact. While we focus on sustainability and social impact across our value chain, we continue to improve and focus on the lives of cocoa farmers and cocoa communities, the environmental priorities of climate change and the role of packaging in our business, responsibly and sustainably sourcing the inputs to our products and increasing investments in human rights and diversity initiatives and growing diverse representation across the organization.
OVERVIEW
Hershey is a global confectionery leader known for making more moments of goodness through chocolate, sweets, mints and other great tasting snacks. We are the largest producer of quality chocolate in North America, a leading snack maker in the United States and a global leader in chocolate and non-chocolate confectionery. We market, sell and distribute our products under more than 100 brand names in approximately 80 countries worldwide.
Our principal product offerings include chocolate and non-cho
Showing the first 8K of 97K characters. Open the full section
Item 7A. QUANTITATIVE AND QUALITATIVE DISCLOSURES ABOUT MARKET RISK
We use certain derivative instruments to manage our interest rate, foreign currency exchange rate and commodity price risks. We monitor and manage these exposures as part of our overall risk management program.
We enter into interest rate swap agreements and foreign currency forward exchange contracts for periods consistent with related underlying exposures. We enter into commodities futures and options contracts and other derivative instruments for varying periods. These commodity derivative instruments are intended to be, and are effective as, economic hedges of market price risks associated with anticipated raw material purchases, energy requirements and transportation costs. We do not hold or issue derivative instruments for trading purposes and are not a party to any instruments with leverage or prepayment features.
In entering into these contracts, we have assumed the risk that might arise from the possible inability of counterparties to meet the terms of their contracts. We mitigate this risk by entering into exchange-traded contracts with collateral posting requirements and/or by performing financial assessments prior to contract execution, conducting periodic evaluations of counterparty performance and maintaining a diverse portfolio of qualified counterparties. We do not expect any significant losses from counterparty defaults.
Refer to Note 1 and Note 5 to the Consolidated Financial Statements for further discussion of these derivative instruments and our hedging policies.
Interest Rate Risk
In December 2020, our fixed-to-floating interest rate swap matured in connection with the repayment of certain long-term debt upon its maturity. Therefore, as of December 31, 2022 and December 31, 2021, we had no interest rate swap derivative instruments in a fair value hedging relationship. Prior to maturing in December 2020, the total notional amount of interest rate swaps was $350 million. The notional amount relates to fixed-to-floating interest rate swaps which convert a comparable amount of fixed-rate debt to variable rate debt. A hypothetical 100 basis point increase in interest rates applied to this variable-rate debt through its December 2020 maturity would have increased interest expense by approximately $3.2 million for 2020.
In addition, the total amount of short-term debt, net of cash, amounted to net debt of $230 million and net debt of $610 million, respectively, at December 31, 2022 and 2021. A hypothetical 100 basis point increase in interest rates applied to this variable-rate short-term debt as of December 31, 2022 would have changed interest expense by approximately $4.5 million for 2022 and $2.4 million for 2021.
We consider our current risk related to market fluctuations in interest rates on our remaining debt portfolio, excluding fixed-rate debt converted to variable rates with fixed-to-floating instruments, to be minimal since this debt is largely long-term and fixed-rate in nature. Generally, the fair market value of fixed-rate debt will increase as interest rates fall and decrease as interest rates rise. A 100 basis point increase in market interest rates would decrease the fair value of our fixed-rate long-term debt at December 31, 2022 and December 31, 2021 by approximately $187 million and $319 million, respectively. However, since we currently have no plans to repurchase our outstanding fixed-rate instruments before their maturities, the impact of market interest rate fluctuations on our long-term debt does not affect our results of operations or financial position.
| Table of Contents | The Hershey Company | 2022 Form 10-K | Page 41 | |
Foreign Currency Exchange Rate Risk
We are exposed to currency fluctuations related to manufacturing or selling products in currencies other than the U.S. dollar. We may enter into foreign currency forward exchange contracts to reduce fluctuations in our long or short currency positions relating primarily to purchase commitments or forecasted purchases for equipment, raw materials and finished goods denominated in foreign currencies. We also may hedge payment of forecasted intercompany transactions with our subsidiaries outside of the United States. We generally hedge foreign currency price risks for periods from 3 to 12 months.
A summary of foreign currency forward exchange contracts and the corresponding amounts at contracted forward rates is as follows:
| December 31, | 2022 | 2021 | ||||||||||||||||||||||||
| Contract Amount | Primary Currencies | Contract Amount | Primary Currencies | |||||||||||||||||||||||
| In millions of dollars | ||||||||||||||||||||||||||
| Foreign currency forward exchange contracts to purchase foreign currencies | $ | 58.3 | Euros Malaysian ringgit | $ | 53.1 | Euros Malaysian ringgit British pound | ||||||||||||||||||||
| Foreign currency forward exchange contracts to sell foreign currencies | $ | 119.6 | Canadian dollars Brazilian reals Japanese yen Mexican Pesos | $ | 144.7 | Canadian dollars Brazilian reals Japanese yen |
The fair value of foreign currency forward exchange contracts represents the difference between the contracted and current market foreign currency exchange rates at the end of the period. We estimate the fair value of foreign currency forward exchange contracts on a quarterly basis by obtaining market quotes of spot and forward rates for contracts with similar terms, adjusted where necessary for maturity differences. At December 31, 2022 and 2021, the net fair value of these instruments was an asset of $3.9 million and an asset of $2.8 million, respectively. In addition, assuming an unfavorable 10% change in year-end foreign currency exchange rates, the fair value of these instruments would have declined by $18.4 million and $24.8 million, respectively, generally offset by a reduction in foreign exchange associated with our transactional activities.
Commodities—Price Risk Management and Futures Contracts
Our most significant raw material requirements include cocoa products, sugar, corn products, dairy products, wheat, peanuts and almonds. The cost of cocoa products and prices for related futures contracts and costs for certain other raw materials historically have been subject to wide fluctuations attributable to a variety of factors. These factors include:
-
Commodity market fluctuations;
-
Currency exchanges rates;
-
Imbalances between supply and demand;
-
Rising levels of inflation and interest rates related to domestic and global economic conditions or supply chain issues;
-
The effects of climate change and extreme weather on crop yield and quality;
-
Speculative influences;
-
Trade agreements among producing and consuming nations;
-
Supplier compliance with commitments;
-
Import/export requirements for raw materials and finished goods;
-
Political unrest in producing countries;
-
Introduction of living income premiums or similar requirements;
-
Changes in governmental agricultural programs and energy policies; and
-
Other events beyond our control such as the impacts on the business or supply chain arising from the conflict between Russia and Ukraine.
| Table of Contents | The Hershey Company | 2022 Form 10-K | Page 42 | |
We use futures and options contracts and other commodity derivative instruments in combination with forward purchasing of cocoa products, sugar, corn products, certain dairy products, wheat products, natural gas and diesel fuel primarily to mitigate price volatility and provide visibility to future costs within our supply chain. Currently, active futures contracts are not available for use in pricing our other major raw material requirements, primarily peanuts and almonds. We attempt to minimize the effect of future raw material and energy price fluctuations by using derivatives and forward purchasing to cover future manufacturing requirements generally for 3 to 24 months. However, dairy futures liquidity is not as developed as many of the other commodity futures markets and, therefore, it can be difficult to hedge dairy costs for extended periods of time. We use diesel fuel futures to minimize price fluctuations associated with our transportation costs. Our commodity procurement practices are intended to mitigate price volatility and provide visibility to future costs, but also may potentially limit our ability to benefit from possible price decreases. Our costs for major raw materials will not necessarily reflect market price fluctuations because of our forward purchasing and hedging practices.
Cocoa Products
During 2022, average cocoa futures contract prices decreased 0.9% compared with 2021 and continued to trade in a narrow range between $1.06 and $1.22 per pound, based on the Intercontinental Exchange futures contract. Production was down significantly in Ghana by nearly 30%, while it was stable in the rest of West Africa. As consumption remained strong, the large surplus in the 2020 - 2021 season became a small deficit in the 2022 season. The global surplus of the 2020 - 2021 season weighed on the price outlook for the first half of 2022 and the futures market corrected to accommodate the Living Income Differential being imposed by the Ghana and Ivory Coast cocoa marketing boards, leading to fairly similar price levels to the previous year. The table below shows annual average cocoa futures prices and the highest and lowest monthly averages for each of the calendar years indicated. The prices reflect the monthly averages of the quotations at noon of the three active futures trading contracts closest to maturity on the Intercontinental Exchange.
| Cocoa Futures Contract Prices (dollars per pound) | ||||||||||||||||||||||||||||||||
| 2022 | 2021 | 2020 | 2019 | 2018 | ||||||||||||||||||||||||||||
| Annual Average | $ | 1.13 | $ | 1.14 | $ | 1.11 | $ | 1.03 | $ | 1.06 | ||||||||||||||||||||||
| High | 1.22 | 1.27 | 1.29 | 1.14 | 1.23 | |||||||||||||||||||||||||||
| Low | 1.06 | 1.04 | 1.00 | 0.90 | 0.88 |
Source: International Cocoa Organization Quarterly Bulletin of Cocoa Statistics
Our costs for cocoa products will not necessarily reflect market price fluctuations because of our forward purchasing and hedging practices, premiums and discounts reflective of varying delivery times, and supply and demand for our specific varieties and grades of cocoa liquor, cocoa butter and cocoa powder. As a result, the average futures contract prices are not necessarily indicative of our average costs.
Sugar
The price of sugar is subject to price supports under U.S. farm legislation. Such legislation establishes import quotas and duties to support the price of sugar. As a result, sugar prices paid by users in the U.S. are currently higher than prices on the world sugar market. The U.S. delivered east coast refined sugar prices traded in a range from $0.53 to $0.71 per pound during 2022. Prices were historically high throughout 2022 due to lack of imports by the U.S. government resulting in an extremely tight domestic raw sugar market and strong demand which resulted in a scarcity market for much of the year.
Corn Products
We use corn futures to price our corn sweetener product requirements. The conflict between Russia and Ukraine caused a tightness for global grain stocks in 2022. Corn prices traded in a range from $5.62 to $8.25 per bushel during 2022. Corn sweetener prices were also higher as strong demand resulted in a scarcity market during the year.
| Table of Contents | The Hershey Company | 2022 Form 10-K | Page 43 | |
Dairy Products
During 2022 prices for fluid dairy milk ranged from a low of $0.23 per pound to a high of $0.26 per pound, on a Class IV milk basis. Fluid dairy milk prices were higher than 2021, driven by declines in U.S. milk production and higher global dairy demand.
Wheat Products
In 2022 we continued utilizing soft and hard wheat futures as a risk management tool for our flour purchasing. The conflict between Russia and Ukraine, in addition to poor U.S. weather, resulted in uncertainty in the wheat market and impacted global availability of supplies. Wheat stock levels were at historic 15-year lows and prices reached historic highs in 2022. Hard wheat prices traded in the range of $7.72 to $13.21 per bushel during 2022, while soft wheat prices traded in the range of $7.40 to $12.29 per bushel during 2022.
Peanuts and Almonds
Peanut prices in the U.S. ranged from a low of $0.55 per pound to a high of $0.64 per pound during 2022. Prices rose this year due to higher competing crop prices and a smaller peanut crop. Almond prices traded in the range of $2.00 per pound to $2.25 per pound during 2022. Prices were lower than 2021 as a result of large crop and high inventory levels.
Changes in the Value of Futures Contracts
We make or receive cash transfers to or from commodity futures brokers on a daily basis reflecting changes in the value of futures contracts on the Intercontinental Exchange or various other exchanges. These changes in value represent unrealized gains and losses. The cash transfers offset higher or lower cash requirements for the payment of future invoice prices of raw materials, energy requirements and transportation costs.
Commodity Sensitivity Analysis
Our open commodity derivative contracts had a notional value of $243.0 million as of December 31, 2022 and $313.2 million as of December 31, 2021. At the end of 2022, the potential change in fair value of commodity derivative instruments, assuming a 10% decrease in the underlying commodity price, would have increased our net unrealized losses in 2022 by $25.1 million, generally offset by a reduction in the cost of the underlying commodity purchases.
| Table of Contents | The Hershey Company | 2022 Form 10-K | Page 44 | |
Item 8. FINANCIAL STATEMENTS AND SUPPLEMENTARY DATA
INDEX TO CONSOLIDATED FINANCIAL STATEMENTS
| Table of Contents | The Hershey Company | 2022 Form 10-K | Page 45 | |
REPORT OF INDEPENDENT REGISTERED PUBLIC ACCOUNTING FIRM
To the Stockholders and the Board of Directors of The Hershey Company
Opinion on the Financial Statements
We have audited the accompanying consolidated balance sheets of The Hershey Company (the Company) as of December 31, 2022 and 2021, the related consolidated statements of income, comprehensive income, cash flows, and stockholders' equity for each of the three years in the period ended December 31, 2022, and the related notes and financial statement schedule listed in the Index at Item 15(a)(2) (collectively referred to as the “consolidated financial statements”). In our opinion, the consolidated financial statements present fairly, in all material respects, the financial position of the Company at December 31, 2022 and 2021, and the results of its operations and its cash flows for each of the three years in the period ended December 31, 2022, in conformity with U.S. generally accepted accounting principles.
We also have audited, in accordance with the standards of the Public Company Accounting Oversight Board (United States) (PCAOB), the Company's internal control over financial reporting as of December 31, 2022, based on criteria established in Internal Control-Integrated Framework issued by the Committee of Sponsoring Organizations of the Treadway Commission (2013 framework), and our report dated February 17, 2023 expressed an unqualified opinion thereon.
Basis for Opinion
These financial statements are the responsibility of the Company's management. Our responsibility is to express an opinion on the Company’s financial statements based on our audits. We are a publ
Showing the first 8K of 241K characters. Open the full section
Item 9. CHANGES IN AND DISAGREEMENTS WITH ACCOUNTANTS ON ACCOUNTING AND FINANCIAL DISCLOSURE
None.
Item 9A. CONTROLS AND PROCEDURES
Evaluation of Disclosure Controls and Procedures
The Company’s management, with the participation of the Company’s Chief Executive Officer and Chief Financial Officer, has evaluated the effectiveness of the Company’s disclosure controls and procedures, as defined in Rules 13a-15(e) and 15d-15(e) of the Securities Exchange Act of 1934 (the “Exchange Act”), as of December 31, 2022. Based on that evaluation, the Company’s Chief Executive Officer and Chief Financial Officer concluded that the Company’s disclosure controls and procedures were effective as of December 31, 2022.
Design and Evaluation of Disclosure Controls and Procedures
Disclosure controls and procedures are controls and other procedures that are designed to ensure that information required to be disclosed in the Company’s reports filed or submitted under the Exchange Act is recorded, processed, summarized and reported within the time periods specified in the Securities and Exchange Commission’s rules and forms. Disclosure controls and procedures include, without limitation, controls and procedures designed to ensure that information required to be disclosed in the Company’s reports filed under the Exchange Act is accumulated and communicated to management, including the Company’s Chief Executive Officer and Chief Financial Officer, as appropriate, to allow timely decisions regarding required disclosure.
Changes in Internal Control Over Financial Reporting
Management’s report on the Company’s internal control over financial reporting appears on the following page. There were no changes in the Company’s internal control over financial reporting during the fourth quarter of 2022 that have materially affected, or are reasonably likely to materially affect, the Company’s internal control over financial reporting.
We rely extensively on information systems and technology to manage our business and summarize operating results. We are in the process of a multi-year implementation of a new global enterprise resource planning (“ERP”) system, which will replace our existing operating and financial systems. The ERP system is designed to accurately maintain the Company’s financial records, enhance operational functionality and provide timely information to the Company’s management team related to the operation of the business. The implementation is expected to occur in phases over the next several years. During the third quarter of 2022, we completed the implementation of our new ERP system for one operating segment which is included in our International segment. The portion of the transition to the new ERP system which we have completed to date did not result in significant changes in our internal control over financial reporting. However, as the next phases of the updated processes are rolled out in connection with the ERP implementation, we will give appropriate consideration to whether these process changes necessitate changes in the design of and testing for effectiveness of internal controls over financial reporting.
| Table of Contents | The Hershey Company | 2022 Form 10-K | Page 95 | |
MANAGEMENT’S ANNUAL REPORT ON INTERNAL CONTROL OVER FINANCIAL REPORTING
The management of The Hershey Company is responsible for establishing and maintaining adequate internal control over financial reporting, as such term is defined in Exchange Act Rule 13a-15(f). The Company’s internal control system was designed to provide reasonable assurance to the Company’s management and Board of Directors regarding the preparation and fair presentation of published financial statements.
All internal control systems, no matter how well designed, have inherent limitations. Therefore, even those systems determined to be effective can provide only reasonable assurance with respect to financial statement preparation and presentation.
The Company’s management, including the Company’s Chief Executive Officer and Chief Financial Officer, assessed the effectiveness of the Company’s internal control over financial reporting as of December 31, 2022. In making this assessment, the Company’s management used the criteria set forth by the Committee of Sponsoring Organizations of the Treadway Commission (COSO) in Internal Control–Integrated Framework (2013 edition). Based on this assessment, management concluded that, as of December 31, 2022, the Company’s internal control over financial reporting was effective based on those criteria.
The Company’s independent auditors have audited, and reported on, the Company’s internal control over financial reporting as of December 31, 2022.
Item 9B. OTHER INFORMATION
None.
Item 9C. DISCLOSURE REGARDING FOREIGN JURISDICTIONS THAT PREVENT INSPECTIONS
Item 10. DIRECTORS, EXECUTIVE OFFICERS AND CORPORATE GOVERNANCE.
The information regarding executive officers of the Company required by Item 401 of SEC Regulation S-K is incorporated herein by reference from the disclosure included under the caption “Supplemental Item. Information About Out Executive Officers” at the end of Part I of this Annual Report on Form 10-K.
The information required by Item 401 of SEC Regulation S-K concerning the directors and nominees for director of the Company, together with a discussion of the specific experience, qualifications, attributes and skills that led the Board to conclude that the director or nominee should serve as a director at this time, will be located in the Proxy Statement in the section entitled “Proposal No. 1 – Election of Directors,” which information is incorporated herein by reference.
Information regarding the identification of the Audit Committee as a separately-designated standing committee of the Board and information regarding the status of one or more members of the Audit Committee as an “audit committee financial expert” will be located in the Proxy Statement in the section entitled “Corporate Governance – Committees of the Board,” which information is incorporated herein by reference.
Information regarding our Code of Conduct applicable to our directors, officers and employees is located in Part I of this Annual Report on Form 10-K, under the heading “Available Information.”
Item 11. EXECUTIVE COMPENSATION.
Information regarding the compensation of each of our named executive officers, including our Chief Executive Officer that is required by this Item 11 will be located in the Proxy Statement in the section entitled “Compensation Discussion & Analysis” and is incorporated herein by reference. Information regarding the compensation of our directors will be located in the Proxy Statement in the section entitled “Non-Employee Director Compensation,” which information is incorporated herein by reference.
The information required by Item 407(e)(4) of SEC Regulation S-K will be located in the Proxy Statement in the section entitled “Compensation Committee Interlocks and Insider Participation,” which information is incorporated herein by reference.
The information required by Item 407(e)(5) of SEC Regulation S-K will be located in the Proxy Statement in the section entitled “Compensation Committee Report,” which information is incorporated herein by reference.
Item 12. SECURITY OWNERSHIP OF CERTAIN BENEFICIAL OWNERS AND MANAGEMENT AND RELATED STOCKHOLDER MATTERS.
Information concerning ownership of our voting securities by certain beneficial owners, individual nominees for director, the named executive officers, including persons serving as our Chief Executive Officer and Chief Financial Officer, and directors and executive officers as a group, will be located in the Proxy Statement in the section entitled “Share Ownership of Directors, Management and Certain Beneficial Owners,” which information is incorporated herein by reference.
Information regarding all of the Company’s equity compensation plans will be located in the Proxy Statement in the section entitled “Compensation Committee Report – Equity Compensation Plan Information,” which information is incorporated herein by reference.
| Table of Contents | The Hershey Company | 2022 Form 10-K | Page 97 | |
Item 13. CERTAIN RELATIONSHIPS AND RELATED TRANSACTIONS, AND DIRECTOR INDEPENDENCE.
Information regarding transactions with related persons will be located in the Proxy Statement in the section entitled “Certain Transactions and Relationships,” which information is incorporated herein by reference. Information regarding director independence will be located in the Proxy Statement in the section entitled “Corporate Governance – Director Independence,” which information is incorporated herein by reference.
Item 14. PRINCIPAL ACCOUNTANT FEES AND SERVICES.
Information regarding “Principal Accounting Fees and Services,” including the policy regarding pre-approval of audit and non-audit services performed by our Company’s independent auditors, will be located in the Proxy Statement in the section entitled “Information about Our Independent Auditors,” which information is incorporated herein by reference.
| Table of Contents | The Hershey Company | 2022 Form 10-K | Page 98 | |
PART IV
Item 15. EXHIBITS AND FINANCIAL STATEMENT SCHEDULES
Item 15(a)(1): Financial Statements
The audited consolidated financial statements of The Hershey Company and its subsidiaries and the Report of Independent Registered Public Accounting Firm thereon, as required to be filed, are located under Item 8 of this Annual Report on Form 10-K.
Item 15(a)(2): Financial Statement Schedule
Schedule II—Valuation and Qualifying Accounts for The Hershey Company and its subsidiaries for the years ended December 31, 2022, 2021 and 2020 is filed as part of this Annual Report on Form 10-K as required by Item 15(c).
We omitted other schedules because they are not applicable or the required information is set forth in the consolidated financial statements or notes thereto.
Item 15. (a)(3): Exhibits
The following exhibits are filed as part of, or incorporated by reference into, this Annual Report on Form 10-K.
| Table of Contents | The Hershey Company | 2022 Form 10-K | Page 99 | |
| Table of Contents | The Hershey Company | 2022 Form 10-K | Page 100 | |
| Table of Contents | The Hershey Company | 2022 Form 10-K | Page 101 | |
Item 16. FORM 10-K SUMMARY
None.
| Table of Contents | The Hershey Company | 2022 Form 10-K | Page 102 | |
SIGNATURES
Pursuant to the requirements of Section 13 or 15(d) of the Securities Exchange Act of 1934, the Company has duly caused this report to be signed on its behalf by the undersigned, thereunto duly authorized, this 17th day of February, 2023.
| THE HERSHEY COMPANY | ||||||||
| (Registrant) | ||||||||
| By: | /s/ STEVEN E. VOSKUIL | |||||||
| Steven E. Voskuil | ||||||||
| Senior Vice President, Chief Financial Officer |
Pursuant to the requirements of the Securities Exchange Act of 1934, this report has been signed below by the following persons on behalf of the Company and in the capacities and on the date indicated.
| Signature | Title | Date | ||||||||||||
| /s/ MICHELE G. BUCK | Chairman of the Board, President and Chief Executive Officer | February 17, 2023 | ||||||||||||
| Michele G. Buck | (Principal Executive Officer) | |||||||||||||
| /s/ STEVEN E. VOSKUIL | Senior Vice President, Chief Financial Officer | February 17, 2023 | ||||||||||||
| Steven E. Voskuil | (Principal Financial Officer) | |||||||||||||
| /s/ JENNIFER L. MCCALMAN | Vice President, Chief Accounting Officer | February 17, 2023 | ||||||||||||
| Jennifer L. McCalman | (Principal Accounting Officer) | |||||||||||||
| /s/ ANTHONY J. PALMER | Lead Independent Director | February 17, 2023 | ||||||||||||
| Anthony J. Palmer | ||||||||||||||
| /s/ PAMELA M. ARWAY | Director | February 17, 2023 | ||||||||||||
| Pamela M. Arway | ||||||||||||||
| /s/ JAMES W. BROWN | Director | February 17, 2023 | ||||||||||||
| James W. Brown | ||||||||||||||
| /s/ VICTOR L. CRAWFORD | Director | February 17, 2023 | ||||||||||||
| Victor L. Crawford | ||||||||||||||
| /s/ ROBERT M. DUTKOWSKY | Director | February 17, 2023 | ||||||||||||
| Robert M. Dutkowsky | ||||||||||||||
| /s/ MARY KAY HABEN | Director | February 17, 2023 | ||||||||||||
| Mary Kay Haben | ||||||||||||||
| /s/ JAMES C. KATZMAN | Director | February 17, 2023 | ||||||||||||
| James C. Katzman | ||||||||||||||
| /s/ M. DIANE KOKEN | Director | February 17, 2023 | ||||||||||||
| M. Diane Koken | ||||||||||||||
| /s/ ROBERT M. MALCOLM | Director | February 17, 2023 | ||||||||||||
| Robert M. Malcolm | ||||||||||||||
| /s/ JUAN R. PEREZ | Director | February 17, 2023 | ||||||||||||
| Juan R. Perez | ||||||||||||||
| /s/ WENDY L. SCHOPPERT | Director | February 17, 2023 | ||||||||||||
| Wendy L. Schoppert |
| Table of Contents | The Hershey Company | 2022 Form 10-K | Page 103 | |
THE HERSHEY COMPANY AND SUBSIDIARIES
SCHEDULE II—VALUATION AND QUALIFYING ACCOUNTS
For the Years Ended December 31, 2022, 2021 and 2020
| Additions | ||||||||||||||||||||||||||||||||
| Description | Balance at Beginning of Period | Charged to Costs and Expenses | Charged to Other Accounts | Deductions from Reserves | Balance at End of Period | |||||||||||||||||||||||||||
| In thousands of dollars | ||||||||||||||||||||||||||||||||
| For the year ended December 31, 2022 | ||||||||||||||||||||||||||||||||
| Allowances deducted from assets | ||||||||||||||||||||||||||||||||
| Accounts receivable—trade, net (a) | $ | 28,837 | $ | 228,463 | $ | — | $ | (231,299) | $ | 26,001 | ||||||||||||||||||||||
| Valuation allowance on net deferred taxes (b) | 184,896 | 9,578 | — | (56,943) | 137,531 | |||||||||||||||||||||||||||
| Inventory obsolescence reserve (c) | 19,472 | 44,497 | — | (34,615) | 29,354 | |||||||||||||||||||||||||||
| Total allowances deducted from assets | $ | 233,205 | $ | 282,538 | $ | — | $ | (322,857) | $ | 192,886 | ||||||||||||||||||||||
| For the year ended December 31, 2021 | ||||||||||||||||||||||||||||||||
| Allowances deducted from assets | ||||||||||||||||||||||||||||||||
| Accounts receivable—trade, net (a) | $ | 24,975 | $ | 198,608 | $ | — | $ | (194,746) | $ | 28,837 | ||||||||||||||||||||||
| Valuation allowance on net deferred taxes (b) | 193,310 | 9,759 | — | (18,173) | 184,896 | |||||||||||||||||||||||||||
| Inventory obsolescence reserve (c) | 17,703 | 27,657 | — | (25,888) | 19,472 | |||||||||||||||||||||||||||
| Total allowances deducted from assets | $ | 235,988 | $ | 236,024 | $ | — | $ | (238,807) | $ | 233,205 | ||||||||||||||||||||||
| For the year ended December 31, 2020 | ||||||||||||||||||||||||||||||||
| Allowances deducted from assets | ||||||||||||||||||||||||||||||||
| Accounts receivable—trade, net (a) | $ | 24,966 | $ | 180,764 | $ | — | $ | (180,755) | $ | 24,975 | ||||||||||||||||||||||
| Valuation allowance on net deferred taxes (b) | 206,743 | 2,603 | — | (16,036) | 193,310 | |||||||||||||||||||||||||||
| Inventory obsolescence reserve (c) | 22,049 | 27,162 | — | (31,508) | 17,703 | |||||||||||||||||||||||||||
| Total allowances deducted from assets | $ | 253,758 | $ | 210,529 | $ | — | $ | (228,299) | $ | 235,988 | ||||||||||||||||||||||
(a) Includes allowances for doubtful accounts, anticipated discounts and write-offs of uncollectible accounts receivable.
(b) Includes adjustments to the valuation allowance for deferred tax assets that we do not expect to realize, as well as the release of valuation allowances.
(c) Includes adjustments to the inventory reserve, transfers, disposals and write-offs of obsolete inventory.
| Table of Contents | The Hershey Company | 2022 Form 10-K | Page 104 | |