 filings.tools
Hubbell 10-K 2017-12-31
Filed 2018-02-15. 21 sections, 393K characters. Original on sec.gov · Markdown · JSON
Cover and table of contents
10-K 1 hubb-20171231x10k.htm FORM 10-K
UNITED STATES
SECURITIES AND EXCHANGE COMMISSION
Washington, DC 20549
FORM 10-K
þ ANNUAL REPORT PURSUANT TO SECTION 13 OR 15(d) OF THE SECURITIES EXCHANGE ACT OF 1934
FOR THE FISCAL YEAR ENDED DECEMBER 31, 2017
¨ TRANSITION REPORT PURSUANT TO SECTION 13 OR 15(d) OF THE SECURITIES EXCHANGE ACT OF 1934
Commission File Number 1-2958

HUBBELL INCORPORATED
(Exact name of registrant as specified in its charter)
| STATE OF CONNECTICUT | 06-0397030 |
| (State or other jurisdiction of incorporation or organization) | (I.R.S. Employer Identification No.) |
| 40 Waterview Drive, Shelton, CT | 06484 |
| (Address of principal executive offices) | (Zip Code) |
| (475) 882-4000 | |
| (Registrant's telephone number, including area code) |
| SECURITIES REGISTERED PURSUANT TO SECTION 12(b) OF THE ACT: | |
| Title of each Class | Name of Exchange on which Registered |
| Common Stock — par value $0.01 per share | New York Stock Exchange |
| SECURITIES REGISTERED PURSUANT TO SECTION 12(g) OF THE ACT: | |
| NONE |
| Indicate by check mark | Yes | No | |||
| • | if the registrant is a well-known seasoned issuer, as defined in Rule 405 of the Securities Act. | þ | ¨ | ||
| • | if the registrant is not required to file reports pursuant to Section 13 or 15(d) of the Securities Exchange Act of 1934. | ¨ | þ | ||
| • | if the registrant (1) has filed all reports required to be filed by Section 13 or 15(d) of the Securities Exchange Act of 1934 during the preceding 12 months (or for such shorter period that the registrant was required to file such report), and (2) has been subject to such filing requirements for the past 90 days. | þ | ¨ | ||
| • | whether the registrant has submitted electronically and posted on its corporate Web site, if any, every Interactive Data File required to be submitted and posted pursuant to Rule 405 of Regulation S-T (§232.405 of this chapter) during the preceding 12 months (or for such shorter period that the registrant was required to submit and post such files). | þ | ¨ | ||
| • | if disclosure of delinquent filers pursuant to Item 405 of Regulation S-K is not contained herein, and will not be contained, to the best of registrant’s knowledge, in definitive proxy or information statements incorporated by reference in Part III of this Form 10-K or any amendment to this Form 10-K. | ¨ | |||
| • | whether the registrant is a large accelerated filer, an accelerated filer, a non-accelerated filer or a smaller reporting company. See the definitions of “large accelerated filer,” “accelerated filer” and “smaller reporting company” in Rule 12b-2 of the Exchange Act. (Check one): | ||||
| Large accelerated filer þ | Accelerated filer ¨ | Non-accelerated filer ¨ (Do not check if a smaller reporting company) | Smaller reporting company ¨ | ||
| Emerging growth company ¨ | If an emerging growth company, indicate by check mark if the registrant has elected not to use the extended transition period for complying with any new or revised financial accounting standard provided pursuant to Section 13(a) of the Exchange Act. ¨ | ||||
| • whether the registrant is a shell company (as defined in Rule 12b-2 of the Exchange Act). | ¨ | þ |
The approximate aggregate market value of the voting stock held by non-affiliates of the registrant as of June 30, 2017 was $6,149,647,615*. The number of shares outstanding of Hubbell Common Stock as of February 12, 2018 is 54,822,923.
DOCUMENTS INCORPORATED BY REFERENCE
Portions of the definitive proxy statement for the annual meeting of shareholders scheduled to be held on May 1, 2018, to be filed with the Securities and Exchange Commission (the “SEC”), are incorporated by reference in answer to Part III of this Form 10-K.
*Calculated by excluding all shares held by Executive Officers and Directors of registrant without conceding that all such persons or entities are “affiliates” of registrant for purpose of the Federal Securities Laws.
| 2 | HUBBELL INCORPORATED - Form 10-K |
| PART I |
Item 1. Business
Hubbell Incorporated (herein referred to as “Hubbell”, the “Company”, the “registrant”, “we”, “our” or “us”, which references shall include its divisions and subsidiaries as the context may require) was founded as a proprietorship in 1888, and was incorporated in Connecticut in 1905. Hubbell is primarily engaged in the design, manufacture and sale of quality electrical and electronic products for a broad range of non-residential and residential construction, industrial and utility applications. Products are either sourced complete, manufactured or assembled by subsidiaries in the United States, Canada, Switzerland, Puerto Rico, Mexico, the People’s Republic of China (“China”), the United Kingdom (“UK”), Brazil, Australia, Spain and Ireland. Hubbell also participates in joint ventures in Taiwan, Hong Kong and Philippines, and maintains offices in Singapore, Italy, China, India, Mexico, South Korea, Chile, and countries in the Middle East.
The Company’s reporting segments consist of the Electrical and the Power segments, as described below. See also Item 7. Management’s Discussion and Analysis – “Executive Overview
of the Business”, and “Results of Operations” as well as Note 19 — Industry Segments and Geographic Area Information in the Notes to Consolidated Financial Statements.
The Company’s annual report on Form 10-K, quarterly reports on Form 10-Q, current reports on Form 8-K, and all amendments to those reports are made available free of charge through the Investor Relations section of the Company’s website at http://www.hubbell.com as soon as practicable after such material is electronically filed with, or furnished to, the SEC. These filings are also available for reading and copying at the SEC’s Public Reference Room at 100 F Street N.E., Washington, D.C. 20549. Information on the operation of the Public Reference Room may be obtained by calling the SEC at 1-800-SEC-0330. In addition, the Company’s SEC filings can be accessed from the SEC’s homepage on the Internet at http://www.sec.gov. The information contained on the Company’s website or connected to our website is not incorporated by reference into this Annual Report on Form 10-K and should not be considered part of this report.
Electrical Segment
The Electrical segment (69% of consolidated revenues in 2017 and 70% in 2016 and 2015) is comprised of businesses that sell stock and custom products including standard and special application wiring device products, rough-in electrical products, connector and grounding products, lighting fixtures and controls, components and assemblies for the natural gas distribution market, as well as other electrical equipment.
Products of the Electrical segment are typically used in and around industrial, commercial and institutional facilities by electrical contractors, maintenance personnel, electricians, utilities, and telecommunications companies. In addition, certain businesses design and manufacture a variety of high voltage test and measurement equipment, industrial controls and communication systems used in the non-residential and industrial markets. Many of these products are designed such that they can also be used in harsh and hazardous locations where a potential for fire and explosion exists due to the presence of flammable gasses and vapors. Harsh and hazardous products are primarily used in the oil and gas (onshore and offshore) and mining industries. There are also a variety of lighting fixtures, wiring devices and electrical products that have residential and utility applications, including residential products with Internet-of-Things ("IoT") enabled technologies.
These products are primarily sold through electrical and industrial distributors, home centers, retail and hardware outlets, lighting showrooms and residential product oriented internet sites. Special application products are primarily sold through wholesale distributors to contractors, industrial customers and original equipment manufacturers (“OEMs”). High voltage products are sold primarily by direct sales to customers through our sales engineers.
Hubbell maintains a sales and marketing organization to assist potential users with the application of certain products to their specific requirements, and with architects, engineers, industrial designers, OEMs and electrical contractors for the design of electrical systems to meet the specific requirements of industrial, non-residential and residential users. Hubbell is also represented by independent manufacturers’ sales agents for many of its product offerings.
| HUBBELL INCORPORATED - Form 10-K | 3 |
The Electrical segment, manufactures and sells thousands of wiring and electrical products, lighting fixtures and controls for indoor and outdoor applications as well as specialty lighting and communications products. The products within the segment have applications in the non-residential, residential, industrial, and energy-related (oil and gas) markets. Fast growing trends within the industry are the adoption of light emitting diode (“LED”) technology as the light source as well as products with embedded IoT technologies. The Company has a broad array of LED-luminaire products within its portfolio and the majority of new product development efforts are oriented towards expanding those offerings. In 2017, the Company expanded its research and development capabilities in new technologies through the acquisition of iDevices, a developer with expertise in IoT technologies and a platform of IoT-enabled home automation products. Within the Electrical segment, products include items such as:
| Commercial and Industrial | |||||
| • | Wiring devices & accessories | • | Junction boxes, plugs & receptacles | • | Cable reels |
| • | Switches & dimmers | • | Steel & plastic enclosures | • | Datacom connectivity & enclosures |
| • | Ground fault devices | • | Pin & sleeve devices | • | High voltage test systems |
| • | Electrical motor controls | ||||
| Lighting | |||||
| • | Canopy lights | • | Parking lot/parking garage fixtures | • | Decorative landscape fixtures |
| • | Emergency lighting/exit signs | • | Bollards | • | Fluorescent fixtures |
| • | Floodlights & poles | • | Bath/vanity fixtures & fans | • | Ceiling fans |
| • | LED components | • | Chandeliers & sconces | • | Site & area lighting |
| • | Recessed, surface mounted & track fixtures | • | Athletic & recreational field fixtures | • | Occupancy, dimming & daylight harvesting sensors |
| Construction and Energy | |||||
| • | Mechanical connectors | • | Gas connectors and assemblies | • | Specialty communications equipment |
| • | Mechanical grounding devices | • | Installation tooling | • | Mining communication & controls |
| • | Compression connectors | • | Specialty lighting | • | Cable glands & fittings |
| • | Safety equipment |
These products are sold under various brands and/or trademarks, including:
| Commercial and Industrial | |||||||||
| • | Hubbell® | • | Bell® | • | Raco® | • | Gleason Reel® | • | ACME Electric® |
| • | Kellems® | • | TayMac® | • | Hipotronics® | • | Powerohm™ | • | EC&M Design® |
| • | Bryant® | • | Wiegmann® | • | Haefely® | • | iDevices® | ||
| Lighting | |||||||||
| • | Kim Lighting® | • | Beacon Products™ | • | Spaulding Lighting™ | • | Kurt Versen® | • | Litecontrol™ |
| • | Sportsliter Solutions™ | • | Columbia Lighting® | • | Alera Lighting® | • | Prescolite® | • | Dual-Lite® |
| • | Security Lighting™ | • | Progress Lighting Design® | • | Hubbell® Outdoor Lighting™ | • | Architectural Area Lighting™ | ||
| Construction and Energy | |||||||||
| • | Burndy® | • | Killark® | • | GAI-Tronics® | • | Gas Breaker® | • | R.W. Lyall™ |
| • | CMC® | • | Hawke™ | • | Chalmit™ | • | Vantage Technology® | • | Continental® |
| • | Austdac™ | • | AEC™ |
| 4 | HUBBELL INCORPORATED - Form 10-K |
Power Segment
The Power segment (31% of consolidated revenues in 2017 and 30% in 2016 and 2015) consists of operations that design and manufacture various distribution, transmission, substation and telecommunications products primarily used by the electrical utility industry. In addition, certain of these products are used in the civil construction and transportation industries. Products are sold to distributors and directly to users such as utilities, telecommunication companies, pipeline and mining operations, industrial firms, construction and engineering firms. While Hubbell believes its sales in this area are not materially dependent upon any customer or group of customers, a substantial decrease in purchases by electrical utilities would affect this segment.
On February 2, 2018 the Company acquired Meter Readings Holding Group, LLC ("Aclara Technologies" or "Aclara") for approximately $1.1 billion. Aclara is a provider of smart infrastructure solutions for electric, gas, and water utilities, with advanced metering solutions and grid monitoring sensor technology, as well as leading software enabled installation services. The acquisition extends the Power segment's capabilities into smart automation technologies, accelerates ongoing innovation efforts to address utility customer demand for data and integrated solutions, and expands the segment's reach to a broader set of utility customers.
Hubbell's Power segment manufactures and sells a wide variety of electrical distribution, transmission, substation utility and telecommunications products. These products include items such as:
| • | Arresters | • | Bushings | • | Grounding & bonding equipment |
| • | Cutouts & fuse links | • | Insulators | • | Programmable reclosers |
| • | Pole line hardware | • | Cable terminations & accessories | • | Sectionalizers |
| • | Helical anchors & foundations | • | Formed wire products | • | Lineman tools, hoses & gloves |
| • | Overhead, pad mounted & capacitor switches | • | Splices, taps & connectors | • | Polymer concrete & fiberglass enclosures and equipment pads |
These products are sold under the following brands and/or trademarks:
| • | Aclara® | • | Chance® | • | Anderson® | • | PenCell® |
| • | Fargo® | • | Hubbell® | • | Polycast® | • | Opti-loop Design® |
| • | Quazite® | • | Quadri*sil® | • | Trinetics® | • | Reuel™ |
| • | Electro Composites™ | • | USCO™ | • | CDR™ | • | RFL Design® |
| • | Hot Box® | • | PCORE® | • | Delmar™ | • | Turner Electric® |
| • | EMC™ | • | Longbow™ | • | Ohio Brass® | • | Meramec® |
Information Applicable to All General Categories
The following information applicable to all general categories is as of December 31, 2017, and does not include information relating to Aclara.
International Operations
The Company has several operations located outside of the United States. These operations manufacture, assemble and/or procure and market Hubbell products and services for both the Electrical and Power segments.
As a percentage of total net sales, shipments from foreign operations directly to third parties were 11% in 2017, 10% in 2016 and 11% in 2015, with the Canadian, UK and Brazilian operations representing approximately 31%, 21%, and 12% respectively, of 2017 total international net sales. See also Note 19 — Industry Segments and Geographic Area Information in the Notes to Consolidated Financial Statements and Item 1A. Risk Factors relating to manufacturing in and sourcing from foreign countries.
Customers
The Company does not have any customers whose annual consolidated purchases exceed 10 percent of our total net sales in 2017, 2016 and 2015.
Raw Materials
Raw materials used in the manufacture of Hubbell products primarily include steel, aluminum, brass, copper, bronze, plastics, phenolics, zinc, nickel, elastomers and petrochemicals. Hubbell also purchases certain electrical and electronic components, including solenoids, lighting ballasts, printed circuit boards, integrated circuit chips and cord sets, from a number of suppliers. Hubbell is not materially dependent upon any one supplier for raw materials used in the manufacture of its products and equipment, and at the present time, raw materials and components essential to its operation are in adequate supply. However, some of these principal raw
| HUBBELL INCORPORATED - Form 10-K | 5 |
materials are sourced from a limited number of suppliers. See also Item 7A. Quantitative and Qualitative Disclosures about Market Risk.
Patents
Hubbell has approximately 1,800 active United States and foreign patents covering a portion of its products, which expire at various times. While Hubbell deems these patents to be of value, it does not consider its business to be dependent upon patent protection. Hubbell also licenses products under patents owned by others, as necessary, and grants licenses under certain of its patents.
Working Capital
Inventory, accounts receivable and accounts payable levels, payment terms and, where applicable, return policies are in accordance with the general practices of the electrical products industry and standard business procedures. See also Item 7. Management’s Discussion and Analysis of Financial Condition and Results of Operations.
Backlog
Substantially all of the backlog existing at December 31, 2017 is expected to be shipped to customers in 2018. Backlog of orders believed to be firm at December 31, 2017 was approximately $355.5 million compared to $297.4 million at December 31, 2016. Although this backlog is important, the majority of Hubbell’s revenues result from sales of inventoried products or products that have short periods of manufacture.
Competition
Hubbell experiences substantial competition in all categories of its business, but does not compete with the same companies in all of its product categories. The number and size of competitors vary considerably depending on the product line. Hubbell cannot specify with precision the number of competitors in each product category or their relative market position. However, some of its competitors are larger companies with substantial financial and other resources. Hubbell considers product performance, reliability, quality and technological innovation as important factors relevant to all areas of its business, and considers its reputation as a manufacturer of quality products to be an important factor in its business. In addition, product price, service levels and other factors can affect Hubbell’s ability to compete.
Research and Development
Research and development expenditures represent costs to discover and/or apply new knowledge in developing a new product or process, or in bringing about significant improvement in an existing product or process. Research and development expenses are recorded as a component of Cost of goods sold. Expenses for research and development were approximately 3% of Cost of goods sold in 2017 and 2% in 2016 and 2015.
Environment
The Company is subject to various federal, state and local government requirements relating to the protection of employee health and safety and the environment. The Company believes that, as a general matter, its policies, practices and procedures are properly designed to prevent unreasonable risk of environmental damage and personal injury to its employees and its customers’ employees and that the handling, manufacture, use and disposal of hazardous or toxic substances are in accordance with environmental laws and regulations.
Like other companies engaged in similar businesses, the Company has incurred or acquired through business combinations, remedial response and voluntary cleanup costs for site contamination and is a party to product liability and other lawsuits and claims associated with environmental matters, including past production of product containing toxic substances. Additional lawsuits, claims and costs involving environmental matters are likely to continue to arise in the future. However, considering past experience and reserves, the Company does not anticipate that these matters will have a material impact on earnings, capital expenditures, financial condition or competitive position. See also Item 1A. Risk Factors and Note 14 — Commitments and Contingencies in the Notes to Consolidated Financial Statements.
Employees
As of December 31, 2017, Hubbell had approximately 17,700 salaried and hourly employees of which approximately 7,300 of these employees, or 42%, are located in the United States. Approximately 2,200 of these U.S. employees are represented by 11 labor unions. Hubbell considers its labor relations to be satisfactory.
| 6 | HUBBELL INCORPORATED - Form 10-K |
Executive Officers of the Registrant
| Name | Age(1) | Present Position | Business Experience | |
| David G. Nord | 60 | Chairman of the Board, President and Chief Executive Officer | Present position since May 2014; President and Chief Executive Officer since January 2013; President and Chief Operating Officer from June 2012 to January 2013, and Senior Vice President and Chief Financial Officer from September 2005 to June 2012. Previously, various positions, including Vice President, Controller, of United Technologies and its subsidiaries, 2000-2005. | |
| William R. Sperry | 55 | Senior Vice President and Chief Financial Officer | Present position since June 6, 2012; Vice President, Corporate Strategy and Development August 15, 2008 to June 6, 2012; previously, Managing Director, Lehman Brothers August 2006 to April 2008, various positions, including Managing Director, of J.P. Morgan and its predecessor institutions, 1994-2006. | |
| Gerben W. Bakker | 53 | Group President, Power Systems | Present position since February 1, 2014; previously, Division Vice President, Hubbell Power Systems, Inc. (“HPS”) August 2009 - February 1, 2014; President, HPS Brazil June 2005 – July 2009; Vice President, Sourcing, HPS March 2004 – May 2005. | |
| Joseph A. Capozzoli | 43 | Vice President, Controller | Present position since April 22, 2013; previously, Assistant Corporate Controller of Stanley Black & Decker, Inc. (“Stanley”) April 2011 to April 2013; Global Operations Controller at Stanley 2010-2011; Director of Cost Accounting at Stanley, 2006-2010. | |
| An-Ping Hsieh | 57 | Senior Vice President, General Counsel and Secretary | Present position since May 2, 2017; previously Senior Vice President, General Counsel May 2016 - May 2017, Vice President, General Counsel, September 2012 - May 2016; Vice President, Secretary and Associate General Counsel of United Technologies Corporation (“UTC”) February 2008 to September 2012; Vice President and General Counsel, UTC Fire and Security 2003-2008; Deputy General Counsel, Otis Elevator Company, a United Technologies company 2001-2003. | |
| Maria R. Lee | 42 | Treasurer and Vice President, Corporate Strategy and Investor Relations | Present position since January 1, 2016; previously Vice President, Corporate Strategy and Investor Relations, March 2015-December 2015; Director, Investor Relations of United Technologies Corporation (“UTC”) 2011-2012; various positions, including Director, Financial Planning & Analysis, North and South America Area, Otis Elevator Company, at UTC, 2006-2011; various positions at Duff & Phelps, Affiliated Managers Group, Inc., and Booz Allen Hamilton, 1997-2006. | |
| Stephen M. Mais | 53 | Senior Vice President, Human Resources | Present position since May 3, 2016, previously Vice President, Human Resources, August 2005 - May 2016; Director, Staffing and Capability, Pepsi Bottling Group (“Pepsi”) 2001-2005; Director, Human Resources Southeastern U.S., Pepsi 1997-2001. | |
| Kevin A. Poyck | 48 | Group President, Lighting | Present position since June 1, 2015; previously, Vice President, General Manager, Commercial and Industrial Lighting, Hubbell Lighting, Inc. ("HLI") 2014 - 2015; Vice President, Brand Management, Commercial and Industrial, HLI 2012-2014; Vice President, Operations, HLI 2009 - 2012; Vice President, Engineering, HLI 2005-2009. | |
| Rodd R. Ruland | 60 | Group President, Construction and Energy | Present position since June 1, 2015; previously, President, BURNDY LLC, Hubbell Canada (HCLP) & Hubbell de Mexico (HdM) 2012-2015; President, BURNDY LLC 2009-2012; Corporate Vice President & General Manager, Electrical Power Interconnect Division, FCI (BURNDY) 2003-2009, Director, Business Development 2001-2003; various positions in Sales & Marketing, Business Development, and General Management and TycoElectronics/AMP Incorporated 1979-2000. | |
| Darrin S. Wegman | 50 | Group President, Commercial and Industrial | Present position since June 1, 2015; previously, Vice President, General Manager, Wiring Device and Industrial Electrical business, 2013-2015; Vice President, Controller, Hubbell Incorporated, 2008-2013; Vice President and Controller, Hubbell Industrial Technology, 2002-2008; Controller, GAI-Tronics Corporation, 2000-2002. |
| (1) | As of February 15, 2018. |
There are no family relationships among any of the above-named executive officers and directors. For information related to our Board of Directors, refer to Item 10. Directors, Executive Officers and Corporate Governance.
| HUBBELL INCORPORATED - Form 10-K | 7 |
Item 1A. Risk Factors
Our business, operating results, financial condition, and cash flows may be impacted by a number of factors including, but not limited to those set forth below. Any one of these factors could cause our actual results to vary materially from recent results or future anticipated results. See also Item 7. Management’s Discussion and Analysis — “Executive Overview of the Business”, “Outlook”, and “Results of Operations”.
Global economic uncertainty could adversely affect us.
During periods of prolonged slow growth, or a downturn in conditions in the worldwide or domestic economies, we could experience reduced orders, payment delays, supply chain disruptions or other factors caused by economic challenges faced by our customers, prospective customers and suppliers. Depending upon their severity and duration, these conditions could have an adverse impact on our results of operations, financial condition and cash flows.
We operate in markets that are subject to competitive pressures that could affect selling prices or demand for our products.
We compete on the basis of product performance, quality, service and/or price. Competitors' behavior related to these areas could potentially have significant impacts on our financial results. Our competitive strategy is to design and manufacture high quality products at the lowest possible cost. Our strategy is to also increase selling prices to offset rising costs of raw materials and components. Competitive pricing pressures may not allow us to offset some or all of our increased costs through pricing actions. Alternatively, if raw material and component costs decline, the Company may not be able to maintain current pricing levels. Competition could also affect future selling prices or demand for our products which could have an adverse impact on our results of operations, financial condition and cash flows.
Our inability to effectively develop and introduce new products could adversely affect our ability to compete.
New product introductions and enhancement of existing products and services are key to the Company’s competitive strategy. The success of new product introductions is dependent on a number of factors, including, but not limited to, timely and successful development of new products, market acceptance of these products and the Company’s ability to manage the risks associated with these introductions. These risks include production capabilities, management of inventory levels to support anticipated demand, the risk that new products may have quality defects in the early stages of introduction, and obsolescence risk of existing products. The Company cannot predict with certainty the ultimate impact new product introductions could have on our results of operations, financial condition or cash flows.
We may not be able to successfully implement initiatives, including our restructuring activities, that improve productivity and streamline operations to control or reduce costs.
Achieving our long-term profitability goals depends significantly on our ability to control or reduce our operating costs. Because many of our costs are affected by factors outside, or substantially outside, our control, we generally must seek to control or reduce costs through productivity initiatives. If we are not able to identify and implement initiatives that control or reduce costs and increase operating efficiency, or if the cost savings initiatives we have implemented to date do not generate expected cost savings, our financial results could be adversely impacted. Our efforts to control or reduce costs may include restructuring activities involving workforce reductions, facility consolidations and other cost reduction initiatives. If we do not successfully manage our current restructuring activities, or any other restructuring activities that we may undertake in the future, expected efficiencies and benefits may be delayed or not realized, and our operations and business could be disrupted.
We engage in acquisitions and strategic investments and may encounter difficulty in obtaining appropriate acquisitions and in integrating these businesses.
Part of the Company’s growth strategy involves acquisitions. We have pursued and will continue to seek acquisitions and other strategic investments to complement and expand our existing businesses. The rate and extent to which acquisitions become available may impact our growth rate. The success of these transactions will depend on our ability to integrate these businesses into our operations and realize the planned synergies. We may encounter difficulties in integrating acquisitions into our operations and in managing strategic investments and foreign acquisitions and joint ventures may also present additional risk related to the integration of operations across different cultures and languages. Failure to effectively complete or manage acquisitions may adversely affect our existing businesses as well as our results of operations, financial condition and cash flows.
We may fail to realize all of the anticipated benefits of the Aclara Acquisition or those benefits may take longer to realize than expected.
The full benefits of the Aclara Acquisition, including the anticipated sales or growth opportunities, may not be realized as expected or may not be achieved within the anticipated time frame, or at all. Failure to achieve the anticipated benefits of the Aclara Acquisition could adversely affect our results of operations or cash flows and decrease or delay the expected accretive effect of the Aclara Acquisition.
In addition, we have been required to devote significant attention and resources prior to closing to prepare for the operation of Hubbell following the Aclara Acquisition and will be required to devote significant attention and resources post-closing to successfully align the business practices and operations of Hubbell Incorporated and Aclara. This process may disrupt the businesses and, if ineffective, could limit the anticipated benefits of the Aclara Acquisition.
| 8 | HUBBELL INCORPORATED - Form 10-K |
We have incurred direct and indirect costs as a result of the Aclara Acquisition and will incur additional direct and indirect costs as a result of the Aclara Acquisition.
We have incurred substantial expenses in connection with and as a result of completing the Aclara Acquisition and we expect to incur additional expenses in connection with combining the businesses, operations, policies and procedures of Hubbell Incorporated and Aclara. Factors beyond our control could affect the total amount or timing of these expenses, many of which, by their nature, are difficult to estimate accurately.
We have outstanding indebtedness; our indebtedness has increased as a result of the Aclara Acquisition, and will further increase if we incur additional indebtedness in the future and do not retire existing indebtedness.
We have outstanding indebtedness and other financial obligations and significant unused borrowing capacity. The amount of cash required to pay interest on our indebtedness following completion of the Aclara Acquisition, and thus the demands on our cash resources, is greater than the amount of cash required to service our indebtedness prior to the Aclara Acquisition. Our increased indebtedness level and related debt service obligations could have negative consequences, including (i) requiring us to dedicate significant cash flow from operations to the payment of principal and interest on our indebtedness, which would reduce the funds we have available for other purposes, (ii) reducing our flexibility in planning for or reacting to changes in our business and market conditions and (iii) exposing us to interest rate risk since a portion of our debt obligations are at variable rates.
We may incur significantly more indebtedness in the future. If we add new indebtedness and do not retire existing indebtedness, the risks described above could increase.
We manufacture and source products and materials from various countries throughout the world. A disruption in the availability, price or quality of these products or materials could impact our operating results.
Our business is subject to risks associated with global manufacturing and sourcing. We use a variety of raw materials in the production of our products including steel, aluminum, brass, copper, bronze, zinc, nickel, plastics, phenolics, elastomers and petrochemicals. We also purchase certain electrical and electronic components, including solenoids,lighting ballasts, printed circuit boards and integrated circuit chips and cord sets from a number of suppliers. Significant shortages in the availability of these materials or significant price increases could increase our operating costs and adversely impact the competitive positions of our products, which could adversely impact our results of operations.
We rely on materials, components and finished goods that are sourced from or manufactured in foreign countries including Mexico, China, and other international countries. Political instability in any country where we do business could have an adverse impact on our results of operations.
We rely on our suppliers to produce high quality materials, components and finished goods according to our specifications. Although we have quality control procedures in place, there is a risk that products may not meet our specifications which could impact our ability to ship quality products to our customers on a timely basis, which could adversely impact our results of operations.
We are subject to risks surrounding our information technology systems failures, network, disruptions and breaches in data security.
The proper functioning of Hubbell’s information technology systems is critical to the successful operation of our business. Although our information technology systems are protected with robust backup and security systems, these systems are still susceptible to cyber threats, outages due to fire, floods, power loss, telecommunications failures, viruses, break-ins and similar events, or breaches of physical security. A failure of our information technology systems could impact our ability to process orders, maintain proper levels of inventory, collect accounts receivable and pay expenses; all of which could have an adverse effect on our results of operations, financial condition and cash flows. In addition, security breaches could result in unauthorized disclosure of confidential information that may result in financial or reputational damage to the Company.
We have continued to work on improving our utilization of our enterprise resource planning system, expanding standardization of business processes and performing implementations at our remaining businesses. We expect to incur additional costs related to future implementations, process reengineering efforts as well as enhancements and upgrades to the system. These system modifications and implementations could result in operating inefficiencies which could adversely impact our operating results and/or our ability to perform necessary business transactions.
Future tax law changes could increase our prospective tax expense. In addition, tax payments may ultimately differ from amounts currently recorded by the Company.
We are subject to income taxes as well as non-income based taxes, in both the United States and numerous foreign jurisdictions. The determination of the Company's worldwide provision for income taxes and other tax liabilities requires judgment and is based on diverse legislative and regulatory structures that exist in the various jurisdictions where the company operates. Although management believes its estimates are reasonable, the ultimate tax outcome may differ from the amounts recorded in its financial statements and may adversely affect the Company's financial results for the period when such determination is made. We are subject to ongoing tax audits in various jurisdictions. Tax authorities may disagree with certain positions we have taken and assess additional taxes. We regularly assess the likely outcomes of these audits in order to determine the appropriateness of our tax provisions. However, there can be no assurance that we will accurately predict the outcomes of these audits, and the future outcomes of these audits could adversely affect our results of operations, financial condition and cash flows.
| HUBBELL INCORPORATED - Form 10-K | 9 |
Recent U.S. tax legislation may materially adversely affect our financial condition, results of operations and cash flows.
On December 22, 2017 Public Law 115-97 “An Act to Provide Reconciliation Pursuant to Titles II and V of the Concurrent Resolution on the Budget for Fiscal Year 2018” was enacted. This law is commonly referred to as the Tax Cuts and Job Act of 2017 ("TCJA"). The TCJA significantly changed the U.S. Internal Revenue Code, including taxation of U.S. corporations, by, among other things, reducing the U.S. federal corporate income tax rate, limiting the availability of previously claimed deductions, taxing certain activities and transactions not previously subject to U.S. tax and imposing a mandatory deemed repatriation tax on certain undistributed earnings and profits of U.S.-owned foreign corporations. The legislation is unclear in many respects and will require further interpretation and review of regulations to be issued by the Internal Revenue Service (“IRS”) and state tax authorities. The legislation could also be subject to potential amendments and technical corrections, any of which could lessen or increase certain impacts of the legislation.
The TCJA will also impact how we account for income taxes in our financial statements. Pursuant to guidance issued by the SEC in December 2017, issuers are permitted up to one-year from the date of enactment of the TCJA to complete the accounting for the income tax effects of the TCJA. See Note 1 — Recent Accounting Pronouncements in the Notes to Consolidated Financial Statements for further information about Staff Accounting Bulletin No. 118 (“SAB 118”). Until the accounting for the income tax effects is complete, financial statements should include provisional amounts to the extent a reasonable estimate of the income tax effects of the TCJA can be determined. We have included in the current period financial statements a provisional amount with respect to the deemed repatriation provisions of the TCJA, the revaluation of U.S. deferred taxes and the U.S. and foreign tax costs associated with anticipated remittances related to certain of our outside basis differences. We have also included provisional amounts with respect to those states with current conformity to the Internal Revenue Code where a reasonable estimate could be determined. We have not included a provisional amount for the income tax effects of a repatriation of our remaining unremitted foreign earnings because we have not determined a reasonable estimate related to it. During the one-year period provided under SAB 118, we will include additional provisional amounts or adjustments to prior provisional amounts in our financial statements as information is obtained, prepared and analyzed and legislative and authoritative guidance is issued. These additional amounts or adjustments to prior provisional amounts could be material. See Note 12 — Income Taxes in the Notes to Consolidated Financial Statements for additional information.
We will continue to examine the impact that the TCJA may have on our business in subsequent periods. Notwithstanding the reduction in the corporate income tax rate, the overall impact of the legislation remains uncertain and our business and financial condition could be adversely affected.
Significant developments stemming from the recent U.S. federal elections could have a material adverse effect on us.
As a result of the recent U.S. federal elections, there may be changes to existing trade agreements, like the North American Free Trade Agreement ("NAFTA"), and proposed trade agreements, like the Trans-Pacific Partnership ("TPP"), greater restrictions on free trade generally, significant increases in tariffs on goods imported into the United States particularly tariffs on products manufactured in Mexico, among other possible changes. Changes in U.S. social, political, regulatory and economic conditions or in laws and policies governing foreign trade, manufacturing, development and investment in the territories and countries where we currently manufacture and sell products, and any resulting negative sentiments towards the United States as a result of such changes, could have an adverse effect on our business.
Our success depends on attracting and retaining qualified personnel.
Our ability to sustain and grow our business requires us to hire, retain and develop a highly skilled and diverse management team and workforce. Failure to ensure that we have the depth and breadth of personnel with the necessary skill set and experience, or the loss of key employees, could impede our ability to deliver our growth objectives and execute our strategy.
Deterioration in the credit quality of our customers could have a material adverse effect on our operating results and financial condition.
We have an extensive customer base of distributors, wholesalers, electric utilities, OEMs, electrical contractors, telecommunications companies and retail and hardware outlets. We are not dependent on a single customer, however, our top ten customers account for approximately 40% of our net sales. Deterioration in the credit quality of several major customers could adversely affect our results of operations, financial condition and cash flows.
Inability to access capital markets or failure to maintain our credit ratings may adversely affect our business.
Our ability to invest in our business and make strategic acquisitions may require access to the capital markets. If general economic and capital market conditions deteriorate significantly, it could impact our ability to access capital. Failure to maintain our credit ratings could also impact our ability to access credit markets and could adversely impact our cost of borrowing. While we have not encountered significant financing difficulties recently, the capital and credit markets have experienced significant volatility in recent years. Market conditions could make it more difficult for us to access capital to finance our investments and acquisitions. This could adversely affect our results of operations, financial condition and cash flows.
| 10 | HUBBELL INCORPORATED - Form 10-K |
If the underlying investments of our defined benefit plans do not perform as expected, we may have to make additional contributions to these plans.
We sponsor certain pension and other postretirement defined benefit plans. The performance of the financial markets and interest rates impact these plan expenses and funding obligations. Significant changes in market interest rates, investment losses on plan assets and reductions in discount rates may increase our funding obligations and could adversely impact our results of operations, cash flows, and financial condition. Furthermore, there can be no assurance that the value of the defined benefit plan assets will be sufficient to meet future funding requirements.
Volatility in currency exchange rates may adversely affect our financial condition, results of operations and cash flows.
Our international operations accounted for approximately 11% of our net sales in 2017. We are exposed to the effects (both positive and negative) that fluctuating exchange rates have on translating the financial statements of our international operations, most of which are denominated in local currencies, into the U.S. dollar. Fluctuations in exchange rates may affect product demand and reported profits in our international operations. In addition, currency fluctuations may affect the prices we pay suppliers for materials used in our products. As a result, fluctuating exchange rates may adversely impact our results of operations and cash flows.
Our reputation and our ability to conduct business may be impaired by improper conduct by any of our employees, agents or business partners.
We cannot provide absolute assurance that our internal controls and compliance systems will always protect us from acts committed by our employees, agents or business partners that would violate U.S. and/or non-U.S. laws, including the laws governing payments to government officials, bribery, fraud, anti-kickback and false claims rules, competition, export and import compliance, money laundering and data privacy. In particular, the U.S. Foreign Corrupt Practices Act, the U.K. Bribery Act, and similar anti-bribery laws in other jurisdictions generally prohibit companies and their intermediaries from making improper payments to government officials for the purpose of obtaining or retaining business, and we operate in parts of the world that have experienced governmental corruption to some degree. Despite meaningful measures that we undertake to facilitate lawful conduct, which include training and internal control policies, these measures may not always prevent reckless or criminal acts by our employees or agents. Any such improper actions could damage our reputation and subject us to civil or criminal investigation in the United States and in other jurisdictions, could lead to substantial civil and criminal, monetary and non-monetary penalties and could cause us to incur significant legal and investigative fees.
We could incur significant and/or unexpected costs in our efforts to successfully avoid, manage, defend and litigate intellectual property matters.
The Company relies on certain patents, trademarks, copyrights, trade secrets and other intellectual property of which the Company cannot be certain that others have not and will not infringe upon. Although management believes that the loss or expiration of any single intellectual property right would not have a material impact on its operating results, intellectual property litigation could be costly and time consuming and the Company could incur significant legal expenses pursuing these claims against others.
From time to time, we receive notices from third parties alleging intellectual property infringement. Any dispute or litigation involving intellectual property could be costly and time-consuming due to the complexity and the uncertainty of intellectual property litigation. Our intellectual property portfolio may not be useful in asserting a counterclaim, or negotiating a license, in response to a claim of infringement or misappropriation. In addition, as a result of such claims, the Company may lose its rights to utilize critical technology or may be required to pay substantial damages or license fees with respect to the infringed rights or be required to redesign our products at a substantial cost, any of which could negatively impact our operating results. Even if we successfully defend against claims of infringement, we may incur significant costs that could adversely affect our results of operations, financial condition and cash flow. See Item 3 “Legal Proceedings” for a discussion of our legal proceedings.
We may be required to recognize impairment charges for our goodwill and other intangible assets.
As of December 31, 2017, the net carrying value of our goodwill and other intangible assets totaled approximately $1.5 billion. In addition, the Aclara acquisition is expected to result in a significant increase in goodwill and intangible assets. As required by generally accepted accounting principles, we periodically assess these assets to determine if they are impaired. Impairment of intangible assets may be triggered by developments both within and outside the Company’s control. Deteriorating economic conditions, technological changes, disruptions to our business, inability to effectively integrate acquired businesses, unexpected significant changes or planned changes in use of the assets, intensified competition, divestitures, market capitalization declines and other factors may impair our goodwill and other intangible assets. Any charges relating to such impairments could adversely affect our results of operations in the periods an impairment is recognized.
| HUBBELL INCORPORATED - Form 10-K | 11 |
We are subject to litigation and environmental regulations that may adversely impact our operating results.
We are a party to a number of legal proceedings and claims, including those involving product liability, intellectual property and environmental matters, which could be significant. It is not possible to predict with certainty the outcome of every claim and lawsuit. In the future, we could incur judgments or enter into settlements of lawsuits and claims that could have a materially adverse effect on our results of operations, cash flows, and financial condition. In addition, while we maintain insurance coverage with respect to certain claims, such insurance may not provide adequate coverage against such claims. We establish reserves based on our assessment of contingencies, including contingencies related to legal claims asserted against us. Subsequent developments in legal proceedings may affect our assessment and estimates of the loss contingency recorded as a reserve and require us to make additional payments, which could have a materially adverse effect on our results of operations, financial condition and cash flow.
We are also subject to various laws and regulations relating to environmental protection and the discharge of materials into the environment, and we could incur substantial costs as a result of the noncompliance with or liability for clean up or other costs or damages under environmental laws. In addition, we could be affected by future laws or regulations, including those imposed in response to climate change concerns. Compliance with any future laws and regulations could result in a materially adverse effect on our business and financial results. See Item 3 “Legal Proceedings” for a discussion of our legal proceedings.
Regulations related to conflict-free minerals may cause us to incur additional expenses and may create challenges with our customers.
The Dodd-Frank Wall Street Reform and Consumer Protection Act contains provisions to improve transparency and accountability regarding the use of “conflict” minerals mined from the Democratic Republic of Congo and adjoining countries (“DRC”). The SEC has established annual disclosure and reporting requirements for those companies who use “conflict” minerals sourced from the DRC in their products. These new requirements could limit the pool of suppliers who can provide conflict-free minerals and as a result, we cannot ensure that we will be able to obtain these conflict-free minerals at competitive prices. Compliance with these new requirements may also increase our costs. In addition, we may face challenges with our customers if we are unable to sufficiently verify the origins of the minerals used in our products.
We face the potential harms of natural disasters, terrorism, acts of war, international conflicts or other disruptions to our operations.
Natural disasters, acts or threats of war or terrorism, international conflicts, and the actions taken by the United States and other governments in response to such events could cause damage to or disrupt our business operations, our suppliers or our customers, and could create political or economic instability, any of which could have an adverse effect on our business. Although it is not possible to predict such events or their consequences, these events could decrease demand for our products, make it difficult or impossible for us to deliver products, or disrupt our supply chain.
| 12 | HUBBELL INCORPORATED - Form 10-K |
Item 1B. Unresolved Staff Comments
None.
Item 2. Properties
As of December 31, 2017, Hubbell’s global headquarters are located in leased office space in Shelton, Connecticut. Other principal administrative offices are in Columbia, South Carolina, Greenville, South Carolina and Manchester, New Hampshire. Hubbell's manufacturing and warehousing facilities, classified by reporting segment, are located in the following countries. The Company believes its manufacturing and warehousing facilities are adequate to carry on its business activities.
| Number of Facilities | Total Approximate Floor Area in Square Feet | ||||||||
| Segment | Location | Warehouses | Manufacturing | Owned | Leased | ||||
| Electrical segment | United States | 9 | 25 | 2,688,400 | 1,921,200 | ||||
| Australia | — | 2 | — | 31,700 | |||||
| Canada | 1 | 2 | 178,700 | 3,000 | |||||
| Mexico | 1 | 4 | 828,600 | 174,000 | |||||
| China | — | 2 | — | 287,900 | |||||
| Puerto Rico | — | 1 | 162,400 | — | |||||
| Singapore | 1 | — | — | 8,700 | |||||
| Switzerland | — | 1 | 95,000 | — | |||||
| United Kingdom | 2 | 3 | 133,500 | 57,500 | |||||
| Power segment (1) | United States | 1 | 14 | 2,708,900 | 94,600 | ||||
| Brazil | — | 2 | 188,100 | 24,000 | |||||
| Canada | — | 1 | 30,000 | — | |||||
| Mexico | 1 | 1 | 167,400 | 181,100 | |||||
| China | — | 3 | — | 262,500 | |||||
| TOTAL | 16 | 61 | 7,181,000 | 3,046,200 |
(1) The Power segment shares an owned manufacturing building in Mexico with the Electrical segment. The building is included in the Electrical segment facility count.
| HUBBELL INCORPORATED - Form 10-K | 13 |
Item 3. Legal Proceedings
The Company is subject to various legal proceedings arising in the normal course of its business. These proceedings include claims for damages arising out of use of the Company’s products, intellectual property, workers’ compensation and environmental matters. The Company is self-insured up to specified limits for certain types of claims, including product liability and workers’ compensation, and is fully self-insured for certain other types of claims, including environmental and intellectual property matters. The Company recognizes a liability for any contingency that in management’s judgment is probable of occurrence and can be reasonably estimated. We continually reassess the likelihood of adverse judgments and outcomes in these matters, as well as estimated ranges of possible losses based upon an analysis of each matter which includes
consideration of outside legal counsel and, if applicable, other experts. Information required by this item is incorporated herein by reference to the section captioned “Notes to Consolidated Financial Statements, Note 14 — Commitments and Contingencies” of this Form 10-K.
Item 4. Mine Safety Disclosures
Not applicable.
| 14 | HUBBELL INCORPORATED - Form 10-K |
| PART II |
Item 5. Market for the Registrant’s Common Equity, Related Stockholder Matters and Issuer Purchases of Equity Securities
On December 23, 2015 the Company completed the Reclassification of its dual-class common stock into a single class of Common Stock. Trading in the Class A common stock and Class B common stock ceased after markets closed on December 23, 2015 and trading in the Company's single class of Common Stock commenced on the New York Stock Exchange ("NYSE") on December 24, 2015. The Company’s Common Stock is principally traded on the NYSE. Prior to the Reclassification the Company's Class A common stock traded under the symbol “HUB.A” and the Company's Class B common stock traded under the symbol “HUB.B”. The Common Stock, resulting from the Reclassification, trades under the symbol "HUBB". See Note 15 — Capital Stock in the Notes to Consolidated Financial Statements for more information about the Reclassification.
The information required by Item 5 with respect to securities authorized for issuance under equity compensation plans is incorporated herein by reference to Part III, Item 12 of this Form 10-K.
The following tables provide information about market prices of the Company's Common Stock and dividends declared.
| Market Prices (Dollars Per Share) | Common Stock | |||
| Years Ended December 31, | High | Low | ||
| 2017 — Fourth quarter | 138.96 | 114.68 | ||
| 2017 — Third quarter | 121.43 | 109.32 | ||
| 2017 — Second quarter | 122.58 | 109.50 | ||
| 2017 — First quarter | 125.93 | 115.08 | ||
| 2016 — Fourth quarter | 119.05 | 101.15 | ||
| 2016 — Third quarter | 109.33 | 101.72 | ||
| 2016 — Second quarter | 111.23 | 97.35 | ||
| 2016 — First quarter | 106.66 | 83.16 | ||
| Dividends Declared (Dollars Per Share) | Common Stock | |||
| Years Ended December 31, | 2017 | 2016 | ||
| Fourth quarter | 0.77 | 0.70 | ||
| Third quarter | 0.70 | 0.63 | ||
| Second quarter | 0.70 | 0.63 | ||
| First quarter | 0.70 | 0.63 |
The following table provides information about the number of common shareholders of the Company's Class A common stock, Class B common stock, and the Common Stock resulting from the Reclassification.
| Number of Common Shareholders of Record | ||||||||||
| At December 31, | 2017 | 2016 | 2015 | 2014 | 2013 | |||||
| Class A | — | — | — | 369 | 394 | |||||
| Class B | — | — | — | 2,093 | 2,225 | |||||
| Common Stock | 1,811 | 2,003 | 2,548 | — | — |
Our dividends are declared at the discretion of our Board of Directors. In October 2017, the Company’s Board of Directors approved an increase in the common stock dividend rate from $0.70 to $0.77 per share per quarter. The increased quarterly dividend payment commenced with the December 15, 2017 payment made to the shareholders of record on November 30, 2017.
| HUBBELL INCORPORATED - Form 10-K | 15 |
Purchases of Equity Securities
At December 31, 2016, we had total remaining share repurchase authorization of $153.6 million under the repurchase program authorized by our Board of Directors in August 2015. In 2017, the Company repurchased shares for an aggregate purchase price of $92.5 million and the August 2015 repurchase program expired in October, 2017. On October 20, 2017, the Board of Directors approved a new stock repurchase program (the “October 2017 program”) that authorized the repurchase of up to $400 million of Common Stock and expires on October 20, 2020. As of December 31, 2017, the entire $400 million remains authorized for repurchases under the October 2017 program. Subject to numerous factors, including market conditions and alternative uses of cash, we may conduct discretionary repurchases through open market or privately negotiated transactions, which may include repurchases under plans complying with Rules 10b5-1 and 10b-18 under the Securities Exchange Act of 1934, as amended.
Corporate Performance Graph
The following graph compares the total return to shareholders on the Company’s common stock during the five years ended December 31, 2017, with a cumulative total return on the (i) Standard & Poor’s MidCap 400 (“S&P MidCap 400”) and (ii) the Dow Jones U.S. Electrical Components & Equipment Index (“DJUSEC”). The Company is a member of the S&P MidCap 400. As of December 31, 2017, the DJUSEC reflects a group of fourteen company stocks in the electrical components and equipment market segment, and serves as the Company’s peer group for purposes of this graph. The comparison assumes $100 was invested on December 31, 2012 in the Company’s Common Stock and in each of the foregoing indices and assumes reinvestment of dividends.
COMPARISON OF 5 YEAR CUMULATIVE TOTAL RETURN*
Among Hubbell Incorporated, the S&P Midcap 400 Index, and the Dow Jones US Electrical Components & Equipment Index
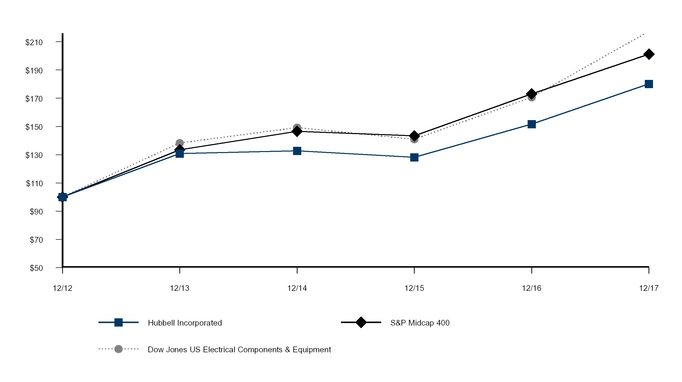
The Hubbell Incorporated line above uses the weighted average of Hubbell Class A and Class B shares for the two annual periods from December 2012 through December 2014.
| *$100 invested on 12/31/12 in stock or index, including reinvestment of dividends. Fiscal year ending December 31. Copyright© 2018 Standard & Poor's, a division of S&P Global. All rights reserved. Copyright© 2018 S&P Dow Jones Indices LLC, a division of S&P Global. All rights reserved. |
| 16 | HUBBELL INCORPORATED - Form 10-K |
Item 6. Selected Financial Data
The following summary should be read in conjunction with the consolidated financial statements and notes contained herein (dollars and shares in millions, except per share amounts).
| OPERATIONS, years ended December 31, | 2017 | 2016 | 2015 | 2014 | 2013 | ||||||||||
| Net sales | $ | 3,668.8 | $ | 3,505.2 | $ | 3,390.4 | $ | 3,359.4 | $ | 3,183.9 | |||||
| Gross profit | $ | 1,151.9 | $ | 1,100.7 | $ | 1,091.8 | $ | 1,109.0 | $ | 1,070.5 | |||||
| Operating income | $ | 503.7 | $ | 477.8 | $ | 474.6 | $ | 517.4 | $ | 507.6 | |||||
| Adjusted operating income (1) | $ | 534.1 | $ | 512.8 | $ | 513.5 | $ | 522.5 | $ | 507.6 | |||||
| Operating income as a % of sales | 13.7 | % | 13.6 | % | 14.0 | % | 15.4 | % | 15.9 | % | |||||
| Adjusted operating income as a % of sales (1) | 14.6 | % | 14.6 | % | 15.1 | % | 15.6 | % | 15.9 | % | |||||
| Net income attributable to Hubbell (2) | $ | 243.1 | $ | 293.0 | $ | 277.3 | $ | 325.3 | $ | 326.5 | |||||
| Adjusted net income attributable to Hubbell (1) | $ | 328.0 | $ | 316.8 | $ | 321.0 | $ | 328.8 | $ | 326.5 | |||||
| Net income attributable to Hubbell as a % of net sales | 6.6 | % | 8.4 | % | 8.2 | % | 9.7 | % | 10.3 | % | |||||
| Adjusted net income attributable to Hubbell as a % of net sales (1) | 8.9 | % | 9.0 | % | 9.5 | % | 9.8 | % | 10.3 | % | |||||
| Net income attributable to Hubbell as a % of Hubbell shareholders’ average equity | 15.1 | % | 17.6 | % | 15.1 | % | 17.0 | % | 18.3 | % | |||||
| Earnings per share — diluted | $ | 4.39 | $ | 5.24 | $ | 4.77 | $ | 5.48 | $ | 5.47 | |||||
| Adjusted earnings per share — diluted (1) | $ | 5.93 | $ | 5.66 | $ | 5.52 | $ | 5.54 | $ | 5.47 | |||||
| Cash dividends declared per common share | $ | 2.87 | $ | 2.59 | $ | 2.31 | $ | 2.06 | $ | 1.85 | |||||
| Average number of common shares outstanding — diluted | 55.1 | 55.7 | 58.0 | 59.2 | 59.6 | ||||||||||
| Cost of acquisitions, net of cash acquired | $ | 184.1 | $ | 173.4 | $ | 163.4 | $ | 183.8 | $ | 96.5 | |||||
| FINANCIAL POSITION, AT YEAR-END | |||||||||||||||
| Working capital (3) | $ | 898.0 | $ | 961.7 | $ | 784.7 | $ | 1,130.3 | $ | 1,165.4 | |||||
| Total assets | $ | 3,720.6 | $ | 3,525.0 | $ | 3,208.7 | $ | 3,320.1 | $ | 3,184.0 | |||||
| Total debt | $ | 1,055.2 | $ | 993.7 | $ | 644.1 | $ | 596.3 | $ | 594.3 | |||||
| Total Hubbell shareholders’ equity | $ | 1,634.2 | $ | 1,592.8 | $ | 1,740.6 | $ | 1,927.1 | $ | 1,906.4 | |||||
| NUMBER OF EMPLOYEES, AT YEAR-END | 17,700 | 17,400 | 16,200 | 15,400 | 14,300 |
(1) The selected non-GAAP measures of adjusted operating income, adjusted operating income as a percent of sales (adjusted operating margin), adjusted net income attributable to Hubbell, adjusted net income attributable to Hubbell as a percent of net sales, and adjusted earnings per share-diluted should be read in conjunction with Item 7, "Management's Discussion and Analysis of Financial Condition and Results of Operations".
(2) Net income in 2017 includes approximately $57 million, or $1.02 per share, impact associated with the TCJA.
(3) Defined as current assets less current liabilities.
| HUBBELL INCORPORATED - Form 10-K | 17 |
Item 7. Management’s Discussion and Analysis of Financial Condition and Results of Operations
Executive Overview of the Business
The Company is primarily engaged in the design, manufacture and sale of quality electrical and electronic products for a broad range of non-residential and residential construction, industrial and utility applications. Products are either sourced complete, manufactured or assembled by subsidiaries in the United States, Canada, Switzerland, Puerto Rico, China, Mexico, the United Kingdom, Brazil, Australia Spain and Ireland. The Company also participates in joint ventures in Taiwan, Hong Kong and the Philippines, and maintains offices in Singapore, Italy, China, India, Mexico, South Korea, Chile, and countries in the Middle East. The Company employed approximately 17,700 individuals worldwide as of December 31, 2017.
The Company’s reporting segments consist of the Electrical segment and the Power segment. Results for 2017, 2016 and 2015 by segment are included under “Segment Results” within this Management’s Discussion and Analysis.
The Company's long-term strategy is to serve its customers with reliable and innovative electrical and related infrastructure solutions with desired brands, high-quality service, and delivered through a competitive cost structure; to complement organic revenue growth with acquisitions that enhance its product offerings; and to allocate capital effectively to create shareholder value.
Our strategy to complement organic revenue growth with acquisitions focuses on acquiring assets that extend our capabilities, expand our product offerings, and present opportunities to compete in core, adjacent or complementary markets. Our acquisition strategy also provides the opportunity to advance our revenue growth objectives during periods of weakness or inconsistency in our end-markets.
Our strategy to deliver products through a competitive cost structure has resulted in the restructuring and related activities we have initiated, beginning in 2014. Our restructuring and related efforts include the consolidation of manufacturing and distribution facilities, workforce actions, as well as streamlining and consolidating our back-office functions. The primary objectives of our restructuring and related activities are to optimize our manufacturing footprint, cost structure, and effectiveness and efficiency of our workforce.
Productivity improvement also continues to be a key area of focus for the Company and efforts to drive productivity work with our restructuring and related activities to minimize the impact of rising material costs and administrative cost inflation. Material costs are approximately two-thirds of our cost of goods sold therefore volatility in this area can significantly impact profitability. Our goal is to have pricing and productivity programs that offset material and other inflationary cost increases as well as pay for investments in key growth areas.
Productivity programs impact virtually all functional areas within the Company by reducing or eliminating waste and improving processes. We continue to expand our efforts surrounding global product and component sourcing and supplier cost reduction programs. Value engineering efforts, product transfers and the use of lean process improvement techniques are expected to continue to increase manufacturing efficiency. In addition, we continue to build upon the benefits of our enterprise resource planning system across all functions.
Acquisition of Aclara
On February 2, 2018 the Company acquired Aclara for approximately $1.1 billion. Aclara is a leading global supplier of smart infrastructure solutions for electric, gas, and water utilities, with advanced metering solutions and grid monitoring sensor technology, as well as leading software enabled installation services. The acquisition extends the Power segment's capabilities into smart automation technologies, accelerates ongoing innovation efforts to address utility customer demand for data and integrated solutions, and expands the segment's reach to a broader set of utility customers.
For additional information about the Aclara acquisition, refer to Note 2 — Business Acquisitions in the Notes to the Consolidated Financial Statements as well as the Company's current report on Form 8-K filed on December 26, 2017.
| 18 | HUBBELL INCORPORATED - Form 10-K |
Outlook
In 2018, we expect aggregate growth across our end markets of approximately two to four percent and that our new product development initiatives will drive our net sales results to modestly out-perform end-market expectations. Our end-market growth expectations include three to five percent growth in the oil and gas market, two to four percent growth in the electrical transmission and distribution, industrial, and residential markets, and one to three percent growth in the non-residential market. We expect acquisitions to contribute approximately 15% to net sales growth in 2018, including net sales growth from the acquisition of Aclara.
We expect reported earnings per diluted share for 2018 in the range of $6.10 to $6.50 and adjusted earnings per diluted share in the range of $6.95 to $7.35(1).
Finally, with our strong financial position and cash flows provided by operating activities, we expect to continue to enhance shareholder value through capital deployment. We expect free cash flow (defined as cash flows from operating activities less capital expenditures) to be equal to net income attributable to Hubbell in 2018.
(1) Effective with results of operations reported in the first quarter of 2018, "adjusted" operating measures will no longer exclude restructuring and related costs, as these costs and the related savings are expected to return to a more consistent annual run-rate in 2018, and therefore no longer affect the comparability of our underlying performance from period to period. Our expectation for full year 2018 adjusted earnings per diluted share in the range of $6.95 to $7.35 excludes Aclara acquisition-related and transaction costs. Aclara acquisition-related costs include the amortization of identified intangible assets and inventory step-up amortization expense.
Results of Operations
Our operations are classified into two reportable segments: Electrical and Power. For a complete description of the Company’s segments, see Part I, Item 1 of this Annual Report on Form 10-K. Within these segments, Hubbell serves customers in five primary end markets; non-residential construction, residential construction, industrial, energy-related markets (also referred to as oil and gas markets) and utility markets (also referred to as the electrical transmission and distribution market). In order of magnitude of net sales, the Company's served markets are non-residential construction, industrial, utility, oil and gas, and residential construction.
Growth of our five primary end markets was more consistent in 2017 as compared to recent years. Higher margin businesses, such as our harsh and hazardous business, that declined in recent years experienced a recovery, and the gas market was strong, which complemented utility capital spend and storm-related activity that drove growth in electrical transmission and distribution markets.
Non-residential and residential market demand grew as well, but that growth was restrained by the Lighting market, which experienced unit growth that was dampened by pricing headwinds. Industrial markets were mixed, with declines in heavy industrial business, but improvement in telecommunications.
With the return to more balanced growth and recovery of higher margin businesses, adjusted operating margin of our Electrical segment has stabilized year over year, declining by only 30 basis points, while absorbing our investment in IoT capabilities (through the acquisition of iDevices), restructuring-driven inefficiencies and pricing headwinds in our Lighting business as well as material cost headwinds during the year. Our Power segment grew organic revenues by six per
Showing the first 8K of 100K characters. Open the full section
Item 7A. Quantitative and Qualitative Disclosures about Market Risk
In the operation of our business, we have various exposures to areas of risk related to factors within and outside the control of management. Significant areas of risk and our strategies to manage the exposure are discussed below.
In 2017, we manufactured and/or assembled products in the United States, Canada, Switzerland, Puerto Rico, Mexico, China, UK, Brazil and Australia and sold products in those markets as well as through offices in Singapore, Italy, China, Mexico, and South Korea and countries in the Middle East. In 2017, Hubbell also participated in joint ventures in Taiwan and Hong Kong. Shipments from non-U.S. subsidiaries as a percentage of the Company’s total net sales were 11% in 2017, 10% in 2016 and 11% in 2015, with the Canadian, UK and Brazilian operations representing approximately 31%, 21%, and 12% respectively, of 2017 total international net sales. As such, our operating results could be affected by changes in foreign currency exchange rates or weak economic conditions in the foreign markets in which we sell our products. To manage this exposure, we closely monitor the working capital requirements of our international units and may enter into forward foreign exchange contracts. Further discussion of forward exchange contracts can be found in Note 13 — Financial Instruments and Fair Value Measurement in the Notes to Consolidated Financial Statements.
Product purchases representing approximately 17% of our net sales are sourced from unaffiliated suppliers located outside the United States, primarily in China and other Asian countries, Europe and Brazil. Foreign sourcing of products may result in unexpected fluctuations in product cost or increased risk of business interruption due to lack of product or component availability due to any one of the following:
| • | Political or economic uncertainty in the source country |
| • | Fluctuations in the rate of exchange between the U.S. dollar and the currencies of the source countries |
| • | Changes in U.S. laws and policies governing foreign trade |
| • | Increased logistical complexity including supply chain interruption or delay, port of departure or entry disruption and overall time to market |
| • | Loss of proprietary information |
| • | Product quality issues outside the control of the Company |
We have developed plans that address many of these risks. Such actions include careful selection of products to be outsourced and the suppliers selected; ensuring multiple sources of supply; limiting concentrations of activity by port, broker, freight forwarder, etc.; processes related to quality control; and maintaining control over operations, technologies and manufacturing deemed to provide competitive advantage. Many of our businesses have a dependency on certain basic
raw materials needed to produce their products including steel, aluminum, brass, copper, bronze, plastics, phenols, zinc, nickel, elastomers and petrochemicals as well as purchased electrical and electronic components. Our financial results could be affected by the availability and changes in prices of these materials and components.
Certain of these materials are sourced from a limited number of suppliers. These materials are also key source materials for many other companies in our industry and within the universe of industrial manufacturers in general. As such, in periods of rising demand for these materials, we may experience both increased costs and/or limited supply. These conditions can potentially result in our inability to acquire these key materials on a timely basis to produce our products and satisfy our incoming sales orders. Similarly, the cost of these materials can rise suddenly and result in materially higher costs of producing our products. We believe we have adequate primary and secondary sources of supply for each of our key materials and that, in periods of rising prices, we expect to recover a majority of the increased cost in the form of higher selling prices. However, recoveries typically lag the effect of cost increases due to the nature of our markets.
Our financial results are subject to interest rate fluctuations to the extent there is a difference between the amount of our interest-earning assets and the amount of interest-bearing liabilities. The principal objectives of our investment management activities are to preserve capital while earning net investment income that is commensurate with acceptable levels of interest rate, default and liquidity risk taking into account our funding needs. As part of our investment management strategy, we may use derivative financial products such as interest rate hedges and interest rate swaps.
From time to time or when required, we issue commercial paper, which exposes us to changes in interest rates. Our cash position includes amounts denominated in foreign currencies. We manage our worldwide cash requirements by considering available funds held by our subsidiaries and the cost effectiveness with which these funds can be accessed.
We continually evaluate risk retention and insurance levels for product liability, property damage and other potential exposures to risk. We devote significant effort to maintaining and improving safety and internal control programs, which are intended to reduce our exposure to certain risks. We determine the level of insurance coverage and the likelihood of a loss and believe that the current levels of risk retention are consistent with those of comparable companies in the industries in which we operate. There can be no assurance that we will not incur losses beyond the limits of our insurance. However, our liquidity, financial position and profitability are not expected to be materially affected by the levels of risk retention that we accept.
| 36 | HUBBELL INCORPORATED - Form 10-K |
The following table presents cost and weighted average interest rate information related to fixed rate interest risk sensitive instruments by maturity at December 31, 2017 (dollars in millions):
| 2018 | 2019 | 2020 | 2021 | 2022 | Thereafter | Total | Fair Value 12/31/17 | |||||||||||||||||
| ASSETS | ||||||||||||||||||||||||
| Available-for-sale investments | $ | 14.5 | $ | 6.1 | $ | 12.9 | $ | 3.5 | $ | 4.0 | $ | 13.3 | $ | 54.3 | $ | 54.3 | ||||||||
| Avg. interest rate | 4.50 | % | 5.00 | % | 5.00 | % | 5.00 | % | 5.00 | % | 4.70 | % | ||||||||||||
| LIABILITIES | ||||||||||||||||||||||||
| Long-term debt | $ | — | $ | — | $ | — | $ | — | $ | — | $ | 987.1 | $ | 987.1 | $ | 1,013.2 | ||||||||
| Avg. interest rate | — | — | — | — | — | 3.37 | % | 3.37 | % |
We use derivative financial instruments only if they are matched with a specific asset, liability, or proposed future transaction. We do not speculate or use leverage when trading a financial derivative product.
In September 2015, we purchased redeemable preferred stock of a privately held company for $5.0 million which is classified as an available-for-sale security, but is not interest rate sensitive and so has been excluded from the above analysis. See also Note 1 — Significant Accounting Policies, Note 6 — Investments and Note 11 — Debt, in the Notes to Consolidated Financial Statements.
| HUBBELL INCORPORATED - Form 10-K | 37 |
Item 8. Financial Statements and Supplementary Data
All other schedules are omitted because they are not applicable or the required information is shown in the consolidated financial statements or notes thereto.
| 38 | HUBBELL INCORPORATED - Form 10-K |
Reports of Management
Report on Management’s Responsibility for Financial Statements
Our management is responsible for the preparation, integrity and fair presentation of its published financial statements. The financial statements have been prepared in accordance with accounting principles generally accepted in the United States of America and include amounts based on informed judgments made by management.
We believe it is critical to provide investors and other users of our financial statements with information that is relevant, objective, understandable and timely, so that they can make informed decisions. As a result, we have established and maintain systems and practices and internal control processes designed to provide reasonable, but not absolute, assurance that transactions are properly executed and recorded and that our policies and procedures are carried out appropriately. Management strives to recruit, train and retain high quality people to ensure that controls are designed, implemented and maintained in a high-quality, reliable manner.
Our independent registered public accounting firm audited our financial statements and the effectiveness of our internal control over financial reporting in accordance with standards established by the Public Company Accounting Oversight Board (United States). Their report appears on the next page within this Annual Report on Form 10-K.
Our Board of Directors normally meets ten times per year to provide oversight, to review corporate strategies and operations, and to assess management’s conduct of the business. The Audit Committee of our Board of Directors is comprised of at least three individuals all of whom must be “independent” under current New York Stock Exchange listing standards and regulations adopted by the SEC under the federal securities laws. The Audit Committee meets regularly with our internal auditors and independent registered public accounting firm, as well as management to review, among other matters, accounting, auditing, internal controls and financial reporting issues and practices. Both the internal auditors and independent registered public accounting firm have full, unlimited access to the Audit Committee.
Management’s Annual Report on Internal Control over Financial Reporting
Management is responsible for establishing and maintaining adequate systems of internal control over financial reporting as defined by Rules 13a-15(f) and 15d-15(f) under the Securities Exchange Act of 1934. Our internal control over financial reporting is designed to provide reasonable assurance regarding the reliability of financial reporting and the preparation of financial statements for external reporting purposes in accordance with generally accepted accounting principles. Because of its inherent limitations, internal control over financial reporting may not prevent or detect misstatements. Management has assessed the effectiveness of our internal control over financial reporting as of December 31, 2017. In
making this assessment, management used the criteria set forth in Internal Control-Integrated Framework (2013 framework) issued by the Committee of Sponsoring Organizations of the Treadway Commission ("COSO"). Based on this assessment, management concluded that our internal control over financial reporting was effective at a reasonable assurance level as of December 31, 2017.
The effectiveness of our internal control over financial reporting as of December 31, 2017 has been audited by PricewaterhouseCoopers LLP, our independent registered public accounting firm as stated in their report which is included on the next page within this Annual Report on Form 10-K.
| /s/ DAVID G. NORD | /s/ WILLIAM R. SPERRY | |
| David G. Nord | William R. Sperry | |
| Chairman of the Board, President and Chief Executive Officer | Senior Vice President and Chief Financial Officer |
| HUBBELL INCORPORATED - Form 10-K | 39 |
Report of Independent Registered Public Accounting Firm
To the Board of Directors and Shareholders of Hubbell Incorporated
Opinions on the Financial Statements and Internal Control over Financial Reporting
We have audited the accompanying consolidated balance sheets of Hubbell Incorporated and its subsidiaries as of December 31, 2017 and 2016, and the related consolidated statements of income, comprehensive income, changes in equity and cash flows for each of the three years in the period ended December 31, 2017, including the related notes and schedule of valuation and qualifying accounts and reserves for each of the three years in the period ended December 31, 2017 appearing under Item 15 (collectively referred to as the “consolidated financial statements”). We also have audited the Company's internal control over financial reporting as of December 31, 2017, based on criteria established in Internal Control - Integrated Framework (2013) issued by the Committee of Sponsoring Organizations of the Treadway Commission (COSO).
In our opinion, the consolidated financial statements referred to above present fairly, in all material respects, the financial position of the Company as of December 31, 2017 and 2016, and the results of their operations and their cash flows for each of the three years in the period ended December 31, 2017 in conformity with accounting principles generally accepted in the United States of America. Also in our opinion, the Company maintained, in all material respects, effective internal control over financial reporting as of December 31, 2017, based on criteria established in Internal Control - Integrated Framework (2013) issued by the COSO.
Basis for Opinions
The Company's management is responsible for these consolidated financial statements, for maintaining effective internal control over financial reporting, and for its assessment of the effectiveness of internal control over financial reporting, included in the accompanying Management’s Annual Report on Internal Control over Financial Reporting. Our responsibility is to express opinions on the Company’s consolidated financial statements and on the Company's internal control over financial reporting based on our audits. We are a public accounting firm registered with the Public Company Accounting Oversight Board (United States) ("PCAOB") and are required to be independent with respect to the Company in accordance with the U.S. federal securities laws and
Showing the first 8K of 183K characters. Open the full section
Item 9. Changes in and Disagreements with Accountants on Accounting and Financial Disclosure
Not applicable.
Item 9A. Controls and Procedures
The Company maintains disclosure controls and procedures that are designed to ensure that information required to be disclosed in Exchange Act reports is recorded, processed, summarized and reported within the time periods specified in the SEC’s rules and forms, and that such information is accumulated and communicated to management, including the Chief Executive Officer and Chief Financial Officer, as appropriate, to allow timely decisions regarding required disclosure. Management necessarily applied its judgment in assessing the costs and benefits of such controls and procedures which, by their nature, can provide only reasonable assurance that the controls and procedures will meet their objectives.
The Company carried out an evaluation, under the supervision and with the participation of management, including the Chief Executive Officer and Chief Financial Officer, of the effectiveness of the design and operation of the Company’s disclosure controls and procedures as defined in Exchange Act Rules 13a-15(e) and 15d-15(e), as of the end of the period covered by this report on Form 10-K. Based upon that evaluation, each of the Chief Executive Officer and Chief Financial Officer concluded that the Company’s disclosure controls and procedures are effective at a reasonable assurance level. Management’s annual report on internal control over financial reporting and the independent registered public accounting firm’s audit report on the effectiveness of our internal control over financial reporting as of December 31, 2017 are included in Item 8 of this Annual Report on Form 10-K.
There have been no changes in the Company’s internal control over financial reporting that occurred during the Company’s most recently completed quarter that have materially affected, or are reasonably likely to materially affect, the Company’s internal control over financial reporting.
Item 9B. Other Information
Not applicable.
| 84 | HUBBELL INCORPORATED - Form 10-K |
| PART III |
Item 10. Directors, Executive Officers and Corporate Governance(1)
Item 11. Executive Compensation(2)
Item 12. Security Ownership of Certain Beneficial Owners and Management and Related Stockholder Matters
Equity Compensation Plan Information
The following table provides information as of December 31, 2017 with respect to the Company’s common stock that may be issued under the Company’s equity compensation plans (in thousands, except per share amounts):
| A | B | C | ||||||||
| Plan Category | Number of Securities to be Issued upon Exercise of Outstanding Options,Warrants and Rights | Weighted Average Exercise Price of Outstanding Options, Warrants and Rights | Number of Securities Remaining Available for Future Issuance Under Equity Compensation Plans (Excluding Securities Reflected in Column A) | |||||||
| Equity Compensation Plans Approved by Shareholders(a) | 2,528 | (c)(e) | $ | 103.60 | (f) | 2,609 | (c) | |||
| Equity Compensation Plans Not Requiring Shareholder Approval(b) | 66 | (c)(d) | — | 161 | (c) | |||||
| TOTAL | 2,594 | $ | 103.60 | 2,770 |
| (a) | The Company’s (1) Stock Option Plan for Key Employees and (2) 2005 Incentive Award Plan as amended and restated. |
| (b) | The Company’s Deferred Compensation Plan for Directors as amended and restated. |
| (c) | Hubbell Common Stock. |
| (d) | Represents amount of shares currently deferred under this plan. These shares are not included in the total weighted average exercise price included in column B. |
| (e) | Includes 486 thousand performance share awards assuming a maximum payout target. The Company does not anticipate that the maximum payout target will be achieved for all of these awards. |
| (f) | Weighted average exercise price excludes performance share awards included in column A. |
The remaining information required by this item is incorporated by reference to the subheading “Voting Rights and Security Ownership of Certain Beneficial Owners and Management” of the definitive proxy statement for the Company’s annual meeting of shareholders scheduled to be held on May 1, 2018.
| (1) | Certain of the information required by this item regarding executive officers is included under the subheading “Executive Officers of the Registrant” at the end of Part I of this Form 10-K and the remaining required information is incorporated by reference to the subheadings “Election of Directors – Proposal 1," “General – Section 16(a) Beneficial Ownership Reporting Compliance,” “Corporate Governance – Code of Business Conduct and Ethics,” and “Corporate Governance – Board Committees – Audit Committee” of the definitive proxy statement for the Company’s annual meeting of shareholders scheduled to be held on May 1, 2018. |
| (2) | The information required by this item is incorporated by reference to the subheadings “Compensation Discussion and Analysis,” “Compensation Committee Report,” “Executive Compensation” and “Compensation of Directors” of the definitive proxy statement for the Company’s annual meeting of shareholders scheduled to be held on May 1, 2018. |
| HUBBELL INCORPORATED - Form 10-K | 85 |
Item 13. Certain Relationships and Related Transactions and Director Independence(3)
Item 14. Principal Accountant Fees and Services(4)
| (3) | The information required by this item is incorporated by reference to the subheadings “General – Review and Approval of Related Person Transactions” and “Corporate Governance – Director Independence” of the definitive proxy statement for the Company’s annual meeting of shareholders scheduled to be held on May 1, 2018. |
| (4) | The information required by this item is incorporated by reference to the heading “Ratification of the Selection of Independent Registered Public Accounting Firm – Proposal 2” of the definitive proxy statement for the Company’s annual meeting of shareholders scheduled to be held on May 1, 2018. |
| 86 | HUBBELL INCORPORATED - Form 10-K |
| PART IV |
Item 15. Exhibits and Financial Statement Schedule
- Financial Statements and Schedule
Financial statements and schedule listed in the Index to Financial Statements and Schedule are filed as part of this Annual Report on Form 10-K.
- Exhibits
| HUBBELL INCORPORATED - Form 10-K | 87 |
| 88 | HUBBELL INCORPORATED - Form 10-K |
| HUBBELL INCORPORATED - Form 10-K | 89 |
| † | A management contract or compensatory plan or arrangement required to be filed as an exhibit pursuant to Item 15(a)(3) of Form 10-K. |
| †† | Schedules and exhibits have been omitted pursuant to Item 601(b)(2) of Regulation S-K. The Company agrees to furnish supplemental copies of such omitted schedules and exhibits to the Securities and Exchange Commission upon request. |
| * | Filed herewith. |
| ** | Furnished herewith. |
| 90 | HUBBELL INCORPORATED - Form 10-K |
Signatures
Pursuant to the requirements of Section 13 or 15(d) of the Securities Exchange Act of 1934, the registrant has duly caused this report to be signed on its behalf by the undersigned, thereunto duly authorized.
| HUBBELL INCORPORATED | ||||
| By | /s/ JOSEPH A. CAPOZZOLI | By | /s/ WILLIAM R. SPERRY | |
| Joseph A. Capozzoli | William R. Sperry | |||
| Vice President, Controller | Senior Vice President and Chief | |||
| Financial Officer | ||||
| Date: | February 15, 2018 |
Pursuant to the requirements of the Securities Exchange Act of 1934, this report has been signed below by the following persons on behalf of the registrant and in the capacities and on the dates indicated.(1)
| Title | Date | ||
| By | /s/ D. G. NORD D. G. Nord | Chairman, President and Chief Executive Officer and Director | 2/15/2018 |
| By | /s/ W. R. SPERRY W. R. Sperry | Senior Vice President and Chief Financial Officer | 2/15/2018 |
| By | /s/ J. A. CAPOZZOLI J. A. Capozzoli | Vice President, Controller (Principal Accounting Officer) | 2/15/2018 |
| By | /s/ C. M. CARDOSO C. M. Cardoso | Director | 2/15/2018 |
| By | /s/ A. J. GUZZI A. J. Guzzi | Director | 2/15/2018 |
| By | /s/ N. J. KEATING N. J. Keating | Director | 2/15/2018 |
| By | /s/ J. F. MALLOY J. F. Malloy | Director | 2/15/2018 |
| By | /s/ JUDITH F. MARKS J.F. Marks | Director | 2/15/2018 |
| By | /s/ J. G. RUSSELL J. G. Russell | Director | 2/15/2018 |
| By | /s/ S. R. SHAWLEY S. R. Shawley | Director | 2/15/2018 |
| By | /s/ R. J. SWIFT R. J. Swift | Director | 2/15/2018 |
| (1) | As of February 15, 2018. |
| HUBBELL INCORPORATED - Form 10-K | 91 |
Valuation and Qualifying Accounts and Reserves for the Years Ended December 31, 2015, 2016 and 2017
Reserves deducted in the balance sheet from the assets to which they apply (in millions):
| Balance at Beginning of Year | Additions / (Reversals) Charged to Costs and Expenses | Deductions | Acquisitions | Balance at End of Year | ||||||||||||||||
| Allowances for doubtful accounts receivable: | ||||||||||||||||||||
| Year 2015 | $ | 3.4 | $ | 2.7 | $ | (1.4 | ) | $ | — | $ | 4.7 | |||||||||
| Year 2016 | $ | 4.7 | $ | 0.8 | $ | (0.8 | ) | $ | — | $ | 4.7 | |||||||||
| Year 2017 | $ | 4.7 | $ | 1.5 | $ | (3.5 | ) | $ | 1.9 | $ | 4.6 | |||||||||
| Allowance for credit memos, returns and cash discounts: | ||||||||||||||||||||
| Year 2015 | $ | 36.7 | $ | 233.2 | $ | (228.4 | ) | $ | — | $ | 41.5 | |||||||||
| Year 2016 | $ | 41.5 | $ | 249.2 | $ | (244.8 | ) | $ | — | $ | 45.9 | |||||||||
| Year 2017 | $ | 45.9 | $ | 260.8 | $ | (256.3 | ) | $ | 0.1 | $ | 50.5 | |||||||||
| Valuation allowance on deferred tax assets: | ||||||||||||||||||||
| Year 2015 | $ | 34.3 | $ | (12.3 | ) | $ | — | $ | — | $ | 22.0 | |||||||||
| Year 2016 | $ | 22.0 | $ | 0.6 | $ | — | $ | — | $ | 22.6 | ||||||||||
| Year 2017 | $ | 22.6 | $ | (3.2 | ) | $ | — | $ | — | $ | 19.4 |
| 92 | HUBBELL INCORPORATED - Form 10-K |