 filings.tools
Item 5. Market for the Registrant’s Common Equity, Related Stockholder Matters and Issuer Purchases of Equity Securities
4K characters. Original on sec.gov · Markdown
Item 5. Market for the Registrant’s Common Equity, Related Stockholder Matters and Issuer Purchases of Equity Securities
The Company's Common Stock trades on the New York Stock Exchange under the symbol, "HUBB".
The number of common shareholders of record on February 8, 2022 was 1,260.
Our dividends are declared at the discretion of our Board of Directors. In October 2021, the Company’s Board of Directors approved an increase in the common stock dividend rate from $0.98 to $1.05 per share per quarter. The increased quarterly dividend payment commenced with the December 15, 2021 payment made to the shareholders of record on November 30, 2021.
The information required by Item 5 with respect to securities authorized for issuance under equity compensation plans is incorporated herein by reference to Part III, Item 12 of this Form 10-K.
Purchases of Equity Securities
On October 23, 2020 the Board of Directors approved a new stock repurchase program (the "October 2020 program") that authorized the repurchase of up to $300 million of common stock and expires in October 2023. At December 31, 2021 our remaining share repurchase authorization under the October 2020 program is $288.8 million. The Company repurchased $11.2 million and $41.3 million of shares of Common Stock, in 2021 and 2020, respectively. All of the repurchases in 2020 were completed prior to the expiration of the October 2017 program. Subject to numerous factors, including market conditions and alternative uses of cash, we may conduct discretionary repurchases through open market or privately negotiated transactions, which may include repurchases under plans complying with Rules 10b5-1 and 10b-18 under the Securities Exchange Act of 1934, as amended.
There were no share repurchases during the quarter ended December 31, 2021.
| 18 | HUBBELL INCORPORATED - Form 10-K |
Corporate Performance Graph
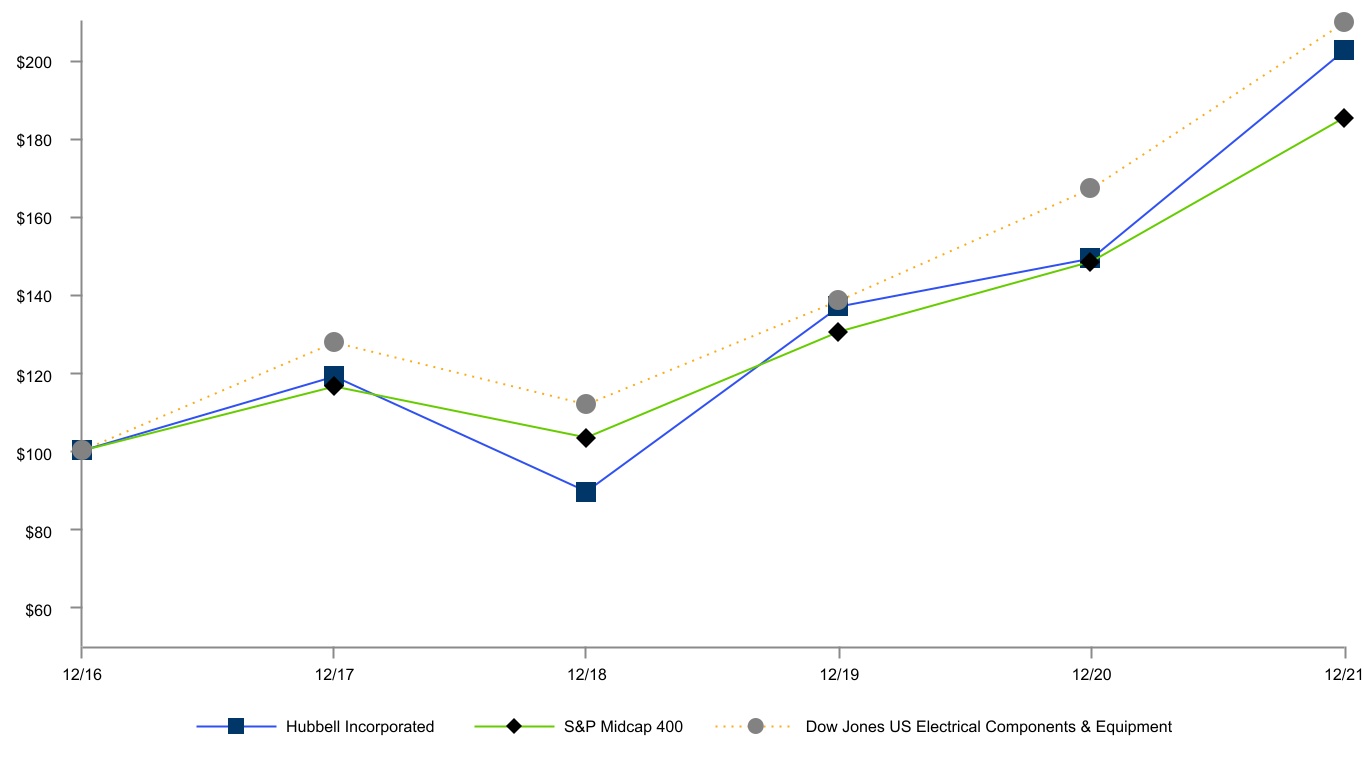
The following graph compares the total return to shareholders on the Company’s common stock during the five years ended December 31, 2021, with a cumulative total return on the (i) Standard & Poor’s MidCap 400 (“S&P MidCap 400”) and (ii) the Dow Jones U.S. Electrical Components & Equipment Index (“DJUSEC”). The Company is a member of the S&P MidCap 400. The comparison assumes $100 was invested on December 31, 2016 in the Company’s Common Stock and in each of the foregoing indices and assumes reinvestment of dividends.
COMPARISON OF 5 YEAR CUMULATIVE TOTAL RETURN
Among Hubbell Incorporated, the S&P Midcap 400 Index
and the Dow Jones US Electrical Components & Equipment Index
| 12/16 | 12/17 | 12/18 | 12/19 | 12/20 | 12/21 | |||||||||||||||
| Hubbell, Inc. | 100.00 | 118.81 | 89.56 | 136.89 | 149.08 | 202.14 | ||||||||||||||
| S&P Midcap 400 | 100.00 | 116.24 | 103.36 | 130.44 | 148.26 | 184.96 | ||||||||||||||
| Dow Jones US Electrical Components & Equipment | 100.00 | 127.46 | 111.82 | 138.30 | 166.99 | 209.33 |
| HUBBELL INCORPORATED - Form 10-K | 19 |
Previous: Item 4. Mine Safety Disclosures · Next: Item 6. [Reserved]