 filings.tools
Humana 10-K 2018-12-31
Filed 2019-02-21. 22 sections, 572K characters. Original on sec.gov · Markdown · JSON
Cover and table of contents
10-K 1 hum-20181231x10k.htm 10-K
UNITED STATES
SECURITIES AND EXCHANGE COMMISSION
Washington, D.C. 20549
FORM 10-K
| þ | ANNUAL REPORT PURSUANT TO SECTION 13 OR 15(d) OF THE SECURITIES EXCHANGE ACT OF 1934 |
For the fiscal year ended December 31, 2018
OR
| ¨ | TRANSITION REPORT PURSUANT TO SECTION 13 OR 15 (d) OF THE SECURITIES EXCHANGE ACT OF 1934 |
For the transition period from to
Commission file number 1-5975
HUMANA INC.
(Exact name of registrant as specified in its charter)
| Delaware | 61-0647538 | |
| (State of incorporation) | (I.R.S. Employer Identification Number) | |
| 500 West Main Street Louisville, Kentucky | 40202 | |
| (Address of principal executive offices) | (Zip Code) | |
| Registrant’s telephone number, including area code: (502) 580-1000 Securities registered pursuant to Section 12(b) of the Act: | ||
| Title of each class | Name of exchange on which registered | |
| Common stock, $0.16 2/3 par value | New York Stock Exchange |
Securities registered pursuant to Section 12(g) of the Act: None
Indicate by check mark if the registrant is a well-known seasoned issuer, as defined in Rule 405 of the Securities Act. Yes þ No ¨
Indicate by check mark if the registrant is not required to file reports pursuant to Section 13 or Section 15(d) of the Act. Yes ¨ No þ
Indicate by check mark whether the registrant (1) has filed all reports required to be filed by Section 13 or 15(d) of the Securities Exchange Act of 1934 during the preceding 12 months (or for such shorter period that the registrant was required to file such reports), and (2) has been subject to such filing requirements for the past 90 days. Yes þ No ¨
Indicate by check mark whether the registrant has submitted electronically every Interactive Data File required to be submitted pursuant to Rule 405 of Regulation S-T (§ 232.405 of this chapter) during the preceding 12 months (or for such shorter period that the registrant was required to submit such files). Yes þ No ¨
Indicate by check mark if disclosure of delinquent filers pursuant to Item 405 of Regulation S-K (§ 229.405 of this chapter) is not contained herein, and will not be contained, to the best of registrant’s knowledge, in definitive proxy or information statements incorporated by reference in Part III of this Form 10-K or any amendment to this Form 10-K. ¨
Indicate by check mark whether the registrant is a large accelerated filer, an accelerated filer, a non-accelerated filer, a smaller reporting company, or an emerging growth company. See the definitions of “large accelerated filer,” “accelerated filer,” “smaller reporting company,”and "emerging growth company" in Rule 12b-2 of the Exchange Act.
Large accelerated filer þ Accelerated filer ¨ Non-accelerated filer ¨ Smaller reporting company ¨ Emerging growth company ¨
If an emerging growth company, indicate by check mark if the registrant has elected not to use the extended transition period for complying with any new or revised financial accounting standards provided pursuant to Section 13(a) of the Exchange Act. ¨
Indicate by check mark whether the registrant is a shell company (as defined in Rule 12b-2 of the Exchange Act). Yes ¨ No þ
The aggregate market value of voting stock held by non-affiliates of the Registrant as of June 30, 2018 was $41,129,697,151 calculated using the average price on June 30, 2018 of $299.02.
The number of shares outstanding of the Registrant’s Common Stock as of January 31, 2019 was 135,566,909.
DOCUMENTS INCORPORATED BY REFERENCE
Parts II and III incorporate herein by reference portions of the Registrant’s Proxy Statement to be filed pursuant to Regulation 14A with respect to the Annual Meeting of Stockholders scheduled to be held on April 18, 2019.
HUMANA INC.
INDEX TO ANNUAL REPORT ON FORM 10-K
For the Year Ended December 31, 2018
Forward-Looking Statements
Some of the statements under “Business,” “Management’s Discussion and Analysis of Financial Condition and Results of Operations,” and elsewhere in this report may contain forward-looking statements which reflect our current views with respect to future events and financial performance. These forward-looking statements are made within the meaning of Section 27A of the Securities Act of 1933 and Section 21E of the Securities Exchange Act of 1934, or the Exchange Act. We intend such forward-looking statements to be covered by the safe harbor provisions for forward-looking statements contained in the Private Securities Litigation Reform Act of 1995, and we are including this statement for purposes of complying with these safe harbor provisions. We have based these forward-looking statements on our current expectations and projections about future events, trends and uncertainties. These forward-looking statements are not guarantees of future performance and are subject to risks, uncertainties and assumptions, including the information discussed under the section entitled “Risk Factors” in this report. In making these statements, we are not undertaking to address or update them in future filings or communications regarding our business or results. Our business is highly complicated, regulated and competitive with many different factors affecting results.
PART I
Item 1. BUSINESS
General
Headquartered in Louisville, Kentucky, Humana Inc. and its subsidiaries, referred to throughout this document as “we,” “us,” “our,” the “Company” or “Humana,” is a leading health and well-being company committed to helping our millions of medical and specialty members achieve their best health. Our successful history in care delivery and health plan administration is helping us create a new kind of integrated care with the power to improve health and well‐being and lower costs. Our efforts are leading to a better quality of life for people with Medicare, families, individuals, military service personnel, and communities at large. To accomplish that, we support physicians and other health care professionals as they work to deliver the right care in the right place for their patients, our members. Our range of clinical capabilities, resources and tools, such as in‐home care, behavioral health, pharmacy services, data analytics and wellness solutions, combine to produce a simplified experience that makes health care easier to navigate and more effective.
As of December 31, 2018, we had approximately 17 million members in our medical benefit plans, as well as approximately 6 million members in our specialty products. During 2018, 81% of our total premiums and services revenue were derived from contracts with the federal government, including 15% derived from our individual Medicare Advantage contracts in Florida with the Centers for Medicare and Medicaid Services, or CMS, under which we provide health insurance coverage to approximately 636,800 members as of December 31, 2018.
Humana Inc. was organized as a Delaware corporation in 1964. Our principal executive offices are located at 500 West Main Street, Louisville, Kentucky 40202, the telephone number at that address is (502) 580-1000, and our website address is www.humana.com. We have made available free of charge through the Investor Relations section of our web site our annual reports on Form 10-K, quarterly reports on Form 10-Q, current reports on Form 8-K, proxy statements, and, if applicable, amendments to those reports filed or furnished pursuant to Section 13(a) of the Exchange Act, as soon as reasonably practicable after we electronically file such material with, or furnish it to, the Securities and Exchange Commission.
This Annual Report on Form 10-K, or 2018 Form 10-K, contains both historical and forward-looking information. See Item 1A. – Risk Factors in this 2018 Form 10-K for a description of a number of factors that may adversely affect our results or business.
Business Segments
We manage our business with four reportable segments: Retail, Group and Specialty, Healthcare Services, and Individual Commercial. In addition, the Other Businesses category includes businesses that are not individually reportable because they do not meet the quantitative thresholds required by generally accepted accounting principles. These segments are based on a combination of the type of health plan customer and adjacent businesses centered on well-being solutions for our health plans and other customers, as described below. These segment groupings are consistent with information used by our Chief Executive Officer to assess performance and allocate resources. See Note 17 to the consolidated financial statements included in Item 8. - Financial Statements and Supplementary Data for segment financial information.
Our Products
Our medical and specialty insurance products allow members to access health care services primarily through our networks of health care providers with whom we have contracted. These products may vary in the degree to which members have coverage. Health maintenance organizations, or HMOs, include comprehensive managed care benefits generally through a participating network of physicians, hospitals, and other providers. Preferred provider organizations, or PPOs, provide members the freedom to choose any health care provider. However PPOs generally require the member to pay a greater portion of the provider’s fee in the event the member chooses not to use a provider participating in the PPO’s network. Point of Service, or POS, plans combine the advantages of HMO plans with the flexibility of PPO plans. In general, POS plans allow members to choose, at the time medical services are needed, to seek care from a provider within the plan’s network or outside the network. In addition, we offer services to our health plan members as well as to third parties that promote health and wellness, including pharmacy solutions, provider, and clinical programs, as well as services and capabilities to advance population health. At the core of our strategy is our integrated care delivery model, which unites quality care, high member engagement, and sophisticated data analytics. Three core elements of the model are to improve the consumer experience by simplifying the interaction with us, engaging members in clinical programs, and offering assistance to providers in transitioning from a fee-for-service to a value-based arrangement. Our approach to primary, physician-directed care for our members aims to provide quality care that is consistent, integrated, cost-effective, and member-focused. The model is designed to improve health outcomes and affordability for individuals and for the health system as a whole, while offering our members a simple, seamless healthcare experience. The discussion that follows describes the products offered by each of our segments.
Our Retail Segment Products
This segment is comprised of products sold on a retail basis to individuals including medical and supplemental benefit plans described in the discussion that follows. The following table presents our premiums and services revenue for the Retail segment by product for the year ended December 31, 2018:
| Retail Segment Premiums and Services Revenue | Percent of Consolidated Premiums and Services Revenue | ||||||
| (dollars in millions) | |||||||
| Premiums: | |||||||
| Individual Medicare Advantage | $ | 35,656 | 63.2 | % | |||
| Group Medicare Advantage | 6,103 | 10.8 | % | ||||
| Medicare stand-alone PDP | 3,584 | 6.4 | % | ||||
| Total Retail Medicare | 45,343 | 80.4 | % | ||||
| State-based Medicaid | 2,255 | 4.0 | % | ||||
| Medicare Supplement | 510 | 0.9 | % | ||||
| Total premiums | 48,108 | 85.3 | % | ||||
| Services | 11 | — | % | ||||
| Total premiums and services revenue | $ | 48,119 | 85.3 | % |
Medicare
We have participated in the Medicare program for private health plans for over 30 years and have established a national presence, offering at least one type of Medicare plan in all 50 states. We have a geographically diverse membership base that we believe provides us with greater ability to expand our network of PPO and HMO providers. We employ strategies including health assessments and clinical guidance programs such as lifestyle and fitness programs for seniors to guide Medicare beneficiaries in making cost-effective decisions with respect to their health care. We believe these strategies result in cost savings that occur from making positive behavior changes.
Medicare is a federal program that provides persons age 65 and over and some disabled persons under the age of 65 certain hospital and medical insurance benefits. CMS, an agency of the United States Department of Health and Human Services, administers the Medicare program. Hospitalization benefits are provided under Part A, without the payment of any premium, for up to 90 days per incident of illness plus a lifetime reserve aggregating 60 days. Eligible beneficiaries are required to pay an annually adjusted premium to the federal government to be eligible for physician care and other services under Part B. Beneficiaries eligible for Part A and Part B coverage under traditional fee-for-service Medicare are still required to pay out-of-pocket deductibles and coinsurance. Throughout this document this program is referred to as Medicare FFS. As an alternative to Medicare FFS, in geographic areas where a managed care organization has contracted with CMS pursuant to the Medicare Advantage program, Medicare beneficiaries may choose to receive benefits from a Medicare Advantage organization under Medicare Part C. Pursuant to Medicare Part C, Medicare Advantage organizations contract with CMS to offer Medicare Advantage plans to provide benefits at least comparable to those offered under Medicare FFS. Our Medicare Advantage, or MA, plans are discussed more fully below. Prescription drug benefits are provided under Part D.
Individual Medicare Advantage Products
We contract with CMS under the Medicare Advantage program to provide a comprehensive array of health insurance benefits, including wellness programs, chronic care management, and care coordination, to Medicare eligible persons under HMO, PPO, and Private Fee-For-Service, or PFFS, plans in exchange for contractual payments received from CMS, usually a fixed payment per member per month. With each of these products, the beneficiary receives benefits in excess of Medicare FFS, typically including reduced cost sharing, enhanced prescription drug benefits, care coordination, data analysis techniques to help identify member needs, complex case management, tools to guide members in their health care decisions, care management programs, wellness and prevention programs and, in some instances, a reduced monthly Part B premium. Most Medicare Advantage plans offer the prescription drug benefit under Part D as part of the basic plan, subject to cost sharing and other limitations. Accordingly, all of the provisions of the Medicare Part D program described in connection with our stand-alone prescription drug plans in the following section also are applicable to most of our Medicare Advantage plans. Medicare Advantage plans may charge beneficiaries monthly premiums and other copayments for Medicare-covered services or for certain extra benefits. Generally, Medicare-eligible individuals enroll in one of our plan choices between October 15 and December 7 for coverage that begins on the following January 1.
Our Medicare HMO and PPO plans, which cover Medicare-eligible individuals residing in certain counties, may eliminate or reduce coinsurance or the level of deductibles on many other medical services while seeking care from participating in-network providers or in emergency situations. Except in emergency situations or as specified by the plan, most HMO plans provide no out-of-network benefits. PPO plans carry an out-of network benefit that is subject to higher member cost-sharing. In some cases, these beneficiaries are required to pay a monthly premium to the HMO or PPO plan in addition to the monthly Part B premium they are required to pay the Medicare program.
Most of our Medicare PFFS plans are network-based products with in and out of network benefits due to a requirement that Medicare Advantage organizations establish adequate provider networks, except in geographic areas that CMS determines have fewer than two network-based Medicare Advantage plans. In these areas, we offer Medicare PFFS plans that have no preferred network. Individuals in these plans pay us a monthly premium to receive typical Medicare Advantage benefits along with the freedom to choose any health care provider that accepts individuals at rates equivalent to Medicare FFS payment rates.
CMS uses monthly rates per person for each county to determine the fixed monthly payments per member to pay to health benefit plans. These rates are adjusted under CMS’s risk-adjustment model which uses health status indicators, or risk scores, to improve the accuracy of payment. The risk-adjustment model, which CMS implemented pursuant to the Balanced Budget Act of 1997 (BBA) and the Benefits Improvement and Protection Act of 2000 (BIPA), generally pays more for members with predictably higher costs and uses principal hospital inpatient diagnoses as well as diagnosis data from ambulatory treatment settings (hospital outpatient department and physician visits) to establish the risk-adjustment payments. Under the risk-adjustment methodology, all health benefit organizations must collect from providers and submit the necessary diagnosis code information to CMS within prescribed deadlines. CMS is phasing-in the process of calculating risk scores using diagnoses data from the Risk Adjustment Processing System, or RAPS, to diagnoses data from the Encounter Data System, or EDS. The RAPS process requires MA plans to apply a filter logic based on CMS guidelines and only submit diagnoses that satisfy those guidelines. For submissions through EDS, CMS requires MA plans to submit all the encounter data and CMS will apply the risk adjustment filtering logic to determine the risk scores. For 2018, 15% of the risk score was calculated from claims data submitted through EDS. In 2019 and 2020 CMS will increase that percentage to 25% and 50%, respectively. For more information refer to Note 16 to the consolidated financial statements included in Item 8. – Financial Statements and Supplementary Data and Item 1A. - Risk Factors.
At December 31, 2018, we provided health insurance coverage under CMS contracts to approximately 3,064,000 individual Medicare Advantage members, including approximately 636,800 members in Florida. These Florida contracts accounted for premiums revenue of approximately $8.2 billion, which represented approximately 23.0% of our individual Medicare Advantage premiums revenue, or 14.6% of our consolidated premiums and services revenue for the year ended December 31, 2018.
Our HMO, PPO, and PFFS products covered under Medicare Advantage contracts with CMS are renewed generally for a calendar year term unless CMS notifies us of its decision not to renew by May 1 of the calendar year in which the contract would end, or we notify CMS of our decision not to renew by the first Monday in June of the calendar year in which the contract would end. All material contracts between Humana and CMS relating to our Medicare Advantage products have been renewed for 2019, and all of our product offerings filed with CMS for 2019 have been approved.
Individual Medicare Stand-Alone Prescription Drug Products
We offer stand-alone prescription drug plans, or PDPs, under Medicare Part D, including a PDP offering co-branded with Wal-Mart Stores, Inc., or the Humana-Walmart plan. Generally, Medicare-eligible individuals enroll in one of our plan choices between October 15 and December 7 for coverage that begins on the following January 1. Our stand-alone PDP offerings consist of plans offering basic coverage with benefits mandated by Congress, as well as plans providing enhanced coverage with varying degrees of out-of-pocket costs for premiums, deductibles, and co-insurance. Our revenues from CMS and the beneficiary are determined from our PDP bids submitted annually to CMS. These revenues also reflect the health status of the beneficiary and risk sharing provisions as more fully described in Note 2 to the consolidated financial statements included in Item 8. – Financial Statements and Supplementary Data, titled “Medicare Part D.” Our stand-alone PDP contracts with CMS are renewed generally for a calendar year term unless CMS notifies us of its decision not to renew by May 1 of the calendar year in which the contract would end, or we notify CMS of our decision not to renew by the first Monday in June of the calendar year in which the contract would end. All material contracts between Humana and CMS relating to our Medicare stand-alone PDP products have been renewed for 2019, and all of our product offerings filed with CMS for 2019 have been approved.
We have administered CMS’s Limited Income Newly Eligible Transition, or LI-NET, prescription drug plan program since 2010. This program allows individuals who receive Medicare’s low-income subsidy to also receive immediate prescription drug coverage at the point of sale if they are not already enrolled in a Medicare Part D plan. CMS temporarily enrolls newly identified individuals with both Medicare and Medicaid into the LI-NET prescription drug plan program, and subsequently transitions each member into a Medicare Part D plan that may or may not be a Humana Medicare plan.
Group Medicare Advantage and Medicare stand-alone PDP
We offer products that enable employers that provide post-retirement health care benefits to replace Medicare wrap or Medicare supplement products with Medicare Advantage or stand-alone PDPs from Humana. These products offer the same types of benefits and services available to members in our individual Medicare plans discussed previously and can be tailored to closely match an employer’s post-retirement benefit structure.
State-based Medicaid Contracts
Our state-based contracts allow us to serve members enrolled in state-based Medicaid programs including Temporary Assistance to Needy Families, or TANF, Aged, Blind, and Disabled, or ABD, Long-Term Support Services, or LTSS, and the CMS Financial Alignment dual eligible demonstration programs. TANF and ABD programs are traditional Medicaid programs that are state and federally funded and provide cash assistance and supportive services to assist qualifying aged, blind, or disabled individuals, as well as families with children under age 18, helping them achieve economic self-sufficiency. LTSS is a state and federally funded program that offers states a broad and flexible set of program design options and refers to the delivery of long-term support services for our members who receive home and community or institution-based services for long-term care. Our contracts are generally for three to five year terms.
We have contracts to serve Medicaid eligible members in Florida and Kentucky under traditional programs, as well as contracts in Florida under the LTSS program. Our Kentucky Medicaid contract is subject to a 100% coinsurance contract with CareSource Management Group Company, ceding all the risk to CareSource.
Medicare beneficiaries who also qualify for Medicaid due to low income or special needs are known as dual eligible beneficiaries, or dual eligibles. The dual eligible population represents a disproportionate share of Medicaid and Medicare costs. States require special coordinating contracts for plans to offer Medicare Advantage dual eligible special needs plans, or D-SNPs. These largely operate separate from traditional Medicaid and LTSS programs. Some states are moving to support the dual eligible population by linking D-SNP participation to enrollment in a plan that also participates in a state-based Medicaid program to coordinate and integrate both Medicare and Medicaid benefits. Beginning in 2021, based on new federal requirements, D-SNPs will be required to more fully integrate Medicare and Medicaid benefits and states will have authority to require linkages to state-based traditional Medicaid and/or LTSS contracts or alternatively, allow D-SNPs to operate without a link to such state-based contracts while meeting additional coordination standards; CMS has yet to finalize regulations.
We currently serve dual eligible members under the CMS stand-alone dual eligible demonstration program in Illinois, and continue to serve other dual eligible members enrolled in our Medicare Advantage and stand-alone prescription drug plans.
Our Group and Specialty Segment Products
The Group and Specialty segment consists of employer group commercial fully-insured medical and specialty health insurance benefits marketed to individuals and employer groups, including dental, vision and life insurance benefits, as well as administrative services only, or ASO products as described in the discussion that follows. The following table presents our premiums and services revenue for the Group and Specialty segment by product for the year ended December 31, 2018:
| Group and Specialty Segment Premiums and Services Revenue | Percent of Consolidated Premiums and Services Revenue | ||||||
| (dollars in millions) | |||||||
| External Revenue: | |||||||
| Premiums: | |||||||
| Fully-insured commercial group | $ | 5,444 | 9.7 | % | |||
| Specialty | 1,359 | 2.4 | % | ||||
| Total premiums | 6,803 | 12.1 | % | ||||
| Services | 835 | 1.5 | % | ||||
| Total premiums and services revenue | $ | 7,638 | 13.6 | % | |||
| Intersegment services revenue | $ | 18 | n/a |
n/a – not applicable
Group Commercial Coverage
Our commercial products sold to employer groups include a broad spectrum of major medical benefits with multiple in-network coinsurance levels and annual deductible choices that employers of all sizes can offer to their employees on either a fully-insured, through HMO, PPO, or POS plans, or self-funded basis. Our plans integrate clinical programs, plan designs, communication tools, and spending accounts. We participate in the Federal Employee Health Benefits Program, or FEHBP, primarily with our HMO offering in certain markets. FEHBP is the government’s health insurance program for Federal employees, retirees, former employees, family members, and spouses.
Our administrative services only, or ASO, products are offered to employers who self-insure their employee health plans. We receive fees to provide administrative services which generally include the processing of claims, offering access to our provider networks and clinical programs, and responding to customer service inquiries from members of self-funded employers. These products may include all of the same benefit and product design characteristics of our fully-insured HMO, PPO, or POS products described previously. Under ASO contracts, self-funded employers generally retain the risk of financing substantially all of the cost of health benefits. However, substantially all of our ASO customers purchase stop loss insurance coverage from us to cover catastrophic claims or to limit aggregate annual costs.
Employers can customize their offerings with optional benefits such as dental, vision, and life products. We also offer optional benefits such as dental and vision to individuals.
Military Services
Under our TRICARE contracts with the United States Department of Defense, or DoD, we provide administrative services to arrange health care services for the dependents of active duty military personnel and for retired military personnel and their dependents. We have participated in the TRICARE program since 1996 under contracts with the DoD. Under our contracts, we provide administrative services while the federal government retains all of the risk of the cost of health benefits. Accordingly, we account for revenues under the current contract net of estimated health care costs similar to an administrative services fee only agreement. On January 1, 2018, we began to deliver services under the T2017 East Region contract. The T2017 East Region contract is a consolidation of the former T3 North and South Regions, comprising thirty-two states and approximately 6 million TRICARE beneficiaries. The T2017 East Region contract is a 5-year contract set to expire on December 31, 2022 and is subject to renewals on January 1 of each year during its term at the government's option.
Our Healthcare Services Segment Products
The products offered by our Healthcare Services segment are key to our integrated care delivery model. This segment is comprised of stand-alone businesses that offer services including pharmacy solutions, provider services, clinical care services, and predictive modeling and informatics services to other Humana businesses, as well as external health plan members, external health plans, and other employers or individuals and are described in the discussion that follows. Our intersegment revenue is described in Note 17 to the consolidated financial statements included in Item 8. – Financial Statements and Supplementary Data. The following table presents our services revenue for the Healthcare Services segment by line of business for the year ended December 31, 2018:
| Healthcare Services Segment Services Revenue | Percent of Consolidated Premiums and Services Revenue | ||||||
| (dollars in millions) | |||||||
| Intersegment revenue: | |||||||
| Pharmacy solutions | $ | 20,514 | n/a | ||||
| Provider services | 1,994 | n/a | |||||
| Clinical care services | 662 | n/a | |||||
| Total intersegment revenue | $ | 23,170 | |||||
| External services revenue: | |||||||
| Pharmacy solutions | $ | 203 | 0.4 | % | |||
| Provider services | 228 | 0.4 | % | ||||
| Clinical care services | 176 | 0.3 | % | ||||
| Total external services revenue | $ | 607 | 1.1 | % |
n/a – not applicable
Pharmacy solutions
Humana Pharmacy Solutions®, or HPS, manages traditional prescription drug coverage for both individuals and employer groups in addition to providing a broad array of pharmacy solutions. HPS also operates prescription mail order services for brand, generic, and specialty drugs and diabetic supplies through Humana Pharmacy, Inc.
Provider services
We operate full-service, multi-specialty medical centers in a number of states, primarily in Florida and Texas, staffed by primary care providers and medical specialists practicing cardiology, endocrinology, geriatric medicine, internal medicine, ophthalmology, neurology, and podiatry. Our care delivery subsidiaries operate our medical center business through both employed physicians and care providers, and through third party management service organizations with whom we contract to arrange for and manage certain clinical services.
We also operate Transcend, a Medical Services Organization, or MSO, that coordinates medical care for Medicare Advantage beneficiaries primarily in four states. Transcend provides resources in care coordination, financial risk management, clinical integration and patient engagement that help physicians improve the patient experience as well as care outcomes. Transcend collaborates with physicians, medical groups and integrated delivery systems to successfully transition to value-based care by engaging, partnering and offering practical services and solutions. Transcend represents a key component of our integrated care delivery model which we believe is scalable to new markets.
During 2018, we acquired the remaining equity interest in MCCI Holdings, LLC, or MCCI, a privately held management service organization and healthcare provider headquartered in Miami, Florida, that primarily coordinates medical care for Medicare Advantage beneficiaries in Florida and Texas. In addition, during 2018, we acquired Family Physicians Group, or FPG, which serves Medicare Advantage and Managed Medicaid HMO patients in Greater Orlando, Florida with a footprint that includes clinics located in Lake, Orange, Osceola and Seminole counties. See Note 3 to the consolidated financial statements included in Item 8. - Financial Statements and Supplementary Data.
Clinical care services
Via in-home care, telephonic health counseling/coaching, and remote monitoring, we are actively involved in the care management of our customers with the greatest needs. Clinical care services include the operations of Humana At Home, Inc., or Humana At Home®. As a chronic-care provider of in-home care for seniors, we provide innovative and holistic care coordination services for individuals living with multiple chronic conditions, individuals with disabilities, fragile and aging-in-place members and their care givers. We focus our deployment of these services in geographies with a high concentration of members living with multiple chronic conditions. The clinical support and care provided by Humana At Home is designed to improve health outcomes and result in a higher number of days members can spend at their homes instead of in an acute care facility. At December 31, 2018, we have enrolled approximately 716,000 members, with complex chronic conditions participating in a Humana Chronic Care Program, reflecting enhanced predictive modeling capabilities and focus on proactive clinical outreach and member engagement, particularly for our Medicare Advantage membership. These members may not be unique to each program since members have the ability to enroll in multiple programs. We believe these initiatives lead to better health outcomes for our members and lower health care costs.
We have committed additional investments in our home care capabilities with our acquisition of a 40% minority interest in Kindred at Home, Inc., or Kindred at Home, and Curo Health Services, or Curo, which combined creates the nation's largest home health and hospice provider with 65% overlap with our individual Medicare Advantage business. See Note 3 to the consolidated financial statements included in Item 8. - Financial Statements and Supplementary Data.
We are committed to the integrated physical and mental health of our members. Accordingly, we take a holistic approach to healthcare, offering care management and wellness programs. These programs use our capabilities that enable us to create a more complete view of an individual’s health, designed to connect, coordinate and simplify health care while reducing costs. These capabilities include our health care analytics engine, which reviews billions of clinical data points on millions of patients each day to provide members, providers, and payers real-time clinical insights to identify evidence-based gaps-in-care, drug safety alerts and other critical health concerns to improve outcomes. Additionally, our technology connects Humana and disparate electronic health record systems to enable the exchange of essential health information in real-time to provide physicians and care teams with a single, comprehensive patient view.
Our care management programs take full advantage of the population health, wellness and clinical applications offered by CareHub, our clinical management tool used by providers and care managers across the company to help our members achieve their best health, to offer various levels of support, matching the intensity of the support to the needs of members with ongoing health challenges through telephonic and onsite programs. These programs include Personal Nurse, chronic condition management, and case management as well as programs supporting maternity, cancer, neonatal intensive care unit, and transplant services.
Wellness
We offer wellness solutions including our Go365 wellness and loyalty rewards program, employee assistance program, and clinical programs. These programs, when offered collectively to employer customers as our Total Health product, turn any standard plan of the employer's choosing into an integrated health and well-being solution that encourages participation in these programs.
Our Go365 program provides our members with access to a science-based, actuarially driven wellness and loyalty program that features a wide range of well-being tools and rewards that are customized to an individual’s needs and wants. A key element of the program includes a sophisticated health-behavior-change model supported by an incentive program.
Our Individual Commercial Segment Products
Our individual health plans were marketed under the HumanaOne brand. We offered products both on and off of the public exchange.
We discontinued substantially all off-exchange individual commercial medical plans effective January 1, 2017, and we exited our remaining individual commercial medical business effective January 1, 2018.
Other Businesses
Other Businesses includes those businesses that do not align with the reportable segments previously described, primarily our closed-block long-term care insurance policies, which was sold in 2018. For a detailed discussion of the sale refer to Note 3 to the consolidated financial statements included in Item 8. – Financial Statements and Supplementary Data.
Membership
The following table summarizes our total medical membership at December 31, 2018, by market and product:
| Retail Segment | Group and Specialty Segment | ||||||||||||||||||||
| (in thousands) | |||||||||||||||||||||
| Individual Medicare Advantage | Group Medicare Advantage | Medicare stand- alone PDP | Medicare Supplement | State- based contracts | Fully- insured commercial Group | ASO | Military services | Total | Percent of Total | ||||||||||||
| Florida | 636.8 | 9.9 | 234.2 | 11.4 | 333.4 | 125.7 | 36.2 | — | 1,387.6 | 8.4 | % | ||||||||||
| Texas | 246.9 | 241.9 | 305.1 | 10.6 | — | 171.6 | 30.4 | — | 1,006.5 | 6.1 | % | ||||||||||
| Kentucky | 89.0 | 63.7 | 215.6 | 5.8 | — | 112.6 | 138.5 | — | 625.2 | 3.8 | % | ||||||||||
| California | 70.9 | 0.2 | 484.4 | 20.3 | — | — | — | — | 575.8 | 3.5 | % | ||||||||||
| Georgia | 114.2 | 2.2 | 124.5 | 11.1 | — | 158.5 | 45.2 | — | 455.7 | 2.7 | % | ||||||||||
| Illinois | 108.7 | 23.3 | 185.2 | 5.7 | 7.7 | 46.0 | 76.8 | — | 453.4 | 2.7 | % | ||||||||||
| Ohio | 128.6 | 22.1 | 184.3 | 45.8 | — | 44.6 | 27.5 | — | 452.9 | 2.7 | % | ||||||||||
| Missouri/Kansas | 82.5 | 4.9 | 227.2 | 9.1 | — | 45.0 | 17.4 | — | 386.1 | 2.3 | % | ||||||||||
| North Carolina | 149.5 | 0.5 | 172.6 | 6.0 | — | — | — | — | 328.6 | 2.0 | % | ||||||||||
| Tennessee | 144.3 | 4.3 | 117.2 | 4.9 | — | 41.4 | 12.9 | — | 325.0 | 2.0 | % | ||||||||||
| Louisiana | 161.1 | 12.1 | 61.3 | 2.2 | — | 59.6 | 13.5 | — | 309.8 | 1.9 | % | ||||||||||
| Wisconsin | 58.7 | 10.0 | 121.6 | 6.3 | — | 68.7 | 36.8 | — | 302.1 | 1.8 | % | ||||||||||
| Indiana | 103.5 | 6.8 | 145.8 | 9.0 | — | 21.2 | 12.6 | — | 298.9 | 1.8 | % | ||||||||||
| Virginia | 121.6 | 3.1 | 159.1 | 8.6 | — | — | — | — | 292.4 | 1.8 | % | ||||||||||
| Michigan | 52.9 | 12.9 | 140.2 | 3.4 | — | 2.8 | 0.4 | — | 212.6 | 1.3 | % | ||||||||||
| Arizona | 76.0 | 0.4 | 97.6 | 4.8 | — | 25.0 | 5.5 | — | 209.3 | 1.3 | % | ||||||||||
| Pennsylvania | 46.6 | 0.4 | 156.2 | 4.7 | — | — | — | — | 207.9 | 1.2 | % | ||||||||||
| South Carolina | 87.0 | 0.5 | 71.3 | 5.2 | — | — | — | — | 164.0 | 1.0 | % | ||||||||||
| Military services | — | — | — | — | — | — | — | 5,928.6 | 5,928.6 | 35.8 | % | ||||||||||
| Others | 585.2 | 78.6 | 1,800.9 | 79.4 | — | 82.0 | 28.2 | — | 2,654.3 | 15.9 | % | ||||||||||
| Totals | 3,064.0 | 497.8 | 5,004.3 | 254.3 | 341.1 | 1,004.7 | 481.9 | 5,928.6 | 16,576.7 | 100.0 | % |
Provider Arrangements
We provide our members with access to health care services through our networks of health care providers whom we employ or with whom we have contracted, including hospitals and other independent facilities such as outpatient surgery centers, primary care providers, specialist physicians, dentists, and providers of ancillary health care services and facilities. These ancillary services and facilities include laboratories, ambulance services, medical equipment services, home health agencies, mental health providers, rehabilitation facilities, nursing homes, optical services, and pharmacies. Our membership base and the ability to influence where our members seek care generally enable us to obtain contractual discounts with providers.
We use a variety of techniques to provide access to effective and efficient use of health care services for our members. These techniques include the coordination of care for our members, product and benefit designs, hospital inpatient management systems, the use of sophisticated analytics, and enrolling members into various care management programs. The focal point for health care services in many of our HMO networks is the primary care provider who, under contract with us, provides services to our members, and may control utilization of appropriate services by directing or approving hospitalization and referrals to specialists and other providers. Some physicians may have arrangements under which they can earn bonuses when certain target goals relating to the provision of quality patient care are met. We have available care management programs related to complex chronic conditions such as congestive heart failure and coronary artery disease. We also have programs for prenatal and premature infant care, asthma related illness, end stage renal disease, diabetes, cancer, and certain other conditions.
We typically contract with hospitals on either (1) a per diem rate, which is an all-inclusive rate per day, (2) a case rate for diagnosis-related groups (DRG), which is an all-inclusive rate per admission, or (3) a discounted charge for inpatient hospital services. Outpatient hospital services generally are contracted at a flat rate by type of service, ambulatory payment classifications, or APCs, or at a discounted charge. APCs are similar to flat rates except multiple services and procedures may be aggregated into one fixed payment. These contracts are often multi-year agreements, with rates that are adjusted for inflation annually based on the consumer price index, other nationally recognized inflation indexes, or specific negotiations with the provider. Outpatient surgery centers and other ancillary providers typically are contracted at flat rates per service provided or are reimbursed based upon a nationally recognized fee schedule such as the Medicare allowable fee schedule.
Our contracts with physicians typically are renewed automatically each year, unless either party gives written notice, generally ranging from 90 to 120 days, to the other party of its intent to terminate the arrangement. Most of the physicians in our PPO networks and some of our physicians in our HMO networks are reimbursed based upon a fixed fee schedule, which typically provides for reimbursement based upon a percentage of the standard Medicare allowable fee schedule.
The terms of our contracts with hospitals and physicians may also vary between Medicare and commercial business. A significant portion of our Medicare network contracts, including those with both hospitals and physicians, are tied to Medicare reimbursement levels and methodologies.
Capitation
We offer providers a continuum of opportunities to increase the integration of care and offer assistance to providers in transitioning from a fee-for-service to a value-based arrangement. These include performance bonuses, shared savings and shared risk relationships. For some of our medical membership, we share risk with providers under capitation contracts where physicians and hospitals accept varying levels of financial risk for a defined set of membership, primarily HMO membership. Under the typical capitation arrangement, we prepay these providers a monthly fixed-fee per member, known as a capitation (per capita) payment, to cover all or a defined portion of the benefits provided to the capitated member.
We believe these risk-based models represent a key element of our integrated care delivery model at the core of our strategy. Our health plan subsidiaries may enter into these risk-based contracts with third party providers or our owned provider subsidiaries.
At December 31, 2018, approximately 1,128,500 members, or 6.8% of our medical membership, were covered under risk-based contracts, which provide all member benefits, including 942,000 individual Medicare Advantage members, or 30.7% of our total individual Medicare Advantage membership.
Physicians under capitation arrangements typically have stop loss coverage so that a physician’s financial risk for any single member is limited to a maximum amount on an annual basis. We typically process all claims and monitor the financial performance and solvency of our capitated providers. However, we delegated claim processing functions under capitation arrangements covering approximately 181,200 HMO members, including 168,900 individual Medicare Advantage members, or 17.9% of the 942,000 individual Medicare Advantage members covered under risk-based contracts at December 31, 2018, with the provider assuming substantially all the risk of coordinating the members’ health care benefits. Capitation expense under delegated arrangements for which we have a limited view of the underlying claims experience was approximately $1.5 billion, or 3.3% of total benefits expense, for the year ended December 31, 2018. We remain financially responsible for health care services to our members in the event our providers fail to provide such services.
Accreditation Assessment
Our accreditation assessment program consists of several internal programs, including those that credential providers and those designed to meet the audit standards of federal and state agencies as well as external accreditation standards. We also offer quality and outcome measurement and improvement programs such as the Health Care Effectiveness Data and Information Set, or HEDIS, which is used by employers, government purchasers and the National
Committee for Quality Assurance (NCQA) to evaluate health plans based on various criteria, including effectiveness of care and member satisfaction.
Providers participating in our networks must satisfy specific criteria, including licensing, patient access, office standards, after-hours coverage, and other factors. Most participating hospitals also meet accreditation criteria established by CMS and/or The Joint Commission.
Recredentialing of participating providers occurs every three years, unless otherwise required by state or federal regulations. Recredentialing of participating providers includes verification of their medical licenses, review of their malpractice liability claims histories, review of their board certifications, if applicable, and review of applicable quality information. A committee composed of a peer group of providers reviews the applications of providers being considered for credentialing and recredentialing.
We maintain accreditation for certain of our health plans and/or departments from NCQA, the Accreditation Association for Ambulatory Health Care (AAAHC), and/or URAC. All Federal Employee Health Benefit Plans are required to be accredited. Certain commercial businesses, such as those impacted by a third-party labor agreement or those where a request is made by the employer, may require or prefer accredited health plans.
NCQA reviews our compliance based on standards for quality improvement, population health management, credentialing, utilization management, network management, member connections, and member rights and responsibilities. We have achieved and maintained NCQA accreditation in many of our commercial, Medicare and Medicaid HMO/POS and PPO markets and our wellness program, Go365. Humana’s pharmacy organization is accredited by URAC.
Sales and Marketing
We use various methods to market our products, including television, radio, the Internet, telemarketing, and direct mailings.
At December 31, 2018, we employed approximately 1,500 sales representatives, as well as approximately 1,400 telemarketing representatives who assisted in the marketing of Medicare, including Medicare Advantage and PDP, in our Retail segment and specialty products in our Group and Specialty segment, including making appointments for sales representatives with prospective members. We have a marketing arrangement with Wal-Mart Stores, Inc., or Wal-Mart, for our individual Medicare stand-alone PDP offering. We also sell group Medicare Advantage products through large employers. In addition, we market our Medicare and individual specialty products through licensed independent brokers and agents. For our Medicare products, commissions paid to employed sales representatives and independent brokers and agents are based on a per unit commission structure, regulated in structure and amount by CMS. For our individual specialty products, we generally pay brokers a commission based on premiums, with commissions varying by market and premium volume. In addition to a commission based directly on premium volume for sales to particular customers, we also have programs that pay brokers and agents based on other metrics. These include commission bonuses based on sales that attain certain levels or involve particular products. We also pay additional commissions based on aggregate volumes of sales involving multiple customers.
In our Group and Specialty segment, individuals may become members of our commercial HMOs and PPOs through their employers or other groups, which typically offer employees or members a selection of health insurance products, pay for all or part of the premiums, and make payroll deductions for any premiums payable by the employees. We attempt to become an employer’s or group’s exclusive source of health insurance benefits by offering a variety of HMO, PPO, and specialty products that provide cost-effective quality health care coverage consistent with the needs and expectations of their employees or members. We use licensed independent brokers, independent agents, digital insurance agencies, and employees to sell our group products. Many of our larger employer group customers are represented by insurance brokers and consultants who assist these groups in the design and purchase of health care products. We pay brokers and agents using the same commission structure described above for our specialty products.
Underwriting
Since 2014, the Patient Protection and Affordability Care Act and The Health Care and Education Reconciliation Act of 2010, which we collectively refer to as the Health Care Reform Law, requires certain group health plans to guarantee issuance and renew coverage without pre-existing condition exclusions or health-status rating adjustments. Accordingly, certain group health plans are not subject to underwriting. Further, underwriting techniques are not employed in connection with our Medicare, military services, or Medicaid products because government regulations require us to accept all eligible applicants regardless of their health or prior medical history.
Competition
The health benefits industry is highly competitive. Our competitors vary by local market and include other managed care companies, national insurance companies, and other HMOs and PPOs. Many of our competitors have a larger membership base and/or greater financial resources than our health plans in the markets in which we compete. Our ability to sell our products and to retain customers may be influenced by such factors as those described in Item 1A. – Risk Factors in this 2018 Form 10-K.
Government Regulation
Diverse legislative and regulatory initiatives at both the federal and state levels continue to affect aspects of the nation’s health care system, including the Health Care Reform Law.
Our management works proactively to ensure compliance with all governmental laws and regulations affecting our business. We are unable to predict how existing federal or state laws and regulations may be changed or interpreted, what additional laws or regulations affecting our businesses may be enacted or proposed, when and which of the proposed laws will be adopted or what effect any such new laws and regulations will have on our results of operations, financial position, or cash flows.
For a description of certain material current activities in the federal and state legislative areas, see Item 1A. – Risk Factors in this 2018 Form 10-K.
Certain Other Services
Captive Insurance Company
We bear general business risks associated with operating our Company such as professional and general liability, employee workers’ compensation, cybersecurity, and officer and director errors and omissions risks. Professional and general liability risks may include, for example, medical malpractice claims and disputes with members regarding benefit coverage. We retain certain of these risks through our wholly-owned, captive insurance subsidiary. We reduce exposure to these risks by insuring levels of coverage for losses in excess of our retained limits with a number of third-party insurance companies. We remain liable in the event these insurance companies are unable to pay their portion of the losses.
Centralized Management Services
We provide centralized management services to each of our health plans and to our business segments from our headquarters and service centers. These services include management information systems, product development and administration, finance, human resources, accounting, law, public relations, marketing, insurance, purchasing, risk management, internal audit, actuarial, underwriting, claims processing, billing/enrollment, and customer service. Through intercompany service agreements approved, if required, by state regulatory authorities, Humana Inc., our parent company, charges a management fee for reimbursement of certain centralized services provided to its subsidiaries.
Employees
As of December 31, 2018, we had approximately 41,600 employees and approximately 2,000 additional medical professionals working under management agreements primarily between us and affiliated physician-owned associations. We believe we have good relations with our employees and have not experienced any work stoppages.
Item 1A. RISK FACTORS
Risks Relating to Our Business
If we do not design and price our products properly and competitively, if the premiums we charge are insufficient to cover the cost of health care services delivered to our members, if we are unable to implement clinical initiatives to provide a better health care experience for our members, lower costs and appropriately document the risk profile of our members, or if our estimates of benefits expense are inadequate, our profitability may be materially adversely affected. We estimate the costs of our benefits expense payments, and design and price our products accordingly, using actuarial methods and assumptions based upon, among other relevant factors, claim payment patterns, medical cost inflation, and historical developments such as claim inventory levels and claim receipt patterns. We continually review these estimates, however these estimates involve extensive judgment, and have considerable inherent variability because they are extremely sensitive to changes in claim payment patterns and medical cost trends. Any reserve, including a premium deficiency reserve, may be insufficient.
We use a substantial portion of our revenues to pay the costs of health care services delivered to our members. These costs include claims payments, capitation payments to providers (predetermined amounts paid to cover services), and various other costs incurred to provide health insurance coverage to our members. These costs also include estimates of future payments to hospitals and others for medical care provided to our members. Generally, premiums in the health care business are fixed for one-year periods. Accordingly, costs we incur in excess of our benefit cost projections generally are not recovered in the contract year through higher premiums. We estimate the costs of our future benefit claims and other expenses using actuarial methods and assumptions based upon claim payment patterns, medical inflation, historical developments, including claim inventory levels and claim receipt patterns, and other relevant factors. We also record benefits payable for future payments. We continually review estimates of future payments relating to benefit claims costs for services incurred in the current and prior periods and make necessary adjustments to our reserves, including premium deficiency reserves where appropriate. However, these estimates involve extensive judgment, and have considerable inherent variability that is sensitive to claim payment patterns and medical cost trends. Many factors may and often do cause actual health care costs to exceed what was estimated and used to set our premiums. These factors may include:
| • | increased use of medical facilities and services; |
| • | increased cost of such services; |
| • | increased use or cost of prescription drugs, including specialty prescription drugs; |
| • | the introduction of new or costly treatments, including new technologies; |
| • | our membership mix; |
| • | variances in actual versus estimated levels of cost associated with new products, benefits or lines of business, product changes or benefit level changes; |
| • | changes in the demographic characteristics of an account or market; |
| • | changes or reductions of our utilization management functions such as preauthorization of services, concurrent review or requirements for physician referrals; |
| • | changes in our pharmacy volume rebates received from drug manufacturers; |
| • | catastrophes, including acts of terrorism, public health epidemics, or severe weather (e.g. hurricanes and earthquakes); |
| • | medical cost inflation; and |
| • | government mandated benefits or other regulatory changes, including any that result from the Health Care Reform Law. |
Key to our operational strategy is the implementation of clinical initiatives that we believe provide a better health care experience for our members, lower the cost of healthcare services delivered to our members, and appropriately document the risk profile of our members. Our profitability and competitiveness depend in large part on our ability to
appropriately manage health care costs through, among other things, the application of medical management programs such as our chronic care management program.
While we proactively attempt to effectively manage our operating expenses, increases or decreases in staff-related expenses, any costs associated with exiting products, additional investment in new products (including our opportunities in the Medicare programs, state-based contracts, and expansion of clinical capabilities as part of our integrated care delivery model), investments in health and well-being product offerings, acquisitions, new taxes and assessments (including the non-deductible health insurance industry fee), and implementation of regulatory requirements may increase our operating expenses.
Failure to adequately price our products or estimate sufficient benefits payable or effectively manage our operating expenses, may result in a material adverse effect on our results of operations, financial position, and cash flows.
We are in a highly competitive industry. Some of our competitors are more established in the health care industry in terms of a larger market share and have greater financial resources than we do in some markets. In addition, other companies may enter our markets in the future, including emerging competitors in the Medicare program or competitors in the delivery of health care services. We believe that barriers to entry in our markets are not substantial, so the addition of new competitors can occur relatively easily, and customers enjoy significant flexibility in moving between competitors. Contracts for the sale of commercial products are generally bid upon or renewed annually. While health plans compete on the basis of many factors, including service and the quality and depth of provider networks, we expect that price will continue to be a significant basis of competition. In addition to the challenge of controlling health care costs, we face intense competitive pressure to contain premium prices. Factors such as business consolidations, strategic alliances, legislative reform, and marketing practices create pressure to contain premium price increases, despite being faced with increasing medical costs.
The policies and decisions of the federal and state governments regarding the Medicare, military and Medicaid programs in which we participate have a substantial impact on our profitability. These governmental policies and decisions, which we cannot predict with certainty, directly shape the premiums or other revenues to us under the programs, the eligibility and enrollment of our members, the services we provide to our members, and our administrative, health care services, and other costs associated with these programs. Legislative or regulatory actions, such as those resulting in a reduction in premium payments to us, an increase in our cost of administrative and health care services, or additional fees, taxes or assessments, may have a material adverse effect on our results of operations, financial position, and cash flows.
Premium increases, introduction of new product designs, and our relationships with our providers in various markets, among other issues, could also affect our membership levels. Other actions that could affect membership levels include our possible exit from or entrance into Medicare or commercial markets, or the termination of a large contract.
If we do not compete effectively in our markets, if we set rates too high or too low in highly competitive markets to keep or increase our market share, if membership does not increas
Showing the first 8K of 73K characters. Open the full section
Item 1B. UNRESOLVED STAFF COMMENTS
None.
Item 2. PROPERTIES
The following table lists, by state, the number of medical centers and administrative offices we owned or leased at December 31, 2018:
| Medical Centers | Administrative Offices | |||||||||||||
| Owned | Leased | Owned | Leased | Total | ||||||||||
| Florida | 13 | 207 | — | 69 | 289 | |||||||||
| Texas | 1 | 17 | 2 | 14 | 34 | |||||||||
| Kentucky | 2 | 3 | 15 | 12 | 32 | |||||||||
| Arizona | — | 17 | — | 6 | 23 | |||||||||
| Louisiana | — | 6 | — | 10 | 16 | |||||||||
| Virginia | — | 8 | — | 7 | 15 | |||||||||
| Illinois | — | 5 | — | 10 | 15 | |||||||||
| California | — | 2 | — | 12 | 14 | |||||||||
| Ohio | — | 1 | — | 13 | 14 | |||||||||
| South Carolina | — | 6 | — | 6 | 12 | |||||||||
| New York | — | — | — | 13 | 13 | |||||||||
| Nevada | — | 7 | — | 5 | 12 | |||||||||
| Puerto Rico | — | 1 | — | 10 | 11 | |||||||||
| Indiana | — | 5 | — | 5 | 10 | |||||||||
| Georgia | — | 8 | — | 3 | 11 | |||||||||
| Washington | — | 7 | — | 4 | 11 | |||||||||
| Tennessee | — | — | — | 9 | 9 | |||||||||
| New Jersey | — | — | — | 9 | 9 | |||||||||
| Colorado | — | 5 | — | 3 | 8 | |||||||||
| Michigan | — | 5 | — | 3 | 8 | |||||||||
| North Carolina | — | 2 | — | 4 | 6 | |||||||||
| Others | — | 9 | 1 | 38 | 48 | |||||||||
| Total | 16 | 321 | 18 | 265 | 620 |
The medical centers we operate are primarily located in Florida and Texas, including full-service, multi-specialty medical centers staffed by primary care providers and medical specialists. Of the medical centers included in the table above, approximately 44 of these facilities are leased or subleased to our contracted providers to operate.
Our principal executive office is located in the Humana Building, 500 West Main Street, Louisville, Kentucky 40202. In addition to the headquarters in Louisville, Kentucky, we maintain other principal operating facilities used for customer service, enrollment, and/or claims processing and certain other corporate functions in Louisville, Kentucky; Green Bay, Wisconsin; Tampa, Florida; Cincinnati, Ohio; San Antonio, Texas; and San Juan, Puerto Rico.
Item 3. LEGAL PROCEEDINGS
We are party to a variety of legal actions in the ordinary course of business, certain of which may be styled as class-action lawsuits. Among other matters, this litigation may include employment matters, claims of medical malpractice, bad faith, nonacceptance or termination of providers, anticompetitive practices, improper rate setting, provider contract rate disputes, qui tam litigation brought by individuals seeking to sue on behalf of the government, failure to disclose network discounts and various other provider arrangements, general contractual matters, intellectual property matters, and challenges to subrogation practices. For a discussion of our material legal actions, including those not in the ordinary course of business, see “Legal Proceedings and Certain Regulatory Matters” in Note 16 to the consolidated financial statements included in Item 8. – Financial Statements and Supplementary Data. We cannot predict the outcome of these suits with certainty.
Item 4. MINE SAFETY DISCLOSURES
Not applicable.
PART II
Item 5. MARKET FOR THE REGISTRANT’S COMMON EQUITY, RELATED STOCKHOLDER MATTERS AND ISSUER PURCHASES OF EQUITY SECURITIES
Market Information
Our common stock trades on the New York Stock Exchange under the symbol HUM.
Holders of our Capital Stock
As of January 31, 2019, there were approximately 2,300 holders of record of our common stock and approximately 244,700 beneficial holders of our common stock.
Dividends
The following table provides details of dividend payments, excluding dividend equivalent rights, in 2017 and 2018, under our Board approved quarterly cash dividend policy:
| Record Date | Payment Date | Amount per Share | Total Amount | |||
| (in millions) | ||||||
| 2017 payments | ||||||
| 1/12/2017 | 1/27/2017 | $0.29 | $43 | |||
| 3/31/2017 | 4/28/2017 | $0.40 | $58 | |||
| 6/30/2017 | 7/31/2017 | $0.40 | $58 | |||
| 9/29/2017 | 10/27/2017 | $0.40 | $57 | |||
| 2018 payments | ||||||
| 12/29/2017 | 1/26/2018 | $0.40 | $55 | |||
| 3/30/2018 | 4/27/2018 | $0.50 | $69 | |||
| 6/29/2018 | 7/27/2018 | $0.50 | $69 | |||
| 9/28/2018 | 10/26/2018 | $0.50 | $69 |
On November 2, 2018, the Board declared a cash dividend of $0.50 per share that was paid on January 25, 2019 to stockholders of record on December 31, 2018, for an aggregate amount of $68 million. Declaration and payment of future quarterly dividends is at the discretion of our Board and may be adjusted as business needs or market conditions change.
In February 2019, the Board declared a cash dividend of $0.55 per share payable on April 26, 2019 to stockholders of record on March 29, 2019.
Stock Total Return Performance
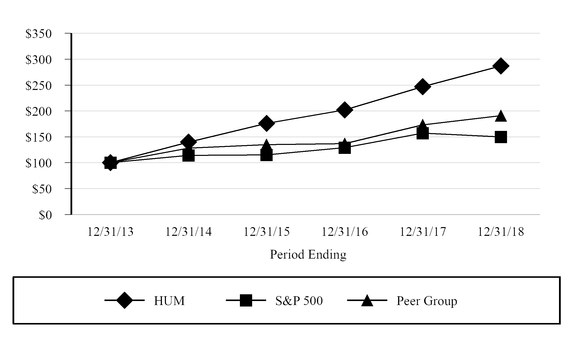
The following graph compares our total return to stockholders with the returns of the Standard & Poor’s Composite 500 Index (“S&P 500”) and the Dow Jones US Select Health Care Providers Index (“Peer Group”) for the five years ended December 31, 2018. The graph assumes an investment of $100 in each of our common stock, the S&P 500, and the Peer Group on December 31, 2013, and that dividends were reinvested when paid.
| 12/31/2013 | 12/31/2014 | 12/31/2015 | 12/31/2016 | 12/31/2017 | 12/31/2018 | ||||||||||||||||||
| HUM | $ | 100 | $ | 140 | $ | 176 | $ | 202 | $ | 247 | $ | 287 | |||||||||||
| S&P 500 | $ | 100 | $ | 114 | $ | 115 | $ | 129 | $ | 157 | $ | 150 | |||||||||||
| Peer Group | $ | 100 | $ | 128 | $ | 135 | $ | 137 | $ | 173 | $ | 191 |
The stock price performance included in this graph is not necessarily indicative of future stock price performance.
Issuer Purchases of Equity Securities
The following table provides information about purchases by us during the three months ended December 31, 2018 of equity securities that are registered by us pursuant to Section 12 of the Exchange Act:
| Period | Total Number of Shares Purchased (1) | Average Price Paid per Share | Total Number of Shares Purchased as Part of Publicly Announced Plans or Programs (1)(2) | Dollar Value of Shares that May Yet Be Purchased Under the Plans or Programs (1) (2) | |||||||||
| October 2018 | — | $ | — | — | $ | 1,776,354,011 | |||||||
| November 2018 | 1,937,797 | 309.63 | 1,937,797 | 1,176,354,010 | |||||||||
| December 2018 | — | — | — | 1,176,354,010 | |||||||||
| Total | 1,937,797 | $ | 309.63 | 1,937,797 |
| (1) | On December 14, 2017, our Board of Directors authorized the repurchase of up to $3.0 billion of our common shares expiring on December 31, 2020, exclusive of shares repurchased in connection with employee stock plans. Under the share repurchase authorization, shares may be purchased from time to time at prevailing prices in the open market, by block purchases, through plans designed to comply with Rule 10b5-1 under the Securities Exchange Act of 1934, as amended, or in privately-negotiated transactions, including pursuant to accelerated share repurchase agreements with investment banks, subject to certain regulatory restrictions on volume, pricing, and timing. On November 28, 2018, we entered into an accelerated stock repurchase agreement, the November 2018 ASR, with Goldman, Sachs & Co. LLC, or Goldman Sachs, to repurchase $750 million of our common stock as part of the $3.0 billion share repurchase program authorized by the Board of Directors on December 14, 2017. On November 29, 2018, we made a payment of $750 million to Goldman Sachs from available cash on hand and received an initial delivery of 1.94 million shares of our common stock from Goldman Sachs. The payment to Goldman Sachs was recorded as a reduction to stockholders’ equity, consisting of an $600 million increase in treasury stock, which reflects the value of the initial 1.94 million shares received upon initial settlement, and a $150 million decrease in capital in excess of par value, which reflected the value of stock held back by Goldman Sachs pending final settlement of the November 2018 ASR. Our remaining repurchase authorization was approximately $1,176 million as of February 21, 2019, excluding the $150 million pending final settlement of our November 2018 ASR. |
| (2) | Excludes 0.15 million shares repurchased in connection with employee stock plans. |
Item 6. SELECTED FINANCIAL DATA
| 2018 | 2017 | 2016 (a) | 2015 | 2014 | |||||||||||||||
| (dollars in millions, except per common share results) | |||||||||||||||||||
| Summary of Operating Results: | |||||||||||||||||||
| Revenues: | |||||||||||||||||||
| Premiums | $ | 54,941 | $ | 52,380 | $ | 53,021 | $ | 52,409 | $ | 45,959 | |||||||||
| Services | 1,457 | 982 | 969 | 1,406 | 2,164 | ||||||||||||||
| Investment income | 514 | 405 | 389 | 474 | 377 | ||||||||||||||
| Total revenues | 56,912 | 53,767 | 54,379 | 54,289 | 48,500 | ||||||||||||||
| Operating expenses: | |||||||||||||||||||
| Benefits | 45,882 | 43,496 | 45,007 | 44,269 | 38,166 | ||||||||||||||
| Operating costs | 7,525 | 6,567 | 7,173 | 7,295 | 7,639 | ||||||||||||||
| Merger termination fee and related costs, net | — | (936 | ) | 104 | 23 | — | |||||||||||||
| Depreciation and amortization | 405 | 378 | 354 | 355 | 333 | ||||||||||||||
| Total operating expenses | 53,812 | 49,505 | 52,638 | 51,942 | 46,138 | ||||||||||||||
| Income from operations | 3,100 | 4,262 | 1,741 | 2,347 | 2,362 | ||||||||||||||
| Loss (gain) on sale of business | 786 | — | — | (270 | ) | — | |||||||||||||
| Interest expense | 218 | 242 | 189 | 186 | 192 | ||||||||||||||
| Other expense, net | 33 | — | — | — | — | ||||||||||||||
| Income before income taxes and equity in net earnings | 2,063 | 4,020 | 1,552 | 2,431 | 2,170 | ||||||||||||||
| Provision for income taxes | 391 | 1,572 | 938 | 1,155 | 1,023 | ||||||||||||||
| Equity in net earnings of Kindred at Home | 11 | — | — | — | — | ||||||||||||||
| Net income | $ | 1,683 | $ | 2,448 | $ | 614 | $ | 1,276 | $ | 1,147 | |||||||||
| Basic earnings per common share | $ | 12.24 | $ | 16.94 | $ | 4.11 | $ | 8.54 | $ | 7.44 | |||||||||
| Diluted earnings per common share | $ | 12.16 | $ | 16.81 | $ | 4.07 | $ | 8.44 | $ | 7.36 | |||||||||
| Dividends declared per common share | $ | 2.00 | $ | 1.60 | $ | 1.16 | $ | 1.15 | $ | 1.11 | |||||||||
| Financial Position: | |||||||||||||||||||
| Cash and investments | $ | 12,780 | $ | 16,344 | $ | 13,675 | $ | 11,681 | $ | 11,482 | |||||||||
| Total assets | 25,413 | 27,178 | 25,396 | 24,678 | 23,497 | ||||||||||||||
| Benefits payable | 4,862 | 4,668 | 4,563 | 4,976 | 4,475 | ||||||||||||||
| Debt | 6,069 | 4,920 | 4,092 | 4,093 | 3,795 | ||||||||||||||
| Stockholders’ equity | 10,161 | 9,842 | 10,685 | 10,346 | 9,646 | ||||||||||||||
| Cash flows from operations | $ | 2,173 | $ | 4,051 | $ | 1,936 | $ | 868 | $ | 1,618 | |||||||||
| Key Financial Indicators: | |||||||||||||||||||
| Benefit ratio | 83.5 | % | 83.0 | % | 84.9 | % | 84.5 | % | 83.0 | % | |||||||||
| Operating cost ratio | 13.3 | % | 12.3 | % | 13.3 | % | 13.6 | % | 15.9 | % | |||||||||
| Membership by Segment: | |||||||||||||||||||
| Retail segment: | |||||||||||||||||||
| Medical membership | 9,161,500 | 9,206,300 | 8,751,300 | 8,327,700 | 7,360,300 | ||||||||||||||
| Group and Specialty segment: | |||||||||||||||||||
| Medical membership | 7,415,200 | 4,638,200 | 4,793,300 | 4,963,400 | 5,430,200 | ||||||||||||||
| Specialty membership | 6,072,300 | 6,986,000 | 6,961,200 | 7,221,800 | 7,668,500 | ||||||||||||||
| Individual commercial segment: | |||||||||||||||||||
| Medical membership | — | 128,800 | 654,800 | 899,100 | 1,016,200 | ||||||||||||||
| Other Businesses: | |||||||||||||||||||
| Medical membership | — | 29,800 | 30,800 | 32,600 | 35,000 | ||||||||||||||
| Consolidated: | |||||||||||||||||||
| Total medical membership | 16,576,700 | 14,003,100 | 14,230,200 | 14,222,800 | 13,841,700 | ||||||||||||||
| Total specialty membership | 6,072,300 | 6,986,000 | 6,961,200 | 7,221,800 | 7,668,500 |
| (a) | Includes a reduction in premiums revenue of $583 million ($367 million after tax, or $2.43 per diluted common share) associated with the write-off of commercial risk corridor receivables. Also includes benefits expense of $505 million ($318 million after tax, or $2.11 per diluted common share) for reserve strengthening associated with our non-strategic closed block of long-term care insurance policies, which were sold in 2018. |
Item 7. MANAGEMENT’S DISCUSSION AND ANALYSIS OF FINANCIAL CONDITION AND RESULTS OF OPERATIONS
Executive Overview
General
Humana Inc., headquartered in Louisville, Kentucky, is a leading health and well-being company committed to helping our millions of medical and specialty members achieve their best health. Our successful history in care delivery and health plan administration is helping us create a new kind of integrated care with the power to improve health and well‐being and lower costs. Our efforts are leading to a better quality of life for people with Medicare, families, individuals, military service personnel, and communities at large. To accomplish that, we support physicians and other health care professionals as they work to deliver the right care in the right place for their patients, our members. Our range of clinical capabilities, resources and tools, such as in‐home care, behavioral health, pharmacy services, data analytics and wellness solutions, combine to produce a simplified experience that makes health care easier to navigate and more effective.
Our industry relies on two key statistics to measure performance. The benefit ratio, which is computed by taking total benefits expense as a percentage of premiums revenue, represents a statistic used to measure underwriting profitability. The operating cost ratio, which is computed by taking total operating costs, excluding Merger termination fee and related costs, net, and depreciation and amortization, as a percentage of total revenue less investment income, represents a statistic used to measure administrative spending efficiency.
Business Segments
We manage our business with four reportable segments: Retail, Group and Specialty, Healthcare Services, and Individual Commercial. In addition, the Other Businesses category includes businesses that are not individually reportable because they do not meet the quantitative thresholds required by generally accepted accounting principles. These segments are based on a combination of the type of health plan customer and adjacent businesses centered on well-being solutions for our health plans and other customers, as described below. These segment groupings are consistent with information used by our Chief Executive Officer to assess performance and allocate resources. See Note 17 to the consolidated financial statements included in Item 8. - Financial Statements and Supplementary Data for segment financial information.
The Retail segment consists of Medicare benefits, marketed to individuals or directly via group Medicare accounts. In addition, the Retail segment also includes our contract with CMS to administer the Limited Income Newly Eligible Transition, or LI-NET, prescription drug plan program and contracts with various states to provide Medicaid, dual eligible, and Long-Term Support Services benefits, which we refer to collectively as our state-based contracts. The Group and Specialty segment consists of employer group commercial fully-insured medical and specialty health insurance benefits marketed to individuals and employer groups, including dental, vision, and other supplemental health benefits, as well as administrative services only, or ASO products. In addition, our Group and Specialty segment includes military services business, primarily our TRICARE T2017 East Region contract. The Healthcare Services segment includes our services offered to our health plan members as well as to third parties, including pharmacy solutions, provider services, and clinical care service, such as home health and other services and capabilities to promote wellness and advance population health, including our investment in Kindred at Home. The Individual Commercial segment consisted of our individual commercial fully-insured medical health insurance business, which we exited beginning January 1, 2018. We report under the category of Other Businesses those businesses that do not align with the reportable segments described above, primarily our closed-block long-term care insurance policies, which were sold in 2018.
The results of each segment are measured by income before income taxes and equity in net earnings from Kindred at Home, or segment earnings. Transactions between reportable segments primarily consist of sales of services rendered by our Healthcare Services segment, primarily pharmacy, provider, and clinical care services, to our Retail and Group and Specialty segment customers. Intersegment sales and expenses are recorded at fair value and eliminated in consolidation. Members served by our segments often use the same provider networks, enabling us in some instances to obtain more favorable contract terms with providers. Our segments also share indirect costs and assets. As a result, the profitability of each segment is interdependent. We allocate most operating expenses to our segments. Assets and
certain corporate income and expenses are not allocated to the segments, including the portion of investment income not supporting segment operations, interest expense on corporate debt, and certain other corporate expenses. These items are managed at a corporate level. These corporate amounts are reported separately from our reportable segments and are included with intersegment eliminations.
Seasonality
One of the product offerings of our Retail segment is Medicare stand-alone prescription drug plans, or PDPs, under the Medicare Part D program. Our quarterly Retail segment earnings and operating cash flows are impacted by the Medicare Part D benefit design and changes in the composition of our membership. The Medicare Part D benefit design results in coverage that varies as a member’s cumulative out-of-pocket costs pass through successive stages of a member’s plan period, which begins annually on January 1 for renewals. These plan designs generally result in us sharing a greater portion of the responsibility for total prescription drug costs in the early stages and less in the latter stages. As a result, the PDP benefit ratio generally decreases as the year progresses. In addition, the number of low income senior members as well as year-over-year changes in the mix of membership in our stand-alone PDP products affects the quarterly benefit ratio pattern.
In addition, the Retail segment also experiences seasonality in the operating cost ratio as a result of costs incurred in the second half of the year associated with the Medicare marketing season.
Our Group and Specialty segment also experiences seasonality in the benefit ratio pattern. However, the effect is opposite of Medicare stand-alone PDP in the Retail segment, with the Group and Specialty segment’s benefit ratio increasing as fully-insured members progress through their annual deductible and maximum out-of-pocket expenses.
Aetna Merger
On February 16, 2017, under the terms of the Agreement and Plan of Merger, or Merger Agreement, with Aetna Inc., and certain wholly owned subsidiaries of Aetna Inc., which we collectively refer to as Aetna, we received a breakup fee of $1 billion from Aetna, which is included in our consolidated statement of income in the line captioned "Merger termination fee and related costs, net."
Acquisitions and Divestitures
On August 9, 2018, we completed the sale of our wholly-owned subsidiary, KMG America Corporation, or KMG, to Continental General Insurance Company, or CGIC, a Texas-based insurance company wholly owned by HC2 Holdings, Inc., a diversified holding company. KMG's subsidiary, Kanawha Insurance Company, or KIC, includes our closed block of non-strategic commercial long-term care policies. Upon closing, we funded the transaction with approximately $190 million of parent company cash contributed into KMG, subject to customary adjustments, in addition to the transfer of approximately $160 million of statutory capital with the sale. In connection with the sale of KMG, we recognized a pretax loss, including transaction costs, of $786 million and a corresponding $452 million tax benefit. Prior to the sale of KMG, we entered into reins
Showing the first 8K of 139K characters. Open the full section
Item 7A. QUANTITATIVE AND QUALITATIVE DISCLOSURES ABOUT MARKET RISK
Our earnings and financial position are exposed to financial market risk, including those resulting from changes in interest rates.
The level of our pretax earnings is subject to market risk due to changes in interest rates and the resulting impact on investment income and interest expense. In the past we have, and in the future we may enter into interest rate swap agreements depending on market conditions and other factors. Amounts borrowed under the revolving credit portion of our $2.0 billion unsecured revolving credit agreement bear interest at either LIBOR plus a spread or the base rate plus a spread. There were no borrowings outstanding under our credit agreement at December 31, 2018 or December 31, 2017.
Interest rate risk also represents a market risk factor affecting our consolidated financial position due to our significant investment portfolio, consisting primarily of fixed maturity securities of investment-grade quality with a weighted average S&P credit rating of AA at December 31, 2018. Our net unrealized position decreased $402 million from a net unrealized gain position of $198 million at December 31, 2017 to a net unrealized loss position of $204 million at December 31, 2018. At December 31, 2018, we had gross unrealized losses of $213 million on our investment portfolio primarily due to an increase in market interest rates since the time the securities were purchased. There were no material other-than-temporary impairments during 2018. While we believe that these impairments are temporary and we currently do not have the intent to sell such securities, given the current market conditions and the significant judgments involved, there is a continuing risk that future declines in fair value may occur and material realized losses from sales or other-than-temporary impairments may be recorded in future periods.
Duration is the time-weighted average of the present value of the bond portfolio’s cash flow. Duration is indicative of the relationship between changes in fair value and changes in interest rates, providing a general indication of the sensitivity of the fair values of our fixed maturity securities to changes in interest rates. However, actual fair values may differ significantly from estimates based on duration. The average duration of our investment portfolio, including cash and cash equivalents, was approximately 2.9 years as of December 31, 2018 and 4.1 years as of December 31, 2017. Based on the duration including cash equivalents, a 1% increase in interest rates would generally decrease the fair value of our securities by approximately $365 million.
We have also evaluated the impact on our investment income and interest expense resulting from a hypothetical change in interest rates of 100, 200, and 300 basis points over the next twelve-month period, as reflected in the following table. The evaluation was based on our investment portfolio and our outstanding indebtedness at December 31, 2018 and 2017. Our investment portfolio consists of cash, cash equivalents, and investment securities. The modeling technique used to calculate the pro forma net change in pretax earnings considered the cash flows related to fixed income investments and debt, which are subject to interest rate changes during a prospective twelve-month period. This evaluation measures parallel shifts in interest rates and may not account for certain unpredictable events that may affect interest income, including unexpected changes of cash flows into and out of the portfolio, changes in the asset allocation, including shifts between taxable and tax-exempt securities, and spread changes specific to various investment categories. In the past ten years, changes in 3 month LIBOR rates during the year have not exceeded 300 basis points, have not changed between 200 and 300 basis points, have changed between 100 and 200 basis points twice, and have changed by less than 100 basis points eight times.
| Increase (decrease) in pretax earnings given an interest rate decrease of X basis points | Increase (decrease) in pretax earnings given an interest rate increase of X basis points | |||||||||||||||||||||||
| (300) | (200) | (100) | 100 | 200 | 300 | |||||||||||||||||||
| (in millions) | ||||||||||||||||||||||||
| As of December 31, 2018 | ||||||||||||||||||||||||
| Investment income (a) | $ | (154 | ) | $ | (114 | ) | $ | (57 | ) | $ | 58 | $ | 116 | $ | 175 | |||||||||
| Interest expense (b) | 31 | 20 | 10 | (10 | ) | (20 | ) | (31 | ) | |||||||||||||||
| Pretax | $ | (123 | ) | $ | (94 | ) | $ | (47 | ) | $ | 48 | $ | 96 | $ | 144 | |||||||||
| As of December 31, 2017 | ||||||||||||||||||||||||
| Investment income (a) | $ | (87 | ) | $ | (83 | ) | $ | (67 | ) | $ | 67 | $ | 134 | $ | 202 | |||||||||
| Interest expense (b) | 2 | 2 | 2 | (2 | ) | (3 | ) | (5 | ) | |||||||||||||||
| Pretax | $ | (85 | ) | $ | (81 | ) | $ | (65 | ) | $ | 65 | $ | 131 | $ | 197 |
| (a) | As of December 31, 2018 and 2017, some of our investments had interest rates below 3% so the assumed hypothetical change in pretax earnings does not reflect the full 3% point reduction. |
| (b) | The interest rate under our senior notes is fixed. There were no borrowings outstanding under the credit agreement at December 31, 2018 or December 31, 2017. There was $645 million and $150 million outstanding under our commercial paper program at December 31, 2018 and 2017, respectively. As of December 31, 2017, our interest rate under our commercial paper program was less than 2% so the assumed hypothetical change in pretax earnings does not reflect the full 2% point reduction. |
Item 8. FINANCIAL STATEMENTS AND SUPPLEMENTARY DATA
Humana Inc.
CONSOLIDATED BALANCE SHEETS
| December 31, | |||||||
| 2018 | 2017 | ||||||
| (in millions, except share amounts) | |||||||
| ASSETS | |||||||
| Current assets: | |||||||
| Cash and cash equivalents | $ | 2,343 | $ | 4,042 | |||
| Investment securities | 10,026 | 9,557 | |||||
| Receivables, less allowance for doubtful accounts of $79 in 2018 and $96 in 2017 | 1,015 | 854 | |||||
| Other current assets | 3,564 | 2,949 | |||||
| Total current assets | 16,948 | 17,402 | |||||
| Property and equipment, net | 1,735 | 1,584 | |||||
| Long-term investment securities | 411 | 2,745 | |||||
| Equity method investment in Kindred at Home | 1,047 | — | |||||
| Goodwill | 3,897 | 3,281 | |||||
| Other long-term assets | 1,375 | 2,166 | |||||
| Total assets | $ | 25,413 | $ | 27,178 | |||
| LIABILITIES AND STOCKHOLDERS’ EQUITY | |||||||
| Current liabilities: | |||||||
| Benefits payable | $ | 4,862 | $ | 4,668 | |||
| Trade accounts payable and accrued expenses | 3,067 | 4,069 | |||||
| Book overdraft | 171 | 141 | |||||
| Unearned revenues | 283 | 378 | |||||
| Short-term debt | 1,694 | 150 | |||||
| Total current liabilities | 10,077 | 9,406 | |||||
| Long-term debt | 4,375 | 4,770 | |||||
| Future policy benefits payable | 219 | 2,923 | |||||
| Other long-term liabilities | 581 | 237 | |||||
| Total liabilities | 15,252 | 17,336 | |||||
| Commitments and contingencies (Note 16) | |||||||
| Stockholders’ equity: | |||||||
| Preferred stock, $1 par; 10,000,000 shares authorized; none issued | — | — | |||||
| Common stock, $0.16 2/3 par; 300,000,000 shares authorized; 198,594,841 shares issued at December 31, 2018 and 198,572,458 shares issued at December 31, 2017 | 33 | 33 | |||||
| Capital in excess of par value | 2,535 | 2,445 | |||||
| Retained earnings | 15,072 | 13,670 | |||||
| Accumulated other comprehensive (loss) income | (159 | ) | 19 | ||||
| Treasury stock, at cost, 63,028,169 shares at December 31, 2018 and 60,893,762 shares at December 31, 2017 | (7,320 | ) | (6,325 | ) | |||
| Total stockholders’ equity | 10,161 | 9,842 | |||||
| Total liabilities and stockholders’ equity | $ | 25,413 | $ | 27,178 |
The accompanying notes are an integral part of the consolidated financial statements.
Humana Inc.
CONSOLIDATED STATEMENTS OF INCOME
| For the year ended December 31, | |||||||||||
| 2018 | 2017 | 2016 | |||||||||
| (in millions, except per share results) | |||||||||||
| Revenues: | |||||||||||
| Premiums | $ | 54,941 | $ | 52,380 | $ | 53,021 | |||||
| Services | 1,457 | 982 | 969 | ||||||||
| Investment income | 514 | 405 | 389 | ||||||||
| Total revenues | 56,912 | 53,767 | 54,379 | ||||||||
| Operating expenses: | |||||||||||
| Benefits | 45,882 | 43,496 | 45,007 | ||||||||
| Operating costs | 7,525 | 6,567 | 7,173 | ||||||||
| Merger termination fee and related costs, net | — | (936 | ) | 104 | |||||||
| Depreciation and amortization | 405 | 378 | 354 | ||||||||
| Total operating expenses | 53,812 | 49,505 | 52,638 | ||||||||
| Income from operations | 3,100 | 4,262 | 1,741 | ||||||||
| Loss on sale of business | 786 | — | — | ||||||||
| Interest expense | 218 | 242 | 189 | ||||||||
| Other expense, net | 33 | — | — | ||||||||
| Income before income taxes and equity in net earnings | 2,063 | 4,020 | 1,552 | ||||||||
| Provision for income taxes | 391 | 1,572 | 938 | ||||||||
| Equity in net earnings of Kindred at Home | 11 | — | — | ||||||||
| Net income | $ | 1,683 | $ | 2,448 | $ | 614 | |||||
| Basic earnings per common share | $ | 12.24 | $ | 16.94 | $ | 4.11 | |||||
| Diluted earnings per common share | $ | 12.16 | $ | 16.81 | $ | 4.07 |
The accompanying notes are an integral part of the consolidated financial statements.
Humana Inc.
CONSOLIDATED STATEMENTS OF COMPREHENSIVE INCOME
| For the year ended December 31, | |||||||||||
| 2018 | 2017 | 2016 | |||||||||
| (in millions) | |||||||||||
| Net income | $ | 1,683 | $ | 2,448 | $ | 614 | |||||
| Other comprehensive income (loss): | |||||||||||
| Change in gross unrealized investment losses/gains | (189 | ) | 149 | (101 | ) | ||||||
| Effect of income taxes | 51 | (55 | ) | 38 | |||||||
| Total change in unrealized investment gains/losses, net of tax | (138 | ) | 94 | (63 | ) | ||||||
| Reclassification adjustment for net realized gains included in investment income | (53 | ) | (14 | ) | (96 | ) | |||||
| Effect of income taxes | 17 | 5 | 35 | ||||||||
| Total reclassification adjustment, net of tax | (36 | ) | (9 | ) | (61 | ) | |||||
| Other comprehensive (loss) income, net of tax | (174 | ) | 85 | (124 | ) | ||||||
| Comprehensive income attributable to our equity method investment in Kindred at Home | (4 | ) | — | — | |||||||
| Comprehensive income | $ | 1,505 | $ | 2,533 | $ | 490 |
The accompanying notes are an integral part of the consolidated financial statements.
Humana Inc.
CONSOLIDATED STATEMENTS OF STOCKHOLDERS’ EQUITY
| Common Stock | Capital In Excess of Par Value | Retained Earnings | Accumulated Other Comprehensive Income (Loss) | Treasury Stock | Total Stockholders’ Equity | |||||||||||||||||||||
| Issued Shares | Amount | |||||||||||||||||||||||||
| (dollars in millions, share amounts in thousands) | ||||||||||||||||||||||||||
| Balances, January 1, 2016 | 198,372 | $ | 33 | $ | 2,530 | $ | 11,017 | $ | 58 | $ | (3,292 | ) | $ | 10,346 | ||||||||||||
| Net income | 614 | 614 | ||||||||||||||||||||||||
| Other comprehensive loss | (124 | ) | (124 | ) | ||||||||||||||||||||||
| Common stock repurchases | — | (104 | ) | (104 | ) | |||||||||||||||||||||
| Dividends and dividend equivalents | — | (177 | ) | (177 | ) | |||||||||||||||||||||
| Stock-based compensation | 115 | 115 | ||||||||||||||||||||||||
| Restricted stock unit vesting | 13 | — | (98 | ) | 98 | — | ||||||||||||||||||||
| Stock option exercises | 110 | — | 13 | 13 | ||||||||||||||||||||||
| Stock option and restr |
Showing the first 8K of 216K characters. Open the full section
Item 9. CHANGES IN AND DISAGREEMENTS WITH ACCOUNTANTS ON ACCOUNTING AND FINANCIAL DISCLOSURE
Not applicable.
Item 9A. CONTROLS AND PROCEDURES
Management’s Responsibility for Financial Statements and Other Information
We are responsible for the preparation and integrity of the consolidated financial statements appearing in our Annual Report. The consolidated financial statements were prepared in conformity with accounting principles generally accepted in the United States and include amounts based on our estimates and judgments. All other financial information in this report has been presented on a basis consistent with the information included in the financial statements.
Our control environment is the foundation for our system of internal control over financial reporting and is embodied in our Code of Ethics and Business Conduct, which we currently refer to as the Humana Inc. Ethics Every Day. It sets the tone of our organization and includes factors such as integrity and ethical values. Our internal control over financial reporting is supported by formal policies and procedures which are reviewed, modified and improved as changes occur in business conditions and operations.
The Audit Committee of the Board of Directors, which is composed solely of independent outside directors, meets periodically with members of management, the internal auditors and our independent registered public accounting firm to review and discuss internal controls over financial reporting and accounting and financial reporting matters. Our independent registered public accounting firm and internal auditors report to the Audit Committee and accordingly have full and free access to the Audit Committee at any time.
Evaluation of Disclosure Controls and Procedures
We have established disclosure controls and procedures to ensure that material information relating to the Company, including its consolidated subsidiaries, is made known to members of senior management and the Board of Directors.
Based on our evaluation as of December 31, 2018, we as the principal executive officer, the principal financial officer and the principal accounting officer of the Company have concluded that the Company’s disclosure controls and procedures (as defined in the Securities Exchange Act of 1934) are effective to ensure that the information required to be disclosed by the Company in the reports that it files or submits under the Securities Exchange Act of 1934 is recorded, processed, summarized and reported as specified in Securities and Exchange Commission rules and forms.
Management’s Report on Internal Control Over Financial Reporting
We are responsible for establishing and maintaining effective internal control over financial reporting as defined in Rule 13a-15(f) under the Securities Exchange Act of 1934. The Company’s internal control over financial reporting is a process designed to provide reasonable assurance regarding the reliability of financial reporting and the preparation of financial statements for external purposes in accordance with generally accepted accounting principles. A company’s internal control over financial reporting includes those policies and procedures that (i) pertain to the maintenance of records that, in reasonable detail, accurately and fairly reflect the transactions and dispositions of the assets of the company; (ii) provide reasonable assurance that transactions are recorded as necessary to permit preparation of financial statements in accordance with generally accepted accounting principles, and that receipts and expenditures of the company are being made only in accordance with authorizations of management and directors of the company; and (iii) provide reasonable assurance regarding prevention or timely detection of unauthorized acquisition, use, or disposition of the company’s assets that could have a material effect on the financial statements.
Because of its inherent limitations, internal control over financial reporting may not prevent or detect misstatements. Also, projections of any evaluation of effectiveness to future periods are subject to the risk that controls may become inadequate or that the degree of compliance with the policies or procedures may deteriorate.
We assessed the effectiveness of the Company’s internal control over financial reporting as of December 31, 2018. In making this assessment, we used the criteria set forth by the Committee of Sponsoring Organizations of the Treadway Commission (COSO) in Internal Control – Integrated Framework (2013). Based on our assessment, we determined that, as of December 31, 2018, the Company’s internal control over financial reporting was effective based on those criteria.
The effectiveness of our internal control over financial reporting as of December 31, 2018 has been audited by PricewaterhouseCoopers LLP, our independent registered public accounting firm, who also audited the Company’s consolidated financial statements included in our Annual Report on Form 10-K, as stated in their report which appears on page 134.
Changes in Internal Control over Financial Reporting
There have been no changes in the Company’s internal control over financial reporting during the quarter ended December 31, 2018 that have materially affected, or are reasonably likely to materially affect, the Company’s internal control over financial reporting.
Item 9B. OTHER INFORMATION
None.
PART III
Item 10. DIRECTORS, EXECUTIVE OFFICERS AND CORPORATE GOVERNANCE
Directors
The information required by this Item is herein incorporated by reference from our Proxy Statement for the Annual Meeting of Stockholders scheduled to be held on April 18, 2019 appearing under the caption “Proposal One: Election of Directors” in such Proxy Statement.
Executive Officers of the Registrant
Set forth below are names and ages of all of our current executive officers as of February 1, 2019, their positions, and the date first elected an officer:
| Name | Age | Position | First Elected Officer | |||||
| Bruce D. Broussard | 56 | President and Chief Executive Officer, Director | 12/11 | (1) | ||||
| Vishal Agrawal, M.D. | 44 | Chief Strategy and Corporate Development Officer | 12/18 | (2) | ||||
| Roy A. Beveridge, M.D. | 61 | Chief Medical Officer | 06/13 | (3) | ||||
| Elizabeth D. Bierbower | 60 | Segment President | 03/17 | (4) | ||||
| Jody L. Bilney | 57 | Chief Consumer Officer | 04/13 | (5) | ||||
| Sam M. Deshpande | 54 | Chief Risk Officer | 07/17 | (6) | ||||
| William K. Fleming, PharmD | 51 | Segment President, Healthcare Services | 03/17 | (7) | ||||
| Christopher H. Hunter | 50 | Segment President, Group Business | 01/14 | (8) | ||||
| Timothy S. Huval | 52 | Chief Human Resources Officer | 12/12 | (9) | ||||
| Brian A. Kane | 46 | Chief Financial Officer | 06/14 | (10) | ||||
| Brian P. LeClaire | 58 | Chief Information Officer | 08/11 | (11) | ||||
| Joseph C. Ventura | 42 | Chief Legal Officer and Corporate Secretary | 02/19 | (12) | ||||
| T. Alan Wheatley | 51 | Segment President, Retail | 03/17 | (13) | ||||
| Cynthia H. Zipperle | 56 | Senior Vice President and Chief Accounting Officer | 12/14 | (14) |
| (1) | Mr. Broussard currently serves as Director, President and Chief Executive Officer (Principal Executive Officer), having held these positions since January 1, 2013. Mr. Broussard was elected President upon joining the Company in December 2011 and served in that capacity through December 2012. Prior to joining the Company, Mr. Broussard was Chief Executive Officer of McKesson Specialty/US Oncology, Inc. US Oncology was purchased by McKesson in December 2010. At US Oncology, Mr. Broussard served in a number of senior executive roles, including Chief Financial Officer, Chief Executive Officer, and Chairman of the Board. |
| (2) | Dr. Agrawal serves as Chief Strategy and Corporate Development Officer, having joined the company in December 2018. Prior to joining the company, Dr. Agrawal was Senior Advisor for The Carlyle Group L.P., having held that position from October 2017 to December 2018. Previously, Dr. Agrawal was President and Chief Growth Officer of Ciox Health, the largest health information exchange and release of information services |
organization in the U.S. from December of 2015 to October 2018. Prior to joining Ciox Health, Dr. Agrawal served as President of Harris Healthcare Solutions from January 2013 to December 2015.
| (3) | Dr. Beveridge currently serves as Chief Medical Officer, having held this position since joining the Company in June 2013. Prior to joining the Company, Dr. Beveridge served as Chief Medical Officer for McKesson Specialty Health from December 2010 until June 2013. Prior to McKesson’s acquisition of US Oncology, Dr. Beveridge served as the Executive Vice President and Medical Director at US Oncology from September 2009 through December 2010. |
| (4) | Ms. Bierbower currently serves as Segment President, having held this position since August 2018. She is responsible for creating a new operating model and member experience that reduces friction in the system and helps members engage in and manage their health. Prior to that, she served as the Segment President, Group Business, and also previously led the Company’s Specialty Benefits area, including dental, vision, life, disability and workplace voluntary benefits. Ms. Bierbower joined the Company in 2001. |
| (5) | Ms. Bilney currently serves as Chief Consumer Officer, having held this position since joining the Company in April 2013. Prior to joining the Company, Ms. Bilney served as Executive Vice President and Chief Brand Officer for Bloomin’ Brands, Inc. from 2006 until April 2013. |
| (6) | Mr. Deshpande currently serves as Chief Risk Officer, having held this position since joining the Company in July 2017. Before joining Humana, Mr. Deshpande spent 17 years at Capital One in key leadership positions, most recently as Business Chief Risk Officer for the U.S. and international card business. He previously served as the Business Chief Risk Officer and Head of Enterprise Services for the Financial Services Division, responsible for Business Risk, Data Science, Data Quality, Process Excellence and Project Management. He also led marketing and analysis for the Home Loans, Auto Finance, and Credit Card businesses, with responsibilities for business strategy, credit, product and marketing. |
| (7) | Mr. Fleming currently serves as Segment President, Healthcare Services, where he is responsible for Humana’s clinical and pharmacy businesses that service all Humana segments, having held this position since March of 2017. Prior to that, he served as President of the Company’s pharmacy business. Mr. Fleming joined the Company in 1994. |
| (8) | Mr. Hunter currently serves as Segment President, Group Business, having held this position since August 2018. Prior to that, he served as Chief Strategy Officer from joining the company in January 2014 until August 2018. Prior to joining the Company, Mr. Hunter served as President of Provider Markets at The TriZetto Group, Inc. from July 2012 until December 2013, and as Senior Vice President, Emerging Markets at BlueCross BlueShield of Tennessee from 2009 through July 2012. While at BlueCross BlueShield of Tennessee, Mr. Hunter was simultaneously President and Chief Executive Officer of Onlife Health, a national health and wellness subsidiary of BlueCross BlueShield of Tennessee. |
| (9) | Mr. Huval currently serves as Chief Human Resources Officer, having been elected to this position in December 2012. Prior to joining the Company, Mr. Huval spent 10 years at Bank of America in multiple senior-level roles, including Human Resources executive and Chief Information Officer for Global Wealth & Investment Management, as well as Human Resources executive for both Global Treasury Services and Technology & Global Operations. |
| (10) | Mr. Kane currently serves as Chief Financial Officer, having been elected to this position in June 2014. Prior to joining the Company, Mr. Kane spent nearly 17 years at Goldman, Sachs & Co. As a managing director, he was responsible for client relationships as well as for leading strategic and financing transactions for a number of companies in multiple industries. |
| (11) | Mr. LeClaire currently serves as Chief Information Officer, having held this position since January 2014. Prior to that, he served as Senior Vice President and Chief Service and Information Officer from August 2011 to January 2014, and as Chief Technology Officer from 2002 to August 2011. Mr. LeClaire joined the Company in August 1999. |
| (12) | Mr. Ventura currently serves as Chief Legal Officer and Corporate Secretary. He joined the Company in January 2009 and since then has held various positions of increasing responsibility in the Company's Law Department, including most recently, Senior Vice President, Associate General Counsel & Corporate Secretary from July 2017 until February 2019. |
| (13) | Mr. Wheatley currently serves as Segment President, Retail, having held this position since March 2017. During his 25-year career with the Company, Mr. Wheatley has served in a number of key leadership roles, including Vice President of Medicare Service Operations and President of the East Region, one of the Company’s key Medicare geographies. |
| (14) | Mrs. Zipperle currently serves as Senior Vice President, Chief Accounting Officer, having held this position since December 2014. Mrs. Zipperle previously served as the Vice President - Finance from January 2013 until her election to her current role, and as the Assistant Controller from January 1998 until January 2013. |
Executive officers are elected annually by our Board of Directors and serve until their successors are elected or until resignation or removal. There are no family relationships among any of our executive officers.
Section 16(a) Beneficial Ownership Reporting Compliance
The information required by this Item is herein incorporated by reference from our Proxy Statement for the Annual Meeting of Stockholders scheduled to be held on April 18, 2019 appearing under the caption “Section 16(a) Beneficial Ownership Reporting Compliance” of such Proxy Statement.
Code of Conduct for Chief Executive Officer and Senior Financial Officers
We have adopted a Code of Conduct for the Chief Executive Officer and Senior Financial Officers, violations of which should be reported to the Audit Committee. The code may be viewed through the Investor Relations section of our web site at www.humana.com. Any amendment to or waiver of the application of the Code of Conduct for the Chief Executive Officer and Senior Financial Officers will be promptly disclosed through the Investor Relations section of our web site at www.humana.com.
Code of Business Conduct and Ethics
Since 1995, we have operated under an omnibus Code of Ethics and Business Conduct, currently known as the Humana Inc. Ethics Every Day. All employees and directors are required to annually affirm in writing their acceptance of the code. The Humana Inc. Ethics Every Day was adopted by our Board of Directors in June 2014, replacing a previous iteration of our Code of Ethics and Business Conduct – the Humana Inc. Principles of Business Ethics – as the document to comply with the New York Stock Exchange Corporate Governance Standard 303A.10. The Humana Inc. Ethics Every Day is available on our web site at www.humana.com, and any waiver of the application of the Ethics Every Day with respect to directors or executive officers must be made by the Board of Directors and will be promptly disclosed on our web site at www.humana.com.
Corporate Governance Items
We have made available free of charge on or through the Investor Relations section of our web site at www.humana.com our annual reports on Form 10-K, quarterly reports on Form 10-Q, proxy statements, and all of our other reports, and, if applicable, amendments to those reports filed or furnished pursuant to Section 13(a) of the Exchange Act, as soon as reasonably practicable after we electronically file such material with, or furnish it to, the SEC. Also available on our Internet web site is information about our corporate governance, including:
| • | a determination of independence for each member of our Board of Directors; |
| • | the name, membership, role, and charter of each of the various committees of our Board of Directors; |
| • | the name(s) of the directors designated as a financial expert under rules and regulations promulgated by the SEC; |
| • | the responsibility of the Company’s Lead Independent Director, if applicable, to convene, set the agenda for, and lead executive sessions of the non-management directors; |
| • | the pre-approval process of non-audit services provided by our independent accountants; |
| • | our by-laws and Certificate of Incorporation; |
| • | our Majority Vote policy; |
| • | our Related Persons Transaction Policy; |
| • | the process by which interested parties can communicate with directors; |
| • | the process by which stockholders can make director nominations (pursuant to our By-laws); |
| • | our Corporate Governance Guidelines; |
| • | our Policy Regarding Transactions in Company Securities, Inside Information and Confidentiality; |
| • | Stock Ownership Guidelines for directors and for executive officers; |
| • | the Humana Inc. Ethics Every Day and any waivers thereto; and |
| • | the Code of Conduct for the Chief Executive Officer and Senior Financial Officers and any waivers thereto. |
Additional information about these items can be found in, and is incorporated by reference to, our Proxy Statement for the Annual Meeting of Stockholders scheduled to be held on April 18, 2019.
Material Changes to the Procedures by which Security Holders May Recommend Nominees to the Registrant’s Board of Directors
None.
Audit Committee Financial Expert
The information required by this Item is herein incorporated by reference from our Proxy Statement for the Annual Meeting of Stockholders scheduled to be held on April 18, 2019 appearing under the caption “Corporate Governance – Audit Committee” of such Proxy Statement.
Audit Committee Composition and Independence
The information required by this Item is herein incorporated by reference from our Proxy Statement for the Annual Meeting of Stockholders scheduled to be held on April 18, 2019 appearing under the caption “Corporate Governance – Committee Membership and Attendance” of such Proxy Statement.
Item 11. EXECUTIVE COMPENSATION
Additional information required by this Item is incorporated herein by reference from our Proxy Statement for the Annual Meeting of Stockholders scheduled to be held on April 18, 2019.
Item 12. SECURITY OWNERSHIP OF CERTAIN BENEFICIAL OWNERS AND MANAGEMENT AND RELATED STOCKHOLDER MATTERS
Equity compensation plan information
We maintain plans under which options to purchase our common stock and awards of restricted stock may be made to officers, directors, key employees, and consultants. Stock options are granted with an exercise price equal to the fair market value of the underlying common stock on the date of grant. Our stock plans, as approved by the Board of Directors and stockholders, define fair market value as the average of the highest and lowest stock prices reported on the composite tape by the New York Stock Exchange on a given date. Exercise provisions vary, but most options vest in whole or in part 1 to 3 years after grant and expire up to 7 years after grant.
Information concerning stock option awards and the number of securities remaining available for future issuance under our equity compensation plans in effect as of December 31, 2018 follows:
| Plan category | (a) Number of securities to be issued upon exercise of outstanding options, warrants and rights | (b) Weighted-average exercise price of outstanding options, warrants and rights | (c) Number of securities remaining available for future issuance under equity compensation plans (excluding securities reflected in column(a)) | ||||||||
| Equity compensation plans approved by security holders (1) | 677,648 | $ | 213.171 | 4,673,360 | (2)(3) | ||||||
| Equity compensation plans not approved by security holders | — | — | — | ||||||||
| Total | 677,648 | $ | 213.171 | 4,673,360 |
| (1) | The above table does not include awards of shares of restricted stock or restricted stock units. For information concerning these awards, see Note 13. |
| (2) | The Humana Inc. 2011 Stock Incentive Plan was approved by stockholders at the Annual Meeting held on April 21, 2011. On July 5, 2011, 18.5 million shares were registered with the Securities and Exchange Commission on Form S-8. |
| (3) | Of the number listed above, 2,040,768 can be issued as restricted stock at December 31, 2018 (giving effect to the provision that one restricted share is equivalent to 2.29 stock options in the 2011 Plan). |
The information under the captions “Security Ownership of Certain Beneficial Owners of Company Common Stock” and “Security Ownership of Directors and Executive Officers” in our Proxy Statement for the Annual Meeting of Stockholders scheduled to be held on April 18, 2019, is herein incorporated by reference.
Item 13. CERTAIN RELATIONSHIPS AND RELATED TRANSACTIONS, AND DIRECTOR INDEPENDENCE
The information required by this Item is herein incorporated by reference from our Proxy Statement for the Annual Meeting of Stockholders scheduled to be held on April 18, 2019 appearing under the captions “Certain Transactions with Management and Others” and “Corporate Governance – Independent Directors” of such Proxy Statement.
Item 14. PRINCIPAL ACCOUNTING FEES AND SERVICES
The information required by this Item is herein incorporated by reference from our Proxy Statement for the Annual Meeting of Stockholders scheduled to be held on April 18, 2019 appearing under the caption “Audit Committee Report” of such Proxy Statement.
PART IV
Item 15. EXHIBITS, FINANCIAL STATEMENT SCHEDULES
| (a) | The financial statements, financial statement schedules and exhibits set forth below are filed as part of this report. | |||||||
| (1) | Financial Statements – The response to this portion of Item 15 is submitted as Item 8 of Part II of this report. | |||||||
| (2) | The following Consolidated Financial Statement Schedules are included herein: | |||||||
| Schedule I | Parent Company Condensed Financial Information at December 31, 2018 and 2017 and for the years ended December 31, 2018, 2017 and 2016 | |||||||
| Schedule II | Valuation and Qualifying Accounts for the years ended December 31, 2018, 2017 and 2016 |
All other schedules have been omitted because they are not applicable.
| (3) | Exhibits: |
| 3(a) | Restated Certificate of Incorporation of Humana Inc. filed with the Secretary of State of Delaware on November 9, 1989, as restated to incorporate the amendment of January 9, 1992, and the correction of March 23, 1992 (incorporated herein by reference to Exhibit 4(i) to Humana Inc.’s Post-Effective Amendment No.1 to the Registration Statement on Form S-8 (Reg. No. 33-49305) filed February 2, 1994). |
| (b) | Humana Inc. Amended and Restated By-Laws of Humana Inc., effective as of December 14, 2017 (incorporated herein by reference to Exhibit 3(b) to Humana Inc.’s Current Report on Form 8-K filed on December 14, 2017). |
| 4(a) | Indenture, dates as of August 5, 2003, by and between Humana Inc. and The Bank of New York, as trustee (incorporated herein by reference to Exhibit 4.1 to Humana Inc.'s Quarterly Report on Form 10-Q for the quarter ended September 30, 2003, File No. 001-05975). |
| (b) | First Supplemental Indenture, dated as of August 5, 2003, by and between Humana Inc. and The Bank of New York, as trustee (incorporated herein by reference to Exhibit 4.2 to Humana Inc.’s Quarterly Report on Form 10-Q for the quarter ended September 30, 2003, File No. 001-05975). |
| (c) | Second Supplemental Indenture, dated as of May 31, 2006, by and between Humana Inc. and The Bank of New York Trust Company, N.A., as trustee (incorporated herein by reference to Exhibit 4.1 to Humana Inc.’s Current Report on Form 8-K filed on May 31, 2006, File No.001-05975). |
| (d) | Third Supplemental Indenture, dated as of June 5, 2008, by and between Humana Inc. and The Bank of New York Trust Company, N.A., as trustee (incorporated herein by reference to Exhibit 4.1 to Humana Inc.’s Current Report on Form 8-K filed on June 5, 2008). |
| (e) | Fourth Supplemental Indenture, dated as of June 5, 2008, by and between Humana Inc. and The Bank of New York Trust Company, N.A., as trustee (incorporated herein by reference to Exhibit 4.3 to Humana Inc.’s Current Report on Form 8-K filed on June 5, 2008). |
| (f) | Indenture, dated as of March 30, 2006, by and between Humana Inc. and The Bank of New York Trust Company, N.A., as trustee (incorporated herein by reference to Exhibit 4.2 to Humana Inc.’s Registration Statement on Form S-3 filed on March 31, 2006, Req. No. 333-132878). |
| (g) | There are no instruments defining the rights of holders with respect to long-term debt in excess of 10 percent of the total assets of Humana Inc. on a consolidated basis. Other long-term indebtedness of Humana Inc. is described herein in Note 12 to Consolidated Financial Statements. Humana Inc. agrees to furnish copies of all such instruments defining the rights of the holders of such indebtedness not otherwise filed as an Exhibit to this Annual Report on Form 10-K to the Commission upon request. |
| (h) | Fifth Supplemental Indenture, dated as of December 10, 2012, by and between Humana Inc. and The Bank of New York Mellon Trust Company, N.A., as trustee (incorporated herein by reference to Exhibit 4.1 to Humana Inc.’s Current Report on Form 8-K filed on December 10, 2012). |
| (i) | Sixth Supplemental Indenture, dated as of December 10, 2012, by and between Humana Inc. and The Bank of New York Mellon Trust Company, N.A., as trustee (incorporated herein by reference to Exhibit 4.3 to Humana Inc.’s Current Report on Form 8-K filed on December 10, 2012). |
| (j) | Seventh Supplemental Indenture, dated as of September 19, 2014, by and between Humana Inc. and The Bank of New York, Mellon Trust Company, N.A., as trustee (incorporated herein by reference to Exhibit 4.2 to Humana Inc.’s Current Report on Form 8-K filed on September 19, 2014). |
| (k) | Eighth Supplemental Indenture, dated as of September 19, 2014, by and between Humana Inc. and The Bank of New York Mellon Trust Company, N.A., as trustee (incorporated herein by reference to Exhibit 4.4 to Humana Inc.’s Current Report on Form 8-K filed on September 19, 2014). |
| (l) | Ninth Supplemental Indenture, dated as of September 19, 2014, by and between Humana Inc. and The Bank of New York Mellon Trust Company, N.A., as trustee (incorporated herein by reference to Exhibit 4.6 to Humana Inc.’s Current Report on Form 8-K filed on September 19, 2014). |
| (m) | Tenth Supplemental Indenture, dated March 16, 2017, between Humana Inc. and The Bank of New York Mellon Trust Company, N.A., as trustee (incorporated herein by reference to Exhibit 4.2 to Humana Inc.’s Current Report on Form 8-K filed on March 16, 2017. |
| (n) | Eleventh Supplemental Indenture, dated March 16, 2017, between Humana Inc. and The Bank of New York Mellon Trust Company, N.A., as trustee (incorporated herein by reference to Exhibit 4.4 to Humana Inc.’s Current Report on Form 8-K filed on March 16, 2017. |
| (o) | Twelfth Supplemental Indenture, dated December 21, 2017, between Humana Inc. and The Bank of New York Mellon Trust Company, N.A., as trustee (incorporated herein by reference to Exhibit 4.2 to Humana Inc.’s Current Report on Form 8-K filed on December 21, 2017. |
| (p) | Thirteenth Supplemental Indenture, dated December 21, 2017, between Humana Inc. and The Bank of New York Mellon Trust Company, N.A., as trustee (incorporated herein by reference to Exhibit 4.4 to Humana Inc.’s Current Report on Form 8-K filed on December 21, 2017. |
| 10(a)* | Form of Company’s Restricted Stock Unit Agreement and Agreement not to Compete or Solicit under the 2011 Stock Incentive Plan (with retirement provisions) (incorporated herein by reference to Exhibit 10(a) to Humana Inc.’s Annual Report on Form 10-K for the fiscal year ended December 31, 2015). |
| (b)* | Form of Company’s Restricted Stock Unit Agreement and Agreement not to Compete or Solicit under the 2011 Stock Incentive Plan (without retirement provisions) (incorporated herein by reference to Exhibit 10(b) to Humana Inc.’s Annual Report on Form 10-K for the fiscal year ended December 31, 2015). |
| (c)* | Humana Inc. Executive Management Incentive Compensation Plan, as amended and restated February 21, 2008 (incorporated herein by reference to Appendix A to Humana Inc.’s Proxy Statement with respect to the Annual Meeting of Stockholders held on April 24, 2008). |
| (d)* | Trust under Humana Inc. Deferred Compensation Plans (incorporated herein by reference to Exhibit 10(p) to Humana Inc.’s Annual Report on Form 10-K for the fiscal year ended December 31, 1999, File No. 001-05975). |
| (e)* | The Humana Inc. Deferred Compensation Plan for Non-Employee Directors (as amended on October 18, 2012) (incorporated herein by reference to Exhibit 10(m) to Humana Inc.’s Annual Report on Form 10-K for the fiscal year ended December 31, 2012). |
| (f)*† | Humana Inc. Executive Severance Policy, effective as of March 1, 2019. |
| (g)* | Humana Inc. Deferred Compensation Plan (incorporated herein by reference to Exhibit 4.1 to the Company’s Registration Statement on Form S-8 (Reg. No. 333-171616), filed on January 7, 2011). |
| (h)* | Humana Retirement Equalization Plan, as amended and restated as of January 1, 2011 (incorporated herein by reference to Exhibit 10(p) to Humana Inc.’s Annual Report on Form 10-K filed on February 18, 2011). |
| (i)* | Letter agreement with Humana Inc. officers concerning health insurance availability (incorporated herein by reference to Exhibit 10(mm) to Humana Inc.’s Annual Report on Form 10-K for the fiscal year ended December 31, 1994, File No. 001-05975). |
| (j)* | Executive Long-Term Disability Program (incorporated herein by reference to Exhibit 10(a) to Humana Inc.’s Quarterly Report on Form 10-Q for the quarter ended September 30, 2004). |
| (k)* | Indemnity Agreement (incorporated herein by reference to Appendix B to Humana Inc.’s Proxy Statement with respect to the Annual Meeting of Stockholders held on January 8, 1987). |
| (l)* | Form of Company’s Restricted Stock Unit Agreement and Agreement not to Solicit under the 2011 Stock Incentive Plan (with retirement provisions) (incorporated herein by reference to Exhibit 10(o) to Humana Inc.’s Annual Report on Form 10-K for the fiscal year ended December 31, 2015). |
| (m)* | Summary of the Company’s Financial Planning Program for our executive officers (incorporated herein by reference to Exhibit 10(v) to Humana’s Inc.’s Annual Report on Form 10-K filed on February 22, 2013. |
| (n)* | Form of Company’s Restricted Stock Unit Agreement and Agreement not to Solicit under the 2011 Stock Incentive Plan (without retirement provisions) (incorporated herein by reference to Exhibit 10(q) to Humana Inc.’s Annual Report on Form 10-K for the fiscal year ended December 31, 2015). |
| (o) | Five-Year $2 Billion Amended and Restated Credit Agreement , dated as of May 22, 2017, among Humana Inc., and JPMorgan Chase Bank, N.A. as Agent and as CAF Loan Agent, Bank of America, N.A. as Syndication Agent, Citibank, N.A., PNC Bank, National Association, U.S. Bank National Association, and Wells Fargo Bank, National Association, as Documentation Agents, and J.P. Morgan Chase Bank, N.A., Merrill Lynch, Pierce, Fenner & Smith Incorporated, Citigroup Global Markets, Inc., PNC Capital Markets LLC, U.S. Bank National Association, and Wells Fargo Securities, LLC, as Joint-Lead Arrangers and Joint Bookrunners (incorporated herein by reference to Exhibit 10 to Humana Inc.’s Current Report on Form 8-K filed on May 22, 2017). |
| (p) | Form of CMS Coordinated Care Plan Agreement (incorporated herein by reference to Exhibit 10.1 to Humana Inc.’s Quarterly Report on Form 10-Q for the quarter ended September 30, 2005, File No. 001-05975). |
| (q) | Form of CMS Private Fee for Service Agreement (incorporated herein by reference to Exhibit 10.2 to Humana Inc.’s Quarterly Report on Form 10-Q for the quarter ended September 30, 2005, File No. 001-05975). |
| (r) | Addendum to Agreement Providing for the Operation of a Medicare Voluntary Prescription Drug Plan (incorporated herein by reference to Exhibit 10.3 to Humana Inc.’s Quarterly Report on Form 10-Q for the quarter ended September 30, 2005, File No. 001-05975). |
| (s) | Addendum to Agreement Providing for the Operation of an Employer/Union-only Group Medicare Advantage Prescription Drug Plan (incorporated herein by reference to Exhibit 10.4 to Humana Inc.’s Quarterly Report on Form 10-Q for the quarter ended September 30, 2005, File No. 001-05975). |
| (t) | Addendum to Agreement Providing for the Operation of an Employer/Union-only Group Medicare Advantage-Only Plan (incorporated herein by reference to Exhibit 10.5 to Humana Inc.’s Quarterly Report on Form 10-Q for the quarter ended September 30, 2005, File No. 001-05975). |
| (u) | Addendum to Agreement Providing for the Operation of a Medicare Advantage Regional Coordinated Care Plan (incorporated herein by reference to Exhibit 10.6 to Humana Inc.’s Quarterly Report on Form 10-Q for the quarter ended September 30, 2005, File No. 001-05975). |
| (v) | Explanatory Note regarding Medicare Prescription Drug Plan Contracts between Humana and CMS (incorporated herein by reference to Exhibit 10(nn) to Humana Inc.’s Annual Report on Form 10-K for the fiscal year ended December 31, 2005, File No. 001-05975). |
| (w)* | Humana Inc. 2011 Stock Incentive Plan (incorporated herein by reference to Appendix A to Humana Inc.’s Proxy Statement with respect to the Annual Meeting of Stockholders held on April 21, 2011). |
| (x)* | Amended and Restated Employment Agreement, dated as of February 27, 2014, by and between Humana Inc. and Bruce D. Broussard (incorporated herein by reference to Exhibit 10.1 to Humana Inc.’s current report on Form 8-K filed on February 28, 2014). |
| (y)* | Amendment to the Amended and Restated Employment Agreement between Humana Inc. and Bruce D. Broussard, dated July 2, 2015 (incorporated herein by reference to Exhibit 10.1 to Humana Inc.’s current report on Form 8-K filed on July 9, 2015). |
| (z)* | Amendment No. 2, dated as of August 16, 2018, to the Amended and Restated Employment Agreement between Humana Inc. and Bruce D. Broussard, dated as of February 27, 2014 (incorporated herein by reference to Exhibit 10.1 to Humana Inc.s Current Report on Form 8-K, filed on August 20, 2018). |
| (aa)*† | Humana Inc. Change in Control Policy, effective March 1, 2019. |
| (bb) | Form of Commercial Paper Dealer Agreement between Humana Inc., as Issuer, and the Dealer party thereto (incorporated herein by reference to Exhibit 10.1 to Humana Inc.’s current report on Form 8-K filed on October 7, 2014). |
| (cc) | Form of Company's Stock Option Agreement under the 2011 Stock Incentive Plan (Incentive Stock Options) (incorporated herein by reference to Exhibit 10(jj) to Humana Inc.’s Annual Report on Form 10-K for the fiscal year ended December 31, 2015). |
| (dd)* | Form of Company's Stock Option Agreement under the 2011 Stock Incentive Plan (Non-Qualified Stock Options with Non-Compete/Non-Solicit) (incorporated herein by reference to Exhibit 10(kk) to Humana Inc.’s Annual Report on Form 10-K for the fiscal year ended December 31, 2015). |
| (ee)* | Form of Company's Restricted Stock Unit Agreement with Performance Vesting and Agreement not to Compete or Solicit under the 2011 Stock Incentive Plan (incorporated herein by reference to Exhibit 10(nn) to Humana Inc.’s Annual Report on Form 10-K filed on February 16, 2018). |
| (ff)*† | Form of Company’s Restricted Stock Unit Agreement and Agreement not to Compete or Solicit under the 2011 Stock Incentive Plan (with retirement provisions). |
| (gg)*† | Form of Company's Restricted Stock Unit Agreement with Performance Vesting and Agreement not to Compete or Solicit under the 2011 Stock Incentive Plan. |
| (hh)*† | Form of Company’s Incentive Stock Option Agreement and Agreement not to Compete or Solicit under the 2011 Stock Incentive Plan. |
| (ii)*† | Form of Company’s Stock Option Agreement and Agreement not to Compete or Solicit under the 2011 Stock Incentive Plan (Non-Qualified Stock Options). |
| (jj)*† | Humana Inc. Compensation Recoupment Policy, effective February 21, 2019. |
| 14 | Code of Conduct for Chief Executive Officer & Senior Financial Officers (incorporated herein by reference to Exhibit 14 to Humana Inc.’s Annual Report on Form 10-K for the fiscal year ended December 31, 2003). |
| 21 † | List of subsidiaries. |
| 23 † | Consent of PricewaterhouseCoopers LLP. |
| 31.1 † | CEO certification pursuant to Rule 13a-14(a)/15d-14(a). |
| 31.2 † | CFO certification pursuant to Rule 13a-14(a)/15d-14(a). |
| 32 † | Certification pursuant to 18 U.S.C. Section 1350, as adopted pursuant to Section 906 of the Sarbanes – Oxley Act of 2002. |
| 101 | The following materials from Humana Inc.'s Annual Report on Form 10-K formatted in XBRL (Extensible Business Reporting Language): (i) the Consolidated Balance Sheets at December 31, 2018 and 2017; (ii) the Consolidated Statements of Income for the years ended December 31, 2018, 2017 and 2016; (iii) the Consolidated Statements of Comprehensive Income for the years ended December 31, 2018, 2017 and 2016; (iv) the Consolidated Statements of Stockholders’ Equity as of December 31, 2018, 2017, and 2016; (v) the Consolidated Statements of Cash Flows for the years ended December 31, 2018, 2017 and 2016; and (vi) Notes to Consolidated Financial Statements. |
*Exhibits 10(a) through and including 10(n), and Exhibits 10(w) through and including 10(aa), as well as Exhibits 10(cc) through and including Exhibit 10(jj) are compensatory plans or management contracts.
**Pursuant to Rule 24b-2 of the Exchange Act, confidential portions of this exhibit have been omitted and filed separately with the Securities and Exchange Commission pursuant to a request for confidential treatment.
†Submitted electronically with this report.
Humana Inc.
SCHEDULE I—PARENT COMPANY FINANCIAL INFORMATION
CONDENSED BALANCE SHEETS
| December 31, | |||||||
| 2018 | 2017 | ||||||
| (in millions, except share amounts) | |||||||
| ASSETS | |||||||
| Current assets: | |||||||
| Cash and cash equivalents | $ | 265 | $ | 383 | |||
| Investment securities | 313 | 305 | |||||
| Receivable from operating subsidiaries | 1,306 | 1,042 | |||||
| Other current assets | 628 | 245 | |||||
| Total current assets | 2,512 | 1,975 | |||||
| Property and equipment, net | 1,209 | 1,091 | |||||
| Investments in subsidiaries | 16,951 | 16,810 | |||||
| Equity method investment in Kindred at Home | 1,047 | — | |||||
| Other long-term assets | 359 | 426 | |||||
| Total assets | $ | 22,078 | $ | 20,302 | |||
| LIABILITIES AND STOCKHOLDERS’ EQUITY | |||||||
| Current liabilities: | |||||||
| Payable to operating subsidiaries | $ | 4,487 | $ | 4,311 | |||
| Current portion of notes payable to operating subsidiaries | 28 | 28 | |||||
| Book overdraft | 38 | 41 | |||||
| Short-term debt | 1,694 | 150 | |||||
| Other current liabilities | 791 | 896 | |||||
| Total current liabilities | 7,038 | 5,426 | |||||
| Long-term debt | 4,375 | 4,770 | |||||
| Other long-term liabilities | 504 | 264 | |||||
| Total liabilities | 11,917 | 10,460 | |||||
| Commitments and contingencies | |||||||
| Stockholders’ equity: | |||||||
| Preferred stock, $1 par; 10,000,000 shares authorized; none issued | — | — | |||||
| Common stock, $0.16 2/3 par; 300,000,000 shares authorized; 198,594,841 shares issued at December 31, 2018 and 198,572,458 shares issued at December 31, 2017 | 33 | 33 | |||||
| Capital in excess of par value | 2,535 | 2,445 | |||||
| Retained earnings | 15,072 | 13,670 | |||||
| Accumulated other comprehensive income (loss) | (159 | ) | 19 | ||||
| Treasury stock, at cost, 63,028,169 shares at December 31, 2018 and 60,893,762 shares at December 31, 2017 | (7,320 | ) | (6,325 | ) | |||
| Total stockholders’ equity | 10,161 | 9,842 | |||||
| Total liabilities and stockholders’ equity | $ | 22,078 | $ | 20,302 |
See accompanying notes to the parent company financial statements.
Humana Inc.
SCHEDULE I—PARENT COMPANY FINANCIAL INFORMATION
CONDENSED STATEMENTS OF INCOME
| For the year ended December 31, | |||||||||||
| 2018 | 2017 | 2016 | |||||||||
| (in millions) | |||||||||||
| Revenues: | |||||||||||
| Management fees charged to operating subsidiaries | $ | 1,666 | $ | 1,864 | $ | 1,683 | |||||
| Investment and other income, net | 30 | 57 | 42 | ||||||||
| 1,696 | 1,921 | 1,725 | |||||||||
| Expenses: | |||||||||||
| Operating costs | 1,468 | 1,801 | 1,519 | ||||||||
| Merger termination fee and related costs, net | — | (936 | ) | 104 | |||||||
| Depreciation | 342 | 332 | 302 | ||||||||
| Interest | 218 | 243 | 189 | ||||||||
| 2,028 | 1,440 | 2,114 | |||||||||
| Other expense, net | 33 | — | — | ||||||||
| Loss on sale of business | 782 | — | — | ||||||||
| (Loss) income before income taxes and equity in net earnings of subsidiaries | (1,147 | ) | 481 | (389 | ) | ||||||
| (Benefit) provision for income taxes | (542 | ) | 61 | (107 | ) | ||||||
| (Loss) income before equity in net earnings of subsidiaries | (605 | ) | 420 | (282 | ) | ||||||
| Equity in net earnings of subsidiaries | 2,277 | 2,028 | 896 | ||||||||
| Equity in net earnings of Kindred at Home | 11 | — | — | ||||||||
| Net income | $ | 1,683 | $ | 2,448 | $ | 614 |
See accompanying notes to the parent company financial statements.
Humana Inc.
SCHEDULE I—PARENT COMPANY FINANCIAL INFORMATION
CONDENSED STATEMENTS OF COMPREHENSIVE INCOME
| For the year ended December 31, | |||||||||||
| 2018 | 2017 | 2016 | |||||||||
| (in millions) | |||||||||||
| Net income | $ | 1,683 | $ | 2,448 | $ | 614 | |||||
| Other comprehensive income (loss): | |||||||||||
| Change in gross unrealized investment losses/gains | (189 | ) | 149 | (101 | ) | ||||||
| Effect of income taxes | 51 | (55 | ) | 38 | |||||||
| Total change in unrealized investment gains/losses, net of tax | (138 | ) | 94 | (63 | ) | ||||||
| Reclassification adjustment for net realized gains included in investment income | (53 | ) | (14 | ) | (96 | ) | |||||
| Effect of income taxes | 17 | 5 | 35 | ||||||||
| Total reclassification adjustment, net of tax | (36 | ) | (9 | ) | (61 | ) | |||||
| Other comprehensive (loss) income, net of tax | (174 | ) | 85 | (124 | ) | ||||||
| Comprehensive income attributable to our equity method investment in Kindred at Home | (4 | ) | — | — | |||||||
| Comprehensive income | $ | 1,505 | $ | 2,533 | $ | 490 |
See accompanying notes to the parent company financial statements.
Humana Inc.
SCHEDULE I—PARENT COMPANY FINANCIAL INFORMATION
CONDENSED STATEMENTS OF CASH FLOWS
| For the year ended December 31, | |||||||||||
| 2018 | 2017 | 2016 | |||||||||
| (in millions) | |||||||||||
| Net cash provided by operating activities | $ | 2,719 | $ | 2,423 | $ | 1,848 | |||||
| Cash flows from investing activities: | |||||||||||
| Acquisitions, net of cash acquired | (354 | ) | — | — | |||||||
| Acquisitions, equity method investment in Kindred at Home | (1,095 | ) | — | — | |||||||
| Capital contributions to operating subsidiaries | (697 | ) | (695 | ) | (895 | ) | |||||
| Purchases of investment securities | (145 | ) | (53 | ) | (151 | ) | |||||
| Proceeds from sale of investment securities | 35 | — | 25 | ||||||||
| Maturities of investment securities | 59 | 51 | 143 | ||||||||
| Purchases of property and equipment, net | (465 | ) | (359 | ) | (382 | ) | |||||
| Net cash used in investing activities | (2,662 | ) | (1,056 | ) | (1,260 | ) | |||||
| Cash flows from financing activities: | |||||||||||
| Proceeds from issuance of senior notes, net | — | 1,779 | — | ||||||||
| Proceeds from issuance (repayments) of commercial paper, net | 485 | (153 | ) | (2 | ) | ||||||
| Proceeds from term loan | 1,000 | — | — | ||||||||
| Repayment of term loan | (350 | ) | — | — | |||||||
| Repayment of long-term debt | — | (800 | ) | — | |||||||
| Change in book overdraft | (3 | ) | 3 | 5 | |||||||
| Common stock repurchases | (1,090 | ) | (3,365 | ) | (104 | ) | |||||
| Dividends paid | (265 | ) | (220 | ) | (177 | ) | |||||
| Proceeds from stock option exercises and other | 48 | 62 | 11 | ||||||||
| Net cash used in financing activities | (175 | ) | (2,694 | ) | (267 | ) | |||||
| (Decrease) increase in cash and cash equivalents | (118 | ) | (1,327 | ) | 321 | ||||||
| Cash and cash equivalents at beginning of year | 383 | 1,710 | 1,389 | ||||||||
| Cash and cash equivalents at end of year | $ | 265 | $ | 383 | $ | 1,710 |
See accompanying notes to the parent company financial statements.
Humana Inc.
SCHEDULE I—PARENT COMPANY FINANCIAL INFORMATION
NOTES TO CONDENSED FINANCIAL STATEMENTS
- BASIS OF PRESENTATION
Parent company financial information has been derived from our consolidated financial statements and excludes the accounts of all operating subsidiaries. This information should be read in conjunction with our consolidated financial statements.
- TRANSACTIONS WITH SUBSIDIARIES
Management Fee
Through intercompany service agreements approved, if required, by state regulatory authorities, Humana Inc., our parent company, charges a management fee for reimbursement of certain centralized services provided to its subsidiaries including information systems, disbursement, investment and cash administration, marketing, legal, finance, and medical and executive management oversight.
Dividends
Cash dividends received from subsidiaries and included as a component of net cash provided by operating activities were $2.3 billion in 2018, $1.4 billion in 2017, and $0.8 billion in 2016.
Guarantee
Through indemnity agreements approved by state regulatory authorities, certain of our regulated subsidiaries generally are guaranteed by our parent company in the event of insolvency for: (1) member coverage for which premium payment has been made prior to insolvency; (2) benefits for members then hospitalized until discharged; and (3) payment to providers for services rendered prior to insolvency. Our parent has also guaranteed the obligations of our military services subsidiaries and funding to maintain required statutory capital levels of certain other regulated subsidiaries.
- REGULATORY REQUIREMENTS
Certain of our subsidiaries operate in states that regulate the payment of dividends, loans, or other cash transfers to Humana Inc., our parent company, and require minimum levels of equity as well as limit investments to approved securities. The amount of dividends that may be paid to Humana Inc. by these subsidiaries, without prior approval by state regulatory authorities, or ordinary dividends, is limited based on the entity’s level of statutory income and statutory capital and surplus. If the dividend, together with other dividends paid within the preceding twelve months, exceeds a specified statutory limit or is paid from sources other than earned surplus, it is generally considered an extraordinary dividend requiring prior regulatory approval. In most states, prior notification is provided before paying a dividend even if approval is not required.
Although minimum required levels of equity are largely based on premium volume, product mix, and the quality of assets held, minimum requirements vary significantly at the state level. Our state regulated insurances subsidiaries had aggregate statutory capital and surplus of approximately $7.6 billion and $8.0 billion as of December 31, 2018 and 2017, respectively, which exceeded aggregate minimum regulatory requirements of $5.2 billion and $4.8 billion, respectively. The amount of ordinary dividends that may be paid to our parent company in 2019 is approximately $1 billion in the aggregate. The amount, timing and mix of ordinary and extraordinary dividend payments will vary due to state regulatory requirements, the level of excess statutory capital and surplus and expected future surplus requirements related to, for example, premium volume and product mix. Actual dividends that were paid to our parent company were approximately $2.3 billion in 2018, $1.4 billion in 2017, and $0.8 billion in 2016.
Our use of operating cash flows derived from our non-insurance subsidiaries, such as in our Healthcare Services segment, is generally not restricted by state departments of insurance (or comparable state regulators).
- ACQUISITIONS AND DIVESTITURES
Refer to Note 3 of the notes to consolidated financial statements in this Annual Report on Form 10-K for a description of certain acquisitions and divestitures. During 2018, 2017 and 2016, we funded certain non-regulated subsidiary acquisitions with contributions from Humana Inc., our parent company, included in capital contributions in the condensed statement of cash flows.
- INCOME TAXES
Refer to Note 11 of the notes to consolidated financial statements included in this Annual Report on Form 10-K for a description of income taxes.
- DEBT
Refer to Note 12 of the notes to consolidated financial statements included in this Annual Report on Form 10-K for a description of debt.
- STOCKHOLDER’S EQUITY
Refer to Note 15 of the notes to consolidated financial statements included in this Annual Report on Form 10-K for a description of stockholders’ equity, including stock repurchases and stockholder dividends.
Humana Inc.
SCHEDULE II—VALUATION AND QUALIFYING ACCOUNTS
For the Years Ended December 31, 2018, 2017, and 2016
(in millions)
| Additions | ||||||||||||||||||||||||
| Balance at Beginning of Period | Acquired/(Disposed) Balances | Charged (Credited) to Costs and Expenses | Charged to Other Accounts (1) | Deductions or Write-offs | Balance at End of Period | |||||||||||||||||||
| Allowance for loss on receivables: | ||||||||||||||||||||||||
| 2018 | $ | 96 | $ | — | $ | 36 | $ | (29 | ) | $ | (24 | ) | $ | 79 | ||||||||||
| 2017 | 118 | — | 20 | (10 | ) | (32 | ) | 96 | ||||||||||||||||
| 2016 | 101 | — | 39 | 19 | (41 | ) | 118 | |||||||||||||||||
| Deferred tax asset valuation allowance: | ||||||||||||||||||||||||
| 2018 | (49 | ) | — | (5 | ) | — | — | (54 | ) | |||||||||||||||
| 2017 | (49 | ) | — | — | — | — | (49 | ) | ||||||||||||||||
| 2016 | (42 | ) | — | (7 | ) | — | — | (49 | ) |
| (1) | Represents changes in retroactive membership adjustments to premiums revenue and contractual allowances adjustments to services revenue as more fully described in Note 2 to the consolidated financial statements included in this annual report on Form 10-K. |
Item 16. FORM 10-K SUMMARY
None.
SIGNATURES
Pursuant to the requirements of Sections 13 or 15(d) of the Securities Exchange Act of 1934, the Company has duly caused this report to be signed on its behalf by the undersigned, thereto duly authorized.
| HUMANA INC. | |||
| By: | /s/ BRIAN A. KANE | ||
| Brian A. Kane | |||
| Chief Financial Officer (Principal Financial Officer) | |||
| Date: | February 21, 2019 |
Pursuant to the requirements of the Securities Exchange Act of 1934, this report has been signed below by the following persons on behalf of the Company and in the capacities and on the date indicated.
| Signature | Title | Date | ||
| /s/ BRIAN A. KANE | Chief Financial Officer (Principal Financial Officer) | February 21, 2019 | ||
| Brian A. Kane | ||||
| /s/ CYNTHIA H. ZIPPERLE | Senior Vice President and Chief Accounting Officer (Principal Accounting Officer) | February 21, 2019 | ||
| Cynthia H. Zipperle | ||||
| /s/ BRUCE D. BROUSSARD | President and Chief Executive Officer, Director (Principal Executive Officer) | February 21, 2019 | ||
| Bruce D. Broussard | ||||
| /s/ KURT J. HILZINGER | Chairman of the Board | February 21, 2019 | ||
| Kurt J. Hilzinger | ||||
| /s/ FRANK BISIGNANO | Director | February 21, 2019 | ||
| Frank Bisignano | ||||
| /s/ KAREN DESALVO MD, MPH, MSc | Director | February 21, 2019 | ||
| Karen DeSalvo, MD, MPH, MSc | ||||
| /s/ FRANK A. D’AMELIO | Director | February 21, 2019 | ||
| Frank A. D’Amelio | ||||
| /s/ W. ROY DUNBAR | Director | February 21, 2019 | ||
| W. Roy Dunbar | ||||
| /s/ DAVID A. JONES, JR. | Director | February 21, 2019 | ||
| David A. Jones, Jr. | ||||
| /s/ WILLIAM J. MCDONALD | Director | February 21, 2019 | ||
| William J. McDonald | ||||
| /s/ WILLIAM E. MITCHELL | Director | February 21, 2019 | ||
| William E. Mitchell | ||||
| /s/ DAVID B. NASH, M.D. | Director | February 21, 2019 | ||
| David B. Nash, M.D. | ||||
| /s/ JAMES J. O’BRIEN | Director | February 21, 2019 | ||
| James J. O’Brien | ||||
| /s/ MARISSA T. PETERSON | Director | February 21, 2019 | ||
| Marissa T. Peterson |