 filings.tools
Item 5. Market for Registrant’s Common Equity, Related Stockholder Matters and Issuer Purchases of Equity Securities.
5K characters. Original on sec.gov · Markdown
Item 5. Market for Registrant’s Common Equity, Related Stockholder Matters and Issuer Purchases of Equity Securities.
The Company’s common stock is listed on the New York Stock Exchange. Prior to the Separation of Alcoa Corporation from the Company, the Company’s common stock traded under the symbol “AA.” In connection with the separation, on November 1, 2016, the Company changed its stock symbol and its common stock began trading under the symbol “ARNC.”
On October 5, 2016, the Company’s common shareholders approved a 1-for-3 reverse stock split of the Company’s outstanding and authorized shares of common stock (the “Reverse Stock Split”). As a result of the Reverse Stock Split, every three shares of issued and outstanding common stock were combined into one issued and outstanding share of common stock, without any change in the par value per share. The Reverse Stock Split reduced the number of shares of common stock outstanding from approximately 1.3 billion shares to approximately 0.4 billion shares, and proportionately decreased the number of authorized shares of common stock from 1.8 billion to 0.6 billion shares. The Company’s common stock began trading on a Reverse Stock Split-adjusted basis on October 6, 2016.
On November 1, 2016, the Company completed the Separation of its business into two independent, publicly traded companies: the Company and Alcoa Corporation. The Separation was effected by means of a pro rata distribution by the Company of 80.1% of the outstanding shares of Alcoa Corporation common stock to the Company’s shareholders. The Company’s shareholders of record as of the close of business on October 20, 2016 (the “Record Date”) received one share of Alcoa Corporation common stock for every three shares of the Company’s common stock held as of the Record Date. The Company retained 19.9% of the outstanding common stock of Alcoa Corporation immediately following the Separation. See disposition of retained shares in Note V to the Consolidated Financial Statements in Part II Item 8 of this Form 10-K.
The number of holders of record of common stock was approximately 11,668 as of February 15, 2019.
Stock Performance Graph
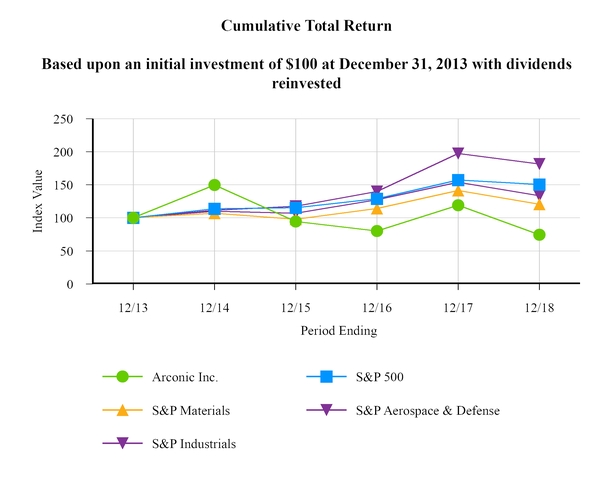
The following graph compares the most recent five-year performance of the Company’s common stock with (1) the Standard & Poor’s (S&P) 500® Index, (2) the S&P 500® Materials Index, a group of 25 companies categorized by Standard & Poor’s as active in the “materials” market sector, (3) the S&P Aerospace & Defense Select Industry Index, a group of 33 companies categorized by Standard & Poor’s as active in the “aerospace & defense” industry and (4) the S&P 500® Industrials Index, a group of 69 companies categorized by Standard & Poor’s as active in the “industrials” market sector. The graph assumes, in each case, an initial investment of $100 on December 31, 2013, and the reinvestment of dividends. Historical prices prior to the separation of Alcoa Corporation from the Company on November 1, 2016, have been adjusted to reflect the value of the Separation transaction. The graph, table and related information shall not be deemed to be “filed” with the SEC, nor shall such information be incorporated by reference into future filings under the Securities Act of 1933 or Securities Exchange Act of 1934, each as amended, except to the extent that the Company specifically incorporates it by reference into such filing.
Please note that the Company intends to replace the S&P 500® Materials Index with the S&P Aerospace & Defense Select Industry Index and the S&P 500® Industrials Index in subsequent stock performance graphs. We believe that the companies and industries represented in the S&P Aerospace & Defense Select Industry Index and the S&P 500® Industrials Index better reflect the markets in which the Company currently participates. All three indices are represented in the graph below.
Copyright© 2019 Standard & Poor's, a division of S&P Global. All rights reserved.
| As of December 31, | 2013 | 2014 | 2015 | 2016 | 2017 | 2018 | |||||||||||||||||
| Arconic Inc. | $ | 100 | $ | 149.83 | $ | 94.62 | $ | 80.22 | $ | 119.02 | $ | 74.47 | |||||||||||
| S&P 500® Index | 100 | 113.69 | 115.26 | 129.05 | 157.22 | 150.33 | |||||||||||||||||
| S&P 500® Materials Index | 100 | 106.91 | 97.95 | 114.30 | 141.55 | 120.74 | |||||||||||||||||
| S&P Aerospace & Defense Select Industry Index | 100 | 111.43 | 117.49 | 139.70 | 197.50 | 181.56 | |||||||||||||||||
| S&P 500® Industrials Index | 100 | 109.83 | 107.04 | 127.23 | 153.99 | 133.53 |
Previous: Item 4. Mine Safety Disclosures. · Next: Item 6. Selected Financial Data.