 filings.tools
Item 7. MANAGEMENT’S DISCUSSION AND ANALYSIS OF FINANCIAL CONDITION AND RESULTS OF OPERATIONS
179K characters. Original on sec.gov · Markdown
Item 7. MANAGEMENT’S DISCUSSION AND ANALYSIS OF FINANCIAL CONDITION AND RESULTS OF OPERATIONS
The following discussion contains forward-looking statements that involve risks and uncertainties. Our actual results could differ materially from those anticipated in these forward-looking statements for many reasons. See the factors set forth under the heading “Forward Looking Statements” at the beginning of Part 1 of this Annual Report and in Item 1(A) under the heading “Risk Factors.” The following discussion is qualified in its entirety by, and should be read in conjunction with, the more detailed information contained in Item 6. Selected Financial Data and our consolidated financial statements included in this Annual Report. For discussion related to the results of operations and changes in financial condition for 2019 compared to 2018 refer to Part II, Item 7. Management's Discussion and Analysis of Financial Condition and Results of Operations in our 2019 Annual Report on Form 10-K, which was filed with the U.S. Securities and Exchange Commission on February 6, 2020.
Overview
We are a provider of marketplace infrastructure, data services and technology solutions to a broad range of customers including financial institutions, corporations and government entities. These products, which span major asset classes including futures, equities, fixed income and U.S. residential mortgages, provide our customers with access to mission critical workflow tools that are designed to increase asset class transparency and workflow efficiency. We report our results in three segments: Exchanges, Fixed Income and Data Services, and Mortgage Technology. The majority of our identifiable assets are located in the U.S. and U.K.
-
In our Exchanges segment, we operate regulated marketplaces for the listing, trading and clearing of a broad array of derivatives contracts and financial securities. Much of the revenue reported in the Exchanges segment was previously reported in our Trading & Clearing segment. However, data services revenues and listings revenues, which are now reported in the Exchanges segment, were previously reported in our Data & Listings segment.
-
In our Fixed Income and Data Services segment, we provide fixed income pricing, reference data, indices and execution services as well as global CDS clearing and multi-asset class data delivery solutions. Our CDS Clearing and ICE Bonds transaction revenue was previously reported in our Trading & Clearing segment, while all of our Fixed Income Data & Analytics and Other Data & Network Services revenues were reported in our Data & Listings segment.
-
In our Mortgage Technology segment, we provide an end-to-end technology platform that offers customers comprehensive, digital workflow tools that aim to address the inefficiencies that exist in the U.S. residential mortgage market. Prior to the re-alignment of our business, ICE Mortgage Technology was reported in our Trading & Clearing segment.
Recent Developments
COVID-19
The coronavirus (COVID-19) pandemic has created economic and financial disruptions globally and has led governmental authorities to take unprecedented measures to mitigate the spread of the disease, including travel bans, border closings, business closures, quarantines and shelter-in-place orders, and to take actions designed to stabilize markets and promote economic growth.
From an operational perspective, our businesses, including our exchanges, clearing houses, listing venues, data services businesses, and mortgage platforms, have remained open and we do not have any plans to close any of our business operations as a result of the COVID-19 pandemic. However, due to the COVID-19 pandemic, we have taken preventative measures and implemented contingency plans, and currently most of our employees are working remotely. In response to government mandates, we closed all of our office facilities between early March and late April 2020, with only our operationally essential employees working on-site at our facilities for business continuity purposes. As various governments began easing orders requiring office closures in late April, we began a phased re-opening of certain of our office facilities allowing a limited number of operationally non-essential workers to also work on-site. These measures are in compliance, as necessary, with local government directives and social distancing directives. We continue to monitor local government mandates in determining our office re-openings, re-closures and work-related travel.
Global health concerns relating to COVID-19 and preventive measures taken to reduce its spread have created significant volatility in financial markets, which has resulted in higher trading volumes for some of our products and increased demand for our services.
The extent of the impact of the pandemic on our business will depend largely on future developments, including the duration, spread and severity of the outbreak, the distribution, public acceptance and widespread use and effectiveness of vaccines against COVID-19 and the actions taken to contain the spread of the disease or mitigate its impact. We continue to monitor this dynamic situation, including guidance and regulations issued by U.S. and other governmental authorities. In light of the continually evolving nature of the COVID-19 outbreak, we are not able at this time to estimate the ultimate effect of the pandemic on our business, results of operations or financial condition in the future.
Acquisition of Ellie Mae
On September 4, 2020, we acquired Ellie Mae for aggregate consideration of $11.4 billion from private equity firm Thoma Bravo. Ellie Mae is a cloud-based technology solution provider for the mortgage finance industry. Through its digital lending platform, Ellie Mae provides technology solutions to participants in the mortgage supply chain, including over
3,000 customers and thousands of partners and investors who participate on its open network. Originators rely on Ellie Mae to securely manage the exchange of data across the mortgage ecosystem to enable the origination of mortgages while adhering to various local, state and federal compliance requirements. Ellie Mae is a part of our ICE Mortgage Technology business and is included in our Mortgage Technology segment. From the acquisition date through December 31, 2020, Ellie Mae revenues of $351 million and operating expenses of $250 million were recorded for the year ended December 31, 2020, which are reflected in our mortgage technology revenues and operating expenses, respectively.
The purchase price consisted of $9.5 billion in cash, as adjusted for $335 million of cash and cash equivalents held by Ellie Mae on the date of acquisition, and approximately $1.9 billion, or approximately 18.4 million shares of our common stock, based on our stock price on the acquisition date. ICE funded the cash portion of the purchase price with net proceeds from our offering of new senior notes in August 2020, together with the issuance of commercial paper and borrowings under a new senior unsecured term loan facility.
Acquisition of Bridge2 Solutions
On February 21, 2020, our Bakkt subsidiary acquired Bridge2 Solutions, a leading provider of loyalty solutions for merchants and consumers. Bridge2 Solutions enables some of the world’s leading brands to engage customers and drive loyalty. It powers incentive and employee perk programs for companies across a wide spectrum of industries.
Bakkt Transaction
Additionally, on January 11, 2021, Bakkt, our majority-owned indirect subsidiary, entered into a definitive agreement and plan of merger, or the Merger Agreement, to combine with VPC Impact Acquisition Holdings, or VIH, a special purpose acquisition company sponsored by Victory Park Capital. Pursuant to the terms and subject to the conditions set forth in the Merger Agreement, VIH plans to domesticate and become a Delaware corporation (the “Domestication”) and be renamed “Bakkt Holdings, Inc.” (“Bakkt Pubco”) and, following the Domestication, a subsidiary of VIH plans to merge with and into Bakkt (the “Merger”), with Bakkt surviving the Merger. Upon the consummation of the Merger (the “Closing”), Bakkt Pubco plans to be organized in an “Up-C” structure in which substantially all of the assets and the business of Bakkt Pubco will be held by Bakkt and its subsidiaries, and Bakkt Pubco’s only direct assets will consist of its membership interests in Bakkt. Upon the Closing, Bakkt Pubco is expected to have a class of common stock listed on the New York Stock Exchange.
Also on January 11, 2021, concurrently with the execution of the Merger Agreement, VIH entered into subscription agreements with certain investors (collectively, the “PIPE Investors”), pursuant to which, and on the terms and subject to the conditions of which, the PIPE Investors have collectively subscribed for additional equity in Bakkt Pubco for an aggregate purchase price equal to $325 million (the “PIPE Investment”). The PIPE Investors include ICE, and we committed to purchase additional equity in Bakkt Pubco that would comprise up to $50 million of the PIPE Investment. The PIPE Investment will be consummated immediately prior to the Closing.
As part of the transaction, Bakkt’s existing equity holders and management will roll 100% of their equity into the combined company. Assuming no shareholders of VIH exercise their redemption rights, current Bakkt equity holders, including ICE, will own approximately 78% of the combined company, VIH’s public shareholders will own approximately 8%, VPC will own 2%, and PIPE investors (a group that will also include us) will own approximately 12% of the issued and outstanding common stock of the combined company at closing; ICE is expected to have a 65% economic interest in the combined company at the Closing, which is expected to occur in the second quarter of 2021. The proposed transaction is subject to customary closing conditions, including the approval of VIH’s shareholders and certain regulatory approvals. At the Closing, ICE, which is expected to own a majority of the common stock of the Bakkt Pubco immediately following the Merger, will enter into a voting agreement with Bakkt Pubco (the “Voting Agreement”). Pursuant to the Voting Agreement, for so long as we own at least 50% of the total voting power of Bakkt Pubco common stock, we will agree to vote on any matter submitted to a vote or consent of the stockholders of Bakkt Pubco any shares of common stock of Bakkt Pubco owned by us in excess of 30% of the outstanding voting power of Bakkt Pubco, in the same percentages, for and against the relevant matter, as votes are cast by all stockholders of Bakkt Pubco other than ICE. As a consequence of the Voting Agreement and Bakkt Pubco’s other governance arrangements, following the Closing, we expect to reclassify Bakkt Pubco as our equity method investment and Bakkt will therefore cease to be consolidated with our financial statements.
Consolidated Financial Highlights
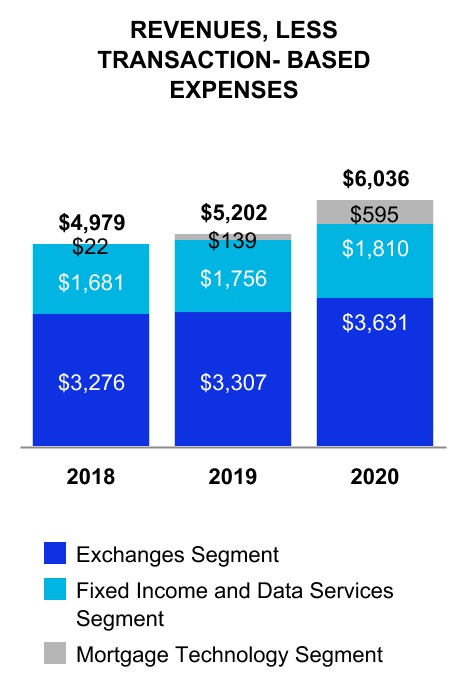
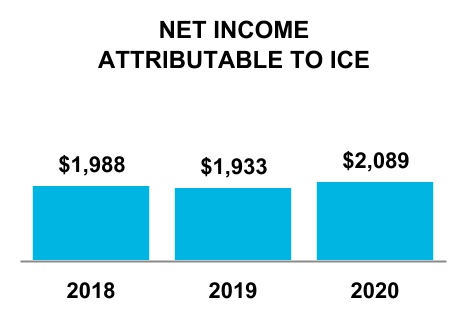
The following summarizes our results and significant changes in our consolidated financial performance for the periods presented (dollars in millions, except per share amounts):



| Year Ended December 31, | Year Ended December 31, | ||||||||||||||||||||||||||||||||||||||||
| 2020 | 2019 | Change | 2019 | 2018 | Change | ||||||||||||||||||||||||||||||||||||
| Revenues, less transaction-based expenses | $ | 6,036 | $ | 5,202 | 16 | % | $ | 5,202 | $ | 4,979 | 4 | % | |||||||||||||||||||||||||||||
| Operating expenses | $ | 3,003 | $ | 2,529 | 19 | % | $ | 2,529 | $ | 2,396 | 6 | % | |||||||||||||||||||||||||||||
| Adjusted operating expenses(1) | $ | 2,495 | $ | 2,189 | 14 | % | $ | 2,189 | $ | 2,071 | 6 | % | |||||||||||||||||||||||||||||
| Operating income | $ | 3,033 | $ | 2,673 | 13 | % | $ | 2,673 | $ | 2,583 | 3 | % | |||||||||||||||||||||||||||||
| Adjusted operating income(1) | $ | 3,541 | $ | 3,013 | 18 | % | $ | 3,013 | $ | 2,908 | 4 | % | |||||||||||||||||||||||||||||
| Operating margin | 50 | % | 51 | % | (1 pt) | 51 | % | 52 | % | (1 pt) | |||||||||||||||||||||||||||||||
| Adjusted operating margin(1) | 59 | % | 58 | % | 1 pt | 58 | % | 58 | % | — | |||||||||||||||||||||||||||||||
| Other income (expense), net | $ | (267) | $ | (192) | 39 | % | $ | (192) | $ | (63) | 203 | % | |||||||||||||||||||||||||||||
| Income tax expense (benefit) | $ | 658 | $ | 521 | 26 | % | $ | 521 | $ | 500 | 4 | % | |||||||||||||||||||||||||||||
| Effective tax rate | 24 | % | 21 | % | 3 pts | 21 | % | 20 | % | 1 pt | |||||||||||||||||||||||||||||||
| Net income attributable to ICE | $ | 2,089 | $ | 1,933 | 8 | % | $ | 1,933 | $ | 1,988 | (3) | % | |||||||||||||||||||||||||||||
| Adjusted net income attributable to ICE(1) | $ | 2,500 | $ | 2,194 | 14 | % | $ | 2,194 | $ | 2,077 | 6 | % | |||||||||||||||||||||||||||||
| Diluted earnings per share attributable to ICE common stockholders | $ | 3.77 | $ | 3.42 | 10 | % | $ | 3.42 | $ | 3.43 | — | % | |||||||||||||||||||||||||||||
| Adjusted diluted earnings per share attributable to ICE common stockholders(1) | $ | 4.51 | $ | 3.88 | 16 | % | $ | 3.88 | $ | 3.59 | 8 | % | |||||||||||||||||||||||||||||
| Cash flows from operating activities | $ | 2,881 | $ | 2,659 | 8 | % | $ | 2,659 | $ | 2,533 | 5 | % |
(1) The adjusted figures exclude items that are not reflective of our ongoing core operations and business performance. Adjusted net income attributable to ICE and adjusted diluted earnings per share attributable to ICE common stockholders are presented net of taxes. These adjusted numbers are not calculated in accordance with U.S. Generally Accepted Accounting Principles, or GAAP. See “- Non-GAAP Financial Measures” below.
-
Revenues, less transaction-based expenses, increased $834 million in 2020 from 2019. The increase in revenues includes $7 million in favorable foreign exchange effects arising from the weaker U.S. dollar in 2020 from 2019.
-
Revenues, less transaction-based expenses, increased $223 million in 2019 from 2018. The increase in revenues includes $34 million in unfavorable foreign exchange effects arising from the stronger U.S. dollar in 2019 from 2018.
-
Operating expenses increased $474 million in 2020 from 2019. The increase in operating expenses includes $2 million in unfavorable foreign exchange effects arising from the weaker U.S. dollar in 2020 from 2019.
-
Operating expenses increased $133 million in 2019 from 2018. The increase in operating expenses includes $14 million in favorable foreign exchange effects arising from the stronger U.S. dollar in 2019 from 2018.
-
In connection with our acquisition of MERS, we recorded a $110 million gain in other income during 2018.
-
The effective tax rate in 2020 is higher than the effective tax rate in 2019 primarily due to U.K. tax law changes enacted in July 2020, partially offset by favorable state apportionment changes as a result of our acquisition of Ellie Mae, as well as favorable changes in certain international tax provisions as part of the U.S. Federal Tax Cuts and Jobs Act, or TCJA, in 2019.
-
The effective tax rate in 2019 was higher than the effective tax rate in 2018 primarily due to the 2018 discrete tax benefits from the acquisition of MERS and the divestiture of Trayport exceeding the net increased tax benefits recorded in 2019 from certain international tax provisions under the TCJA.
Business Environment and Market Trends
Our business environment has been characterized by:
-
globalization of marketplaces, customers and competitors;
-
growing customer demand for workflow efficiency and automation;
-
commodity, interest rate and financial markets uncertainty;
-
growing demand for data to inform customers' risk management and investment decisions;
-
evolving, increasing and disparate regulation across multiple jurisdictions;
-
price volatility increasing customers' demand for risk management services;
-
increasing focus on capital and cost efficiencies;
-
customers' preference to manage risk in markets demonstrating the greatest depth of liquidity and product diversity;
-
the evolution of existing products and new product innovation to serve emerging customer needs and changing industry agreements;
-
rising demand for speed, data, data capacity and connectivity by market participants, necessitating increased investment in technology; and
-
consolidation and increasing competition among global markets for trading, clearing and listings.
Recent changes with regard to global financial reform have emphasized the importance of transparent markets, centralized clearing and access to data, all of which are important aspects of our product offering. However, some of the proposed rules have yet to be implemented and some rules that have already been partially implemented are being reconsidered. In addition, some of the global regulations have not been fully harmonized and several non-U.S. regulations are inconsistent with U.S. rules. As the evolution continues, legislative and regulatory actions may change the way we conduct our business and may create uncertainty for market participants, which could affect trading volumes or demand for market data. As a result, it is difficult to predict all of the effects that the legislation and its implementing regulations will have on us. As discussed more fully in Item 1 “- Business - Regulation” included in this Annual Report, Brexit, the implementation of MiFID II and other regulations may result in operational, regulatory and/or business risk.
We have diversified our business so that we are not dependent on volatility or transaction activity in any one asset class. In addition, we have increased our portion of non-transaction and clearing revenues from 34% in 2014 to 48% in 2020. This non-transaction revenue includes data services, listings and various mortgage technology solutions.
Many of the data products we sell and services we provide are required for our clients’ business operations regardless of market volatility or shifts in business profitability levels. We anticipate that there will continue to be growth in the financial information services sector driven by a number of global trends, including the following:
-
increasing global regulatory demands;
-
greater use of fair value accounting standards and reliance on independent valuations;
-
greater emphasis on risk management;
-
market fragmentation driven by regulatory changes;
-
the move to passive investing and indexation;
-
ongoing growth in the size and diversity of financial markets;
-
increased automation of fixed income and other less automated markets;
-
the development of new data products;
-
the demand for greater data capacity and connectivity;
-
new entrants; and
-
increasing demand for outsourced services by financial institutions.
We continue to focus on our strategy to grow each of our revenue streams, and prudently manage expenses, in order to mitigate these uncertainties and to build on our growth opportunities by leveraging our proprietary data, clearing, markets and technology solutions.
Segment Results
We previously operated as two reportable business segments, but effective October 1, 2020, we realigned our businesses as part of a review of, and changes in, our organizational structure following our acquisition of Ellie Mae. As a result, we changed our internal financial reporting and determined that a change in reportable segments had occurred. Prior periods have been adjusted to reflect this change. Our segments do not engage in intersegment transactions.
As of December 31, 2020, our business is conducted through three reportable business segments, comprised of the following:
-
Our Exchanges segment includes our trade execution and clearing within our global futures network and NYSE businesses, various data and connectivity services that are directly related to those exchange platforms, administration fees and our NYSE listings business. Trade execution and clearing products include energy, agricultural and metals, financial futures and options, cash equities, equity options, OTC and other;
-
Our Fixed Income and Data Services segment includes trade execution and clearing within our ICE Bonds and CDS businesses, pricing and reference data, analytics, indices, consolidated feeds and our ICE Global Network businesses; and
-
Our Mortgage Technology segment includes our MERS, Simplifile and Ellie Mae mortgage services businesses. This segment includes origination technology, network and closing solutions, data and analytics, registrations and other.
While revenues are recorded specifically in the segment in which they are earned or to which they relate, a significant portion of our operating expenses are not solely related to a specific segment because the expenses serve functions that are necessary for the operation of more than one segment. We directly allocate expenses when reasonably possible to do so. Otherwise, we use a pro-rata revenue approach as the allocation method for the expenses that do not relate solely to one segment and serve functions that are necessary for the operation of all segments. Our October 1, 2020 change in business segment presentation triggered a reallocation of our segment operating expenses. Prior periods have been adjusted to reflect this change.
For details on trends in recent prior year periods, refer to our 2019 and 2018 Annual Reports on Form 10-K.
Exchanges Segment
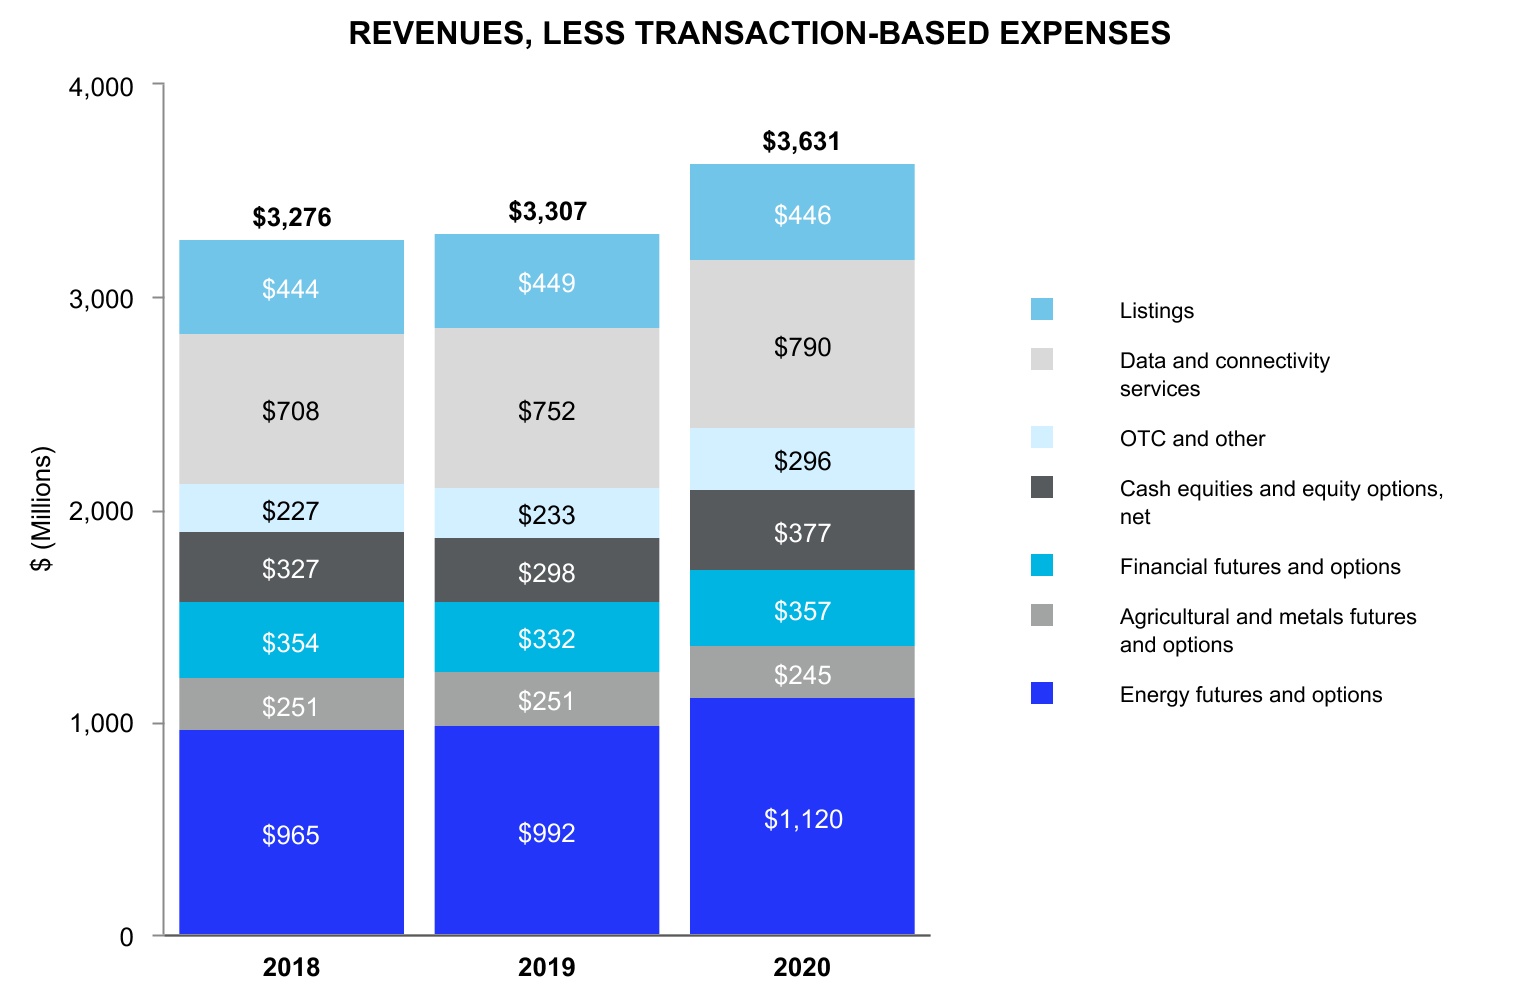
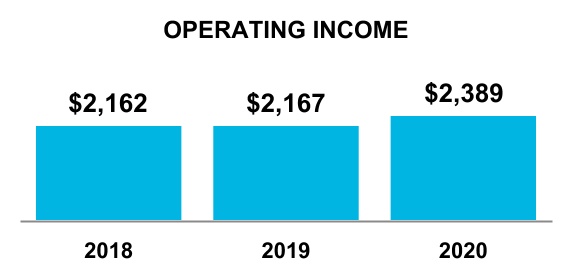
The following presents selected statements of income data for our Exchanges segment (dollars in millions):

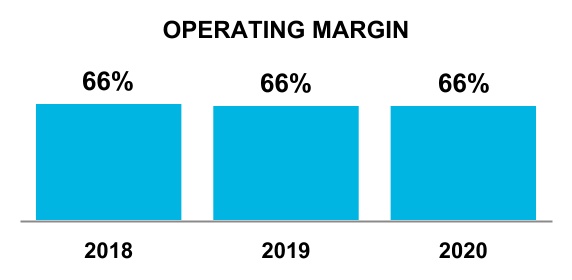
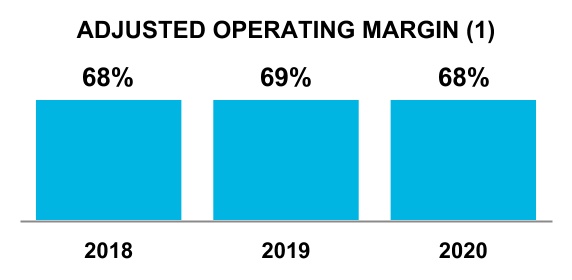
(1) The adjusted numbers in the charts above are calculated by excluding items that are not reflective of our cash operations and core business performance. As a result, these adjusted numbers are not calculated in accordance with U.S. GAAP. See “- Non-GAAP Financial Measures” below.
| Year Ended December 31, | Year Ended December 31, | ||||||||||||||||||||||||||||||||||||||||
| 2020 | 2019 | Change | 2019 | 2018 | Change | ||||||||||||||||||||||||||||||||||||
| Revenues: | |||||||||||||||||||||||||||||||||||||||||
| Energy futures and options | $ | 1,120 | $ | 992 | 13 | % | $ | 992 | $ | 965 | 3 | % | |||||||||||||||||||||||||||||
| Agricultural and metals futures and options | 245 | 251 | (2) | 251 | 251 | — | |||||||||||||||||||||||||||||||||||
| Financial futures and options | 357 | 332 | 8 | 332 | 354 | (6) | |||||||||||||||||||||||||||||||||||
| Futures and options | 1,722 | 1,575 | 9 | 1,575 | 1,570 | — | |||||||||||||||||||||||||||||||||||
| Cash equities and equity options | 2,585 | 1,643 | 57 | 1,643 | 1,624 | 1 | |||||||||||||||||||||||||||||||||||
| OTC and other | 296 | 233 | 27 | 233 | 227 | 2 | |||||||||||||||||||||||||||||||||||
| Transaction and clearing, net | 4,603 | 3,451 | 33 | 3,451 | 3,421 | 1 | |||||||||||||||||||||||||||||||||||
| Data and connectivity services | 790 | 752 | 5 | 752 | 708 | 6 | |||||||||||||||||||||||||||||||||||
| Listings | 446 | 449 | (1) | 449 | 444 | 1 | |||||||||||||||||||||||||||||||||||
| Revenues | 5,839 | 4,652 | 26 | 4,652 | 4,573 | 2 | |||||||||||||||||||||||||||||||||||
| Transaction-based expenses(1) | 2,208 | 1,345 | 64 | 1,345 | 1,297 | 4 | |||||||||||||||||||||||||||||||||||
| Revenues, less transaction-based expenses | 3,631 | 3,307 | 10 | 3,307 | 3,276 | 1 | |||||||||||||||||||||||||||||||||||
| Other operating expenses | 965 | 874 | 10 | 874 | 866 | 1 | |||||||||||||||||||||||||||||||||||
| Depreciation and amortization | 261 | 265 | (2) | 265 | 246 | 8 | |||||||||||||||||||||||||||||||||||
| Acquisition-related transaction and integration costs | 16 | 1 | n/a | 1 | 2 | (64) | |||||||||||||||||||||||||||||||||||
| Operating expenses | 1,242 | 1,140 | 9 | 1,140 | 1,114 | 3 | |||||||||||||||||||||||||||||||||||
| Operating income | $ | 2,389 | $ | 2,167 | 10 | % | $ | 2,167 | $ | 2,162 | — | % |
(1)Transaction-based expenses are largely attributable to our cash equities and options business.
Exchanges Revenues
Our Exchanges segment includes transaction and clearing revenues from our futures and NYSE exchanges as well as data and connectivity services and listings. Transaction and clearing revenues consist of fees collected from derivatives, cash equities and equity options trading and derivatives clearing, and are reported on a net basis, except for the NYSE transaction-based expenses discussed below. Rates per-contract, or RPC, are driven by the number of contracts or securities traded and the fees charged per contract, net of certain rebates. Our per-contract transaction and clearing revenues will depend upon many factors, including, but not limited to, market conditions, transaction and clearing volume, product mix, pricing, applicable revenue sharing and market making agreements, and new product introductions. Because transaction and clearing revenues are generally assessed on a per-contract basis, revenues and profitability fluctuate with changes in contract volume and product mix. Our data and connectivity services revenues are recurring subscription fees related to the various data and connectivity services that we provide which are directly attributable to our exchange venues. Our listings revenues are also recurring subscription fees that we earn for the provision of NYSE listings services for public companies and ETFs, and related corporate actions for listed companies.
In both 2020 and 2019, 14% of our Exchanges segment revenues, less transaction-based expenses, were billed in pounds sterling or euros. Due to the fluctuations of the pound sterling and euro compared to the U.S. dollar, our Exchanges segment revenues, less transaction-based expenses, were higher by $4 million in 2020 from 2019.
Our exchange transaction and clearing revenues are presented net of rebates. We recorded rebates of $962 million and $855 million in 2020 and 2019, respectively. We offer rebates in certain of our markets primarily to support market liquidity and trading volume by providing qualified participants in those markets a discount to the applicable commission rate. Such rebates are calculated based on volumes traded. The increase in the rebates is due primarily to increased volumes in products with higher rates per contract, an increase in the number of rebate programs offered and an increase in the number of participants within our energy futures and options programs.
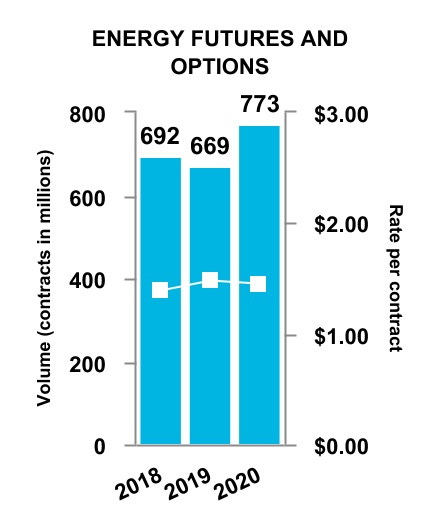
- Energy Futures and Options: Total energy volume increased 15% and revenues increased 13% in 2020 from 2019.
–Total oil volume increased 13% in 2020 from 2019 due to increased risk management activity driven by shifting supply/demand dynamics related to various geopolitical events and the emergence of COVID-19.
–Our global natural gas futures and options volume increased 22% in 2020 from 2019. The volume increase in our North American natural gas products was primarily driven by shifting supply/demand dynamics related to lower levels of U.S. shale production and increased demand for natural gas. In addition, the strength in our European TTF gas volumes was driven by the continued emergence of TTF as not only the European benchmark, but also the emerging global benchmark, for natural gas as the commodity continues to globalize.
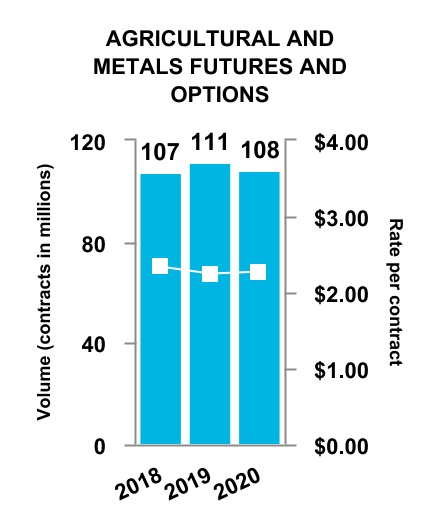
- Agricultural and Metals Futures and Options: Total volume in our agricultural and metals futures and options markets decreased 3% and revenues decreased 2% in 2020 from 2019. The overall decrease in agricultural volumes was primarily driven by lower commodity price volatility than the prior year.
–Sugar futures and options volumes increased 6% in 2020 from 2019, driven by shifting supply/demand dynamics coupled with increased price volatility.
–Other agricultural and metal futures and options volume decreased 9% in 2020 from 2019, primarily due to lower cocoa volumes driven by geopolitical uncertainty.
- Financial Futures and Options: Total volume decreased 2% and revenues increased 8% in our financial futures and options markets in 2020 from 2019.
–Interest rate futures and options volume and revenue decreased 5% and 1% in 2020 from 2019, respectively, due to the impact of quantitative easing measures implemented by major central banks in response to COVID-19. Interest rate futures and options revenues were $193 million and $196 million in 2020 and 2019, respectively.
–Other financial futures and options volume, which includes our MSCI®, FTSE® and NYSE FANG+ equity index products, increased 12% and revenue increased 20% in 2020 from 2019. Other financial futures and options volume increased due to increased equity market volatility driven by accelerating adoption of MSCI® index futures and options as well as uncertainty related to COVID-19. Other financial futures and options revenues were $164 million and $136 million in 2020 and 2019, respectively.
-
Cash Equities and Equity Options: Cash equities volume increased 42% in 2020 from 2019 due to heightened volatility driven by uncertainty related to COVID-19 and various geopolitical events. Cash equities revenues, net of transaction-based expenses, were $276 million and $203 million in 2020 and 2019, respectively. Equity options volume increased 61% in 2020 from 2019 primarily due to higher industry volumes and heightened volatility driven by uncertainty related to COVID-19 and various geopolitical events. Equity options revenues, net of transaction-based expenses, were $101 million and $95 million in 2020 and 2019, respectively.
-
OTC and Other: OTC and other transactions include revenues from our OTC energy business and other trade confirmation services, as well as interest income on certain clearing margin deposits, regulatory penalties and fines, fees for use of our facilities, regulatory fees charged to member organizations of our U.S. securities exchanges, designated market maker service fees, exchange membership fees and agricultural grading and certification fees. Our OTC and other transaction revenues increased 27% in 2020 from 2019 primarily due to increased income earned on certain clearing margin deposits reflecting higher balances and increased regulatory fees.
-
Data and Connectivity Services:** Our data and connectivity services revenues increased 5% in 2020 from 2019. The increase in revenue was driven by the strong retention rate of existing customers, the addition of new customers and increased purchases by existing customers.
-
Listings Revenues:** Through NYSE, NYSE American and NYSE Arca, we generate listings revenue related to the provision of listings services for public companies and ETFs, and related corporate actions for listed companies. Listings revenues decreased 1% in 2020 from 2019, driven by market volatility causing IPO delays as well as de-listings, partially offset by a rebound in IPO activity towards the end of 2020.
Listings revenues in our securities markets arise from fees applicable to companies listed on our cash equities exchanges– original listing fees and annual listing fees. Original listing fees consist of two components: initial listing fees and fees related to corporate actions. Initial listing fees, subject to a minimum and maximum amount, are based on the number of shares that a company initially lists. All listings fees are billed upfront and the identified performance obligations are satisfied over time. Revenue related to the investor relations performance obligation is recognized ratably over the period these services are provided, with the remaining revenue recognized ratably over time as customers continue to list on our exchanges.
In addition, we earn corporate actions-related listing fees in connection with actions involving the issuance of new shares, such as stock splits, rights issues and sales of additional securities, as well as mergers and acquisitions. Listings fees related to other corporate actions are considered contract modifications of our listing contracts and are recognized ratably over time as customers continue to list on our exchanges.
In 2020, NYSE and NYSE American raised the most capital globally with approximately $185 billion raised in IPOs and follow-on offerings from over 435 transactions, an increase of 65% from $112 billion raised in 2019.
Selected Operating Data
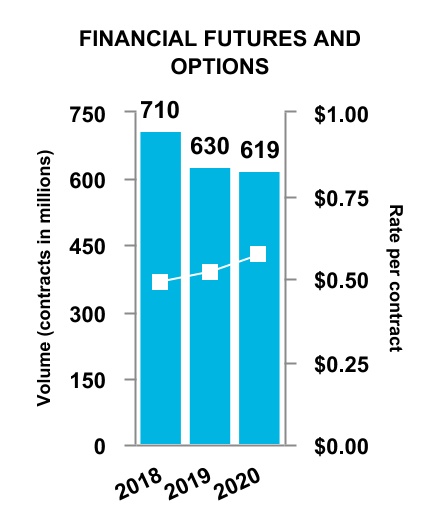
The following charts and tables present trading activity in our futures and options markets by commodity type based on the total number of contracts traded, as well as futures and options rate per contract (in millions, except for percentages and rate per contract amounts):
| Volume and Rate per Contract |
| Year Ended December 31, | Year Ended December 31, | ||||||||||||||||||||||||||||||||||
| 2020 | 2019 | Change | 2019 | 2018 | Change | ||||||||||||||||||||||||||||||
| Number of contracts traded (in millions): | |||||||||||||||||||||||||||||||||||
| Energy futures and options | 773 | 669 | 15 | % | 669 | 692 | (3) | % | |||||||||||||||||||||||||||
| Agricultural and metals futures and options | 108 | 111 | (3) | % | 111 | 107 | 4 | % | |||||||||||||||||||||||||||
| Financial futures and options | 619 | 630 | (2) | % | 630 | 710 | (11) | % | |||||||||||||||||||||||||||
| Total | 1,500 | 1,410 | 6 | % | 1,410 | 1,509 | (7) | % | |||||||||||||||||||||||||||
| Year Ended December 31, | Year Ended December 31, | ||||||||||||||||||||||||||||||||||
| 2020 | 2019 | Change | 2019 | 2018 | Change | ||||||||||||||||||||||||||||||
| Average Daily Volume of contracts traded (in thousands): | |||||||||||||||||||||||||||||||||||
| Energy futures and options | 3,054 | 2,655 | 15 | % | 2,655 | 2,747 | (3) | % | |||||||||||||||||||||||||||
| Agricultural and metals futures and options | 428 | 442 | (3) | % | 442 | 427 | 4 | % | |||||||||||||||||||||||||||
| Financial futures and options | 2,409 | 2,460 | (2) | % | 2,460 | 2,770 | (11) | % | |||||||||||||||||||||||||||
| Total | 5,891 | 5,557 | 6 | % | 5,557 | 5,944 | (7) | % | |||||||||||||||||||||||||||
| Year Ended December 31, | Year Ended December 31, | ||||||||||||||||||||||||||||||||||
| Rate per contract: | 2020 | 2019 | Change | 2019 | 2018 | Change | |||||||||||||||||||||||||||||
| Energy futures and options | $ | 1.45 | $ | 1.48 | (2) | % | $ | 1.48 | $ | 1.39 | 6 | % | |||||||||||||||||||||||
| Agricultural and metals futures and options | $ | 2.27 | $ | 2.25 | 1 | % | $ | 2.25 | $ | 2.34 | (4) | % | |||||||||||||||||||||||
| Financial futures and options | $ | 0.57 | $ | 0.52 | 10 | % | $ | 0.52 | $ | 0.49 | 6 | % |
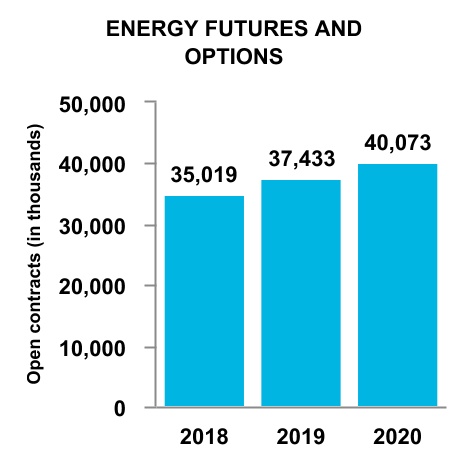
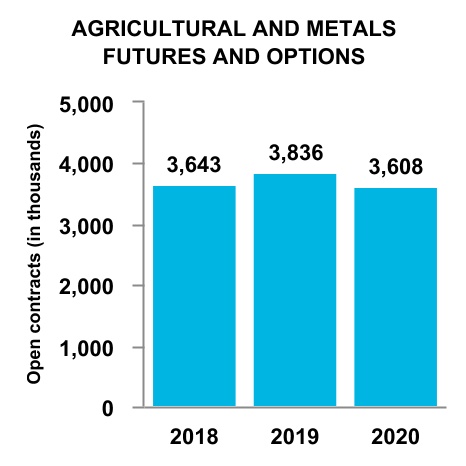
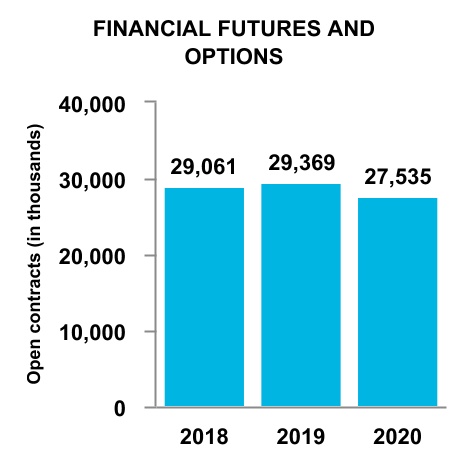
Open interest is the aggregate number of contracts (long or short) that clearing members hold either for their own account or on behalf of their clients. Open interest refers to the total number of contracts that are currently “open,” – in other words, contracts that have been entered into but not yet liquidated by either an offsetting trade, exercise, expiration or assignment. Open interest is also a measure of the future activity remaining to be closed out in terms of the number of contracts that members and their clients continue to hold in the particular contract and by the number of contracts held for each contract month listed by the exchange. The following charts and table present our year-end open interest for our futures and options contracts (in thousands, except for percentages):
| As of December 31, | As of December 31, | ||||||||||||||||||||||||||||||||||
| 2020 | 2019 | Change | 2019 | 2018 | Change | ||||||||||||||||||||||||||||||
| Open interest — in thousands of contracts: | |||||||||||||||||||||||||||||||||||
| Energy futures and options | 40,073 | 37,433 | 7 | % | 37,433 | 35,019 | 7 | % | |||||||||||||||||||||||||||
| Agricultural and metals futures and options | 3,608 | 3,836 | (6) | % | 3,836 | 3,643 | 5 | % | |||||||||||||||||||||||||||
| Financial futures and options | 27,535 | 29,369 | (6) | % | 29,369 | 29,061 | 1 | % | |||||||||||||||||||||||||||
| Total | 71,216 | 70,638 | 1 | % | 70,638 | 67,723 | 4 | % |
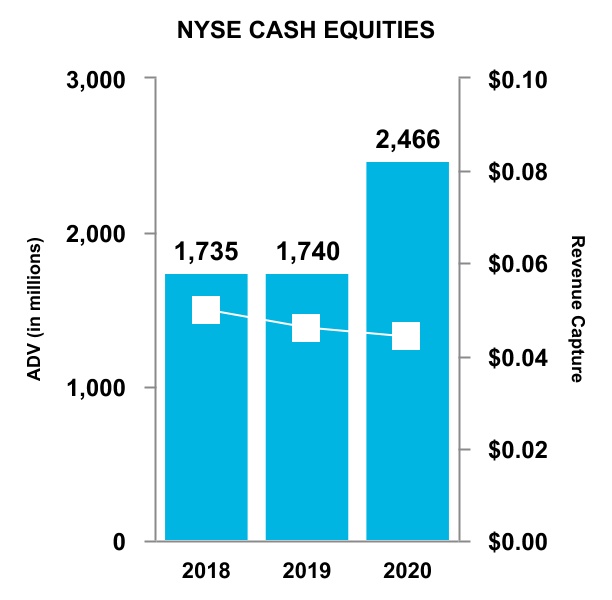
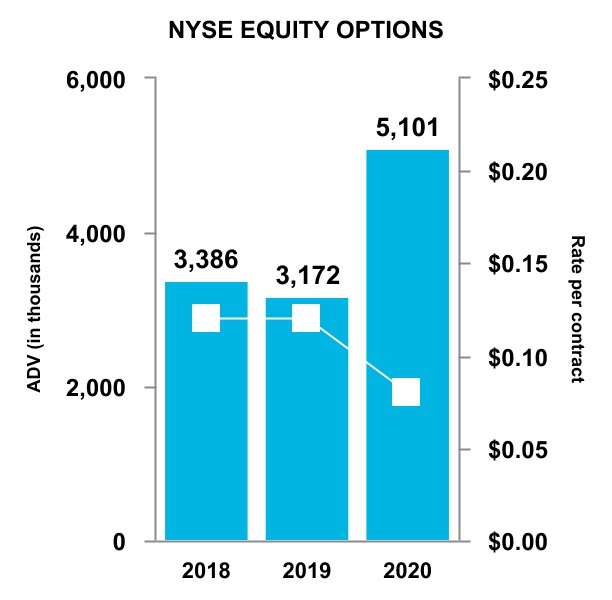
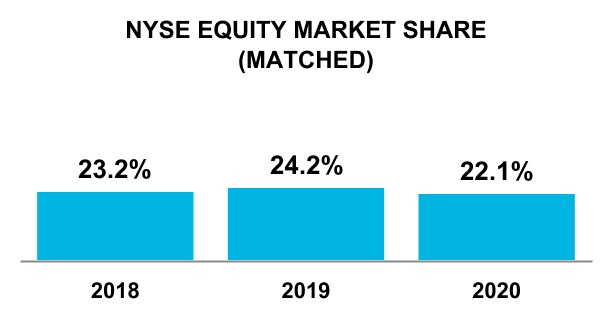
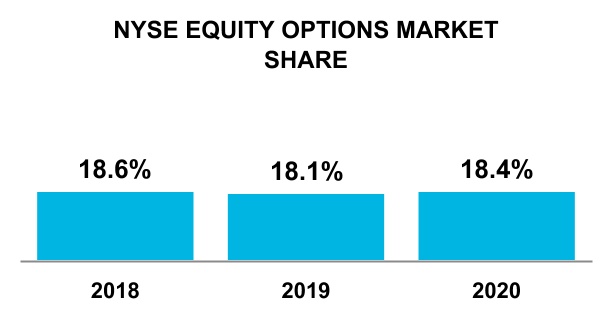
The following charts and tables present selected cash and equity options trading data. All trading volume below is presented as average net daily trading volume, or ADV, and is single counted:
| Year Ended December 31, | Year Ended December 31, | ||||||||||||||||||||||||||||||||||
| 2020 | 2019 | Change | 2019 | 2018 | Change | ||||||||||||||||||||||||||||||
| NYSE cash equities (shares in millions): | |||||||||||||||||||||||||||||||||||
| Total cash handled volume | 2,466 | 1,740 | 42 | % | 1,740 | 1,735 | — | % | |||||||||||||||||||||||||||
| Total cash market share matched | 22.1 | % | 24.2 | % | (2.1) pts | 24.2 | % | 23.2 | % | 1.0 pts | |||||||||||||||||||||||||
| NYSE equity options (contracts in thousands): | |||||||||||||||||||||||||||||||||||
| NYSE equity options volume | 5,101 | 3,172 | 61 | % | 3,172 | 3,386 | (6) | % | |||||||||||||||||||||||||||
| Total equity options volume | 27,685 | 17,542 | 58 | % | 17,542 | 18,217 | (4) | % | |||||||||||||||||||||||||||
| NYSE share of total equity options | 18.4 | % | 18.1 | % | 0.3 pts | 18.1 | % | 18.6 | % | (0.5) pts | |||||||||||||||||||||||||
| Revenue capture or rate per contract: | |||||||||||||||||||||||||||||||||||
| Cash equities rate per contract (per 100 shares) | $0.044 | $0.046 | (4) | % | $0.046 | $0.050 | (8) | % | |||||||||||||||||||||||||||
| Equity options rate per contract | $0.08 | $0.12 | (34) | % | $0.12 | $0.12 | (5) | % |
Handled volume represents the total number of shares of equity securities, ETFs and crossing session activity internally matched on our exchanges or routed to and executed on an external market center. Matched volume represents the total number of shares of equity securities, ETFs and crossing session activity executed on our exchanges.
Transaction-Based Expenses
Our equities and equity options markets pay fees to the SEC pursuant to Section 31 of the Exchange Act. Section 31 fees are recorded on a gross basis as a component of transaction and clearing fee revenue. These Section 31 fees are assessed to recover the government’s costs of supervising and regulating the securities markets and professionals and are subject to change. We, in turn, collect corresponding activity assessment fees from member organizations clearing or settling trades on the equities and options exchanges, and recognize these amounts in our transaction and clearing revenues when invoiced. The activity assessment fees are designed to equal the Section 31 fees. As a result, activity assessment fees and the corresponding Section 31 fees do not have an impact on our net income, although the timing of
payment by us will vary from collections. Section 31 fees were $622 million and $379 million in 2020 and 2019, respectively. The fees we collect are included in cash at the time of receipt and we remit the amounts to the SEC semi-annually as required. The total amount is included in accrued liabilities and was $207 million as of December 31, 2020.
We make liquidity payments to cash and options trading customers, as well as routing charges made to other exchanges which are included in transaction-based expenses. We incur routing charges when we do not have the best bid or offer in the market for a security that a customer is trying to buy or sell on one of our securities exchanges. In that case, we route the customer’s order to the external market center that displays the best bid or offer. The external market center charges us a fee per share (denominated in tenths of a cent per share) for routing to its system. We record routing charges on a gross basis as a component of transaction and clearing fee revenue. Cash liquidity payments, routing and clearing fees were $1.6 billion and $966 million in 2020 and 2019, respectively.
Operating Expenses, Operating Income and Operating Margin
The following chart summarizes our Exchanges segment's operating expenses, operating income and operating margin (dollars in millions). See “- Consolidated Operating Expenses” below for a discussion of the significant changes in our operating expenses.
| Exchanges Segment: | Year Ended December 31, | Year Ended December 31, | |||||||||||||||||||||||||||||||||||||||
| 2020 | 2019 | Change | 2019 | 2018 | Change | ||||||||||||||||||||||||||||||||||||
| Operating expenses | $ | 1,242 | $ | 1,140 | 9 | % | $ | 1,140 | $ | 1,114 | 3 | % | |||||||||||||||||||||||||||||
| Adjusted operating expenses(1) | $ | 1,145 | $ | 1,041 | 10 | % | $ | 1,041 | $ | 1,035 | 1 | % | |||||||||||||||||||||||||||||
| Operating income | $ | 2,389 | $ | 2,167 | 10 | % | $ | 2,167 | $ | 2,162 | — | % | |||||||||||||||||||||||||||||
| Adjusted operating income(1) | $ | 2,486 | $ | 2,266 | 10 | % | $ | 2,266 | $ | 2,241 | 1 | % | |||||||||||||||||||||||||||||
| Operating margin | 66 | % | 66 | % | — | 66 | % | 66 | % | — | |||||||||||||||||||||||||||||||
| Adjusted operating margin(1) | 68 | % | 69 | % | (1 pt) | 69 | % | 68 | % | 1 pt |
(1) The adjusted figures exclude items that are not reflective of our ongoing core operations and business performance. These adjusted numbers are not calculated in accordance with GAAP. See “- Non-GAAP Financial Measures” below.
Fixed Income and Data Services Segment
The following charts and table present our selected statements of income data for our Fixed Income and Data Services segment (dollars in millions):
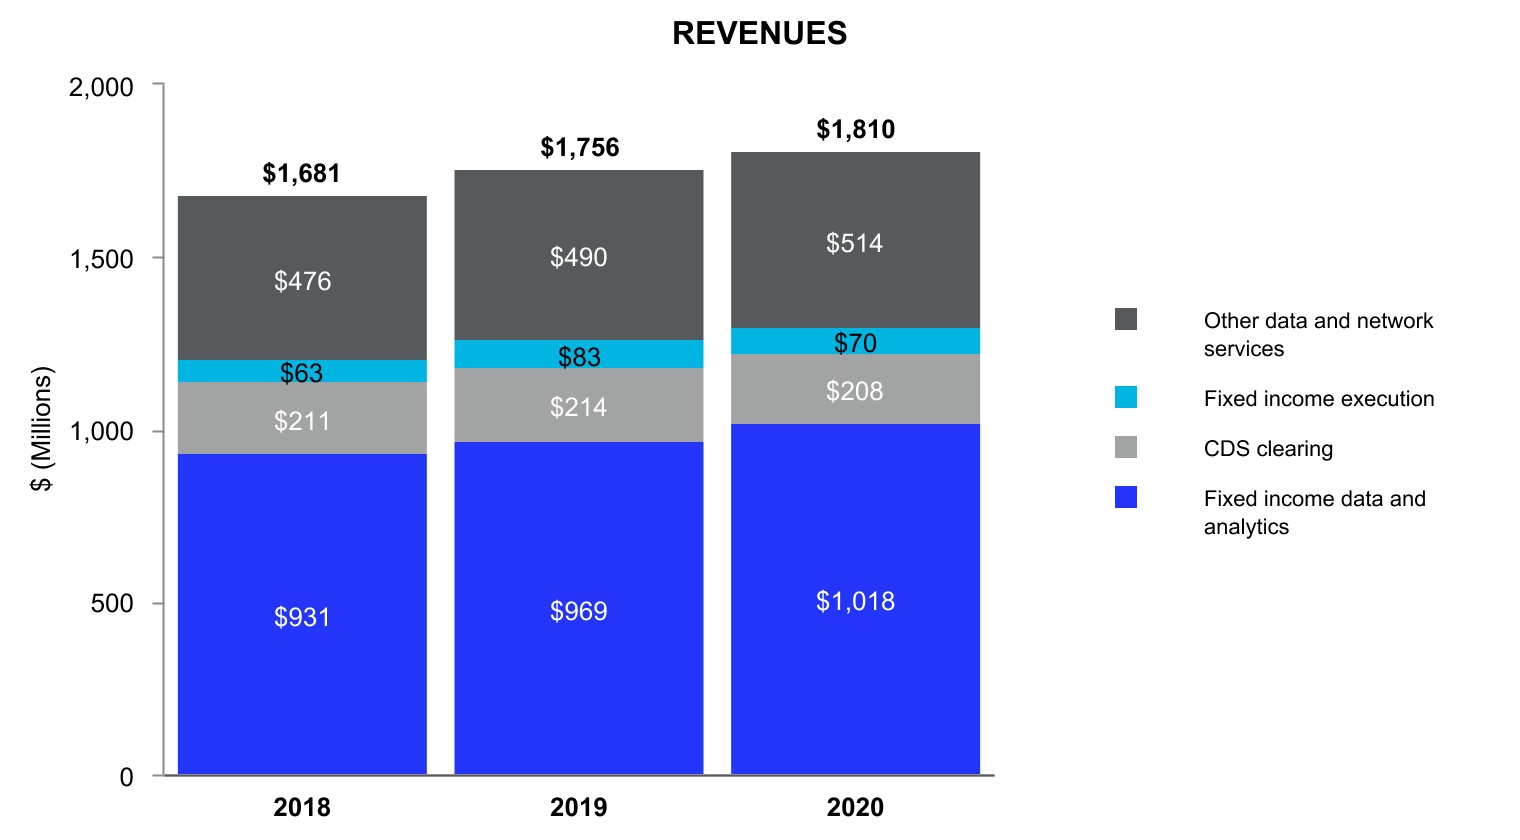
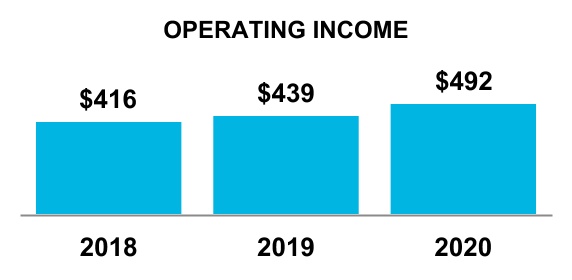
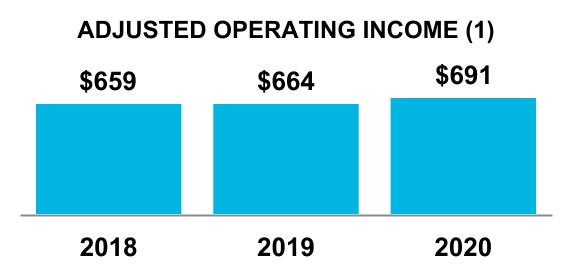
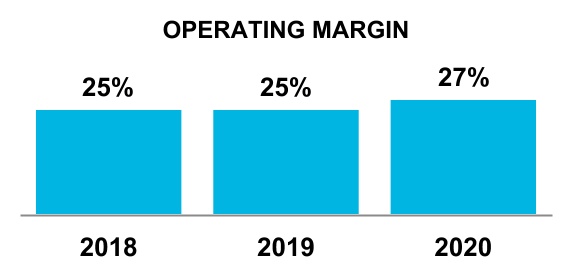
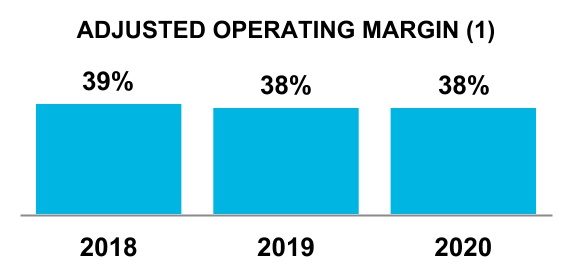
(1) The adjusted numbers in the charts above are calculated by excluding items that are not reflective of our cash operations and core business performance. As a result, these adjusted numbers are not calculated in accordance with U.S. GAAP. See “- Non-GAAP Financial Measures” below.
| Year Ended December 31, | Year Ended December 31, | |||||||||||||||||||||||||||||||||||||||||||
| 2020 | 2019 | Change | 2019 | 2018 | Change | |||||||||||||||||||||||||||||||||||||||
| Revenues: | ||||||||||||||||||||||||||||||||||||||||||||
| Fixed income execution | $ | 70 | $ | 83 | (15) | % | $ | 83 | $ | 63 | 30 | % | ||||||||||||||||||||||||||||||||
| CDS clearing | 208 | 214 | (2) | 214 | 211 | 2 | ||||||||||||||||||||||||||||||||||||||
| Fixed income data and analytics | 1,018 | 969 | 5 | 969 | 931 | 4 | ||||||||||||||||||||||||||||||||||||||
| Fixed income and credit | 1,296 | 1,266 | 3 | 1,266 | 1,205 | 5 | ||||||||||||||||||||||||||||||||||||||
| Other data and network services | 514 | 490 | 5 | 490 | 476 | 3 | ||||||||||||||||||||||||||||||||||||||
| Revenues | 1,810 | 1,756 | 3 | 1,756 | 1,681 | 4 | ||||||||||||||||||||||||||||||||||||||
| Other operating expenses | 967 | 939 | 3 | 939 | 896 | 5 | ||||||||||||||||||||||||||||||||||||||
| Acquisition-related transaction and integration costs | — | — | (10) | — | 32 | n/a | ||||||||||||||||||||||||||||||||||||||
| Depreciation and amortization | 351 | 378 | (7) | 378 | 337 | 12 | ||||||||||||||||||||||||||||||||||||||
| Operating expenses | 1,318 | 1,317 | — | 1,317 | 1,265 | 4 | ||||||||||||||||||||||||||||||||||||||
| Operating income | $ | 492 | $ | 439 | 12 | % | $ | 439 | $ | 416 | 6 | % |
Our Fixed Income and Data Services segment represents fixed income and credit trading and clearing as well as subscription-based, or recurring, revenues related to our fixed income data and analytics offerings as well as other multi-asset class data and network services.
In 2020 and 2019, 14% and 13%, respectively, of our Fixed Income and Data Services segment revenues were billed in pounds sterling or euros. As the pound sterling or euro exchange rate changes, the U.S. equivalent of revenues denominated in foreign currencies changes accordingly. Due to the fluctuations of the pound sterling and euro compared to the U.S. dollar during 2020, our fixed income and data services revenues were higher by $3 million in 2020 than in 2019.
Fixed Income and Data Services Revenues
Our fixed income and data services revenues increased 3% in 2020 from 2019 primarily due to growth in our fixed income data and analytics products, our other data and network services and strong cleared volumes within our CDS clearing business.
-
Fixed Income Execution: Fixed income execution includes revenues from ICE Bonds. Execution fees are reported net of rebates, which were nominal in 2020, 2019 and 2018. Our fixed income execution revenues decreased 15% in 2020 from 2019. The decrease in revenue was driven by decreased retail activity as a result of low interest rates, particularly municipal and corporate bond activity.
-
CDS Clearing:** CDS clearing revenues decreased 2% in 2020 from 2019. The notional value of CDS cleared was $17.9 trillion and $14.7 trillion in 2020 and 2019, respectively. Despite record clearing activity in 2020 from both dealers and clients driven by heightened market volatility, revenue decreased as a result of lower interest earned on collateral balances held at the clearing house due to lower 2020 Fed Funds rates.
-
Fixed Income Data and Analytics:** Our fixed income data and analytics revenues increased 5% in 2020 from 2019. The increase in revenue was due to strength in our index business and continued growth in our pricing and reference data business driven by the strong retention rate of existing customers, the addition of new customers, increased purchases by existing customers and increases in pricing of our products.
-
Other Data and Network Services:** Our other data and network services revenues increased 5% in 2020 from 2019. The increase in revenues was driven primarily through growth in our ICE Global Network offering, coupled with strength in our consolidated feeds and stronger desktop revenues.
Annual Subscription Value, or ASV, represents, at a point in time, the data services revenues, which includes Fixed Income Data and Analytics as well as Other Data and Network Services, subscribed for the succeeding 12 months. ASV does not include new sales, contract terminations or price changes that may occur during that 12-month period. However, while it is an indicative forward-looking metric, it does not provide a growth forecast of the next 12 months of data services revenues.
As of December 31, 2020, ASV was $1.569 billion, which increased 6.4% compared to the ASV as of December 31, 2019. ASV represents nearly 100% of total data services revenues for this segment. This does not adjust for year-over-year foreign exchange fluctuations or impacts of acquisitions.
Operating Expenses, Operating Income and Operating Margin
The following chart summarizes our Fixed Income and Data Services segment's operating expenses, operating income and operating margin (dollars in millions). See “- Consolidated Operating Expenses” below for a discussion of the significant changes in our operating expenses.
| Fixed Income and Data Services Segment: | Year Ended December 31, | Year Ended December 31, | |||||||||||||||||||||||||||||||||||||||
| 2020 | 2019 | Change | 2019 | 2018 | Change | ||||||||||||||||||||||||||||||||||||
| Operating expenses | $ | 1,318 | $ | 1,317 | — | % | $ | 1,317 | $ | 1,265 | 4 | % | |||||||||||||||||||||||||||||
| Adjusted operating expenses(1) | $ | 1,119 | $ | 1,092 | 3 | % | $ | 1,092 | $ | 1,022 | 7 | % | |||||||||||||||||||||||||||||
| Operating income | $ | 492 | $ | 439 | 12 | % | $ | 439 | $ | 416 | 6 | % | |||||||||||||||||||||||||||||
| Adjusted operating income(1) | $ | 691 | $ | 664 | 4 | % | $ | 664 | $ | 659 | 1 | % | |||||||||||||||||||||||||||||
| Operating margin | 27 | % | 25 | % | 2 pts | 25 | % | 25 | % | — | |||||||||||||||||||||||||||||||
| Adjusted operating margin(1) | 38 | % | 38 | % | — | 38 | % | 39 | % | (1 pt) |
(1) The adjusted figures exclude items that are not reflective of our ongoing core operations and business performance. These adjusted numbers are not calculated in accordance with GAAP. See “- Non-GAAP Financial Measures” below.
Mortgage Technology Segment
The following charts and table present our selected statements of income data for our Mortgage Technology segment (dollars in millions):

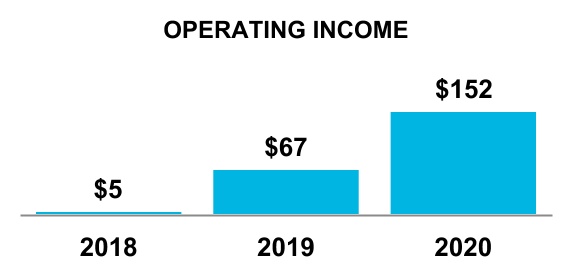

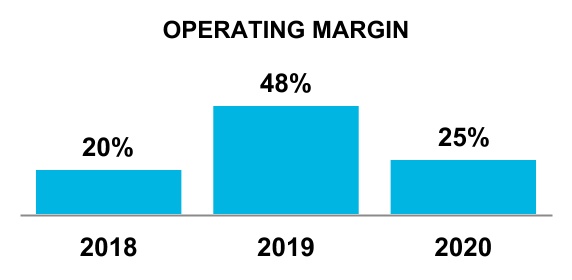

(1) The adjusted numbers in the charts above are calculated by excluding items that are not reflective of our cash operations and core business performance. As a result, these adjusted numbers are not calculated in accordance with U.S. GAAP. See “- Non-GAAP Financial Measures” below.
| Year Ended December 31, | Year Ended December 31, | ||||||||||||||||||||||||||||||||||||||||||||||
| 2020 | 2019 | Change | 2019 | 2018 | Change | ||||||||||||||||||||||||||||||||||||||||||
| Revenues: | |||||||||||||||||||||||||||||||||||||||||||||||
| Origination technology | 253 | — | n/a | — | — | — | |||||||||||||||||||||||||||||||||||||||||
| Network and closing solutions | 158 | 36 | 331 | 36 | — | n/a | |||||||||||||||||||||||||||||||||||||||||
| Data and analytics | 22 | — | n/a | — | — | — | |||||||||||||||||||||||||||||||||||||||||
| Registrations and other | 162 | 103 | 56 | 103 | 22 | 372 | |||||||||||||||||||||||||||||||||||||||||
| Revenues | 595 | 139 | 324 | 139 | 22 | 537 | |||||||||||||||||||||||||||||||||||||||||
| Other operating expenses | 215 | 52 | 310 | 52 | 14 | 301 | |||||||||||||||||||||||||||||||||||||||||
| Acquisition-related transaction and integration costs | 89 | 1 | n/a | 1 | — | n/a | |||||||||||||||||||||||||||||||||||||||||
| Depreciation and amortization | 139 | 19 | 626 | 19 | 3 | 343 | |||||||||||||||||||||||||||||||||||||||||
| Operating expenses | 443 | 72 | 510 | 72 | 17 | 313 | |||||||||||||||||||||||||||||||||||||||||
| Operating income | $ | 152 | $ | 67 | 124 | % | $ | 67 | $ | 5 | 1,427 | % |
Mortgage Technology Revenues
Our mortgage technology revenues are derived from our comprehensive, end-to-end U.S. residential mortgage platform. Our mortgage technology business enables greater workflow efficiency for customers focused on originating U.S. residential mortgage loans. Mortgage technology revenues increased $456 million or 324% in 2020 from 2019. Revenues from Ellie Mae following our September 2020 acquisition were $351 million and revenues from Simplifile following our June 2019 acquisition were $95 million and $37 million in 2020 and 2019, respectively.
-
Origination technology:** Our origination technology acts as a system of record for the mortgage transaction, automating the gathering, reviewing, and verifying of mortgage-related information and enabling automated enforcement of rules and business practices designed to help ensure that each completed loan transaction is of high quality and adheres to secondary market standards. Revenue from origination technology is based on recurring SaaS subscription fees, with an additive Success-Based Pricing fee as lenders exceed the number of loans closed that are included with their monthly base subscription.
-
Network and closing solutions:** Our network and closing solutions provide customers connectivity to the mortgage supply chain and facilitates the secure exchange of information between our customers and a broad ecosystem of third-party service providers, as well as lenders and investors that are critical to consummating the millions of loan transactions that occur on our origination network each year. Our closing network uniquely connects key participants, such as lenders, title and settlement agents and individual county recorders, to digitize the traditionally manual and paper-based closing and recording process. Revenues from network and closing solutions are based largely on the number of applications and closed loans that utilize the various services.
-
Data and Analytics**: Revenues include those related to ICE Mortgage Technology’s AIQ offering, which applies machine learning and artificial intelligence, or AI, to the entire loan origination process, offering customers greater efficiency by streamlining data collection and validation through our automated document recognition and data extraction capabilities. AIQ revenues can be both recurring and transaction-based in nature. In addition, our data offerings include real-time industry and peer benchmarking tools, which provide originators a granular view into the real-time trends of nearly half the U.S. residential mortgage market. We also provide a Data as a Service (DaaS) offering through private data clouds for lenders to access their own data and origination information. Revenues related to our data products are largely subscription-based and recurring in nature.
-
Registrations and other:** Revenues are related to the MERS database, a leading system of record for recording and tracking changes in mortgage servicing rights and beneficial ownership interests in loans secured by U.S. residential real estate; these revenues are transaction-based. Other revenues include professional services fees, as well as revenues from ancillary products.
The following chart summarizes our Mortgage Technology segment's operating expenses, operating income and operating margin (dollars in millions). See “- Consolidated Operating Expenses” below for a discussion of the significant changes in our operating expenses.
| Mortgage Technology Segment: | Year Ended December 31, | Year Ended December 31, | |||||||||||||||||||||||||||||||||||||||
| 2020 | 2019 | Change | 2019 | 2018 | Change | ||||||||||||||||||||||||||||||||||||
| Operating expenses | $ | 443 | $ | 72 | 510 | % | $ | 72 | $ | 17 | 313 | % | |||||||||||||||||||||||||||||
| Adjusted operating expenses(1) | $ | 231 | $ | 56 | 306 | % | $ | 56 | $ | 14 | 291 | % | |||||||||||||||||||||||||||||
| Operating income | $ | 152 | $ | 67 | 124 | % | $ | 67 | $ | 5 | 1,427 | % | |||||||||||||||||||||||||||||
| Adjusted operating income(1) | $ | 364 | $ | 83 | 337 | % | $ | 83 | $ | 8 | 1,024 | % | |||||||||||||||||||||||||||||
| Operating margin | 25 | % | 48 | % | (23 pts) | 48 | % | 20 | % | 28 pts | |||||||||||||||||||||||||||||||
| Adjusted operating margin(1) | 61 | % | 59 | % | 2 pts | 59 | % | 34 | % | 25 pts | |||||||||||||||||||||||||||||||
(1) The adjusted figures exclude items that are not reflective of our ongoing core operations and business performance. These adjusted numbers are not calculated in accordance with GAAP. See “- Non-GAAP Financial Measures”
Consolidated Operating Expenses
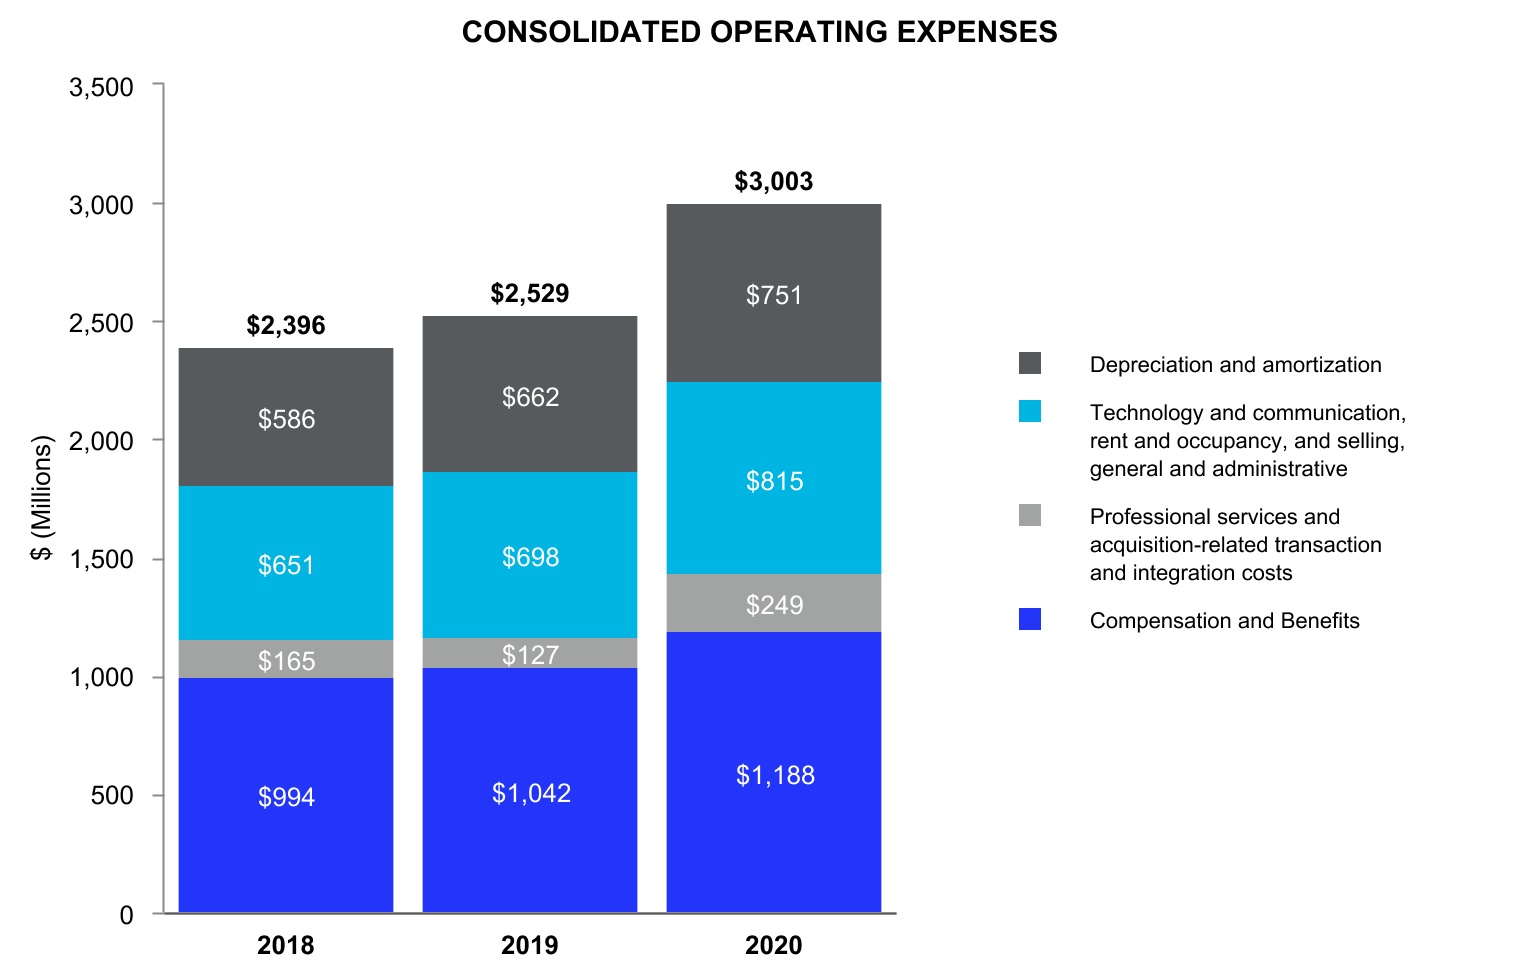
The following presents our consolidated operating expenses (dollars in millions):
| Year Ended December 31, | Year Ended December 31, | |||||||||||||||||||||||||||||||||||||
| 2020 | 2019 | Change | 2019 | 2018 | Change | |||||||||||||||||||||||||||||||||
| Compensation and benefits | $ | 1,188 | $ | 1,042 | 14 | % | $ | 1,042 | $ | 994 | 5 | % | ||||||||||||||||||||||||||
| Professional services | 144 | 125 | 15 | 125 | 131 | (5) | ||||||||||||||||||||||||||||||||
| Acquisition-related transaction and integration costs | 105 | 2 | n/a | 2 | 34 | (94) | ||||||||||||||||||||||||||||||||
| Technology and communication | 549 | 469 | 17 | 469 | 432 | 8 | ||||||||||||||||||||||||||||||||
| Rent and occupancy | 81 | 68 | 19 | 68 | 68 | 1 | ||||||||||||||||||||||||||||||||
| Selling, general and administrative | 185 | 161 | 15 | 161 | 151 | 7 | ||||||||||||||||||||||||||||||||
| Depreciation and amortization | 751 | 662 | 13 | 662 | 586 | 13 | ||||||||||||||||||||||||||||||||
| Total operating expenses | $ | 3,003 | $ | 2,529 | 19 | % | $ | 2,529 | $ | 2,396 | 6 | % |
The majority of our operating expenses do not vary directly with changes in our volume and revenues, except for certain technology and communication expenses, including data acquisition costs, licensing and other fee-related arrangements and a portion of our compensation expense that is tied directly to our data sales or overall financial performance.
We expect our operating expenses to increase in absolute terms in future periods in connection with the growth of our business, and to vary from year-to-year based on the type and level of our acquisitions, our integrations and other investments.
In 2020 and 2019, 11% and 12%, respectively, of our operating expenses were incurred in pounds sterling or euros. Due to fluctuations in the U.S. dollar compared to the pound sterling and euro, our consolidated operating expenses were $2 million higher in 2020 than in 2019. See Item 7(A) “- Quantitative and Qualitative Disclosures About Market Risk - Foreign Currency Exchange Rate Risk” below for additional information.
Compensation and Benefits Expenses
Compensation and benefits expense is our most significant operating expense and includes non-capitalized employee wages, bonuses, non-cash or stock compensation, certain severance costs, benefits and employer taxes. The bonus component of our compensation and benefits expense is based on both our financial performance and individual employee performance. The performance-based restricted stock compensation expense is also based on our financial performance. Therefore, our compensation and benefits expense will vary year-to-year based on our financial performance and fluctuations in our number of employees. The below chart summarizes the significant drivers of our compensation and benefits expense results for the periods presented (dollars in millions, except employee headcount).
| Year Ended December 31, | ||||||||||||||||||||
| 2020 | 2019 | Change | ||||||||||||||||||
| Employee headcount | 8,890 | 5,989 | 48 | % | ||||||||||||||||
| Stock-based compensation expenses | $ | 127 | $ | 139 | (9) | % |
Employee headcount increased in 2020 from 2019 primarily due to new employees at Ellie Mae and Bridge2 Solutions. These businesses, as well as additional expenses related to Simplifile and growth of our ICE India office, resulted in additional compensation and benefits expense of $113 million in 2020 from 2019. In addition, compensation and benefits expense increased $31 million in 2020 from 2019 as a result of other increases in employee headcount, 2020 merit pay and our 2020 adjustment of our employee cash bonus and non-cash performance-based restricted shares to above-target levels based on our 2020 financial performance metrics. Further, employee taxes and benefits expenses were higher in 2020 primarily due to increased employee insurance costs, partially offset by decreased employee severance expense in 2020 from 2019. The stock-based compensation expenses in the table above relate to employee stock option and restricted stock awards.
Professional Services Expenses
Professional services expense includes fees for consulting services received on strategic and technology initiatives, temporary labor, as well as regulatory, legal and accounting fees, and may fluctuate as a result of changes in our use of these services in our business.
Professional services expenses increased in 2020 from 2019 primarily due to increased costs associated with regulatory and litigation matters and $13 million in additional consulting expenses related to our acquisitions of Ellie Mae and Bridge2 Solutions.
Acquisition-Related Transaction and Integration Costs
In 2020, we incurred $105 million in acquisition-related transaction and integration costs, primarily related to our acquisitions of Ellie Mae and Bridge2 Solutions. The Bridge2 Solutions acquisition costs include $10 million of expenses resulting from a Bakkt incentive award market condition estimation adjustment that was directly related to the March 2020 capital call to fund the acquisition of Bridge2 Solutions.
We expect to continue to explore and pursue various potential acquisitions and other strategic opportunities to strengthen our competitive position and support our growth. As a result, we may incur acquisition-related transaction costs in future periods.
Technology and Communication Expenses
Technology support services consist of costs for running our wholly-owned data centers, hosting costs paid to third-party data centers, and maintenance of our computer hardware and software required to support our technology and cybersecurity. These costs are driven by system capacity, functionality and redundancy requirements. Communication expenses consist of costs for network connections for our electronic platforms and telecommunications costs.
Technology and communications expense also includes fees paid for access to external market data, licensing and other fee agreement expenses. Technology and communications expenses may be impacted by growth in electronic contract volume, our capacity requirements, changes in the number of telecommunications hubs and connections with customers to access our electronic platforms directly. Beginning in the second quarter of 2019, we have reflected amounts owed under certain third-party revenue share arrangements as technology and communication operating expenses rather than as had been previously recorded net within transaction and clearing revenues, which resulted in an increase in technology and communications expense of $14 million in 2020 from 2019.
Technology and communications expenses also increased by $21 million in 2020 from 2019, due to increased third-party revenue share fees. In addition, technology and communications expenses increased by $43 million in 2020 from 2019 due to our acquisitions of Ellie Mae and Bridge2 Solutions in 2020 and Simplifile in 2019, partially offset by lower data services costs.
Rent and Occupancy Expenses
Rent and occupancy expense relates to leased and owned property and includes rent, maintenance, real estate taxes, utilities and other related costs. We have significant operations located in and around Atlanta, New York, Pleasanton, London and Hyderabad with smaller offices located throughout the world. Rent and occupancy expenses increased in 2020 from 2019, primarily due to $6 million related to our acquisitions of Ellie Mae and Bridge2 Solutions, and $5 million combined costs for the early termination of our NYSE Chicago office lease and costs of our ICE India office. See Item 2 “- Properties” above for additional information regarding our leased and owned property.
Selling, General and Administrative Expenses
Selling, general and administrative expenses include marketing, advertising, public relations, insurance, bank service charges, dues and subscriptions, travel and entertainment, non-income taxes and other general and administrative costs. Selling, general and administrative expenses increased in 2020 from 2019, primarily due to a $10 million charitable contribution in support of COVID-19 relief efforts, $8 million in accruals for a regulatory settlement, $6 million in increased costs related to our acquisition of Ellie Mae and increased marketing and bad debt expenses, partially offset by lower travel expenses due to COVID-19.
Depreciation and Amortization Expenses
Depreciation and amortization expense results from depreciation of long-lived assets such as buildings, leasehold improvements, aircraft, hardware and networking equipment, software, furniture, fixtures and equipment over their estimated useful lives. This expense includes amortization of intangible assets obtained in our acquisitions of businesses, as well as on various licensing agreements, over their estimated useful lives. Intangible assets subject to amortization consist primarily of customer relationships, trading products with finite lives and technology. This expense also includes amortization of internally-developed and purchased software over its estimated useful life.
We recorded amortization expenses on intangible assets acquired as part of our acquisitions, as well as on other intangible assets, of $388 million and $311 million in 2020 and 2019, respectively. In addition, 2019 amortization expense included a $31 million impairment loss on exchange registration intangible assets on ICE Futures Singapore. Amortization expense increased in 2020 from 2019, primarily due to $104 million in amortization expenses recorded on the Ellie Mae intangible assets following our acquisition, partially offset by certain Interactive Data intangible assets that became fully amortized in the fourth quarter of 2019.
We recorded depreciation expenses on our fixed assets of $363 million and $320 million in 2020 and 2019, respectively. The increase in 2020 over 2019 was primarily due to depreciation resulting from increased software development and networking equipment and due to $8 million in additional expenses related to our September 2020 acquisition of Ellie Mae. In addition, our 2020 depreciation expense included a software impairment charge of $11 million related to a portion of customized software developed at Bakkt that is no longer useful.
Consolidated Non-Operating Income (Expense)
Income and expenses incurred through activities outside of our core operations are considered non-operating. The following tables present our non-operating income (expenses) (dollars in millions):
| Year Ended December 31, | Year Ended December 31, | ||||||||||||||||||||||||||||||||||
| 2020 | 2019 | Change | 2019 | 2018 | Change | ||||||||||||||||||||||||||||||
| Other income (expense): | |||||||||||||||||||||||||||||||||||
| Interest income | $ | 10 | $ | 35 | (71) | % | $ | 35 | $ | 22 | 55 | % | |||||||||||||||||||||||
| Interest expense | (357) | (285) | 25 | (285) | (244) | 17 | |||||||||||||||||||||||||||||
| Other income (expense), net | 80 | 58 | 38 | 58 | 159 | (63) | |||||||||||||||||||||||||||||
| Total other income (expense), net | $ | (267) | $ | (192) | 39 | % | $ | (192) | $ | (63) | 203 | % | |||||||||||||||||||||||
| Net income attributable to non-controlling interest | $ | (19) | $ | (27) | (27) | % | $ | (27) | $ | (32) | (17) | % |
Interest Income
Interest income decreased in 2020 from 2019 primarily due to a decrease in short-term interest rates on various investments.
Interest Expense
Interest expense increased in 2020 from 2019 primarily due to the issuance of new senior notes in the May 2020 refinancing and in August 2020 related to the Ellie Mae acquisition. Our fixed rate senior notes outstanding increased by $7.6 billion in 2020 from 2019. In 2020, interest expense included a $14 million extinguishment payment incurred related to the June 2020 early redemption of senior notes with an original maturity of December 1, 2020 and $5 million in pre-acquisition interest expense related to the Ellie Mae transaction. See “- Debt” below.
Other income (expense), net
We have an equity method investment in the Options Clearing Corporation, or OCC, and we recognized $71 million and $62 million in equity income as other income related to this investment during 2020 and 2019, respectively. We own a 40% interest in the OCC, which is regulated by the SEC and the CFTC. Included within the amount recognized during 2019 is a positive earnings adjustment of $19 million to reflect higher reported OCC 2018 net income than originally estimated, due to the SEC's disapproval of the OCC capital plan that was established in 2015. Refer to Note 4 to our consolidated financial statements, included in this Annual Report for additional details on our OCC investment.
In connection with our equity investment in Euroclear, we recognized dividend income of $19 million in 2019, which is included in other income. As a result of a 2020 European regulation limiting dividend payments, we did not receive a Euroclear dividend in 2020. In addition, in November 2020, we became aware of an observable price change in an orderly transaction of a similar Euroclear investment by a third party. The transaction resulted in a fair value adjustment of our Euroclear investment, and we recorded a gain of $35 million in other income, which includes the impact of foreign currency exchange.
We historically held a 9% ownership interest in BIDS, a registered broker-dealer and the operator of the BIDS Alternative Trading System. In December 2020, we sold our investment in BIDS to Cboe and recorded a gain on the sale of $20 million, included in other income.
In 2020, we recorded an accrual for potential legal settlements of $30 million.
We incurred foreign currency transaction losses of $5 million in both 2020 and 2019. This was primarily attributable to the fluctuations of the pound sterling and euro relative to the U.S. dollar. Foreign currency transaction gains and losses are recorded in other income (expense), net, when the settlement of foreign currency assets, liabilities and payables occur in non-functional currencies and there is an increase or decrease in the period-end foreign currency exchange rates between periods. See Item 7A “- Quantitative and Qualitative Disclosures About Market Risk - Foreign Currency Exchange Rate Risk” included elsewhere in this Annual Report for more information on these items.
In 2019, we recorded promissory note impairment charges of $16 million on work performed by the original plan processor on the CAT, and in 2020, we recorded an additional $2 million. Due to delays and failures in implementation and functionality by the original plan processor, as well as recently-published proposals by the SEC for an amended timeline
and implementation structure, we believe the risk that execution venues are not reimbursed has increased, resulting in this impairment.
In connection with our adoption of Accounting Standards Update, or ASU, 2017-07, Compensation Retirement Benefits: Improving the Presentation of Net Periodic Pension Cost and Net Periodic Postretirement Benefit Cost, or ASU 2017-07, we are recognizing the other components of net benefit cost of our defined benefit plans in the income statement as non-operating income on a full retrospective basis. The combined net periodic expense of these plans was $6 million and $4 million in 2020 and 2019, respectively.
Non-controlling Interest
For consolidated subsidiaries in which our ownership is less than 100%, and for which we have control over the assets, liabilities and management of the entity, the outside stockholders’ interests are shown as non-controlling interests. As of December 31, 2020, our non-controlling interests include those related to the non-ICE limited partners' interest in our CDS clearing subsidiaries, non-controlling interest in ICE Futures Abu Dhabi and redeemable non-controlling interest of the non-ICE partners in Bakkt.
The non-ICE limited partners of our CDS clearing subsidiaries hold a 26.7% ownership interest as of December 31, 2020. During 2020 we received a contribution from a group of minority investors for a non-controlling interest in ICE Futures Abu Dhabi.
In December 2018, Bakkt was capitalized with $183 million in initial funding with ICE as the majority owner, along with a group of other minority investors, and in March 2020, an additional $300 million in funding occurred with ICE maintaining its majority ownership. We hold a call option over these interests subject to certain terms. Similarly, the non-ICE partners in Bakkt hold a put option to require us to repurchase their interests subject to certain terms. These minority interests are reflected as redeemable non-controlling interests in temporary equity within our consolidated balance sheet and are subject to remeasurement when repurchase is probable. Refer to Note 3 to our consolidated financial statements contained elsewhere in this Annual Report.
Consolidated Income Tax Provision
Consolidated income tax expense was $658 million and $521 million in 2020 and 2019, respectively. The change in consolidated income tax expense between years is primarily due to the tax impact of changes in our pre-tax income and the changes in our effective tax rate. Our effective tax rate was 24% and 21% in 2020 and 2019, respectively.
The effective tax rate for 2020 is higher than the effective tax rate for 2019 primarily due to U.K. tax law changes enacted in July 2020, partially offset by favorable state apportionment changes as a result of our acquisition of Ellie Mae, as well as favorable changes in certain international tax provisions as part of the TCJA in 2019.
In 2015 and 2016, the U.K. enacted corporate income tax rate reductions from 19% to 17% to be effective prospectively on April 1, 2020 and we recorded associated deferred tax benefits in those years. In July 2020, the U.K. enacted a reinstatement of the U.K. corporate income tax rate back to 19%, effective April 1, 2020. As a result, we revalued our U.K. deferred tax assets and liabilities back to the rate of 19%, and recorded a $65 million deferred tax expense during 2020.
On March 27, 2020, the CARES Act was enacted and certain income tax related relief was provided under the CARES Act. There was no material impact of the CARES Act on our income tax provision for 2020.
See Note 13 to our consolidated financial statements and related notes, which are included in this Annual Report, for additional information on these tax items.
Quarterly Results of Operations
The following quarterly unaudited condensed consolidated statements of income data has been prepared on substantially the same basis as our audited consolidated financial statements and includes all adjustments, consisting only of normal recurring adjustments, necessary for the fair presentation of our consolidated results of operations for the quarters presented. The historical results for any quarter do not necessarily indicate the results expected for any future period. This unaudited condensed consolidated quarterly data should be read together with our consolidated financial statements and related notes included in this Annual Report. The following table sets forth quarterly consolidated statements of income data (in millions):
| Three Months Ended, | |||||||||||||||||||||||||||||||||||||||||||||||
| December 31, 2020 | September 30, 2020 | June 30, 2020 | March 31, 2020 | December 31, 2019 | September 30, 2019 | June 30, 2019 | March 31, 2019 | ||||||||||||||||||||||||||||||||||||||||
| Revenues: | |||||||||||||||||||||||||||||||||||||||||||||||
| Energy futures and options | $ | 262 | $ | 229 | $ | 276 | $ | 353 | $ | 243 | $ | 265 | $ | 255 | $ | 229 | |||||||||||||||||||||||||||||||
| Agricultural and metals futures and options | 48 | 54 | 59 | 84 | 57 | 60 | 72 | 62 | |||||||||||||||||||||||||||||||||||||||
| Financial futures and options | 82 | 76 | 76 | 123 | 80 | 91 | 78 | 83 | |||||||||||||||||||||||||||||||||||||||
| Cash equities and equity options | 651 | 593 | 672 | 669 | 442 | 401 | 410 | 390 | |||||||||||||||||||||||||||||||||||||||
| OTC and other | 77 | 73 | 75 | 71 | 60 | 59 | 57 | 57 | |||||||||||||||||||||||||||||||||||||||
| Data and connectivity services | 201 | 201 | 195 | 193 | 190 | 185 | 190 | 187 | |||||||||||||||||||||||||||||||||||||||
| Listings | 112 | 111 | 111 | 112 | 113 | 114 | 111 | 111 | |||||||||||||||||||||||||||||||||||||||
| Total exchanges revenues | 1,433 | 1,337 | 1,464 | 1,605 | 1,185 | 1,175 | 1,173 | 1,119 | |||||||||||||||||||||||||||||||||||||||
| Fixed income execution | 14 | 15 | 20 | 21 | 19 | 19 | 21 | 24 | |||||||||||||||||||||||||||||||||||||||
| CDS Clearing | 42 | 47 | 47 | 72 | 48 | 57 | 49 | 60 | |||||||||||||||||||||||||||||||||||||||
| Fixed income data and analytics | 262 | 259 | 252 | 245 | 244 | 244 | 242 | 239 | |||||||||||||||||||||||||||||||||||||||
| Other data and network services | 132 | 129 | 127 | 126 | 125 | 124 | 121 | 120 | |||||||||||||||||||||||||||||||||||||||
| Total fixed income and credit revenues | 450 | 450 | 446 | 464 | 436 | 444 | 433 | 443 | |||||||||||||||||||||||||||||||||||||||
| Origination technology | 201 | 52 | — | — | — | — | — | — | |||||||||||||||||||||||||||||||||||||||
| Network and closing solutions | 77 | 42 | 22 | 17 | 17 | 16 | 3 | — | |||||||||||||||||||||||||||||||||||||||
| Data and analytics | 17 | 5 | — | — | — | — | — | — | |||||||||||||||||||||||||||||||||||||||
| Registrations and other | 55 | 44 | 34 | 29 | 29 | 28 | 25 | 21 | |||||||||||||||||||||||||||||||||||||||
| Total mortgage technology revenues | 350 | 143 | 56 | 46 | 46 | 44 | 28 | 21 | |||||||||||||||||||||||||||||||||||||||
| Total revenues | 2,233 | 1,930 | 1,966 | 2,115 | 1,667 | 1,663 | 1,634 | 1,583 | |||||||||||||||||||||||||||||||||||||||
| Transaction-based expenses | 562 | 519 | 571 | 556 | 369 | 327 | 336 | 313 | |||||||||||||||||||||||||||||||||||||||
| Total revenues, less transaction-based expenses | 1,671 | 1,411 | 1,395 | 1,559 | 1,298 | 1,336 | 1,298 | 1,270 | |||||||||||||||||||||||||||||||||||||||
| Compensation and benefits | 339 | 298 | 273 | 278 | 274 | 261 | 259 | 248 | |||||||||||||||||||||||||||||||||||||||
| Professional services | 44 | 37 | 34 | 29 | 28 | 35 | 29 | 33 | |||||||||||||||||||||||||||||||||||||||
| Acquisition-related transaction and integration costs | 15 | 76 | 2 | 12 | 1 | — | 1 | — | |||||||||||||||||||||||||||||||||||||||
| Technology and communication | 161 | 131 | 126 | 131 | 123 | 126 | 113 | 107 | |||||||||||||||||||||||||||||||||||||||
| Rent and occupancy | 22 | 19 | 19 | 21 | 16 | 17 | 18 | 17 | |||||||||||||||||||||||||||||||||||||||
| Selling, general and administrative | 53 | 43 | 40 | 49 | 45 | 33 | 41 | 42 | |||||||||||||||||||||||||||||||||||||||
| Depreciation and amortization | 257 | 180 | 157 | 157 | 189 | 158 | 157 | 158 | |||||||||||||||||||||||||||||||||||||||
| Total operating expenses | 891 | 784 | 651 | 677 | 676 | 630 | 618 | 605 | |||||||||||||||||||||||||||||||||||||||
| Operating income | 780 | 627 | 744 | 882 | 622 | 706 | 680 | 665 | |||||||||||||||||||||||||||||||||||||||
| Other income (expense), net | (106) | (44) | (71) | (46) | (35) | (66) | (52) | (39) | |||||||||||||||||||||||||||||||||||||||
| Income tax expense | 146 | 189 | 145 | 178 | 134 | 103 | 150 | 134 | |||||||||||||||||||||||||||||||||||||||
| Net income | $ | 528 | $ | 394 | $ | 528 | $ | 658 | $ | 453 | $ | 537 | $ | 478 | $ | 492 | |||||||||||||||||||||||||||||||
| Net income attributable to non-controlling interest | (2) | (4) | (5) | (8) | (5) | (8) | (6) | (8) | |||||||||||||||||||||||||||||||||||||||
| Net income attributable to Intercontinental Exchange, Inc. | $ | 526 | $ | 390 | $ | 523 | $ | 650 | $ | 448 | $ | 529 | $ | 472 | $ | 484 |
Liquidity and Capital Resources
Below are charts that reflect our outstanding debt and capital allocation. The acquisition and integration costs in the chart below includes cash paid for acquisitions, net of cash received for divestitures, cash paid for equity investments, cash paid for non-controlling interest and redeemable non-controlling interest, and acquisition-related transaction and integration costs, in each year.
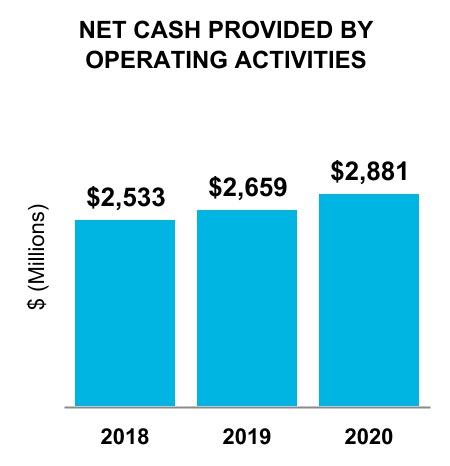


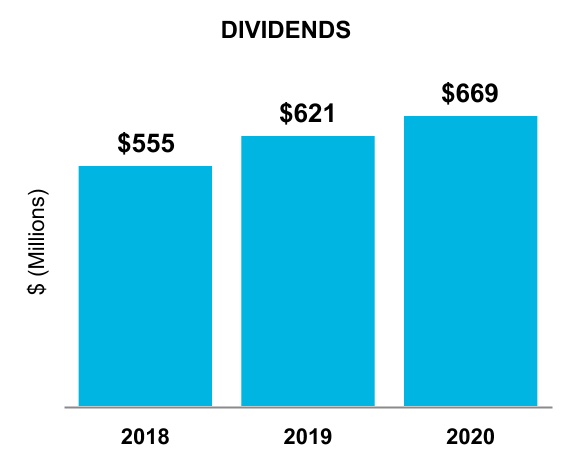
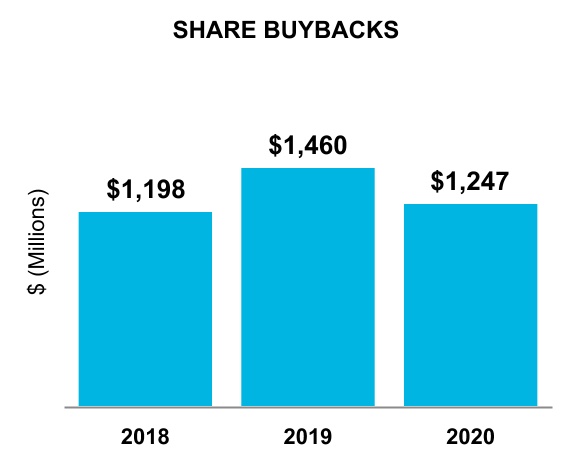
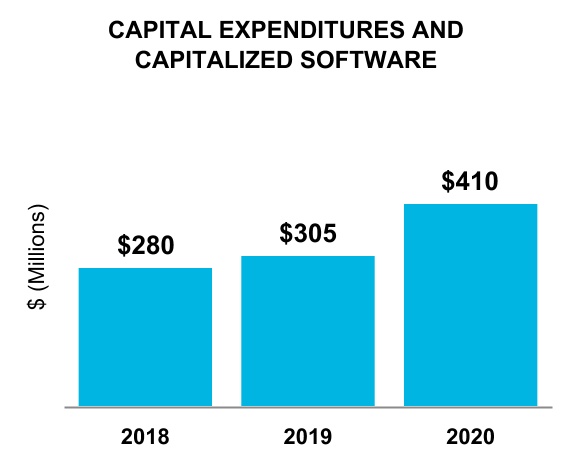
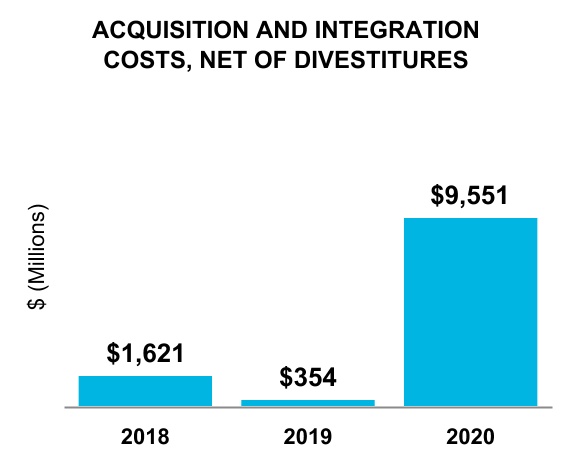
We have financed our operations, growth and cash needs primarily through income from operations and borrowings under our various debt facilities. Our principal capital requirements have been to fund capital expenditures, working capital, strategic acquisitions and investments, stock repurchases, dividends and the development of our technology platforms. We believe that our cash on hand and cash flows from operations will be sufficient to repay our outstanding debt, but we
may also need to incur additional debt or issue additional equity securities in the future. See “- Future Capital Requirements” below.
For a discussion of the COVID-19 pandemic and how the pandemic may impact our business, results of operations or financial condition in the future, including our liquidity and capital resources, see “– Recent Developments" and “– Risk Factors" in Part 1, Item 1(A), above.
See “- Recent Developments” above for a discussion of the acquisitions that we made during 2020. These acquisitions were funded from borrowing under our Commercial Paper Program and term loan, the net proceeds from the issuance of the August 2020 Notes and cash flows from operations, as well as approximately $1.9 billion, or approximately 18.4 million shares of our common stock, based on our stock price, for the Ellie Mae acquisition.
See “- Cash Flow” below for a discussion of our capital expenditures and capitalized software development costs.
Consolidated cash and cash equivalents were $583 million and $841 million as of December 31, 2020 and 2019, respectively. We had $1.4 billion and $1.3 billion in short-term and long-term restricted cash and cash equivalents as of December 31, 2020 and 2019, respectively.
As of December 31, 2020, the amount of unrestricted cash held by our non-U.S. subsidiaries was $292 million. Due to U.S. tax reform, the majority of our foreign earnings since January 1, 2018 have been subject to immediate U.S. income taxation, and the existing non-U.S. unrestricted cash balance can be distributed to the U.S. in the future with no material additional income tax consequences.
Our cash and cash equivalents and financial investments are managed as a global treasury portfolio of non-speculative financial instruments that are readily convertible into cash, such as overnight deposits, term deposits, money market funds, mutual funds for treasury investments, short duration fixed income investments and other money market instruments, thus ensuring high liquidity of financial assets. We may invest a portion of our cash in excess of short-term operating needs in investment-grade marketable debt securities, including government or government-sponsored agencies and corporate debt securities. As of December 31, 2020, we held $27 million of unrestricted cash that was set aside for legal, regulatory and surveillance operations at NYSE.
Cash Flow
The following table presents the major components of net changes in cash, cash equivalents, and restricted cash and cash equivalents (in millions):
| Year Ended December 31, | ||||||||||||||||||||
| 2020 | 2019 | 2018 | ||||||||||||||||||
| Net cash provided by (used in): | ||||||||||||||||||||
| Operating activities | $ | 2,881 | $ | 2,659 | $ | 2,533 | ||||||||||||||
| Investing activities | (9,830) | (594) | (1,755) | |||||||||||||||||
| Financing activities | 6,744 | (1,753) | (463) | |||||||||||||||||
| Effect of exchange rate changes | 8 | 4 | (11) | |||||||||||||||||
| Net (decrease) increase in cash, cash equivalents, and restricted cash and cash equivalents | $ | (197) | $ | 316 | $ | 304 |
Operating Activities
Net cash provided by operating activities primarily consists of net income adjusted for certain items, including depreciation and amortization, deferred taxes, stock based compensation, investment gains and losses and the effects of changes in working capital.
The $222 million increase in net cash provided by operating activities in 2020 and 2019 was driven by a $148 million increase in net income and the non-cash impact of deferred taxes of $125 million, partially offset by the timing of NYSE collections on increased billings of $119 million and higher income taxes paid as a result of the U.K. government accelerating its required income tax installment payments in 2020. The remaining change is due to fluctuations in our working capital and the timing of various payments such as transaction-related expenses.
Investing Activities
Consolidated net cash used in investing activities in 2020 and 2019 relates to cash paid for acquisitions, net of cash acquired, a return of capital related to our investment in OCC, proceeds from investments related to MERS and changes in capital expenditures and capitalized software development costs.
We paid cash for acquisitions, net of the cash of the companies acquired, of $9.4 billion and $352 million in 2020 and 2019, respectively, primarily relating to the Ellie Mae acquisition in 2020 and the Simplifile acquisition in 2019.
In 2019, we had a $60 million return of capital related to our equity method investment in the OCC and $41 million proceeds from investments related to MERS. Refer to Note 4 to our consolidated financial statements, included in this Annual Report for additional details on these investments.
We had capital expenditures of $207 million and $153 million in 2020 and 2019, respectively, and we had capitalized software development costs of $203 million and $152 million in 2020 and 2019, respectively. The capital expenditures primarily relate to hardware and software purchases to continue the development and expansion of our electronic platforms, data services and clearing houses and leasehold improvements. The software development expenditures primarily relate to the development and expansion of our electronic platforms, data services, mortgage services and clearing houses.
Financing Activities
Consolidated net cash provided by financing activities in 2020 primarily relates to $9.6 billion in net proceeds from the issuance of the May 2020 Notes and the August 2020 Notes, borrowings under a term loan facility and $1.1 billion in net issuances under our Commercial Paper Program. Cash provided by financing activities was partially offset by repayments of our $1.25 billion December 2020 Senior Notes, and the early payoff of the term loan mentioned above, $1.2 billion in repurchases of common stock, $669 million in dividend payments to our stockholders and $74 million in cash payments related to treasury shares received for restricted stock tax payments and stock options exercises.
Consolidated net cash used in financing activities in 2019 primarily relates to $1.5 billion in repurchases of common stock, $360 million in net borrowings under our Commercial Paper Program, $621 million in dividend payments to stockholders and $65 million in cash payments related to treasury shares received for restricted stock tax payments and stock options exercises.
See Note 10 to our consolidated financial statements, included in this Annual Report.
Debt
As of December 31, 2020, we had $16.5 billion in outstanding debt, consisting of $12.9 billion of fixed rate senior notes, $1.2 billion of floating rate senior notes, $2.4 billion under our U.S. dollar commercial paper program, or the Commercial Paper Program and $6 million under a line of credit at our ICE India subsidiary. The commercial paper notes had original maturities ranging from four to 266 days as of December 31, 2020, with a weighted average interest rate of 0.40% per annum, and a weighted average remaining maturity of 82 days. Commercial paper notes of $1.3 billion with original maturities ranging from two to 87 days were outstanding as of December 31, 2019, with a weighted average interest rate of 1.84% per annum, and a weighted average remaining maturity of 22 days. Our current fixed rate debt principal of $13.1 billion has a weighted average maturity of 16 years and a weighted average cost of 3.0% per annum.
We have a $3.7 billion senior unsecured revolving credit facility, or the Credit Facility, pursuant to a credit agreement with Wells Fargo Bank, N.A., as primary administrative agent, issuing lender and swing-line lender, Bank of America, N.A., as syndication agent, backup administrative agent and swing-line lender, and the lenders party thereto. As of December 31, 2020, of the $3.7 billion that is currently available for borrowing under the Credit Facility, $2.4 billion is required to back-stop the amount outstanding under our Commercial Paper Program and $171 million is required to support certain broker-dealer and other subsidiary commitments. The amount required to backstop the amounts outstanding under the Commercial Paper Program will fluctuate as we increase or decrease our commercial paper borrowings. The remaining $1.1 billion is available for working capital and general corporate purposes, including, but not limited to, acting as a back-stop to future increases in the amounts outstanding under the Commercial Paper Program.
On August 21, 2020, we entered into a $750 million 18-month senior unsecured delayed draw term loan facility with a maturity date of February 21, 2022. We borrowed in full under the facility on September 3, 2020 and the proceeds were used to fund a portion of the purchase price for the Ellie Mae acquisition. We had the option to prepay the facility in whole or in part at any time, and paid off the full balance of the loan on December 16, 2020. Interest on borrowings under this term loan facility were based on the principal amount outstanding at LIBOR plus an applicable margin, which was equal to 1.125%.
On August 20, 2020, we issued $6.5 billion in aggregate principal amount of new senior notes, comprised of $1.25 billion in aggregate principal amount of floating rate senior notes due in 2023, $1.0 billion in aggregate principal amount of 0.70% senior notes due in 2023, $1.5 billion in aggregate principal amount of 1.85% senior notes due in 2032, $1.25 billion in aggregate principal amount of 2.65% senior notes due in 2040, and $1.5 billion in aggregate principal amount of 3.00%
senior notes due in 2060. We used the net proceeds from the offering to fund a portion of the purchase price for the Ellie Mae acquisition.
On May 26, 2020, we issued $2.5 billion in aggregate principal amount of new senior notes, comprised of $1.25 billion in aggregate principal amount of 2.10% senior notes due in 2030 and $1.25 billion in aggregate principal amount of 3.00% senior notes due in 2050. We used the net proceeds from the offering for general corporate purposes, including to fund the redemption of our $1.25 billion aggregate principal amount of 2.75% senior notes due in December 2020 and to pay down a portion of our commercial paper outstanding.
Our Commercial Paper Program enables us to borrow efficiently at reasonable short-term interest rates and provides us with the flexibility to de-lever using our strong annual cash flows from operating activities whenever our leverage becomes elevated as a result of investment or acquisition activities. We had net issuances of $1.1 billion under our Commercial Paper Program during 2020.
Upon maturity of our commercial paper and to the extent old issuances are not repaid by cash on hand, we are exposed to the rollover risk of not being able to issue new commercial paper. To mitigate this risk, we maintain an undrawn back-stop bank revolving credit facility for an aggregate amount which meets or exceeds the amount issued under our Commercial Paper Program at any time. If we were not able to issue new commercial paper, we have the option of drawing on the back-stop revolving facility. However, electing to do so would result in higher interest expense.
For additional details of our debt instruments, refer to Note 10 to our consolidated financial statements, included in this Annual Report.
Capital Return
In December 2019, our Board approved an aggregate of $2.4 billion for future repurchases of our common stock with no fixed expiration date that became effective January 1, 2020. The $2.4 billion replaced the previous amount approved by the Board.
During 2020, we repurchased 13.6 million shares of our outstanding common stock at a cost of $1.2 billion, including 10.4 million shares at a cost of $948 million under our Rule 10b5-1 trading plan and 3.2 million shares at a cost of $299 million on the open market. In 2019, we repurchased 17.4 million shares of our outstanding common stock at a cost of $1.5 billion, including 16.1 million shares at a cost of $1.4 billion under our Rule 10b5-1 trading plan and 1.3 million shares at a cost of $100 million on the open market. Shares repurchased are held in treasury stock.
We discontinued stock repurchases and terminated our Rule 10b5-1 trading plan in August 2020 in connection with our Ellie Mae acquisition. The remaining balance of Board approved funds for future repurchase is $1.2 billion. The approval of our Board for the share repurchases does not obligate us to acquire any particular amount of our common stock. In addition, our Board may increase or decrease the amount available for repurchases from time to time.
From time to time, we enter into Rule 10b5-1 trading plans, as authorized by our Board, to govern some or all of the repurchases of our shares of common stock. The timing and extent of future repurchases that are not made pursuant to a Rule 10b5-1 trading plan will be at our discretion and will depend upon many conditions. In making a determination regarding any stock repurchases, management considers multiple factors, including overall stock market conditions, our common stock price performance, the remaining amount authorized for repurchases by our Board, the potential impact of a stock repurchase program on our corporate debt ratings, our expected free cash flow and working capital needs, our current and future planned strategic growth initiatives, and other potential uses of our cash and capital resources.
During 2020, we paid cash dividends of $1.20 per share of our common stock in the aggregate, including quarterly dividends of $0.30 per share, for an aggregate payout of $669 million, which includes the payment of dividend equivalents on unvested employee restricted stock units. Refer to Note 12 to our consolidated financial statements included in this Annual Report, for details on the amounts of our quarterly dividend payouts for the last three years.
Future Capital Requirements
Our future capital requirements will depend on many factors, including the rate of growth across our segments, strategic plans and acquisitions, available sources for financing activities, required and discretionary technology and clearing initiatives, regulatory requirements, the timing and introduction of new products and enhancements to existing products, the geographic mix of our business and potential stock repurchases.
We currently expect to incur capital expenditures (including operational and real estate capital expenditures) and to incur software development costs that are eligible for capitalization ranging in the aggregate between $400 million and
$430 million in 2021, which we believe will support the enhancement of our technology, business integration and the continued growth of our businesses.
In December 2019, our Board approved an aggregate of $2.4 billion for future repurchases of our common stock with no fixed expiration date that became effective on January 1, 2020. As of December 31, 2020, we had $1.2 billion authorized for future repurchases of our common stock. Refer to Note 12 to our consolidated financial statements included in this Annual Report for additional details on our stock repurchase program.
Our Board has adopted a quarterly dividend policy providing that dividends will be approved quarterly by the Board or the Audit Committee taking into account factors such as our evolving business model, prevailing business conditions, our current and future planned strategic growth initiatives and our financial results and capital requirements, without a predetermined net income payout ratio. For the first quarter of 2021, we announced a $0.33 per share dividend payable on March 31, 2021 to stockholders of record as of March 17, 2021.
Other than the facilities for the ICE Clearing Houses, our Credit Facility and our Commercial Paper Program are currently the only significant agreements or arrangements that we have for liquidity and capital resources with third parties. See Notes 10 and 14 to our consolidated financial statements for further discussion. In the event of any strategic acquisitions, mergers or investments, or if we are required to raise capital for any reason or desire to return capital to our stockholders, we may incur additional debt, issue additional equity to raise necessary funds, repurchase additional shares of our common stock or pay a dividend. However, we cannot provide assurance that such financing or transactions will be available or successful, or that the terms of such financing or transactions will be favorable to us. See “-Risk Factors" and Note 10 to our consolidated financial statements, included in this Annual Report.
Non-GAAP Measures
We use certain financial measures internally to evaluate our performance and make financial and operational decisions that are presented in a manner that adjusts from their equivalent GAAP measures or that supplement the information provided by our GAAP measures. We use these adjusted results because we believe they more clearly highlight trends in our business that may not otherwise be apparent when relying solely on GAAP financial measures, since these measures eliminate from our results specific financial items that have less bearing on our core operating performance.
We use these measures in communicating certain aspects of our results and performance, including in this Annual Report, and believe that these measures, when viewed in conjunction with our GAAP results and the accompanying reconciliation, can provide investors with greater transparency and a greater understanding of factors affecting our financial condition and results of operations than GAAP measures alone. In addition, we believe the presentation of these measures is useful to investors for making period-to-period comparisons of results because the adjustments to GAAP are not reflective of our core business performance.
These financial measures are not presented in accordance with, or as an alternative to, GAAP financial measures and may be different from non-GAAP measures used by other companies. We encourage investors to review the GAAP financial measures included in this Annual Report, including our consolidated financial statements, to aid in their analysis and understanding of our performance and in making comparisons.
The table below outlines our adjusted operating expenses, adjusted operating income, adjusted operating margin, adjusted net income attributable to ICE common stockholders and adjusted earnings per share, which are non-GAAP measures that are calculated by making adjustments for items we view as not reflective of our cash operations and core business performance. These measures, including the adjustments and their related income tax effect and other tax adjustments (in millions, except for percentages and per share amounts), are as follows:
| Exchanges Segment | Fixed Income and Data Services Segment | Mortgage Technology Segment | Consolidated | ||||||||||||||||||||||||||||||||||||||||||||||||||||||||||||||||||||
| Year Ended December 31, | Year Ended December 31, | Year Ended December 31, | Year Ended December 31, | ||||||||||||||||||||||||||||||||||||||||||||||||||||||||||||||||||||
| 2020 | 2019 | 2018 | 2020 | 2019 | 2018 | 2020 | 2019 | 2018 | 2020 | 2019 | 2018 | ||||||||||||||||||||||||||||||||||||||||||||||||||||||||||||
| Total revenues, less transaction-based expenses | $ | 3,631 | $ | 3,307 | $ | 3,276 | $ | 1,810 | $ | 1,756 | $ | 1,681 | $ | 595 | $ | 139 | $ | 22 | $ | 6,036 | $ | 5,202 | $ | 4,979 | |||||||||||||||||||||||||||||||||||||||||||||||
| Operating expenses | 1,242 | 1,140 | 1,114 | 1,318 | 1,317 | 1,265 | 443 | 72 | 17 | 3,003 | 2,529 | 2,396 | |||||||||||||||||||||||||||||||||||||||||||||||||||||||||||
| Less: Amortization of acquisition-related intangibles | 74 | 68 | 71 | 191 | 225 | 213 | 123 | 16 | 3 | 388 | 309 | 287 | |||||||||||||||||||||||||||||||||||||||||||||||||||||||||||
| Less: Transaction and integration costs and acquisition-related success fees | 12 | — | — | — | — | 30 | 89 | — | — | 101 | — | 30 | |||||||||||||||||||||||||||||||||||||||||||||||||||||||||||
| Less: Impairment of developed software | 11 | — | — | — | — | — | — | — | — | 11 | — | — | |||||||||||||||||||||||||||||||||||||||||||||||||||||||||||
| Less: Impairment of exchange registration intangible assets on ICE Futures Singapore | — | 31 | — | — | — | — | — | — | — | — | 31 | — | |||||||||||||||||||||||||||||||||||||||||||||||||||||||||||
| Less: Accruals relating to a regulatory settlement | — | — | — | 8 | — | — | — | — | — | 8 | — | — | |||||||||||||||||||||||||||||||||||||||||||||||||||||||||||
| Less: Impairment of exchange registration intangible assets on closure of ICE Futures Canada and ICE Clear Canada | — | — | 4 | — | — | — | — | — | — | — | — | 4 | |||||||||||||||||||||||||||||||||||||||||||||||||||||||||||
| Less: Employee severance costs related to ICE Futures Canada and ICE Clear Canada operations | — | — | 4 | — | — | — | — | — | — | — | — | 4 | |||||||||||||||||||||||||||||||||||||||||||||||||||||||||||
| Adjusted operating expenses | $ | 1,145 | $ | 1,041 | $ | 1,035 | $ | 1,119 | $ | 1,092 | $ | 1,022 | $ | 231 | $ | 56 | $ | 14 | $ | 2,495 | $ | 2,189 | $ | 2,071 | |||||||||||||||||||||||||||||||||||||||||||||||
| Operating income | $ | 2,389 | $ | 2,167 | $ | 2,162 | $ | 492 | $ | 439 | $ | 416 | $ | 152 | $ | 67 | $ | 5 | $ | 3,033 | $ | 2,673 | $ | 2,583 | |||||||||||||||||||||||||||||||||||||||||||||||
| Adjusted operating income | $ | 2,486 | $ | 2,266 | $ | 2,241 | $ | 691 | $ | 664 | $ | 659 | $ | 364 | $ | 83 | $ | 8 | $ | 3,541 | $ | 3,013 | $ | 2,908 | |||||||||||||||||||||||||||||||||||||||||||||||
| Operating margin | 66 | % | 66 | % | 66 | % | 27 | % | 25 | % | 25 | % | 25 | % | 48 | % | 20 | % | 50 | % | 51 | % | 52 | % | |||||||||||||||||||||||||||||||||||||||||||||||
| Adjusted operating margin | 68 | % | 69 | % | 68 | % | 38 | % | 38 | % | 39 | % | 61 | % | 59 | % | 34 | % | 59 | % | 58 | % | 58 | % | |||||||||||||||||||||||||||||||||||||||||||||||
| Net income attributable to ICE common stockholders | $ | 2,089 | $ | 1,933 | $ | 1,988 | |||||||||||||||||||||||||||||||||||||||||||||||||||||||||||||||||
| Add: Amortization of acquisition-related intangibles | 388 | 309 | 287 | ||||||||||||||||||||||||||||||||||||||||||||||||||||||||||||||||||||
| Add: Transaction and integration costs and acquisition-related success fees | 101 | — | 30 | ||||||||||||||||||||||||||||||||||||||||||||||||||||||||||||||||||||
| Less: Gain on equity investments | (55) | — | — | ||||||||||||||||||||||||||||||||||||||||||||||||||||||||||||||||||||
| Add: Extinguishment of 2020 Senior Notes | 14 | — | — | ||||||||||||||||||||||||||||||||||||||||||||||||||||||||||||||||||||
| Add: Pre-acquisition interest expense on debt issued for Ellie Mae acquisition | 5 | — | — | ||||||||||||||||||||||||||||||||||||||||||||||||||||||||||||||||||||
| Add: Impairment of developed software | 11 | — | — | ||||||||||||||||||||||||||||||||||||||||||||||||||||||||||||||||||||
| Add: Impairment of CAT promissory notes | 2 | 16 | — | ||||||||||||||||||||||||||||||||||||||||||||||||||||||||||||||||||||
| Add: Impairment of exchange registration intangible assets on ICE Futures Singapore | — | 31 | — | ||||||||||||||||||||||||||||||||||||||||||||||||||||||||||||||||||||
| Less: Gain on acquisition of MERS | — | — | (110) | ||||||||||||||||||||||||||||||||||||||||||||||||||||||||||||||||||||
| Add: Accrual for potential legal settlements | 30 | — | — | ||||||||||||||||||||||||||||||||||||||||||||||||||||||||||||||||||||
| Add: Accruals relating to a regulatory settlement | 8 | — | — | ||||||||||||||||||||||||||||||||||||||||||||||||||||||||||||||||||||
| Add: Impairment of exchange registration intangible assets on closure of ICE Futures Canada and ICE Clear Canada | — | — | 4 | ||||||||||||||||||||||||||||||||||||||||||||||||||||||||||||||||||||
| Add: Employee severance costs related to ICE Futures Canada and ICE Clear Canada operations | — | — | 4 | ||||||||||||||||||||||||||||||||||||||||||||||||||||||||||||||||||||
| Add: Adjustment to gain on divestiture of Trayport, net | — | — | 1 | ||||||||||||||||||||||||||||||||||||||||||||||||||||||||||||||||||||
| Less: Income tax effect for the above items | (129) | (90) | (98) | ||||||||||||||||||||||||||||||||||||||||||||||||||||||||||||||||||||
| Less: Deferred tax adjustments from U.S. tax rate reduction | — | — | (11) | ||||||||||||||||||||||||||||||||||||||||||||||||||||||||||||||||||||
| Add/(Less): Deferred tax adjustments on acquisition-related intangibles | 36 | (8) | (5) | ||||||||||||||||||||||||||||||||||||||||||||||||||||||||||||||||||||
| Add/(Less): Other tax adjustments | — | 3 | (13) | ||||||||||||||||||||||||||||||||||||||||||||||||||||||||||||||||||||
| Adjusted net income attributable to ICE common stockholders | $ | 2,500 | $ | 2,194 | $ | 2,077 | |||||||||||||||||||||||||||||||||||||||||||||||||||||||||||||||||
| Basic earnings per share attributable to ICE common stockholders | $ | 3.79 | $ | 3.44 | $ | 3.46 | |||||||||||||||||||||||||||||||||||||||||||||||||||||||||||||||||
| Diluted earnings per share attributable to ICE common stockholders | $ | 3.77 | $ | 3.42 | $ | 3.43 | |||||||||||||||||||||||||||||||||||||||||||||||||||||||||||||||||
| Adjusted basic earnings per share attributable to ICE common stockholders | $ | 4.53 | $ | 3.91 | $ | 3.61 | |||||||||||||||||||||||||||||||||||||||||||||||||||||||||||||||||
| Adjusted diluted earnings per share attributable to ICE common stockholders | $ | 4.51 | $ | 3.88 | $ | 3.59 | |||||||||||||||||||||||||||||||||||||||||||||||||||||||||||||||||
| Basic weighted average common shares outstanding | 552 | 561 | 575 | ||||||||||||||||||||||||||||||||||||||||||||||||||||||||||||||||||||
| Diluted weighted average common shares outstanding | 555 | 565 | 579 |
Amortization of acquisition-related intangibles are included in non-GAAP adjustments as excluding these non-cash expenses provides greater clarity regarding our financial strength and stability of cash operating results.
Acquisition-related transaction costs are included as part of our core business expenses, except for those that are directly related to the announcement, closing, financing or termination of a transaction. However, we adjust for the acquisition-related transaction and integration costs relating to acquisitions such as Ellie Mae and Interactive Data given the
magnitude of the $11.4 billion and $5.6 billion purchase prices, respectively, of these acquisitions. We also adjust for the acquisition-related transaction costs related to the expected merger between Bakkt and VIH due to the significance of the transaction. The integration of Interactive Data was completed by June 2018. In 2020, we also included a $10 million adjustment for Bridge2 Solutions acquisition costs resulting from a Bakkt incentive award market condition estimation adjustment as an acquisition-related success fee. This adjustment was directly related to the March 2020 capital call to fund the acquisition of Bridge2 Solutions and we believe is therefore appropriate since we exclude costs directly related to financing a transaction.
The extinguishment payment on the 2020 Senior Notes is included as a non-GAAP adjustment as it relates to the June 2020 early redemption of senior notes with an original maturity of December 1, 2020 as a result of our new senior notes offering in May 2020. These costs include both a make-whole redemption payment and duplicative interest and are not considered part of our normal operations. We also adjust for pre-acquisition interest expense on the August 2020 debt issued to fund a portion of the purchase price of our Ellie Mae acquisition as we do not consider this to be reflective of our normal operations.
We include the 2019 impairment of exchange registration intangible assets on ICE Futures Singapore as a non-GAAP adjustment. This impairment is not based on our core business operations, but rather was a result of the estimated fair value of an acquired intangible asset falling below its carrying value. See Note 8 to our consolidated financial statements, included in this Annual Report.
We include the 2020 and 2019 promissory note impairment charges on work performed by the original plan processor on the CAT as non-GAAP adjustments. These are included as non-GAAP adjustments as these are not considered a part of our core business operations. See additional discussion on the CAT, above, in Item 1(A) "-Risk Factors" in this Annual Report.
In addition, we also include the following items as non-GAAP adjustments, as each of these are not considered a part of our core business operations:
-
2020: Impairment of software developed at our Bakkt subsidiary since it relates to the build-out of a fundamental software design vs. a recurring upgrade;
-
2020: accrual for potential legal settlements;
-
2020: accruals relating to a regulatory settlement;
-
2020: the $35 million gain on the fair value adjustment of our Euroclear equity investment and the $20 million gain on the sale of our BIDS equity investment;
-
2018: the gain recognized on our initial majority investment in MERS in connection with our acquisition of 100% of the remaining MERS interests;
-
2018: the impairment loss on exchange registration intangible assets and employee severance costs related to the closure of ICE Futures Canada and ICE Clear Canada; and
-
2018: a subsequent adjustment to reduce the gain on the divestiture of Trayport.
The tax items in non-GAAP adjustments are either the tax impacts of the pre-tax non-GAAP adjustments or tax items as described below that are not in the normal course of business and are not indicative of our core business performance. The following tax-related items are included as non-GAAP adjustments:
-
Deferred tax adjustments on acquisition-related intangibles, including the impact of U.K. and U.S. state tax law changes and apportionment updates, as well as foreign tax law changes which resulted in deferred tax expense/(benefit) of $36 million, ($8 million) and ($5 million) in 2020, 2019 and 2018, respectively;
-
Deferred tax benefits of $11 million in 2018 resulting from changes in estimates as a result of the enactment of the TCJA which reduced the corporate income tax rate from 35% to 21%; and
-
Other tax adjustments of $3 million in 2019 for audit settlement payments primarily related to pre-acquisition tax matters in connection with our acquisition of NYSE in 2013; and other tax adjustments in 2018 including a $17 million tax benefit on the sale of Trayport, partially offset by an audit settlement for a pre-acquisition period in connection with our acquisition of NYSE in 2013.
For additional information on these items, refer to our consolidated financial statements included in this Annual Report and “- Recent Developments,” “- Consolidated Operating Expenses”, “- Consolidated Non-Operating Income (Expenses)” and “-Consolidated Income Tax Provision” above.
Off-Balance Sheet Arrangements
As described in Notes 3 and 14 to our consolidated financial statements, which are included elsewhere in this Annual Report, certain clearing house collateral and Bakkt custodial assets are reported off-balance sheet. We do not have any relationships with unconsolidated entities or financial partnerships, often referred to as structured finance or special purpose entities.
Contractual Obligations and Commercial Commitments
The following presents our contractual obligations (which we intend to fund from existing cash as well as cash flow from operations) and commercial commitments as of December 31, 2020 (in millions):
| Payments Due by Period | |||||||||||||||||||||||||||||
| Total | Less Than 1 Year | 1-3 Years | 4-5 Years | After 5 Years | |||||||||||||||||||||||||
| Contractual Obligations: | |||||||||||||||||||||||||||||
| Short-term and long-term debt and interest | $ | 23,084 | $ | 2,799 | $ | 4,696 | $ | 1,866 | $ | 13,723 | |||||||||||||||||||
| Operating lease obligations | 426 | 79 | 152 | 112 | 83 | ||||||||||||||||||||||||
| Purchase obligations | 244 | 152 | 88 | 4 | — | ||||||||||||||||||||||||
| Total contractual cash obligations | $ | 23,754 | $ | 3,030 | $ | 4,936 | $ | 1,982 | $ | 13,806 |
Purchase obligations include our estimate of the minimum outstanding obligations under agreements to purchase goods or services that we believe are enforceable and legally binding and that specify all significant terms, including: fixed or minimum quantities to be purchased; fixed, minimum or variable price provisions; and the approximate timing of the transaction. Purchase obligations exclude agreements that are cancellable at any time without penalty.
We have excluded from the contractual obligations and commercial commitments listed above $84.1 billion in cash margin deposits, guaranty funds and delivery contracts payable. Clearing members of our clearing houses are required to deposit original margin and variation margin and to make deposits to a guaranty fund. The cash deposits made to these margin accounts and to the guaranty fund are recorded in the consolidated balance sheet as current assets with corresponding current liabilities to the clearing members that deposited them. ICE NGX administers the physical delivery of energy trading contracts. It has an equal and offsetting claim to and from its respective participants on opposite sides of the physically-settled contract, each of which is reflected as a delivery contract receivable with an offsetting delivery contract payable. See Note 14 to our consolidated financial statements included in this Annual Report for additional information on our clearing houses and the margin deposits, guaranty funds and delivery contracts payable.
We have also excluded unrecognized tax benefits, or UTBs. As of December 31, 2020, our cumulative UTBs were $188 million, and interest and penalties related to UTBs were $39 million. We are under examination by various tax authorities. We are unable to make a reasonable estimate of the periods of cash settlement because it is not possible to reasonably predict the amount of tax, interest and penalties, if any, that might be assessed by a tax authority or the timing of an assessment or payment. It is also not possible to reasonably predict whether or not the applicable statutes of limitations might expire without us being examined by any particular tax authority. See Note 13 to our consolidated financial statements for additional information on our UTBs.
As of December 31, 2020, we, through NYSE, have net obligations of $130 million related to our pension and other benefit programs. The date of payment under these net obligations cannot be determined and have been excluded from the table above. See Note 16 to our consolidated financial statements for additional information on our pension and other benefit programs.
In addition, the future funding of the implementation and operation of the CAT is ultimately expected to be provided by both the SROs and broker-dealers. To date, however, funding has been provided solely by the SROs, and future funding is expected to be repaid if industry member fees are approved by the SEC and subsequently collected by industry members. See "- Non-GAAP Measures" above.
New and Recently Adopted Accounting Pronouncements
Refer to Note 2 to our consolidated financial statements included in this Annual Report for information on the new and recently adopted accounting pronouncements that are applicable to us.
Critical Accounting Policies
We have identified the policies below as critical to our business operations and the understanding of our results of operations. The impact of, and any associated risks related to, these policies on our business operations is discussed throughout “- Management’s Discussion and Analysis of Financial Condition and Results of Operations.” For a detailed discussion on the application of these and other accounting policies, see Note 2 to our consolidated financial statements included in this Annual Report.
Our discussion and analysis of our financial condition and results of operations are based upon our consolidated financial statements, which have been prepared in accordance with U.S. GAAP. The preparation of financial statements in conformity with these accounting principles requires us to make estimates and assumptions that affect the reported amount of assets and liabilities, and the disclosure of contingent assets and liabilities, at the date of our financial statements and the reported amounts of revenues and expenses during the reporting period.
We base our estimates and judgments on our historical experience and other factors that we believe to be reasonable under the circumstances when we make these estimates and judgments and re-evaluate them on a periodic basis. Based on these factors, we make estimates and judgments about, among other things, the carrying values of assets and liabilities that are not readily apparent from market prices or other independent sources and about the recognition and characterization of our revenues and expenses. The values and results based on these estimates and judgments could differ significantly under different assumptions or conditions and could change materially in the future.
We believe that the following critical accounting policies, among others, affect our more significant judgments and estimates used in the preparation of our consolidated financial statements and could materially increase or decrease our reported results, assets and liabilities.
Goodwill and Other Identifiable Intangible Assets
Assets acquired and liabilities assumed in connection with our acquisitions are recorded at their estimated fair values. Goodwill represents the excess of the purchase price of an acquired company over the fair value of its identifiable net assets, including identified intangible assets. We recognize specifically identifiable intangibles, such as customer relationships, trademarks, technology, trading products, data, exchange registrations, backlog, trade names and licenses when a specific right or contract is acquired. Our determination of the fair value of the intangible assets and whether or not these assets may be impaired following their acquisition requires us to apply significant judgments and make significant estimates and assumptions regarding future cash flows. If we change our strategy or if market conditions shift, our judgments and estimates may change, which may result in adjustments to recorded asset balances. Intangible assets with finite useful lives are amortized over their estimated useful lives whereas goodwill and intangible assets with indefinite useful lives are not.
In performing the allocation of the acquisitions' purchase price to assets and liabilities, we consider, among other factors, the intended use of the acquired assets, analysis of past financial performance and estimates of future performance of the acquired business. At the acquisition date, a preliminary allocation of the purchase price is recorded based upon a preliminary valuation performed with the assistance of a third-party valuation specialist. We continue to review and assess our estimates, assumptions and valuation methodologies during the measurement period provided by GAAP, which ends as soon as we receive the information about facts and circumstances that existed as of the acquisition date or we learn that more information is not obtainable, which usually does not exceed one year from the date of acquisition. Accordingly, these estimates and assumptions are subject to change, which could have a material impact on our consolidated financial statements. Estimation uncertainty may exist due to the sensitivity of the respective fair value to underlying assumptions about the future performance of an acquired business in our discounted cash flow models. Significant assumptions typically include revenue growth rates and expense synergies that form the basis of the forecasted results and the discount rate.
Our goodwill and other indefinite-lived intangible assets are evaluated for impairment annually in our fiscal fourth quarter or more frequently if conditions exist that indicate that the value may be impaired. We test our goodwill for impairment at the reporting unit level, and we have identified four reporting units, which have been updated in 2020 to reflect our new segment presentation. Our reporting units identified for our goodwill testing are the NYSE, Other Exchanges, Fixed Income and Data Services, and Mortgage Technology reporting units. These impairment evaluations are performed by comparing the carrying value of the goodwill or other indefinite-lived intangibles to its estimated fair value.
In accordance with our adoption of Accounting Standards Update 2017-04, Simplifying the Test for Goodwill Impairment, or ASU-2017, for both goodwill and indefinite-lived intangible impairment testing, we have the option to first perform a qualitative assessment to determine whether it is more likely than not that the fair value of a reporting unit or indefinite-
lived intangible asset is less than its carrying amount. If the fair value of the goodwill or indefinite-lived intangible asset is less than its carrying value, an impairment loss is recognized in earnings in an amount equal to the difference. Alternatively, we may choose to bypass the qualitative option and perform quantitative testing to determine if the fair value is less than the carrying value. For our goodwill impairment testing, we have elected to bypass the qualitative assessment and apply the quantitative approach. For our testing of indefinite-lived intangible assets, we apply qualitative and quantitative approaches.
Application of the impairment test requires judgment, including the identification of reporting units, assignment of assets and liabilities to reporting units, assignment of goodwill to reporting units, and determination of the fair value of each reporting unit. We have historically determined the fair value of our reporting units based on various valuation techniques, including discounted cash flow analysis and a multiple of earnings approach. In assessing whether goodwill and other intangible assets are impaired, we must make estimates and assumptions regarding future cash flows, long-term growth rates of our business, operating margins, discount rates, weighted average cost of capital and other factors to determine the fair value of our assets. These estimates and assumptions require management’s judgment, and changes to these estimates and assumptions, as a result of changing economic and competitive conditions, could materially affect the determination of fair value and/or impairment. During 2019, we recorded an impairment charge of $31 million on the remaining value of exchange registration intangible assets on ICE Futures Singapore as a result of a decrease in fair value determined during our annual impairment testing. We did not record any impairments in 2020 as a result of our goodwill or indefinite-lived impairment testing.
We are also required to evaluate other finite-lived intangible assets for impairment by first determining whether events or changes in circumstances indicate that the carrying value of these assets to be held and used may not be recoverable. If impairment indicators are present, then an estimate of undiscounted future cash flows produced by these long-lived assets is compared to the carrying value of those assets to determine if the asset is recoverable. If an asset is not recoverable, the loss is measured as the difference between fair value and carrying value of the impaired asset. Fair value of these assets is based on various valuation techniques, including discounted cash flow analysis.
Income Taxes
We are subject to income taxes in the U.S., U.K. and other foreign jurisdictions where we operate. The determination of our provision for income taxes and related accruals, deferred tax assets and liabilities requires the use of significant judgment, estimates, and the interpretation and application of complex tax laws. We recognize a current tax liability or tax asset for the estimated taxes payable or refundable on tax returns for the current year. We recognize deferred tax assets and liabilities for the expected future tax consequences of temporary differences between the financial statement carrying amounts and the tax bases of our assets and liabilities. We establish valuation allowances if we believe that it is more likely than not that some or all of our deferred tax assets will not be realized. Deferred tax assets and liabilities are measured using current enacted tax rates in effect for the years in which those temporary differences and carryforwards are expected to reverse.
SEC Staff Accounting Bulletin No. 118, or SAB 118, provided guidance for companies that had not completed their accounting for the income tax effects of the TCJA in the period of enactment, allowing for a measurement period of up to one year after the enactment date to finalize the recording of the related tax impacts. As of December 31, 2018, we had completed our accounting for the tax effects of the enactment of the TCJA. We reaffirmed our position that we were not subject to transition tax under the TCJA as of December 31, 2017. In addition, we concluded that the $764 million of deferred tax benefit recorded in the 2017 financial statements was a reasonable estimate of the TCJA’s impact on our deferred tax and no further adjustments are necessary.
The FASB Staff also provided additional guidance to address the accounting for the effects of the provisions related to the taxation of Global Intangible Low-Taxed Income noting that companies should make an accounting policy election to recognize deferred taxes for temporary basis differences expected to reverse in future years or to include the tax expense in the year it is incurred. We have completed our analysis of the effects of these provisions and have made a policy election to recognize such taxes as current period expenses when incurred.
We do not recognize a tax benefit unless we conclude that it is more likely than not that the benefit will be sustained on audit by the taxing authority based solely on the technical merits of the associated tax position. If the recognition threshold is met, we recognize a tax benefit measured at the largest amount of the tax benefit that, in our judgment, is greater than 50 percent likely to be realized. We recognize accrued interest and penalties related to uncertain income tax positions as income tax expense in the consolidated statements of income.
We operate within multiple domestic and foreign taxing jurisdictions and are subject to audit in these jurisdictions by domestic and foreign tax authorities. These audits include questions regarding our tax filing positions, including the timing
and amount of deductions taken and the allocation of income among various tax jurisdictions. We record accruals for the estimated outcomes of these audits, and the accruals may change in the future due to new developments in each matter. At any point in time, many tax years are subject to or in the process of being audited by various taxing authorities. To the extent our estimates of settlements change or the final tax outcome of these matters is different from the amounts recorded, such differences will impact the income tax provision in the period in which such determinations are made. Our income tax expense includes changes in our estimated liability for exposures associated with our various tax filing positions. Determining the income tax expense for these potential assessments requires management to make assumptions that are subject to factors such as proposed assessments by tax authorities, changes in facts and circumstances, issuance of new regulations, and resolution of tax audits.
We believe the judgments and estimates discussed above are reasonable. However, if actual results are not consistent with our estimates or assumptions, we may be exposed to losses or gains that could be material.
ITEM 7 (A). QUANTITATIVE AND QUALITATIVE DISCLOSURES ABOUT MARKET RISK
As a result of our operating and financing activities, we are exposed to market risks such as interest rate risk, foreign currency exchange rate risk and credit risk. We have implemented policies and procedures designed to measure, manage, monitor and report risk exposures, which are regularly reviewed by the appropriate management and supervisory bodies.
Interest Rate Risk
We have exposure to market risk for changes in interest rates relating to our cash and cash equivalents, short-term and long-term restricted cash and cash equivalents, short-term and long-term investments and indebtedness. As of December 31, 2020 and 2019, our cash and cash equivalents, short-term and long-term restricted cash and cash equivalents and short-term and long-term investments were $2.0 billion and $2.2 billion, respectively, of which $245 million and $282 million, respectively, were denominated in pounds sterling, euros or Canadian dollars, and the remaining amounts are denominated in U.S. dollars. We do not use our investment portfolio for trading or other speculative purposes. A hypothetical 50% decrease in short-term interest rates would decrease annual pre-tax earnings by $5 million as of December 31, 2020, assuming no change in the amount or composition of our cash and cash equivalents and short-term and long-term restricted cash and cash equivalents.
As of December 31, 2020, we had $16.5 billion in outstanding debt, of which $12.9 billion relates to our fixed rate senior notes. The remaining amount outstanding of $3.6 billion relates to $2.4 billion outstanding under our Commercial Paper Program and $1.2 billion of floating rate senior notes, each of which bear interest at fluctuating rates, and $6 million under a line of credit at our ICE India subsidiary. A hypothetical 100 basis point increase in short-term interest rates relating to the amounts of floating rate debt outstanding as of December 31, 2020 would decrease annual pre-tax earnings by $36 million, assuming no change in the volume or composition of our outstanding indebtedness and no hedging activity. See Note 10 to our consolidated financial statements included in this Annual Report.
The interest rates on our Commercial Paper Program are currently evaluated based upon current maturities and market conditions. The weighted average interest rate on our Commercial Paper Program decreased from 1.84% as of December 31, 2019 to 0.40% as of December 31, 2020. The decrease in the Commercial Paper Program weighted average interest rate was primarily due to the decision by the U.S. Federal Reserve to decrease the federal funds short-term interest rate by 150 basis points in March 2020 due to the impact of COVID-19 on financial markets, which impacted the liquidity and pricing volatility for all commercial paper issuances. The effective interest rate of commercial paper issuances will continue to fluctuate based on the movement in short-term interest rates along with shifts in supply and demand within the commercial paper market.
Foreign Currency Exchange Rate Risk
As an international business, we are subject to foreign currency exchange rate risk. We may experience gains or losses from foreign currency transactions in the future given that a significant part of our assets and liabilities are recorded in pounds sterling, Canadian dollars or euros, and a significant portion of our revenues and expenses are recorded in pounds sterling or euros. Certain assets, liabilities, revenues and expenses of foreign subsidiaries are denominated in the local functional currency of such subsidiaries. Our exposure to foreign denominated earnings in 2020 and 2019 is presented by primary foreign currency in the following table (dollars in millions, except exchange rates):
| Year Ended December 31, 2020 | Year Ended December 31, 2019 | ||||||||||||||||||||||||||||
| Pound Sterling | Euro | Pound Sterling | Euro | ||||||||||||||||||||||||||
| Average exchange rate to the U.S. dollar in the current year | $ | 1.2832 | $ | 1.1412 | $ | 1.2769 | $ | 1.1195 | |||||||||||||||||||||
| Average exchange rate to the U.S. dollar in the prior year | $ | 1.2769 | $ | 1.1195 | $ | 1.3356 | $ | 1.1813 | |||||||||||||||||||||
| Average exchange rate increase (decrease) | — | % | 2 | % | (4) | % | (5) | % | |||||||||||||||||||||
| Foreign denominated percentage of: | |||||||||||||||||||||||||||||
| Revenues, less transaction-based expenses | 7 | % | 6 | % | 8 | % | 5 | % | |||||||||||||||||||||
| Operating expenses | 9 | % | 2 | % | 10 | % | 2 | % | |||||||||||||||||||||
| Operating income | 6 | % | 9 | % | 7 | % | 8 | % | |||||||||||||||||||||
| Impact of the currency fluctuations (1) on: | |||||||||||||||||||||||||||||
| Revenues, less transaction-based expenses | $ | 1 | $ | 6 | $ | (19) | $ | (15) | |||||||||||||||||||||
| Operating expenses | $ | 1 | $ | 1 | $ | (11) | $ | (3) | |||||||||||||||||||||
| Operating income | $ | — | $ | 5 | $ | (8) | $ | (12) |
(1) Represents the impact of currency fluctuation for the year compared to the same period in the prior year.
We have a significant part of our assets, liabilities, revenues and expenses recorded in pounds sterling or euros. In both 2020 and 2019, 13% of our consolidated revenues, less transaction-based expenses, were denominated in pounds sterling or euros, and in 2020 and 2019, 11% and 12%, respectively, of our consolidated operating expenses were denominated in pounds sterling or euros. As the pound sterling or euro exchange rate changes, the U.S. equivalent of revenues and expenses denominated in foreign currencies changes accordingly.
Foreign currency transaction risk related to the settlement of foreign currency denominated assets, liabilities and payables occurs through our operations, which are received in or paid in pounds sterling, Canadian dollars, or euros, due to the increase or decrease in the foreign currency exchange rates between periods. We incurred foreign currency transaction losses of $5 million in both 2020 and 2019 inclusive of the impact of foreign currency hedging transactions. The foreign currency transaction gains/(losses) were primarily attributable to the fluctuations of the pound sterling and euro relative to the U.S. dollar. A 10% adverse change in the underlying foreign currency exchange rates as of December 31, 2020, assuming no change in the composition of the foreign currency denominated assets, liabilities and payables and assuming no hedging activity, would result in a foreign currency loss of $15 million.
We entered into foreign currency hedging transactions during 2020 and 2019 as economic hedges to help mitigate a portion of our foreign exchange risk exposure and may enter into additional hedging transactions in the future to help mitigate our foreign exchange risk exposure. Although we may enter into additional hedging transactions in the future, these hedging arrangements may not be effective, particularly in the event of imprecise forecasts of the levels of our non-U.S. denominated assets and liabilities.
We have foreign currency translation risk equal to our net investment in our foreign subsidiaries. The financial statements of these subsidiaries are translated into U.S. dollars using a current rate of exchange, with gains or losses included in the cumulative translation adjustment account, a component of equity. Our exposure to the net investment in foreign currencies is presented by primary foreign currencies in the table below (in millions):
| As of December 31, 2020 | |||||||||||||||||
| Position in pounds sterling | Position in Canadian dollars | Position in euros | |||||||||||||||
| Assets | £ | 761 | C$ | 1,359 | € | 147 | |||||||||||
| of which goodwill represents | 589 | 403 | 92 | ||||||||||||||
| Liabilities | 86 | 960 | 46 | ||||||||||||||
| Net currency position | £ | 675 | C$ | 399 | € | 101 | |||||||||||
| Net currency position, in $USD | $ | 922 | $ | 313 | $ | 123 | |||||||||||
| Negative impact on consolidated equity of a 10% decrease in foreign currency exchange rates | $ | 92 | $ | 31 | $ | 12 |
Foreign currency translation adjustments are included as a component of accumulated other comprehensive income/(loss) within our balance sheet. See the table below for the portion of equity attributable to foreign currency translation adjustments as well as the activity by year included within our statement of other comprehensive income. The impact of
the foreign currency exchange rate differences in the table below were primarily driven by fluctuations of the pound sterling as compared to the U.S. dollar which were 1.3665, 1.3260 and 1.2756 as of December 31, 2020, 2019, and 2018, respectively.
| Changes in Accumulated Other Comprehensive Income/ (Loss) from Foreign Currency Translation Adjustments (in millions) | ||||||||
| Balance, as of January 1, 2018 | $ | (136) | ||||||
| Net current period other comprehensive income/(loss) | (91) | |||||||
| Balance, as of December 31, 2018 | (227) | |||||||
| Net current period other comprehensive income/(loss) | 50 | |||||||
| Balance, as of December 31, 2019 | (177) | |||||||
| Net current period other comprehensive income/(loss) | 43 | |||||||
| Balance, as of December 31, 2020 | $ | (134) |
The future impact on our business relating to the U.K. leaving the EU and the corresponding regulatory changes are uncertain at this time, including future impacts on currency exchange rates.
Credit Risk
We are exposed to credit risk in our operations in the event of a counterparty default. We limit our exposure to credit risk by rigorously selecting the counterparties with which we make our investments, monitoring them on an ongoing basis and executing agreements to protect our interests.
Clearing House Cash Deposit Risks
The ICE Clearing Houses hold material amounts of clearing member cash and cash equivalent deposits which are held or invested primarily to provide security of capital while minimizing credit, market and liquidity risks. Refer to Note 14 to our consolidated financial statements for more information on the ICE Clearing Houses' cash and cash equivalent deposits, which were $84.1 billion as of December 31, 2020. While we seek to achieve a reasonable rate of return which may generate interest income for our clearing members, we are primarily concerned with preservation of capital and managing the risks associated with these deposits. As the ICE Clearing Houses may pass on interest revenues (minus costs) to the clearing members, this could include negative or reduced yield due to market conditions. The following is a summary of the risks associated with these deposits and how these risks are mitigated:
- Credit Risk: When a clearing house has the ability to hold cash collateral at a central bank, the clearing house utilizes its access to the central bank system to minimize credit risk exposures. Credit risk is managed by using exposure limits depending on the credit profile of the counterparty as well as the nature and maturity of transactions. Our investment objective is to invest in securities that preserve principal while maximizing yields, without significantly increasing risk. We seek to substantially mitigate the credit risk associated with investments by placing them with governments, well-capitalized financial institutions and other creditworthy counterparties.
An ongoing review is performed to evaluate changes in the financial status of counterparties. In addition to the intrinsic creditworthiness of counterparties, our policies require diversification of counterparties (banks, financial institutions, bond issuers and funds) so as to avoid a concentration of risk.
-
Liquidity Risk: Liquidity risk is the risk a clearing house may not be able to meet its payment obligations in the right currency, in the right place and at the right time. To mitigate this risk, the clearing houses monitor liquidity requirements closely and maintain funds and assets in a manner which minimizes the risk of loss or delay in the access by the clearing house to such funds and assets. For example, holding funds with a central bank where possible or making only short term investments such as overnight reverse repurchase agreements serves to reduce liquidity risks.
-
Interest Rate Risk: Interest rate risk is the risk that interest rates rise and cause the value of securities we hold or invest in to decline. If we were required to sell securities prior to maturity, and interest rates had risen, the sale might be made at a loss relative to the carrying value. Our clearing houses seek to manage this risk by making short term investments. For example, where possible and in accordance with regulatory requirements, the clearing houses invest
cash pursuant to overnight reverse repurchase agreements or term reverse repurchase agreements with short dated maturities. In addition, the clearing house investment guidelines allow for direct purchases of high quality sovereign debt (for example, U.S. Treasury securities) and supranational debt instruments (Euro cash deposits only) with short dated maturities.
-
Security Issuer Risk: Security issuer risk is the risk that an issuer of a security defaults on the payment when the security matures or debt is serviced. This risk is mitigated by limiting allowable investments under the reverse repurchase agreements to high quality sovereign or government agency debt and limiting any direct investments to high quality sovereign debt instruments.
-
Investment Counterparty Risk: Investment counterparty risk is the risk that a reverse repurchase agreement counterparty might become insolvent and, thus, fail to meet its obligations to our clearing houses. We mitigate this risk by only engaging in transactions with high credit quality counterparties and by limiting the acceptable collateral to securities of high quality issuers. When engaging in reverse repurchase agreements, our clearing houses take delivery of the securities underlying the reverse repurchase arrangement in custody accounts under clearing house control. Additionally, the securities purchased subject to reverse repurchase have a market value greater than the reverse repurchase amount. The typical haircut for high quality sovereign debt is 2% of the reverse repurchase amount which provides additional excess collateral. Thus, in the event that a reverse repurchase counterparty defaults on its obligation to repurchase the underlying reverse repurchase securities, our clearing house will have possession of a security with a value potentially greater than the counterparty’s obligation.
The ICE Clearing Houses may use third-party investment advisors who make investments subject to the guidelines provided by each clearing house. Such advisors do not hold clearing member cash or cash equivalent deposits or the underlying investments. Clearing house property is held in custody accounts under clearing house control with credit worthy custodians including JPMorgan Chase Bank N.A., Citibank N.A., BNY Mellon, BMO Harris N.A. and Euroclear Bank Brussels (for non-U.S. dollar deposits). The ICE Clearing Houses employ (or may employ) multiple investment advisors and custodians to ensure that in the event a single advisor or custodian is unable to fulfill its role, additional advisors or custodians are available as alternatives.
- Cross-Currency Margin Deposit Risk: Each of the ICE Clearing Houses may permit posting of cross-currency collateral to satisfy margin requirements (for example, accepting margin deposits denominated in U.S. dollars to secure a Euro margin obligation). The ICE Clearing Houses mitigate the risk of a currency value exposure by applying a “haircut” to the currency posted as margin at a level viewed as sufficient to provide financial protection during periods of currency volatility. Cross-currency balances are marked-to-market on a daily basis. Should the currency posted to satisfy margin requirements decline in value, the clearing member is required to increase its margin deposit on a same-day basis.
Impact of Inflation
We have not been adversely affected by inflation as technological advances and competition have generally caused prices for the hardware and software that we use for our electronic platforms to remain constant. In the event of inflation, we believe that we will be able to pass on any price increases to our participants, as the prices that we charge are not governed by long-term contracts.
Previous: Item 6. SELECTED FINANCIAL DATA · Next: Item 8. FINANCIAL STATEMENTS AND SUPPLEMENTARY DATA