 filings.tools
Item 8. FINANCIAL STATEMENTS AND SUPPLEMENTARY DATA
302K characters. Original on sec.gov · Markdown
Item 8. FINANCIAL STATEMENTS AND SUPPLEMENTARY DATA
INDEX TO CONSOLIDATED FINANCIAL STATEMENTS
REPORT OF MANAGEMENT ON INTERNAL CONTROL OVER FINANCIAL REPORTING
Our management is responsible for the preparation and integrity of the consolidated financial statements appearing in our Annual Report on Form 10-K. The financial statements were prepared in conformity with generally accepted accounting principles appropriate in the circumstances and, accordingly, include certain amounts based on our best judgments and estimates.
Our management is responsible for establishing and maintaining adequate internal control over financial reporting as such term is defined in Rule 13a-15(f) and 15d-a5(f) under the Securities Exchange Act of 1934 (“Exchange Act”). Our internal control over financial reporting is designed to provide reasonable assurance regarding the reliability of financial reporting and the preparation of the consolidated financial statements. Our internal control over financial reporting is supported by a program of internal audits and appropriate reviews by management, written policies and guidelines, careful selection and training of qualified personnel and a written Global Code of Business Conduct adopted by our Board of Directors, applicable to all of our directors and all officers and all of our employees.
Because of its inherent limitations, internal control over financial reporting may not prevent or detect misstatements and even when determined to be effective, can only provide reasonable assurance with respect to financial statement preparation and presentation. Also, projections of any evaluation of effectiveness to future periods are subject to the risk that controls may become inadequate because of changes in conditions, or that the degree of compliance with the policies or procedures may deteriorate.
Management assessed the effectiveness of our internal control over financial reporting as of December 31, 2023. In making this assessment, management used the criteria set forth by the Committee of Sponsoring Organizations of the Treadway Commission (“COSO”) in Internal Control - Integrated Framework (2013 framework). Based on our assessment, management believes that we maintained effective internal control over financial reporting as of December 31, 2023.
Our assessment of and conclusion on the effectiveness of internal control over financial reporting did not include the internal controls over the operations of Black Knight, Inc., or Black Knight, which is included in our 2023 consolidated financial statements and constituted $14.6 billion and $13.2 billion of our total and net assets, respectively, as of December 31, 2023, and $363 million and ($214 million) of revenues, less transaction-based expenses and net income, respectively, for the year then ended.
Our independent auditors, Ernst & Young LLP, a registered public accounting firm, are appointed by the Audit Committee, subject to ratification by our stockholders. Ernst & Young LLP has audited and reported on our consolidated financial statements and the effectiveness of our internal control over financial reporting. The reports of our independent registered public accounting firm are contained in this Annual Report.
| /s/ Jeffrey C. Sprecher | /s/ A. Warren Gardiner | |||||||
| Jeffrey C. Sprecher | A. Warren Gardiner | |||||||
| Chair and Chief Executive Officer | Chief Financial Officer | |||||||
| February 8, 2024 | February 8, 2024 |
REPORT OF INDEPENDENT REGISTERED PUBLIC ACCOUNTING FIRM
ON INTERNAL CONTROL OVER FINANCIAL REPORTING
To the Stockholders and the Board of Directors of Intercontinental Exchange, Inc.
Opinion on Internal Control over Financial Reporting
We have audited Intercontinental Exchange, Inc. and Subsidiaries’ internal control over financial reporting as of December 31, 2023, based on criteria established in Internal Control-Integrated Framework issued by the Committee of Sponsoring Organizations of the Treadway Commission (2013 framework) (the COSO criteria). In our opinion, Intercontinental Exchange, Inc. and Subsidiaries (the Company) maintained, in all material respects, effective internal control over financial reporting as of December 31, 2023, based on the COSO criteria.
As indicated in the accompanying Report of Management on Internal Control over Financial Reporting, management’s assessment of and conclusion on the effectiveness of internal control over financial reporting did not include the internal controls of Black Knight, Inc. (Black Knight), which is included in the 2023 consolidated financial statements of the Company and constituted $14.6 billion and $13.2 billion of total and net assets, respectively as of December 31, 2023 and $363 million and ($214 million) of revenues, less transaction-based expenses and net income, respectively, for the year then ended. Our audit of internal control over financial reporting of the Company also did not include an evaluation of the internal control over financial reporting of Black Knight.
We also have audited, in accordance with the standards of the Public Company Accounting Oversight Board (United States) (PCAOB), the consolidated balance sheets of the Company as of December 31, 2023 and 2022, the related consolidated statements of income, comprehensive income, changes in equity and redeemable non-controlling interest, and cash flows for each of the three years in the period ended December 31, 2023, and the related notes, and our report dated February 8, 2024 expressed an unqualified opinion thereon.
Basis for Opinion
The Company’s management is responsible for maintaining effective internal control over financial reporting and for its assessment of the effectiveness of internal control over financial reporting included in the accompanying “Report of Management on Internal Control over Financial Reporting”. Our responsibility is to express an opinion on the Company’s internal control over financial reporting based on our audit. We are a public accounting firm registered with the PCAOB and are required to be independent with respect to the Company in accordance with the U.S. federal securities laws and the applicable rules and regulations of the Securities and Exchange Commission and the PCAOB.
We conducted our audit in accordance with the standards of the PCAOB. Those standards require that we plan and perform the audit to obtain reasonable assurance about whether effective internal control over financial reporting was maintained in all material respects.
Our audit included obtaining an understanding of internal control over financial reporting, assessing the risk that a material weakness exists, testing and evaluating the design and operating effectiveness of internal control based on the assessed risk, and performing such other procedures as we considered necessary in the circumstances. We believe that our audit provides a reasonable basis for our opinion.
Definition and Limitations of Internal Control over Financial Reporting
A company’s internal control over financial reporting is a process designed to provide reasonable assurance regarding the reliability of financial reporting and the preparation of financial statements for external purposes in accordance with generally accepted accounting principles. A company’s internal control over financial reporting includes those policies and procedures that (1) pertain to the maintenance of records that, in reasonable detail, accurately and fairly reflect the transactions and dispositions of the assets of the company; (2) provide reasonable assurance that transactions are recorded as necessary to permit preparation of financial statements in accordance with generally accepted accounting principles, and that receipts and expenditures of the company are being made only in accordance with authorizations of management and directors of the company; and (3) provide reasonable assurance regarding prevention or timely detection of unauthorized acquisition, use, or disposition of the company’s assets that could have a material effect on the financial statements.
Because of its inherent limitations, internal control over financial reporting may not prevent or detect misstatements. Also, projections of any evaluation of effectiveness to future periods are subject to the risk that controls may become inadequate because of changes in conditions, or that the degree of compliance with the policies or procedures may deteriorate.
/s/ Ernst & Young LLP
New York, New York
February 8, 2024
REPORT OF INDEPENDENT REGISTERED PUBLIC ACCOUNTING FIRM
ON THE FINANCIAL STATEMENTS
To the Stockholders and the Board of Directors of Intercontinental Exchange, Inc.
Opinion on the Financial Statements
We have audited the accompanying consolidated balance sheets of Intercontinental Exchange, Inc. and Subsidiaries (the Company) as of December 31, 2023 and 2022, the related consolidated statements of income, comprehensive income, changes in equity and redeemable non-controlling interest, and cash flows for each of the three years in the period ended December 31, 2023, and the related notes (collectively referred to as the “consolidated financial statements”). In our opinion, the consolidated financial statements present fairly, in all material respects, the financial position of the Company at December 31, 2023 and 2022, and the results of its operations and its cash flows for each of the three years in the period ended December 31, 2023, in conformity with U.S. generally accepted accounting principles.
We also have audited, in accordance with the standards of the Public Company Accounting Oversight Board (United States) (PCAOB), the Company’s internal control over financial reporting as of December 31, 2023, based on criteria established in Internal Control-Integrated Framework issued by the Committee of Sponsoring Organizations of the Treadway Commission (2013 framework), and our report dated February 8, 2024 expressed an unqualified opinion thereon.
Basis for Opinion
These financial statements are the responsibility of the Company’s management. Our responsibility is to express an opinion on the Company’s financial statements based on our audits. We are a public accounting firm registered with the PCAOB and are required to be independent with respect to the Company in accordance with the U.S. federal securities laws and the applicable rules and regulations of the Securities and Exchange Commission and the PCAOB.
We conducted our audits in accordance with the standards of the PCAOB. Those standards require that we plan and perform the audit to obtain reasonable assurance about whether the financial statements are free of material misstatement, whether due to error or fraud. Our audits included performing procedures to assess the risks of material misstatement of the financial statements, whether due to error or fraud, and performing procedures that respond to those risks. Such procedures included examining, on a test basis, evidence regarding the amounts and disclosures in the financial statements. Our audits also included evaluating the accounting principles used and significant estimates made by management, as well as evaluating the overall presentation of the financial statements. We believe that our audits provide a reasonable basis for our opinion.
Critical Audit Matters
The critical audit matters communicated below are matters arising from the current period audit of the financial statements that were communicated or required to be communicated to the audit committee and that: (1) relate to accounts or disclosures that are material to the financial statements and (2) involved our especially challenging, subjective or complex judgments. The communication of the critical audit matters does not alter in any way our opinion on the consolidated financial statements, taken as a whole, and we are not, by communicating the critical audit matters below, providing separate opinions on the critical audit matters or on the accounts or disclosures to which they relate.
Accounting for Business Combinations
Description of the Matter As discussed in Note 3 to the consolidated financial statements, during 2023, the Company completed its acquisition of Black Knight, Inc. (Black Knight) for aggregate consideration of $11.8 billion. This transaction was accounted for as a business combination.
Auditing the Company's accounting for its acquisition of Black Knight was complex due to the significant estimation in the Company’s determination of fair value of identified intangible assets of $4.9 billion, which principally consisted of customer relationships, trademark/tradenames, developed technology, data and databases and in-process research and
development (collectively referred to as the identified intangibles). The significant estimation was primarily due to sensitivity of the fair value to underlying assumptions about future performance of the acquired business in the Company’s discounted cash flow models used to measure the identified intangibles. The most significant of these assumptions included the revenue and margin growth rates that form the basis of the forecasted results and the discount rate.
How We Addressed the
Matter in Our Audit 0000 We obtained an understanding, evaluated the design and tested the operating effectiveness of the Company's controls that address the risk of material misstatement relating to the Company's accounting for the acquisition, including the estimated fair value of identified intangible assets. For example, we tested controls over management’s review of significant assumptions used in its respective valuation models of the identified intangibles.
To test the estimated fair value of the identified intangibles, we performed audit procedures that included, among others, evaluating the valuation methodology and significant assumptions used by the Company's valuation specialist, and evaluating the completeness and accuracy of the underlying data supporting the estimated fair value. We involved our valuation specialists to assist with our assessment of the appropriateness of the valuation methodology applied by the Company and significant assumptions included in the fair value estimate, including testing the revenue and margin growth rates that form the basis of the forecasted results and the discount rate. For example, we compared these significant assumptions to current industry, market and economic trends, assumptions used to value similar assets in other acquisitions, historical results of the acquired business, and the Company’s budgets and forecasts. In addition, we performed sensitivity analysis over those assumptions. We also evaluated the adequacy of the Company’s disclosures included in Note 3 in relation to these acquisition matters.
Accounting for Income Taxes
Description of the Matter As discussed in Note 13 to the consolidated financial statements, the Company operates globally and files income tax returns in the U.S. and in various state, local and foreign jurisdictions. Uncertainty in a tax position may arise because tax laws and rulings are subject to interpretation in each jurisdiction. The Company uses significant judgment to (1) determine whether, based on the technical merits, a tax position is more likely than not to be sustained and (2) measure the amount of tax benefit that qualifies for recognition. As of December 31, 2023, the total amount of unrecognized tax benefits was $268 million, of which $228 million, if recognized, would impact the Company's effective tax rate.
Auditing management's analysis of the Company's uncertain tax positions and the related unrecognized tax benefits was challenging as the analysis involved significant judgment due to the complex interpretations and application of tax laws and rulings.
How We Addressed the
Matter in Our Audit We obtained an understanding, evaluated the design and tested the operating effectiveness of the controls related to management's accounting for uncertain tax positions. For example, we tested controls relating to the completeness of management’s identification of uncertain tax positions and the application of the recognition and measurement principles, including management's review of the inputs and calculations of unrecognized tax benefits.
Our audit procedures included, among others, testing management's assessment of which uncertain tax positions are more likely than not to be sustained and the measurement of the amount of tax benefit that is more likely than not to be realized. To test management's assessment, we performed procedures that included, among others, evaluating management's analysis by jurisdiction, including any communications with taxing authorities, tax controversy and litigation trends, and the technical merits of the uncertain tax positions. We involved our tax professionals with specialized skill and knowledge to evaluate the recognition of the uncertain tax positions and the measurement of the unrecognized tax benefit based on the relevant tax laws, rulings and guidance issued by taxing authorities, as
well as their experience with the taxing authorities. We also evaluated the adequacy of the Company’s disclosures included in Note 13 in relation to these tax matters.
/s/ Ernst & Young LLP
We have served as the Company’s auditor since 2002.
New York, New York
February 8, 2024
Intercontinental Exchange, Inc. and Subsidiaries
Consolidated Balance Sheets
(In millions, except per share amounts)
| As of December 31, | |||||||||||
| 2023 | 2022 | ||||||||||
| Assets: | |||||||||||
| Current assets: | |||||||||||
| Cash and cash equivalents | $ | 899 | $ | 1,799 | |||||||
| Short-term restricted cash and cash equivalents | 531 | 6,149 | |||||||||
| Restricted short-term investments | 680 | — | |||||||||
| Cash and cash equivalent margin deposits and guaranty funds | 78,980 | 141,990 | |||||||||
| Invested deposits, delivery contracts receivable and unsettled variation margin | 1,814 | 5,382 | |||||||||
| Customer accounts receivable, net of allowance for doubtful accounts of $21 and $22, respectively | 1,366 | 1,169 | |||||||||
| Prepaid expenses and other current assets | 703 | 458 | |||||||||
| Total current assets | 84,973 | 156,947 | |||||||||
| Property and equipment, net | 1,923 | 1,767 | |||||||||
| Other non-current assets: | |||||||||||
| Goodwill | 30,553 | 21,111 | |||||||||
| Other intangible assets, net | 17,317 | 13,090 | |||||||||
| Long-term restricted cash and cash equivalents | 340 | 405 | |||||||||
| Other non-current assets | 978 | 1,018 | |||||||||
| Total other non-current assets | 49,188 | 35,624 | |||||||||
| Total assets | $ | 136,084 | $ | 194,338 | |||||||
| Liabilities and Equity: | |||||||||||
| Current liabilities: | |||||||||||
| Accounts payable and accrued liabilities | $ | 1,003 | $ | 866 | |||||||
| Section 31 fees payable | 79 | 223 | |||||||||
| Accrued salaries and benefits | 459 | 352 | |||||||||
| Deferred revenue | 200 | 170 | |||||||||
| Short-term debt | 1,954 | 4 | |||||||||
| Margin deposits and guaranty funds | 78,980 | 141,990 | |||||||||
| Invested deposits, delivery contracts payable and unsettled variation margin | 1,814 | 5,382 | |||||||||
| Other current liabilities | 137 | 184 | |||||||||
| Total current liabilities | 84,626 | 149,171 | |||||||||
| Non-current liabilities: | |||||||||||
| Non-current deferred tax liability, net | 4,080 | 3,493 | |||||||||
| Long-term debt | 20,659 | 18,118 | |||||||||
| Accrued employee benefits | 193 | 160 | |||||||||
| Non-current operating lease liability | 299 | 254 | |||||||||
| Other non-current liabilities | 441 | 381 | |||||||||
| Total non-current liabilities | 25,672 | 22,406 | |||||||||
| Total liabilities | 110,298 | 171,577 | |||||||||
| Commitments and contingencies | |||||||||||
| Equity: | |||||||||||
| Intercontinental Exchange, Inc. stockholders’ equity: | |||||||||||
| Preferred stock, $0.01 par value; 100 shares authorized; none issued or outstanding | — | — | |||||||||
| Common stock, $0.01 par value; 1,500 authorized; 649 and 573 shares issued and outstanding at December 31, 2023, respectively, and 634 and 559 shares issued and outstanding at December 31, 2022, respectively | 6 | 6 | |||||||||
| Treasury stock, at cost; 76 and 75 shares at December 31, 2023 and December 31, 2022, respectively | (6,304) | (6,225) | |||||||||
| Additional paid-in capital | 15,953 | 14,313 | |||||||||
| Retained earnings | 16,356 | 14,943 | |||||||||
| Accumulated other comprehensive loss | (294) | (331) | |||||||||
| Total Intercontinental Exchange, Inc. stockholders’ equity | 25,717 | 22,706 | |||||||||
| Non-controlling interest in consolidated subsidiaries | 69 | 55 | |||||||||
| Total equity | 25,786 | 22,761 | |||||||||
| Total liabilities and equity | $ | 136,084 | $ | 194,338 |
See accompanying notes.
Intercontinental Exchange, Inc. and Subsidiaries
Consolidated Statements of Income
(In millions, except per share amounts)
| Year Ended December 31, | ||||||||||||||||||||
| 2023 | 2022 | 2021 | ||||||||||||||||||
| Revenues: | ||||||||||||||||||||
| Exchanges | $ | 6,355 | $ | 6,415 | $ | 5,878 | ||||||||||||||
| Fixed income and data services | 2,231 | 2,092 | 1,883 | |||||||||||||||||
| Mortgage technology | 1,317 | 1,129 | 1,407 | |||||||||||||||||
| Total revenues | 9,903 | 9,636 | 9,168 | |||||||||||||||||
| Transaction-based expenses: | ||||||||||||||||||||
| Section 31 fees | 293 | 499 | 248 | |||||||||||||||||
| Cash liquidity payments, routing and clearing | 1,622 | 1,845 | 1,774 | |||||||||||||||||
| Total revenues, less transaction-based expenses | 7,988 | 7,292 | 7,146 | |||||||||||||||||
| Operating expenses: | ||||||||||||||||||||
| Compensation and benefits | 1,595 | 1,407 | 1,462 | |||||||||||||||||
| Professional services | 123 | 131 | 159 | |||||||||||||||||
| Acquisition-related transaction and integration costs | 269 | 93 | 102 | |||||||||||||||||
| Technology and communication | 734 | 683 | 666 | |||||||||||||||||
| Rent and occupancy | 92 | 83 | 84 | |||||||||||||||||
| Selling, general and administrative | 266 | 226 | 215 | |||||||||||||||||
| Depreciation and amortization | 1,215 | 1,031 | 1,009 | |||||||||||||||||
| Total operating expenses | 4,294 | 3,654 | 3,697 | |||||||||||||||||
| Operating income | 3,694 | 3,638 | 3,449 | |||||||||||||||||
| Other income/(expense): | ||||||||||||||||||||
| Interest income | 319 | 108 | 1 | |||||||||||||||||
| Interest expense | (808) | (616) | (423) | |||||||||||||||||
| Other income/(expense), net | (311) | (1,322) | 2,671 | |||||||||||||||||
| Total other income/(expense), net | (800) | (1,830) | 2,249 | |||||||||||||||||
| Income before income tax expense | 2,894 | 1,808 | 5,698 | |||||||||||||||||
| Income tax expense | 456 | 310 | 1,629 | |||||||||||||||||
| Net income | $ | 2,438 | $ | 1,498 | $ | 4,069 | ||||||||||||||
| Net income attributable to non-controlling interest | (70) | (52) | (11) | |||||||||||||||||
| Net income attributable to Intercontinental Exchange, Inc. | $ | 2,368 | $ | 1,446 | $ | 4,058 | ||||||||||||||
| Earnings per share attributable to Intercontinental Exchange, Inc. common stockholders: | ||||||||||||||||||||
| Basic | $ | 4.20 | $ | 2.59 | $ | 7.22 | ||||||||||||||
| Diluted | $ | 4.19 | $ | 2.58 | $ | 7.18 | ||||||||||||||
| Weighted average common shares outstanding: | ||||||||||||||||||||
| Basic | 564 | 559 | 562 | |||||||||||||||||
| Diluted | 565 | 561 | 565 |
See accompanying notes.
Intercontinental Exchange, Inc. and Subsidiaries
Consolidated Statements of Comprehensive Income
(In millions)
| Year Ended December 31, | |||||||||||||||||
| 2023 | 2022 | 2021 | |||||||||||||||
| Net income | $ | 2,438 | $ | 1,498 | $ | 4,069 | |||||||||||
| Other comprehensive income/(loss): | |||||||||||||||||
| Foreign currency translation adjustments, net of tax benefit | 48 | (128) | (16) | ||||||||||||||
| Change in equity method investment, net of tax expense | — | — | 1 | ||||||||||||||
| Employee benefit plan net gains/(losses), net of tax benefit/(expense) | (11) | (7) | 11 | ||||||||||||||
| Other comprehensive income/(loss) | 37 | (135) | (4) | ||||||||||||||
| Comprehensive income | $ | 2,475 | $ | 1,363 | $ | 4,065 | |||||||||||
| Comprehensive income attributable to non-controlling interest | (70) | (52) | (11) | ||||||||||||||
| Comprehensive income attributable to Intercontinental Exchange, Inc. | $ | 2,405 | $ | 1,311 | $ | 4,054 |
See accompanying notes.
Intercontinental Exchange, Inc. and Subsidiaries
Consolidated Statements of Changes in Equity and Redeemable Non-Controlling Interest
(In millions)
| Intercontinental Exchange, Inc. Stockholders' Equity | Non- Controlling Interest in Consolidated Subsidiaries | Total Equity | Redeemable Non-controlling Interest | ||||||||||||||||||||||||||||||||||||||||||||||||||||||||
| Common Stock | Treasury Stock | Additional Paid-in Capital | Retained Earnings | Accumulated Other Comprehensive Income/(Loss) | |||||||||||||||||||||||||||||||||||||||||||||||||||||||
| Shares | Value | Shares | Value | ||||||||||||||||||||||||||||||||||||||||||||||||||||||||
| Balance, as of December 31, 2020 | 629 | $ | 6 | (68) | $ | (5,200) | $ | 13,845 | $ | 11,039 | $ | (192) | $ | 36 | $ | 19,534 | $ | 93 | |||||||||||||||||||||||||||||||||||||||||
| Other comprehensive loss | — | — | — | — | — | — | (4) | — | (4) | — | |||||||||||||||||||||||||||||||||||||||||||||||||
| Exercise of common stock options | — | — | — | — | 17 | — | — | — | 17 | — | |||||||||||||||||||||||||||||||||||||||||||||||||
| Repurchases of common stock | — | — | (1) | (250) | — | — | — | — | (250) | — | |||||||||||||||||||||||||||||||||||||||||||||||||
| Payments relating to treasury shares | — | — | (1) | (70) | — | — | — | — | (70) | — | |||||||||||||||||||||||||||||||||||||||||||||||||
| Stock-based compensation | — | — | — | — | 168 | — | — | — | 168 | 27 | |||||||||||||||||||||||||||||||||||||||||||||||||
| Issuance under the employee stock purchase plan | — | — | — | — | 42 | — | — | — | 42 | — | |||||||||||||||||||||||||||||||||||||||||||||||||
| Issuance of restricted stock | 2 | — | — | — | — | — | — | — | — | — | |||||||||||||||||||||||||||||||||||||||||||||||||
| Distributions of profits | — | — | — | — | — | — | — | (21) | (21) | — | |||||||||||||||||||||||||||||||||||||||||||||||||
| Dividends paid to stockholders | — | — | — | — | — | (747) | — | — | (747) | — | |||||||||||||||||||||||||||||||||||||||||||||||||
| Bakkt deconsolidation adjustment | — | — | — | — | (3) | — | — | — | (3) | (107) | |||||||||||||||||||||||||||||||||||||||||||||||||
| Net income attributable to non-controlling interest | — | — | — | — | — | (11) | — | 24 | 13 | (13) | |||||||||||||||||||||||||||||||||||||||||||||||||
| Net income | — | — | — | — | — | 4,069 | — | — | 4,069 | — | |||||||||||||||||||||||||||||||||||||||||||||||||
| Balance, as of December 31, 2021 | 631 | $ | 6 | (70) | $ | (5,520) | $ | 14,069 | $ | 14,350 | $ | (196) | $ | 39 | $ | 22,748 | $ | — | |||||||||||||||||||||||||||||||||||||||||
| Other comprehensive loss | — | — | — | — | — | — | (135) | — | (135) | — | |||||||||||||||||||||||||||||||||||||||||||||||||
| Exercise of common stock options | — | — | — | — | 22 | — | — | — | 22 | — | |||||||||||||||||||||||||||||||||||||||||||||||||
| Repurchases of common stock | — | — | (4) | (632) | — | — | — | — | (632) | — | |||||||||||||||||||||||||||||||||||||||||||||||||
| Payments relating to treasury shares | — | — | (1) | (73) | — | — | — | — | (73) | — | |||||||||||||||||||||||||||||||||||||||||||||||||
| Stock-based compensation | — | — | — | — | 172 | — | — | — | 172 | — | |||||||||||||||||||||||||||||||||||||||||||||||||
| Issuance under the employee stock purchase plan | 1 | — | — | — | 50 | — | — | — | 50 | — | |||||||||||||||||||||||||||||||||||||||||||||||||
| Issuance of restricted stock | 2 | — | — | — | — | — | — | — | — | — | |||||||||||||||||||||||||||||||||||||||||||||||||
| Distributions of profits | — | — | — | — | — | — | — | (36) | (36) | — | |||||||||||||||||||||||||||||||||||||||||||||||||
| Dividends paid to stockholders | — | — | — | — | — | (853) | — | — | (853) | — | |||||||||||||||||||||||||||||||||||||||||||||||||
| Net income/(loss) attributable to non-controlling interest | — | — | — | — | — | (52) | — | 52 | — | — | |||||||||||||||||||||||||||||||||||||||||||||||||
| Net income | — | — | — | — | — | 1,498 | — | — | 1,498 | — | |||||||||||||||||||||||||||||||||||||||||||||||||
| Balance, as of December 31, 2022 | 634 | $ | 6 | (75) | $ | (6,225) | $ | 14,313 | $ | 14,943 | $ | (331) | $ | 55 | $ | 22,761 | $ | — | |||||||||||||||||||||||||||||||||||||||||
| Other comprehensive loss | — | — | — | — | — | — | 37 | — | 37 | — | |||||||||||||||||||||||||||||||||||||||||||||||||
| Stock consideration issued for acquisition | 11 | 1,274 | 1,274 | ||||||||||||||||||||||||||||||||||||||||||||||||||||||||
| Exercise of common stock options | 1 | — | — | — | 30 | — | — | — | 30 | — | |||||||||||||||||||||||||||||||||||||||||||||||||
| Payments relating to treasury shares | — | — | (1) | (79) | — | — | — | — | (79) | — | |||||||||||||||||||||||||||||||||||||||||||||||||
| Stock-based compensation | — | — | — | — | 293 | — | — | — | 293 | — | |||||||||||||||||||||||||||||||||||||||||||||||||
| Issuance under the employee stock purchase plan | 1 | — | — | — | 43 | — | — | — | 43 | — | |||||||||||||||||||||||||||||||||||||||||||||||||
| Contribution from equity partners | — | — | — | — | — | — | — | 9 | 9 | — | |||||||||||||||||||||||||||||||||||||||||||||||||
| Issuance of restricted stock | 2 | — | — | — | — | — | — | — | — | — | |||||||||||||||||||||||||||||||||||||||||||||||||
| Distributions of profits | — | — | — | — | — | — | — | (65) | (65) | — | |||||||||||||||||||||||||||||||||||||||||||||||||
| Dividends paid to stockholders | — | — | — | — | — | (955) | — | — | (955) | — | |||||||||||||||||||||||||||||||||||||||||||||||||
| Net income/(loss) attributable to non-controlling interest | — | — | — | — | — | (70) | — | 70 | — | — | |||||||||||||||||||||||||||||||||||||||||||||||||
| Net income | — | — | — | — | — | 2,438 | — | — | 2,438 | — | |||||||||||||||||||||||||||||||||||||||||||||||||
| Balance, as of December 31, 2023 | 649 | $ | 6 | (76) | $ | (6,304) | $ | 15,953 | $ | 16,356 | $ | (294) | $ | 69 | $ | 25,786 | $ | — |
See accompanying notes.
Intercontinental Exchange, Inc. and Subsidiaries
Consolidated Statements of Cash Flows
(In millions)
| Year Ended December 31, | ||||||||||||||||||||
| 2023 | 2022 | 2021 | ||||||||||||||||||
| Operating activities: | ||||||||||||||||||||
| Net income | $ | 2,438 | $ | 1,498 | $ | 4,069 | ||||||||||||||
| Adjustments to reconcile net income to net cash provided by operating activities: | ||||||||||||||||||||
| Depreciation and amortization | 1,215 | 1,031 | 1,009 | |||||||||||||||||
| Stock-based compensation | 257 | 155 | 188 | |||||||||||||||||
| Deferred taxes | (329) | (593) | 537 | |||||||||||||||||
| Fair value loss on promissory note | 160 | — | — | |||||||||||||||||
| Gain on deconsolidation of Bakkt | — | — | (1,419) | |||||||||||||||||
| (Gains)/losses on sale of investments | 4 | (41) | (1,261) | |||||||||||||||||
| Net losses from and impairment of unconsolidated investees | 122 | 1,340 | 42 | |||||||||||||||||
| Other | 63 | 41 | 45 | |||||||||||||||||
| Changes in assets and liabilities: | ||||||||||||||||||||
| Customer accounts receivable | (71) | 20 | (5) | |||||||||||||||||
| Other current and non-current assets | (41) | (196) | (100) | |||||||||||||||||
| Section 31 fees payable | (144) | 166 | (150) | |||||||||||||||||
| Deferred revenue | (16) | (27) | 34 | |||||||||||||||||
| Other current and non-current liabilities | (116) | 160 | 134 | |||||||||||||||||
| Total adjustments | 1,104 | 2,056 | (946) | |||||||||||||||||
| Net cash provided by operating activities | 3,542 | 3,554 | 3,123 | |||||||||||||||||
| Investing activities: | ||||||||||||||||||||
| Capital expenditures | (190) | (225) | (179) | |||||||||||||||||
| Capitalized software development costs | (299) | (257) | (273) | |||||||||||||||||
| Cash paid for acquisitions, net of cash acquired | (10,198) | (59) | (66) | |||||||||||||||||
| Purchases of equity and equity method investments | (8) | (73) | (117) | |||||||||||||||||
| Proceeds from the sales of equity investments | 187 | 741 | 1,237 | |||||||||||||||||
| Purchases of restricted investments | (1,312) | — | — | |||||||||||||||||
| Proceeds from restricted investments | 641 | — | — | |||||||||||||||||
| Proceeds from/(purchases of) other investments, net | (4) | 2 | 1 | |||||||||||||||||
| Purchases of invested margin deposits | (1,588) | (6,935) | (5,050) | |||||||||||||||||
| Proceeds from sales of invested margin deposits | 3,974 | 7,483 | 3,661 | |||||||||||||||||
| Net cash used in investing activities | (8,797) | 677 | (786) | |||||||||||||||||
| Financing activities: | ||||||||||||||||||||
| Proceeds from debt offerings, net | 2,400 | 7,891 | — | |||||||||||||||||
| Repayments of debt | (2,286) | (2,705) | (1,246) | |||||||||||||||||
| Proceeds from/(redemption of) commercial paper, net | 1,954 | (1,012) | (1,393) | |||||||||||||||||
| Repurchases of common stock | — | (632) | (250) | |||||||||||||||||
| Dividends to stockholders | (955) | (853) | (747) | |||||||||||||||||
| Change in cash and cash equivalent margin deposits and guaranty funds liability | (65,396) | (4,493) | 65,697 | |||||||||||||||||
| Payments relating to treasury shares received for restricted stock tax payments and stock option exercises | (78) | (73) | (70) | |||||||||||||||||
| Other | 16 | 36 | 35 | |||||||||||||||||
| Net cash (used in)/provided by financing activities | (64,345) | (1,841) | 62,026 | |||||||||||||||||
| Effect of exchange rate changes on cash, cash equivalents, restricted cash and cash equivalents, and cash and cash equivalent margin deposits and guaranty funds | 7 | (23) | (6) | |||||||||||||||||
| Net (decrease)/increase in cash, cash equivalents, restricted cash and cash equivalents, and cash and cash equivalent margin deposits and guaranty funds | (69,593) | 2,367 | 64,357 | |||||||||||||||||
| Cash, cash equivalents, restricted cash and cash equivalents and cash and cash equivalent margin deposits and guaranty funds at beginning of year | 150,343 | 147,976 | 83,619 | |||||||||||||||||
| Cash, cash equivalents, restricted cash and cash equivalents and cash and cash equivalent margin deposits and guaranty funds at end of year | $ | 80,750 | $ | 150,343 | $ | 147,976 | ||||||||||||||
| Supplemental cash flow disclosures: | ||||||||||||||||||||
| Cash paid for income taxes | $ | 909 | $ | 882 | $ | 1,057 | ||||||||||||||
| Cash paid for interest | $ | 727 | $ | 550 | $ | 406 |
See accompanying notes.
Intercontinental Exchange, Inc. and Subsidiaries
Notes to Consolidated Financial Statements
**1.**Description of Business
Nature of Business and Organization
Intercontinental Exchange, Inc. is a leading global provider of technology and data to a broad range of customers including financial institutions, corporations and government entities. These products, which span major asset classes including futures, equities, fixed income and United States, or U.S., residential mortgages, provide our customers with access to mission critical tools that are designed to increase asset class transparency and workflow efficiency. Our business is conducted through three reportable business segments:
-
Exchanges:** We operate regulated marketplace technology for the listing, trading and clearing of a broad array of derivatives contracts and financial securities as well as data and connectivity services related to those venues.
-
Fixed Income and Data Services:** We provide fixed income pricing, reference data, indices, analytics and execution services as well as global credit default swap, or CDS, clearing and multi-asset class data delivery technology.
-
Mortgage Technology:** We provide a technology platform that offers customers comprehensive, digital workflow tools that aim to address inefficiencies and mitigate risks that exist in the U.S. residential mortgage market life cycle from application through closing, servicing and the secondary market.
We operate marketplaces, technology and provide data services in the U.S., United Kingdom, or U.K., European Union, or EU, Canada, Asia Pacific and the Middle East.
**2.**Summary of Significant Accounting Policies
Basis of Presentation
The accompanying consolidated financial statements have been prepared by us in accordance with U.S. generally accepted accounting principles, or U.S. GAAP. These statements include the accounts of our wholly-owned and controlled subsidiaries. For consolidated subsidiaries in which our ownership is less than 100% and for which we have control over the assets and liabilities and the management of the entity, the outside stockholders’ interests are shown as non-controlling interests.
All intercompany balances and transactions between us and our wholly-owned and controlled subsidiaries have been eliminated in consolidation. The financial results of companies we acquire are included from the acquisition dates and the results of companies we sold are included up to the disposition dates. The accounting policies used to prepare these financial statements are the same as those used to prepare the consolidated financial statements in prior years.
Use of Estimates
Preparing financial statements in conformity with U.S. GAAP requires us to make certain estimates and assumptions that affect the amounts reported in our consolidated financial statements and accompanying disclosures. Actual amounts could differ from those estimates.
Comprehensive Income
Other comprehensive income includes foreign currency translation adjustments, our proportionate share of our equity method investments' other comprehensive income, and amortization of the difference in the projected benefit obligation and the accumulated benefit obligation associated with benefit plan liabilities, each of which is net of tax.
Segment and Geographic Information
As of December 31, 2023, our business is conducted through three reportable business segments: Exchanges, Fixed Income and Data Services, and Mortgage Technology. This presentation is reflective of how our chief operating decision maker reviews and operates our business. The majority of our identifiable assets are located in the U.S and U.K. (see Note 19).
Cash and Cash Equivalents, Short-Term and Long-Term Restricted Cash and Cash Equivalents, and Cash and Cash Equivalent Margin Deposits and Guaranty Funds
Cash and Cash Equivalents
We consider all short-term, highly liquid investments with maturities of three months or less at the time of purchase to be cash equivalents.
Short-Term and Long-Term Restricted Cash and Cash Equivalents
We classify all cash and cash equivalents that are not available for immediate or general business use by us as restricted in the accompanying consolidated balance sheets (see Note 7). This includes amounts set aside due to regulatory requirements, earmarked for specific purposes, or restricted by specific agreements. We also invest a portion of funds in excess of short-term operating needs in term deposits and investment-grade marketable debt securities, including government or government-sponsored agencies and corporate debt securities. These are classified as cash equivalents, are short-term in nature and carrying amount approximates fair value.
Cash and Cash Equivalent Margin Deposits and Guaranty Funds (Cash and Cash Equivalent Margin)
Original margin, variation margin and guaranty funds received by our clearing houses may be in the form of cash, government obligations, certain agency debt, letters of credit or on rare occasions, gold (see Note 14). We hold the cash deposits at central banks, highly-rated financial institutions or at times secure the cash through reverse repurchase agreements or direct investments, certain of which are not cash equivalents. See "Credit Risk and Significant Customers", below. Although not included in short term restricted cash and cash equivalents, cash and cash equivalent margin represent a form of restricted cash, and exclude invested deposits, delivery contracts receivable and unsettled variation margin since those amounts represent invested cash and not a form of restricted cash.
Consolidated Statement of Cash Flows Presentation
A reconciliation of the components of cash and cash equivalents, restricted cash and cash equivalents, and cash and cash equivalent margin deposits and guaranty funds as presented in the consolidated statements of cash flows to the balance sheet is as follows (in millions):
| As of December 31, 2023 | As of December 31, 2022 | As of December 31, 2021 | |||||||||||||||
| Cash and cash equivalents | $ | 899 | $ | 1,799 | $ | 607 | |||||||||||
| Short-term restricted cash and cash equivalents | 531 | 6,149 | 1,035 | ||||||||||||||
| Long-term restricted cash and cash equivalents | 340 | 405 | 398 | ||||||||||||||
| Cash and cash equivalent margin deposits and guaranty funds | 78,980 | 141,990 | 145,936 | ||||||||||||||
| Total | $ | 80,750 | $ | 150,343 | $ | 147,976 |
Investments
We have made various investments in debt securities and equity securities of other companies. We also invest in mutual funds and fixed income securities. We classify all other investments that are not cash equivalents with original maturity dates of less than one year as short-term investments and all investments that we intend to hold for more than one year as long-term investments. Short-term and long-term investments are included in other current and other non-current assets, respectively, in the accompanying consolidated balance sheets.
Debt Securities
We periodically purchase debt securities including U.S. Treasury securities or other high quality sovereign debt for purposes of meeting regulatory capital requirements at certain of our clearing houses. We classify these investments as trading securities with changes in fair value included in interest income in the consolidated statements of income. These short term debt securities are primarily included in restricted short-term investments in the accompanying consolidated balance sheets.
Equity Investments
Our equity investments are subject to valuation under ASU 2016-01, Financial Instruments- Overall (Subtopic 825-10): Recognition and Measurement of Financial Assets and Financial Liabilities, or ASU 2016-01. Investments in equity
securities, or equity investments, are carried at fair value and included in other non-current assets, with changes in fair value, whether realized or unrealized, recognized in net income. For those investments that we do not control and which do not have readily determinable fair market values, such as those which are not publicly-listed companies, we apply the measurement alternative. Under the measurement alternative, these investments are recorded at cost minus impairment and adjusted to fair value if and when there is an observable price change in an orderly transaction of a similar or identical investment, with any change in fair value recognized in net income. The carrying amount of our investments without readily determinable fair values was $86 million as of December 31, 2023.
Equity Method Investments
When we do not have a controlling financial interest in an entity but exercise significant influence over the entity’s operating and financial policies, such investments are accounted for using the equity method and included in other non-current assets. We recognize dividends when declared as a reduction in the carrying value of our equity method investments. At the end of each reporting period, we record our share of profits or losses of our equity method investments as equity earnings included in other income. We evaluate our equity method investments for impairment whenever events or changes in circumstances indicate that a decline in value has occurred that is other than temporary. If the investment is determined to have a decline in value deemed to be other than temporary it is written down to estimated fair value. We did not record any impairment charges on our equity method investments in 2023.
Property and Equipment
Property and equipment is recorded at cost, reduced by accumulated depreciation (see Note 8). Depreciation and amortization is computed using the straight-line method based on estimated useful lives of the assets, or in the case of leasehold improvements, the shorter of the remaining lease term or the estimated useful life of the improvement. We review the remaining estimated useful lives at each balance sheet date and make adjustments whenever events or changes in circumstances indicate that the remaining useful lives have changed. Gains on disposals are included in other income and losses on disposals are included in depreciation expense. Maintenance and repair costs are expensed as incurred.
Allowance for Doubtful Accounts
The allowance for doubtful accounts is maintained at a level that we believe to be sufficient to absorb probable losses over the expected life in our accounts receivable portfolio in accordance with ASC 326, Financial Instruments - Credit Losses. We estimate our allowance for doubtful accounts using an aging method, disaggregated based on major revenue stream categories as well as other unique revenue stream factors. The allowance is based on several factors, including continuous assessments of risk characteristics, specific customer events that may impact its ability to meet its financial obligations, and other reasonable and supportable economic characteristics. Accounts receivable are written-off against the allowance for doubtful accounts when collection efforts cease.
A reconciliation of the beginning and ending amount of allowance for doubtful accounts is as follows for the years ended December 31, 2023, 2022, and 2021 (in millions):
| Year Ended December 31, | |||||||||||||||||
| 2023 | 2022 | 2021 | |||||||||||||||
| Beginning balance of allowance for doubtful accounts | $ | 22 | $ | 24 | $ | 27 | |||||||||||
| Bad debt expense | 17 | 11 | 13 | ||||||||||||||
| Charge-offs | (18) | (13) | (16) | ||||||||||||||
| Ending balance of allowance for doubtful accounts | $ | 21 | $ | 22 | $ | 24 |
Charge-offs in the table above represent the write-off of uncollectible receivables, net of recoveries. These amounts also include the impact of foreign currency translation adjustments.
Software Development Costs
We capitalize costs related to software we develop or obtain for internal use*.* The costs capitalized include both internal and external direct and incremental costs. General and administrative costs related to developing or obtaining such software are expensed as incurred. Development costs incurred during the preliminary or maintenance project stages are expensed as incurred. Costs incurred during the application development stage are capitalized and amortized using the straight-line method over the useful life of the software, generally not exceeding three years (except for certain software which has a seven-year useful life). Amortization begins when the software is ready for its intended use.
Accrued Employee Benefits
We have a defined benefit pension plan and other postretirement benefit plans, or collectively the “benefit plans,” covering certain of our U.S. operations. The benefit accrual for the pension plan is frozen. We recognize the funded status of the benefit plans in our consolidated balance sheets, measure the fair value of plan assets and benefit obligations as of the date of our fiscal year-end, and provide additional disclosures in the footnotes (see Note 17).
Benefit plan costs and liabilities are dependent on assumptions used in calculating such amounts. These are provided by a third-party specialist and include discount rates, health care cost trend rates, benefits earned, interest cost, expected return on assets, mortality rates and other factors. Actual results that differ from the assumptions are accumulated and amortized over future periods and, therefore, generally affect recognized expense and the recorded obligation in future periods. However, certain of these unrecognized amounts are recognized when triggering events occur, such as when a settlement of pension obligations in excess of total interest and service costs occurs. While we believe that the assumptions used are appropriate, differences in actual experience or changes in assumptions may affect our pension and other post-retirement obligations and future expense recognized.
Goodwill and Indefinite-Lived Intangible Assets
Goodwill represents the excess of the purchase price of our acquisitions over the fair value of identifiable net assets acquired, including other identified intangible assets (see Note 9). We recognize specifically-identifiable intangibles when a specific right or contract is acquired. That value is determined with the assistance of third-party valuation specialists. Goodwill has been allocated to our reporting units for purposes of impairment testing based on the portion of synergy, cost savings and other expected future cash flows expected to benefit the reporting units at the time of the acquisition. The reporting units identified for our goodwill testing are: the NYSE, Other Exchanges, Fixed Income and Data Services, and Mortgage Technology. Goodwill impairment testing is performed annually at the reporting unit level in the fiscal fourth quarter or more frequently if conditions exist that indicate that it may be impaired, or if changes are made to the reporting units.
For both goodwill and indefinite-lived impairment testing we have the option to first perform a qualitative assessment to determine whether it is more likely than not that the fair value of a reporting unit or indefinite lived intangible asset is less than its carrying amount. If the fair value of the reporting unit or indefinite-lived intangible asset is less than its carrying value, an impairment loss is recognized in earnings in an amount equal to the difference. Alternatively, we may choose to bypass the qualitative option and perform quantitative testing to determine if the fair value is less than carrying value. For our goodwill impairment testing, we have elected to bypass the qualitative assessment and apply the quantitative approach. For our testing of indefinite-lived intangible assets, we apply qualitative and quantitative approaches.
Long-Lived Assets and Finite-Lived Intangible Assets
We review our long-lived and finite-lived intangible assets for impairment whenever events or changes in circumstances indicate that the carrying amount may not be fully recoverable. When these indicators exist, we project undiscounted net future cash flows over the remaining life of such assets. If the sum of the projected cash flows is less than the carrying amount, an impairment would exist, measured based upon the difference between the carrying amount and the fair value of the assets. Finite-lived intangible assets are generally amortized using the straight-line method over the lesser of their contractual or estimated useful lives.
All costs related to internally developed patents and trademarks are expensed as incurred. All costs related to purchased patents, trademarks and internet domain names are recorded as other intangible assets and are amortized using a straight-line method over their estimated useful lives. All costs related to licensed patents are capitalized and amortized using a straight-line method over the term of the license.
Derivatives and Hedging Activity
Periodically, we may use derivative financial instruments to manage exposure to changes in currency exchange rates. All derivatives are recorded at fair value. We generally do not designate these derivatives as hedges for accounting purposes. Accordingly, changes in fair value are recognized in income.
We entered into foreign currency hedging transactions during 2023, 2022 and 2021 as economic hedges to help mitigate a portion of our foreign exchange risk exposure. The gains and losses on these transactions were not material during these years.
Income Taxes
We recognize income taxes under the liability method. We recognize a current tax liability or tax asset for the estimated taxes payable or refundable on tax returns for the current year. We recognize deferred tax assets and liabilities for the expected future tax consequences of temporary differences between the financial statement carrying amounts and the tax bases of assets and liabilities. We establish valuation allowances if we believe that it is more likely than not that some or all of our deferred tax assets will not be realized. Deferred tax assets and liabilities are measured using current enacted tax rates in effect. We do not recognize a tax benefit unless we conclude that it is more likely than not that the benefit will be sustained on audit by the taxing authority based solely on the technical merits of the associated tax position. If the recognition threshold is met, we recognize a tax benefit measured at the largest amount of the tax benefit that, in our judgment, is greater than 50 percent likely to be realized. We recognize accrued interest and penalties related to uncertain tax positions as a component of income tax expense. We recognize the tax effects related to Global Intangible Low-Taxed Income in the period it is incurred.
We are subject to tax in numerous domestic and foreign jurisdictions primarily based on our operations in these jurisdictions. Significant judgment is required in assessing the future tax consequences of events that have been recognized in our financial statements or tax returns. Fluctuations in the actual outcome of these future tax consequences could have a material impact on our financial position or results of operations.
We use a portfolio approach with respect to pension, postretirement benefits plan obligations and currency translation matters when we determine the timing and extent to which stranded income tax effects from items that were previously recorded in accumulated other comprehensive income are released.
Revenue Recognition
Our revenues primarily consist of revenues for transactions executed and/or cleared through our global electronic derivatives trading and clearing exchanges and cash equities trading as well as revenues related to our fixed income, data services, mortgage technology services and listings. We recognize revenue when we transfer promised goods or services to customers in an amount that reflects the consideration to which we expect to be entitled in exchange for those goods or services. We enter into contracts that can include various combinations of products and services, which are generally capable of being distinct and accounted for as separate performance obligations. We also evaluate all contracts in order to determine appropriate gross versus net revenue reporting.
Substantially all of our revenues are considered to be revenues from contracts with customers. The related accounts receivable balances are recorded in our balance sheets as customer accounts receivable. We do not have obligations for warranties, returns or refunds to customers, other than rebates, which are settled each period and therefore do not result in variable consideration. We do not have significant revenue recognized from performance obligations that were satisfied in prior periods. Certain judgments and estimates are used in the identification and timing of satisfaction of performance obligations and the related allocation of transaction price. We believe that these represent a faithful depiction of the transfer of services to our customers.
Deferred revenue represents our contract liabilities related to our annual, original and other listings revenues, certain data services, clearing services, mortgage technology services and other revenues. See Note 6 for our discussion of deferred revenue balances, activity, and expected timing of recognition.
We have elected not to provide disclosures about transaction price allocated to unsatisfied performance obligations if contract durations are less than one year, or if we are not required to estimate the transaction price. For all of our contracts with customers, except for listings and certain data, mortgage and clearing services, our performance obligations are short term in nature and there is no significant variable consideration. In addition, we have elected the practical expedient of excluding sales taxes from transaction prices.
We capitalize incremental contract acquisition costs that relate directly to an existing contract or a specific anticipated contract and are expected to be recovered. Costs that would have been incurred regardless of whether the contract was obtained are expensed as incurred. As a practical expedient, we expense incremental costs of obtaining a contract if the amortization period of the asset would be one year or less. We also consider whether to capitalize costs to fulfill a contract that may be incurred before we commence performance on an obligation. These costs represent incremental, recoverable external costs and certain internal costs that are directly related to the contract and are primarily associated with costs of resources involved in installation of systems, processes and data conversion. These capitalized costs are amortized on a systematic basis consistent with the transfer to the customer of the solutions or services to which the asset relates. We consider the explicit term of the contract with the customer, expected renewals and the rate of change related to our solutions in determining the amortization period.
Activity Assessment Fees and Section 31 Fees
We pay the Securities and Exchange Commission, or SEC, fees pursuant to Section 31 of the Securities Exchange Act of 1934 for transactions executed on our U.S. equities and options exchanges. These Section 31 fees are designed to recover the costs to the government for supervising and regulating the securities markets and securities professionals. We (or the Options Clearing Corporation, or OCC, on our behalf), in turn, collect activity assessment fees, which are included in exchanges revenues in the accompanying consolidated statements of income, from member organizations clearing or settling trades on the U.S. equities and options exchanges and recognize these amounts as revenue. Fees received are included in cash at the time of receipt and, as required by law, the amount due to the SEC is remitted semi-annually and recorded as an accrued liability until paid. The activity assessment fees are designed so that they are equal to the Section 31 fees paid by us to the SEC. As a result, Section 31 fees do not have an impact on our net income.
Interest on Margin Deposits and Fees Charged for Non-cash Margin
For purposes of safeguarding customer funds, guaranty fund and original margin deposits of clearing members and their customers are maintained in accounts with national banks and highly-rated financial institutions or secured through other vehicles. Interest earned on these deposits is provided back to clearing members net of certain costs and administrative fees charged and retained by ICE. The ICE Clearing Houses also charge fees for clearing members pledging non-cash margin in lieu of cash margin, and these fees are fully retained by ICE. The safeguarding of clearing member funds is considered a core part of the clearing houses' operations, and therefore, the net interest and fees are included in total revenues within the consolidated statements of income.
Stock-Based Compensation
We currently have employee and non-employee director incentive plans from which we grant stock options, restricted shares, and restricted stock units with various service, performance, and/or market conditions. We also have an Employee Stock Purchase Plan, or ESPP, to provide additional and incentive-based compensation to our employees and directors (see Note 11). Stock options and restricted stock are granted at the discretion of the Compensation Committee of the Board of Directors. We measure and recognize compensation expense for share-based payment awards, including employee stock options, restricted stock and shares purchased under the ESPP based on estimated fair values on the date of grant. The value of the portion of the award that is ultimately expected to vest is recognized as stock-based compensation expense over the requisite service period.
We use the Black-Scholes pricing model to value stock option awards as well as shares purchased as part of our ESPP. The values estimated by the model are affected by the price of our stock as well as subjective variables that include assumed interest rates, our expected dividend yield, our expected share price volatility over the term of the awards and actual and projected employee stock option exercise behavior. Under our ESPP, employees may purchase shares of our common stock at a price equal to 85% of the lesser of the fair market value of the stock on the first or the last trading day of each offering period. We record compensation expenses related to the discount given to our participating employees.
Treasury Stock
We record treasury stock activities under the cost method whereby the cost of the acquired stock is recorded as treasury stock (see Note 12). In the event it occurs in the future, our accounting policy upon the formal retirement of treasury stock is to deduct the par value from common stock and to reflect any excess of cost over par value as a deduction from additional paid-in capital (to the extent created by previous issuances of the shares) and retained earnings.
Credit Risk and Significant Customers
Our clearing houses are exposed to credit risk as a result of maintaining clearing member cash deposits at various financial institutions (see Note 14). Cash deposit accounts are established at large, highly-rated financial institutions and entered into so that they restrict the rights of offset or imposition of liens by the banks. We also limit our risk of loss by holding the majority of the cash deposits in cash accounts at the Federal Reserve Bank of Chicago, high quality short-term sovereign debt reverse repurchase agreements with several different counterparty banks or direct investments in short-term high quality sovereign and supranational debt issues primarily with original maturities of less than three months. While we seek to achieve a reasonable rate of return which may generate interest income for our clearing members, we are primarily concerned with preservation of capital and managing the risks associated with these deposits. As the clearing houses may pass on interest revenues, minus costs, to the members, this could include negative or reduced yield due to market conditions.
When engaging in reverse repurchase agreements, our clearing houses take delivery of the underlying securities in custody accounts under clearing house control. Additionally, the securities purchased have a market value greater than
the reverse repurchase amount. The typical haircut received for high quality sovereign debt is 2% of the reverse repurchase amount. Thus, in the event that a reverse repurchase counterparty defaults on its obligation to repurchase the underlying reverse repurchase securities, our clearing house will have possession of securities with a value potentially greater than the reverse repurchase counterparty’s obligation to the clearing house.
ICE Clear Credit, a systemically important financial market utility as designated by the Financial Stability Oversight Council, maintains a U.S. dollar account at the Federal Reserve Bank of Chicago as of December 31, 2023. ICE Clear Europe maintains a euro-denominated account at the European Central Bank, or ECB, the central bank of the Netherlands, as well as pounds sterling- and euro-denominated accounts at the Bank of England, or BOE, the central bank of the U.K. These accounts provide the flexibility for ICE Clear Europe to place euro- and pounds sterling-denominated cash margin securely at national banks, in particular during periods when liquidity in the euro and pounds sterling repo markets may temporarily become contracted. Such accounts are intended to decrease ICE Clear Credit and ICE Clear Europe’s custodial, liquidity and operational risk as compared to alternative custodial and investment arrangements.
Our futures businesses have minimal credit risk as the majority of their transaction revenues are currently cleared through our clearing houses. Our accounts receivable related to fixed income and data services revenues, cash trading, listing revenues, technology revenues, CDS and bilateral over-the-counter, or OTC, energy transaction revenues and mortgage technology services subjects us to credit (collection) risk, as we do not require these customers to post collateral. We limit our risk of loss by terminating a customer's ability to remain listed or receive data or terminating other services for entities with delinquent accounts. The concentration of risk on accounts receivable is also mitigated by the large number of entities comprising our customer base. Excluding clearing members, there were no individual accounts receivable balances greater than 10% of total consolidated accounts receivable as of December 31, 2023 or December 31, 2022. Our accounts receivable are stated at the billed amount.
Leases
We record our leases in accordance with ASC 842, Leases. At lease inception, we review the service arrangement and components of a contract to identify if a lease or embedded lease arrangement exists. An indicator of a contract containing a lease is when we have the right to control and use an identified asset over a period of time in exchange for consideration. Operating lease right-of-use assets and liabilities are recorded at the lease commencement date based on the present value of the lease payments to be made over the lease term. As the rate implicit in the lease is not readily determinable in most of our leases, we use our incremental borrowing rate based on the information available at the commencement date in determining the present value of lease payments. Certain lease agreements include options to extend, renew or terminate the lease agreement and these terms are evaluated at inception and on an ongoing basis to determine the lease term.
We have elected the short-term lease policy to recognize leases with a term of 12 months or less as rent expense on a straight-line basis over the lease term and do not recognize these short-term leases on our balance sheet. We have elected the practical expedient of not separating lease and non-lease components as our lease arrangements are not highly dependent on other underlying assets. Our lease agreements do not contain any residual value guarantees. Rent expense is recognized on a straight-line basis over the lease term. Rent expense is included in rent and occupancy expenses and technology and communication expenses in the accompanying consolidated statements of income (see Note 15).
Acquisition-Related Transaction and Integration Costs
We incur incremental costs relating to our completed and potential acquisitions and other strategic opportunities. This includes fees for investment banking advisors, lawyers, accountants, tax advisors and public relations firms, as well as costs associated with credit facilities and other external costs directly related to the proposed or closed transactions. In accordance with ASC 805, Business Combinations, acquisition-related transaction and integration costs, excluding costs to issue debt or equity securities, are expensed in the period in which these costs are incurred and the services are received and are not included in the purchase price.
The acquisition-related transaction and integration costs incurred during 2023 and 2022 were primarily related to direct costs incurred related to our acquisition and integration of Black Knight and our integration of Ellie Mae Inc., or Ellie Mae (see Note 3). The acquisition-related transaction and integration costs incurred during 2021 were primarily due to legal and consulting expenses related to the Bakkt transaction and direct costs related to our integration of Ellie Mae.
Fair Value of Financial Instruments
Fair value is the price that would be received from selling an asset or paid to transfer a liability (an exit price) in the principal or most advantageous market for the asset or liability in an orderly transaction between market participants at the measurement date. Our financial instruments consist primarily of certain short-term and long-term assets and liabilities, customer accounts receivable, margin deposits and guaranty funds, equity and equity method investments, and short-term and long-term debt (see Note 18).
The fair value of our financial instruments is measured based on a three-level hierarchy:
-
Level 1 inputs** — quoted prices for identical assets or liabilities in active markets.
-
Level 2 inputs** — observable inputs other than Level 1 inputs such as quoted prices for similar assets and liabilities in active markets or inputs other than quoted prices that are directly observable.
-
Level 3 inputs** — unobservable inputs supported by little or no market activity and that are significant to the fair value of the assets or liabilities.
Foreign Currency Translation Adjustments and Foreign Currency Transaction Gains and Losses
Our functional and reporting currency is the U.S. dollar. We have exposure to foreign currency translation gains and losses arising from our net investment in certain U.K., continental European, Asian and Canadian subsidiaries. The revenues, expenses and financial results of these subsidiaries are recorded in the functional currency of the countries that these subsidiaries are located in, which are primarily pounds sterling and euros. The financial statements of these subsidiaries are translated into U.S. dollars using a current rate of exchange, with gains or losses, net of tax as applicable, included in the cumulative translation adjustment account, a component of equity. As of December 31, 2023 and 2022, the portion of our equity attributable to accumulated other comprehensive loss from foreign currency translation adjustments was $230 million and $278 million, respectively.
We have foreign currency transaction gains and losses related to the settlement of foreign currency denominated assets, liabilities and payables that occur through our operations. These transaction gains and losses are due to the increase or decrease in the foreign currency exchange rates between periods. Forward contracts on foreign currencies are entered into to manage the foreign currency exchange rate risk. Gains and losses from foreign currency transactions are included in other income/(expense) in the accompanying consolidated statements of income and resulted in net losses of $12 million, $9 million and $13 million in 2023, 2022 and 2021, respectively.
Earnings Per Common Share
Basic earnings per common share is calculated using the weighted average common shares outstanding during the year. Common equivalent shares from stock options and restricted stock awards, using the treasury stock method, are included in the diluted per share calculations unless the effect of inclusion would be antidilutive (see Note 20).
Recently Adopted Accounting Pronouncements
| Standard/Description | Adoption Considerations | Effect on Financial Statements | ||||||
| ASU 2021-08*, Business Combinations (Topic 805), Accounting for Contract Assets and Contract Liabilities from Contracts with Customers,* requires the recognition and measurement of contract assets and contract liabilities acquired in a business combination in accordance with ASC 606, Revenue from Contracts with Customers. Considerations to determine the amount of contract assets and contract liabilities to record at the acquisition date include the terms of the acquired contract, such as timing of payment, identification of each performance obligation in the contract and allocation of the contract transaction price to each identified performance obligation on a relative standalone selling price basis as of contract inception. This standard is effective beginning in the first quarter of 2023 and should be applied prospectively for acquisitions occurring on or after the effective date of the amendment, with early adoption permitted. | We adopted this standard early as of December 31, 2022. | We applied the recently adopted pronouncement to our evaluation of the contract assets acquired and contract liabilities assumed as part of the Black Knight acquisition. Refer to Note 3 for more information. | ||||||
Accounting Pronouncements Not Yet Adopted in These Financial Statements
| Standard/Description | Adoption Considerations | Effect on Financial Statements | ||||||
| ASU 2023-07*, Segment Reporting (Topic 280): Improvements to Reportable Segment Disclosures,* requires enhanced disclosures primarily regarding significant segment expenses that are regularly provided to the chief operating decision maker and a description of other segment items. The ASU also requires all annual disclosures required by Topic 280 to be included in interim periods. This standard is effective for our 2024 fiscal year and interim periods beginning in the first quarter of 2025, with early adoption permitted. This standard should be applied retrospectively once adopted. | We will adopt this ASU for our 2024 annual financial statements. | We are currently evaluating the impact of adopting this ASU on our consolidated financial statements and disclosures. | ||||||
| ASU 2023-09*, Income Taxes (Topic 740): Improvements to Income Tax Disclosures,* requires greater disaggregation of income tax disclosures related to the income tax rate reconciliation and income taxes paid. The ASU also requires disclosure of income (or loss) from continuing operations before income tax expense (or benefit) disaggregated between domestic and foreign and disclosure of income tax expense (or benefit) from continuing operations broken out between federal, state/local and foreign. This standard is effective for our annual periods beginning after December 15, 2024, with early adoption permitted. The ASU applies on a prospective basis to the annual financial statements for the periods beginning after the effective date. Retrospective application in all prior periods presented is permitted. | We do not expect to adopt this ASU early and plan to adopt the ASU for our 2025 annual financial statements. | We are currently evaluating the impact of adopting this ASU on our income taxes disclosures. | ||||||
**3.**Acquisitions and Divestitures
Acquisitions and Divestitures
| Company | Transaction Date | Primary Segment | Description | ||||||||
| Black Knight, Inc., or Black Knight | Acquired on 9/5/2023 | Mortgage Technology | Black Knight is a software, data and analytics company that serves the housing finance continuum, including real estate data, mortgage lending and servicing, as well as the secondary markets. See below for the Black Knight preliminary purchase price allocation and supplemental pro forma financial information. Pursuant to the certain Agreement and Plan of Merger, dated as of May 4, 2022, among ICE, Sand Merger Sub Corporation, a wholly owned subsidiary of ICE, or Sub, and Black Knight, which we refer to as the “merger agreement,” Sub merged with and into Black Knight, which we refer to as the “merger,” with Black Knight surviving as a wholly owned subsidiary of ICE. | ||||||||
| Bakkt Holdings, Inc., or Bakkt | Deconsolidated on 10/15/2021 | Exchanges | Bakkt is a business with an integrated platform that enables consumers and institutions to transact in digital assets. The Bakkt platform consists of two complementary aspects: a digital asset marketplace and loyalty redemption services. In 2021, Bakkt completed its merger with VPC Impact Acquisition Holdings, or VIH, a special purpose acquisition company sponsored by Victory Park Capital, or VPC. Following the closing, as a consequence of our inability to meet the power criterion through our variable interest and because of holding a minority voting interest in the combined company, during the fourth quarter of 2021 we deconsolidated Bakkt upon loss of control and prospectively treat it as an equity method investment within our financial statements. | ||||||||
During 2023, 2022 and 2021, we acquired multiple companies which were not material to our operations.
Black Knight, Inc. Acquisition
On September 5, 2023, we acquired 100% of Black Knight for aggregate transaction consideration of approximately $11.8 billion, or $76 per share of Black Knight common stock, with cash comprising 90% of the value of the aggregate transaction consideration. The aggregate cash component of the transaction consideration was $10.5 billion. We issued 10.9 million shares of ICE common stock to Black Knight stockholder, which was based on the market price of our common stock and the average of the volume weighted averages of the trading prices of our common stock on each of the ten consecutive trading days ending three trading days prior to the closing of the merger. We expect that this transaction will build on our position as a provider of end-to-end electronic workflow solutions for the rapidly evolving U.S. residential mortgage industry. We believe the Black Knight ecosystem adds value for clients of all sizes across the mortgage and real estate lifecycles by helping organizations lower costs, increase efficiencies, grow their businesses, and reduce risk.
On September 14, 2023, or the Divestiture Date, in connection with the merger agreement, we sold Black Knight's Optimal Blue and Empower loan origination system, or LOS, businesses, or the Divestitures, to subsidiaries of Constellation Software, Inc. The cash proceeds from the Divestitures were $241 million. The structure of the Optimal Blue transaction also included a promissory note with a face value of $500 million, or the Promissory Note, issued by the purchaser to Black Knight, as a subsidiary of ICE, at the closing of the transaction. The Promissory Note has a 40-year term with a maturity date of September 5, 2063, and a coupon interest rate of 7.0% per year. As discussed in more detail below, the Promissory Note was valued at $235 million on the Divestiture Date. In accordance with Accounting Standards Codification, or ASC, 805, Business Combinations, or ASC 805, as well as ASC 360, Impairment and Disposal of Long-Lived Assets, we are required to measure an acquired long-lived asset or disposal group that is classified as held for sale at the acquisition date at fair value less cost to sell. Accordingly, there was no gain or loss recognized on the Divestitures.
For the period between the acquisition date of September 5, 2023 through the Divestiture Date, the discontinued operations of Empower and Optimal Blue were immaterial and have been included in acquisition-related transaction and
integration costs in our consolidated statements of income.
Pursuant to the Agreement Containing Consent Orders entered into between the Federal Trade Commission, or the FTC, and ICE and Black Knight, the Promissory Note was required to be sold within six months of the Divestiture Date. On February 7, 2024, the FTC approved the buyer of the Promissory Note and the proceeds of the Promissory Note sale will be paid to Black Knight in the near future. We have elected the fair value option for the right to receive the net proceeds of the sale of the Promissory Note, which was valued at $235 million based on Level 3 inputs on the Divestiture Date (Note 18). As we elected the fair value option for the Promissory Note, we are required to mark the asset to fair value each reporting period. For subsequent measurement as of December 31, 2023, we wrote down the value of the Promissory Note, resulting in a fair value loss of $160 million (Note 18).
The estimated net fair value of the consideration transferred for Black Knight was approximately $11.4 billion as of the acquisition date, which consisted of the following (in millions):
| Transaction Consideration | ||||||||
| Cash | $ | 10,542 | ||||||
| ICE common stock* | 1,274 | |||||||
| Converted vested Black Knight awards | 22 | |||||||
| Total preliminary purchase price | $ | 11,838 | ||||||
| Less: Divestitures | $ | (476) | ||||||
| Total net preliminary purchase price | $ | 11,362 |
- Fair value of the ICE common stock is based on the ICE closing stock price on September 1, 2023.
The purchase price has been allocated to the net tangible and identifiable intangible assets and liabilities based on the preliminary respective estimated fair values on the date of acquisition. The excess of purchase price over the net tangible and identifiable intangible assets has been recorded as goodwill, of which $186 million is expected to be deductible for tax purposes. Goodwill represents potential revenue synergies related to new product development, various expense synergies and opportunities to enter new markets and is assigned to our Mortgage Technology business segment. The preliminary purchase price allocation is as follows (in millions):
| Net Preliminary Purchase Price Allocation | ||||||||
| Cash and cash equivalents | $ | 108 | ||||||
| Property and equipment | 119 | |||||||
| Goodwill | 9,417 | |||||||
| Identifiable intangibles | 4,948 | |||||||
| Debt acquired | (2,397) | |||||||
| Other assets and liabilities, net | 80 | |||||||
| Deferred tax liabilities on identifiable intangibles | (1,266) | |||||||
| Other deferred tax assets | 353 | |||||||
| Net preliminary purchase price | $ | 11,362 |
In performing the net preliminary purchase price allocation, we considered, among other factors, the intended future use of acquired assets, analysis of historical financial performance and estimates of future performance of the Black Knight business. For the identified intangible assets, the fair values have been preliminarily determined using the income and cost approaches and are partially based on inputs that are unobservable including forecasted future cash flows, revenue and margin growth rates, customer attrition rates and discount rates that require judgement and are subject to change. We have not yet obtained all of the information related to the fair value of the acquired assets and liabilities.
The primary areas of the preliminary purchase price allocation that are not yet finalized relate to the valuation of the identifiable intangible assets, income taxes, and certain other tangible assets and liabilities. The allocation of the purchase price will be finalized upon the completion of the analysis of the acquired assets and liabilities within one year of the date of acquisition.
The following table sets forth the components of the preliminary intangible assets associated with the acquisition as of December 31, 2023 (in millions, except years):
| Acquisition-Date Preliminary Fair Value | Accumulated Amortization | Net Book Value | Weighted average life (Years) | |||||||||||||||||||||||
| Developed Technology | $ | 1,129 | $ | (39) | $ | 1,090 | 10 | |||||||||||||||||||
| Trademarks/tradenames | 159 | (3) | 156 | 19 | ||||||||||||||||||||||
| Customer Relationships | 3,034 | (80) | 2,954 | 13 | ||||||||||||||||||||||
| Data and Databases | 579 | (19) | 560 | 10 | ||||||||||||||||||||||
| In-process Research & Development | 47 | — | 47 | N/A | ||||||||||||||||||||||
| Total | $ | 4,948 | $ | (141) | $ | 4,807 | 12 |
From the acquisition date through December 31, 2023, Black Knight revenues of $363 million, which are included in our mortgage technology revenues, and operating expenses of $470 million were recorded in our consolidated statements of income.
The financial information in the table below summarizes the combined results of operations of ICE and Black Knight, on a pro forma basis, as though the companies had been combined as of the beginning of the prior period presented. The unaudited pro forma financial information is presented for informational purposes only and is not indicative of the results of operations that would have been achieved if the acquisition had taken place at the beginning of the period presented. Such unaudited pro forma financial information is based on the historical financial statements of ICE and Black Knight. This unaudited pro forma financial information is based on estimates and assumptions that have been made solely for purposes of developing such unaudited pro forma information, including, without limitation, purchase accounting adjustments, interest expense on debt issued to finance the purchase price, acquisition-related transaction costs, the removal of historical Black Knight intangible asset amortization and the addition of intangible asset amortization related to this acquisition. The unaudited pro forma financial information does not reflect any synergies or operating cost reductions that have been and may be achieved from the combined operations. The unaudited pro forma financial information combines the historical results for us and Black Knight for 2023 and 2022 in the following table (in millions).
| Year Ended December 31, | |||||||||||
| 2023 | 2022 | ||||||||||
| Total revenues, less transaction-based expenses | $ | 8,735 | $ | 8,416 | |||||||
| Net income attributable to ICE | $ | 2,128 | $ | 1,110 | |||||||
Transaction-based expenses included within revenues, less transaction-based expenses in the table above, were not impacted by pro forma adjustments and agree to the amounts presented historically in our consolidated income statements as they relate solely to ICE and not to Black Knight.
Bakkt Transaction
On October 15, 2021, Bakkt completed its merger with VPC Impact Acquisition Holdings, or VIH, a special purpose acquisition company sponsored by Victory Park Capital, or VPC. Following completion of the business combination, we held an approximate 68% economic interest. As a result of limitations on ICE from the Bakkt voting agreement entered into in connection with the transaction, we hold a minority voting interest in the combined company. Prior to the closing, Bakkt revenues and operating expenses were reported within our consolidated revenues and operating expenses. Following the closing, as a consequence of our inability to meet the power criterion through our variable interest and because of holding a minority voting interest in the combined company, during the fourth quarter of 2021 we deconsolidated Bakkt upon loss of control and prospectively treat it as an equity method investment within our financial statements. We recorded a pre-tax gain on the transaction of $1.4 billion during the fourth quarter of 2021, which is included in other non-operating income within our consolidated income statement. The pre-tax gain is a result of recording an equity method investment value of $1.7 billion plus the removal of our redeemable non-controlling interest liability of $107 million, partially offset by the deconsolidation of Bakkt net assets of $295 million and our additional PIPE contribution of $47 million. As of December 31, 2023, we held an approximate 64% economic interest in Bakkt.
**4.**Investments
Equity Investments
Dun & Bradstreet
In connection with our acquisition of Black Knight, we acquired an investment in Dun & Bradstreet Holdings, Inc., or D&B, a global provider of business decisioning data and analytics, which we classified as an equity investment. Subsequent to the Black Knight acquisition and prior to December 31, 2023, we sold the entire investment for a total of $187 million and realized a total loss of $3 million on the sales, net of dividends received, which is included in other income/(expense), net in our consolidated statements of income in 2023.
Euroclear
We previously owned a 9.8% stake in Euroclear, plc, or Euroclear, that we originally purchased for $631 million. We participated on the Euroclear Board of Directors, and we classified our investment in Euroclear as an equity investment.
On May 20, 2022, we completed the sale of our 9.8% stake in Euroclear. The carrying value of our investment was $700 million at the time of the sale and was classified within other current assets on our balance sheet. We recorded a net gain on the sale of $41 million, which is included in other income/(expense), net in our consolidated statements of income in 2022.
Coinbase
On December 1, 2014, we acquired preferred stock of Coinbase Global, Inc., or Coinbase, which operates a cryptocurrency exchange platform, for $10 million, representing a 1.4% ownership share on a fully-diluted, as-converted basis. On April 14, 2021, Coinbase completed an initial public offering, or IPO. On April 15, 2021, we completed the sale of our investment in Coinbase for $1.24 billion and recorded a gain of $1.23 billion, or $892 million net of tax, as other income/(expense), net in our consolidated statements of income.
Equity Method Investments
Our equity method investments include OCC and Bakkt, among others. We recognized $122 million, $1.3 billion and $42 million as our share of estimated losses, net, from our equity method investments included in other income/(expense), net in our consolidated statements of income during 2023, 2022 and 2021, respectively. The estimated losses during 2023, 2022 and 2021 are primarily related to our investment in Bakkt, partially offset by our share of OCC profits. In addition, during 2022, after recording our share of Bakkt's equity method losses, which included an impairment charge recorded by Bakkt, we recorded an impairment in our investment in Bakkt to its fair value as other expense. Each period includes adjustments to reflect the difference between reported prior period actual results from our original estimates.
When performing our assessment of the carrying value of our investments, we consider, among other things, the length of time and the extent to which the market value has been less than our cost basis, if applicable, the investee's financial condition and near-term prospects, the economic or technological environment in which our investees operate, weakening of the general market condition of the related industry, whether an investee can continue as a going concern, any impairment charges recorded by an investee on goodwill, intangible or long-lived assets, and our intent and ability to retain the investment for a period of time sufficient to allow for any anticipated recovery in market value.
OCC
We own a 40% interest in OCC through a direct investment by the NYSE. OCC is regulated by the SEC as a registered clearing agency and by the Commodity Futures Trading Commission, or CFTC, as a derivatives clearing organization. OCC serves as a clearing house for securities options, security futures, commodity futures and options on futures traded on various independent exchanges. OCC clears securities options traded on NYSE Arca and NYSE Amex Options, along with other non-affiliated exchanges.
Bakkt
As of December 31, 2023, we hold an approximate 64% economic interest in Bakkt and treat it as an equity method investment (see Note 3). We recorded estimated equity losses and impairment of $1.4 billion during 2022 related to our investment in Bakkt, which included the impairment discussed above, which was based on what we consider to be an other-than-temporary decline in fair value as a result of the factors noted above, and included consideration for the impairment charge recorded by Bakkt. As of December 31, 2023, the carrying value of our investment in Bakkt was determined to be $73 million. As Bakkt is a public company with a readily available market price, the fair value of our
investment using the quoted market price as of December 31, 2023 was $390 million. We have reviewed the performance indicators discussed above on our Bakkt investment, noting that as of September 30, 2023, Bakkt disclosed that it is monitoring its ability to continue as a going concern and recorded an impairment charge, our share of which was included in our equity losses in Bakkt for the year ended December 31, 2023. We've evaluated our assessment of Bakkt's performance, and based on the carrying value of our investment in Bakkt, have not recorded an impairment of our investment as of December 31, 2023. Bakkt has subsequently disclosed its conclusions regarding its substantial doubt of its ability to continue as a going concern. We will continue to monitor Bakkt's financial performance to determine if any impairment of our investment exists in the future.
We concluded that Bakkt meets the significance test under Rule 3-09 of Regulation S-X for 2022. Bakkt's total assets and liabilities as of December 31, 2022 were $455 million and $119 million, respectively, and Bakkt's net revenues and net loss in 2022 were $55 million and $2.0 billion, respectively. We concluded that Bakkt no longer meets the significance test for 2023. In accordance with Rule 3-09 of Regulation S-X, as Bakkt met the significance test for a prior year presented in these financial statements, Bakkt financial statements as of and for the year ended December 31, 2023 will be filed subsequently as an amendment to this Form 10-K.
**5.**Revenue Recognition
Our primary revenue contract classifications are described below. These categories best represent those with similar economic characteristics of the nature, amount, timing and uncertainty of our revenues and cash flows.
Exchanges Revenues
- Futures and Options:** Revenues in our futures and options trading businesses primarily represent fees charged for the performance obligations of derivatives trading and clearing. In our derivatives markets, we earn transaction and clearing revenues from both counterparties to each contract that is traded and/or cleared.
Our transaction and clearing revenues are primarily included in our Exchanges segment with the exception of our CDS and fixed income transaction and clearing revenues which are discussed below and are included in our Fixed Income and Data Services segment. Derivatives trading and clearing fees contain two performance obligations: (1) trade execution/clearing novation and (2) risk management of open interest. While we allocate the transaction price between these two performance obligations, since they generally are satisfied almost simultaneously, there is no significant deferral of revenue. Our Exchanges segment futures and options transaction and clearing revenues are reported net of rebates. Rebates were $928 million, $815 million and $982 million in 2023, 2022 and 2021, respectively. Transaction and clearing fees can be variable based on trade volume discounts used in the determination of rebates, however virtually all volume discounts are calculated and recorded on a monthly basis. Transaction and clearing fees, as well as any volume discounts rebated to our customers, are calculated and billed monthly in accordance with our published fee schedules.
-
Cash Equities and Equity Options: Revenues in our cash equity and equity options markets represent trade execution fees. Cash trading and equity options contain one performance obligation related to each transaction which occurs instantaneously, and the revenue is recorded at the point in time of the transaction. We make liquidity payments to certain customers, as well as charge routing fees related to orders in our markets which are routed to other markets for execution and recognize those payments as a cost of revenue. In addition, we pay NYSE regulatory oversight fees to the SEC and collect equal amounts from our customers. These are also considered a cost of revenue, and both of these NYSE-related fees are included in transaction-based expenses. For one of our equity option exchanges, revenues are reported net of rebates. Rebates for that exchange were $61 million, $50 million and $51 million in 2023, 2022 and 2021, respectively.
-
Listings:** Our listings revenues include original and annual listings fees, and other corporate action fees. Each distinct listing fee is allocated to multiple performance obligations including original and incremental listing and investor relations services, as well as a customer’s material right to renew the option to list on our exchanges. In performing this allocation, the standalone selling price of the listing services is based on the original and annual listing fees and the standalone selling price of the investor relations services is based on its market value. All listings fees are billed upfront and the identified performance obligations are satisfied over time. Revenue related to the investor relations performance obligation is recognized ratably over the period these services are provided, with the remaining revenue recognized ratably over time as customers continue to list on our exchanges. Listings fees related to other corporate actions are considered contract modifications of our listing contracts and are recognized ratably over time as customers continue to list on our exchanges.
-
Data and Connectivity Services:** Our data and connectivity services revenues are related to the various data and connectivity services that we provide which are directly attributable to our exchange venues. Exchange data services include, among other offerings, proprietary real-time and historical pricing data, as well as order book and transaction information related to our global futures markets and the NYSE exchanges. In addition, we receive a share of revenue from the National Market System, or NMS, Plan. Separately, we also provide connectivity services directly related to our futures, cash equity and options exchanges and clearing houses. Data and connectivity services revenues are primarily subscription-based, billed monthly, quarterly or annually in advance and recognized ratably over time as our performance obligations of data delivery are met consistently throughout the period. Considering that these contracts primarily consist of single performance obligations with fixed prices, there is no variable consideration and no need to allocate the transaction price.
*•*OTC and Other: Our OTC revenues are generated in our bilateral energy markets where we offer electronic trading on contracts based on physically settled natural gas, power and refined oil contracts. Other revenues primarily include interest income on certain clearing margin deposits, regulatory penalties and fines, fees for use of our facilities, regulatory fees charged to member organizations of our U.S. securities exchanges, designated market maker service fees, exchange membership fees and agricultural grading and certification fees. Generally, fees for OTC and other revenues contain one performance obligation. Because these contracts primarily consist of single performance obligations with fixed prices, there is no variable consideration and no need to allocate the transaction price. Services for OTC and other revenues are primarily satisfied at a point in time. Therefore, there is no need to allocate the fee and no deferral results as we have no further obligation to the customer at that time.
In certain of our revenue share arrangements with third parties we control the delivered contract; in these arrangements we are acting as a principal and the revenue is recorded gross.
Fixed Income and Data Services Revenues
-
Fixed Income Execution: Execution fees, which include revenues from ICE Bonds, are reported net of rebates, and can be variable based on trade volume discounts used in the determination of rebates, however virtually all volume discounts are calculated and recorded on a monthly basis. Execution fees and rebates are calculated and billed monthly in accordance with our published fee schedules. Fixed income execution rebates were nominal in 2023, 2022 and 2021. In addition, we earn fixed income transaction fees on the trade execution of agency trades, commissions and net markups and markdowns on riskless principal trades. Fixed income execution fees contain one performance obligation related to each transaction which occurs instantaneously, and the revenue is recorded at a point in time.
-
CDS Clearing: CDS clearing revenues are reported net of rebates. Rebates were nominal in 2023, 2022 and 2021. We provide clearing services to the global CDS market and the timing and nature of our CDS transaction and clearing revenue is similar in nature to the Exchanges Segment transaction and clearing revenues discussed above. The CDS derivatives trading and clearing fees contain two performance obligations: (1) trade execution/clearing novation and (2) risk management of open interest. While we allocate the transaction price between these two performance obligations, since they generally are satisfied almost simultaneously, there is no significant deferral of revenue. CDS clearing revenues also include interest income on certain clearing margin deposits related to our CDS clearing business which are satisfied at a point in time and consists of a single performance obligation.
-
Fixed Income Data and Analytics, and Other Data and Network Services: Fixed income data and analytics services revenues are recurring in nature and include evaluated pricing and reference data and analytics including sovereign, corporate and municipal bonds, mortgage and asset-backed securities, as well as leveraged loans. Other data and network services include those related to the ICE Global Network and our consolidated feeds business, as well as desktops and other multi-asset class analytics.
The nature and timing of each contract type for the data services above are similar in nature. Data services revenues are primarily subscription-based, billed monthly, quarterly or annually in advance and recognized ratably over time as our performance obligations of data delivery are met consistently throughout the period. Considering that these contracts primarily consist of single performance obligations with fixed prices, there is no variable consideration and no need to allocate the transaction price. In certain of our data contracts, where third parties are involved, we either arrange for the third party to transfer the services to our customers, or we transfer third-party data to our customers; in these arrangements we are acting as an agent and revenue is recorded net.
Mortgage Technology Revenues
- Origination Technology:** Our origination technology acts as a system of record for the mortgage transaction. These revenues are based on recurring Software as a Service, or SaaS, subscription fees, with an additive transaction-based success-based pricing fee as lenders exceed the number of loans closed that are included with their monthly base subscription. In addition, the ICE Mortgage Technology network provides originators connectivity to the mortgage supply chain and facilitates the secure exchange of information between our customers and third-party service providers, lenders and investors. Revenue from the ICE Mortgage Technology network is largely transaction-based.
Performance obligations consist of a series of distinct services and support services. Mortgage subscription customers simultaneously receive and consume benefits from our performance and revenues are recognized over time using a time elapsed measure of progress as our performance obligations are met consistently throughout the period. Contracts generally range from one year to five years. Success-based contracts are subject to monthly billing calculations whereby customers are obligated to pay the greater of a contractual base fee or variable closed loan fee based on the number of closed loan transactions processed by the customer in the specific month. Under success-based contracts, monthly base fees are recognized ratably over the contract terms as subscription performance obligations are satisfied and closed loan fees in excess of base fees are considered variable consideration.
For the majority of contracts that include variable consideration, such fees meet the variable consideration allocation exception and are recognized in the month in which they are earned because the terms of the variable payments relate specifically to the outcome from transferring the distinct time increment (one month) of service and because such amounts reflect the fees to which we expect to be entitled for providing access to the Encompass platform for that period. For certain contracts where the variable consideration allocation exception would not be met, total variable consideration to be received is estimated at contract inception and recognized ratably over the contract term. The amount of variable consideration included in the transaction price is constrained to ensure that it is probable that a significant reversal in the amount of cumulative revenue recognized will not occur when the amount of variable consideration is subsequently resolved. When agreements involve multiple distinct performance obligations, we allocate arrangement consideration to all performance obligations at the inception of an arrangement based on the relative standalone selling prices of each performance obligation.
-
Closing Solutions:** Our closing solutions connect key participants to digitize the closing and recording process. For these services, we act as agent and revenues are recorded net. Revenues for these services primarily contain one performance obligation related to each transaction which occurs instantaneously, and the revenues are primarily recorded at the point in time of the transaction. Closing solutions also includes revenues from our MERSCORP Holdings, Inc., or MERS database, which provides a system of record for recording and tracking changes and servicing rights and beneficial ownership interests in loans secured by U.S. residential real estate. MERS database revenues contain multiple performance obligations related to each new loan registration and future transfers, and the revenues are primarily recorded at the point in time of each transaction. Closing solutions revenues may include a fixed-fee subscription component recognized ratably over the contract term, as this method best depicts our pattern of performance.
-
Servicing software:** Our servicing software revenues include Black Knight’s integrated mortgage servicing solutions, which help automate all areas of the servicing process. Our servicing software includes business intelligence, mortgage default and servicing technology, digital mortgage solutions and related professional services. These revenues are primarily comprised of recurring SaaS offerings for various platforms. Contracts for software and hosting solutions typically span five to seven years.
For our SaaS offerings, we promise our clients to stand ready to provide continuous access to our processing platforms. For this reason, processing services are generally viewed as a stand-ready performance obligation comprised of a series of distinct daily services. We typically satisfy these performance obligations over time as the services are provided. A time-elapsed output method is used to measure progress because our efforts are expended evenly throughout the period. We evaluate our variable payment terms related to these revenues, and they generally meet the criteria for allocating variable consideration entirely to one or more, but not all, performance obligations in a contract. Accordingly, when the criteria are met, variable amounts based on the number and type of services performed during a period are allocated to and recognized on the day in which we perform the related services. Fixed fees for processing services are generally recognized ratably over the contract period.
- Data and Analytics:** Revenues include those related to ICE Mortgage Technology’s Analyzer (formerly known as AIQ) and Black Knight's suite of data and analytics products and services. ICE Mortgage Technology's Analyzer
streamlines data collection and validation through our automated document recognition and data extraction capabilities. Analyzer revenues can be both recurring and transaction-based in nature. In addition, our data offerings include near real-time industry and peer benchmarking tools and a Data as a Service, or DaaS, offering for lenders to access industry data and origination information. Revenues related to our data products are largely subscription-based and recurring in nature and recognized ratably over time as our performance obligations are met consistently throughout the period.
Black Knight's data and analytics revenues are primarily from licenses for new and historical property ownership data and valuation-related analytical services and are generally distinct. License fees are recognized at a point in time upon delivery. Revenues allocated to data updates are recognized ratably over the period the updates are provided.
The following table depicts the disaggregation of our revenue according to business line and segment (in millions). Amounts here have been aggregated as they follow consistent revenue recognition patterns, and are consistent with the segment information in Note 19:
| Exchanges Segment | Fixed Income and Data Services Segment | Mortgage Technology Segment | Total Consolidated | ||||||||||||||||||||
| Year ended December 31, 2023 | |||||||||||||||||||||||
| Total revenues | $ | 6,355 | $ | 2,231 | $ | 1,317 | $ | 9,903 | |||||||||||||||
| Transaction-based expenses | 1,915 | — | — | 1,915 | |||||||||||||||||||
| Total revenues, less transaction-based expenses | $ | 4,440 | $ | 2,231 | $ | 1,317 | $ | 7,988 | |||||||||||||||
| Timing of Revenue Recognition | |||||||||||||||||||||||
| Services transferred at a point in time | $ | 2,576 | $ | 453 | $ | 341 | $ | 3,370 | |||||||||||||||
| Services transferred over time | 1,864 | 1,778 | 976 | 4,618 | |||||||||||||||||||
| Total revenues, less transaction-based expenses | $ | 4,440 | $ | 2,231 | $ | 1,317 | $ | 7,988 |
| Exchanges Segment | Fixed Income and Data Services Segment | Mortgage Technology Segment | Total Consolidated | ||||||||||||||||||||
| Year ended December 31, 2022 | |||||||||||||||||||||||
| Total revenues | $ | 6,415 | $ | 2,092 | $ | 1,129 | $ | 9,636 | |||||||||||||||
| Transaction-based expenses | 2,344 | — | — | 2,344 | |||||||||||||||||||
| Total revenues, less transaction-based expenses | $ | 4,071 | $ | 2,092 | $ | 1,129 | $ | 7,292 | |||||||||||||||
| Timing of Revenue Recognition | |||||||||||||||||||||||
| Services transferred at a point in time | $ | 2,307 | $ | 370 | $ | 455 | $ | 3,132 | |||||||||||||||
| Services transferred over time | 1,764 | 1,722 | 674 | 4,160 | |||||||||||||||||||
| Total revenues, less transaction-based expenses | $ | 4,071 | $ | 2,092 | $ | 1,129 | $ | 7,292 |
| Exchanges Segment | Fixed Income and Data Services Segment | Mortgage Technology Segment | Total Consolidated | ||||||||||||||||||||
| Year ended December 31, 2021 | |||||||||||||||||||||||
| Total revenues | $ | 5,878 | $ | 1,883 | $ | 1,407 | $ | 9,168 | |||||||||||||||
| Transaction-based expenses | 2,022 | — | — | 2,022 | |||||||||||||||||||
| Total revenues, less transaction-based expenses | $ | 3,856 | $ | 1,883 | $ | 1,407 | $ | 7,146 | |||||||||||||||
| Timing of Revenue Recognition | |||||||||||||||||||||||
| Services transferred at a point in time | $ | 2,166 | $ | 216 | $ | 820 | $ | 3,202 | |||||||||||||||
| Services transferred over time | 1,690 | 1,667 | 587 | 3,944 | |||||||||||||||||||
| Total revenues, less transaction-based expenses | $ | 3,856 | $ | 1,883 | $ | 1,407 | $ | 7,146 |
The Exchanges segment and the Fixed Income and Data Services segment revenues above include data services revenues. Our data services revenues are transferred over time, and a majority of those revenues are performed over a short period of time of one month or less and relate to subscription-based data services billed monthly, quarterly or annually in advance. These revenues are recognized ratably over time as our data delivery performance obligations are met consistently throughout the period.
The Exchanges segment revenues transferred over time in the table above also include services related to listings, services related to risk management of open interest performance obligations and services related to regulatory fees, trading permits, and software licenses.
The Fixed Income and Data Services segment revenues transferred over time in the table above also include services related to risk management of open interest performance obligations, primarily in our CDS business.
The Mortgage Technology segment revenues transferred over time in the table above primarily relate to our origination technology revenue where performance obligations consist of a series of distinct services and are recognized over the contract terms as performance obligations are satisfied, and to a lesser extent, professional services revenues and revenues from certain of our data and analytics and servicing software offerings.
The components of services transferred over time for each of our segments are as follows:
| Year ended December 31, | |||||||||||||||||
| 2023 | 2022 | 2021 | |||||||||||||||
| Exchanges Segment: | |||||||||||||||||
| Data services revenues | $ | 933 | $ | 877 | $ | 838 | |||||||||||
| Services transferred over time related to risk management of open interest performance obligations | $ | 312 | $ | 262 | $ | 260 | |||||||||||
| Services transferred over time related to listings | $ | 497 | $ | 515 | $ | 479 | |||||||||||
| Services transferred over time related to regulatory fees, trading permits, and software licenses | $ | 122 | $ | 110 | $ | 113 | |||||||||||
| Total | $ | 1,864 | $ | 1,764 | $ | 1,690 | |||||||||||
| Fixed Income Data Services Segment: | |||||||||||||||||
| Data services revenues | $ | 1,747 | $ | 1,686 | $ | 1,639 | |||||||||||
| Services transferred over time related to risk management of open interest performance obligations in our CDS business | $ | 31 | $ | 36 | $ | 28 | |||||||||||
| Total | $ | 1,778 | $ | 1,722 | $ | 1,667 | |||||||||||
| Mortgage Technology Segment: | |||||||||||||||||
| Recurring revenues | $ | 961 | $ | 643 | $ | 553 | |||||||||||
| Other | $ | 15 | $ | 31 | $ | 34 | |||||||||||
| Total | $ | 976 | $ | 674 | $ | 587 | |||||||||||
| Total consolidated revenues transferred over time | $ | 4,618 | $ | 4,160 | $ | 3,944 |
6. Deferred Revenue
Our contract liabilities, or deferred revenue, represent consideration received that is yet to be recognized as revenue. Total deferred revenue was $307 million as of December 31, 2023, including $200 million in current deferred revenue and $107 million in other non-current liabilities in our consolidated balance sheets. Total deferred revenue was $254 million as of December 31, 2022, including $170 million in current deferred revenue and $84 million in other non-current liabilities in our consolidated balance sheets. See Note 5 for a description of our listings, data services and mortgage technology services revenues and the revenue recognition policy for each of these revenue streams. The changes in our deferred revenue during 2023 and 2022 are as follows (in millions):
| Listing Revenues | Data Services and Other Revenues | Mortgage Technology | Total | ||||||||||||||||||||
| Deferred revenue balance at January 1, 2022 | $ | 112 | $ | 93 | $ | 79 | $ | 284 | |||||||||||||||
| Additions | 518 | 451 | 72 | 1,041 | |||||||||||||||||||
| Amortization | (515) | (456) | (100) | (1,071) | |||||||||||||||||||
| Deferred revenue balance at December 31, 2022 | 115 | 88 | 51 | 254 |
| Additions (1) | 490 | 401 | 177 | 1,068 | |||||||||||||||||||
| Amortization | (497) | (396) | (122) | (1,015) | |||||||||||||||||||
| Deferred revenue balance at December 31, 2023 | $ | 108 | $ | 93 | $ | 106 | $ | 307 |
(1) 2023 additions in our Mortgage Technology segment in the table above include $68 million of deferred revenue acquired on the date of the Black Knight acquisition (Note 3) and $37 million of Black Knight related deferred revenue added in the period after the date of acquisition through December 31, 2023.
The Mortgage Technology deferred revenue balance as of December 31, 2023 primarily relates to origination and servicing technology subscription services for which the performance obligations have not yet been provided as of the balance sheet date but for which billings or payments have been received in advance. Performance obligations for origination technology revenue consist of a series of distinct services and are recognized over the contract terms as performance obligations are satisfied.
Included in the amortization recognized in 2023, $167 million was related to the deferred revenue balance as of January 1, 2023. Included in the amortization in 2022, $195 million was related to the deferred revenue balance as of January 1, 2022. As of December 31, 2023, the remaining deferred revenue balance will be recognized over the period of time we satisfy our performance obligations. As of December 31, 2023, we estimate that our deferred revenue will be recognized in the following years (in millions):
| Listing Revenues | Data Services and Other Revenues | Mortgage Technology | Total | ||||||||||||||||||||||||||||||||
| 2024 | $ | 36 | $ | 82 | $ | 82 | $ | 200 | |||||||||||||||||||||||||||
| 2025 | 30 | 6 | 18 | 54 | |||||||||||||||||||||||||||||||
| 2026 | 23 | 3 | 3 | 29 | |||||||||||||||||||||||||||||||
| 2027 | 13 | 1 | 1 | 15 | |||||||||||||||||||||||||||||||
| 2028 | 5 | 1 | 1 | 7 | |||||||||||||||||||||||||||||||
| Thereafter | 1 | — | 1 | 2 | |||||||||||||||||||||||||||||||
| Total | $ | 108 | $ | 93 | $ | 106 | $ | 307 |
Transaction Price Allocated to Future Performance Obligations
Our disclosure of transaction price allocated to these future performance obligations excludes the following:
-
Volume-based fees in excess of contractual minimums and other usage-based fees to the extent they are part of a single performance obligation and meet certain variable consideration allocation criteria;
-
Performance obligations that are part of a contract with an original expected duration of one year or less; and
-
Transactional fees based on a fixed fee per transaction when we have the right to invoice once we have completed the performance obligation.
As of December 31, 2023, the aggregate amount of the transaction price that is allocated to our future performance obligations was approximately $4.0 billion and primarily relates to contracts with customers in the Mortgage Technology segment. We expect this amount to be recognized as revenue as follows: 33% by December 31, 2024, 78% by December 31, 2026, 95% by December 31, 2028 and the rest thereafter.
7. Short-Term and Long-Term Restricted Cash, Cash Equivalents, and Investments
Our total restricted cash, cash equivalents, and investments including short-term and long-term portions, consisted of the following (in millions):
| As of December 31, | |||||||||||||||||
| 2023 | 2022 | ||||||||||||||||
| Restricted cash, cash equivalents, and investments: | |||||||||||||||||
| Short-term restricted cash and cash equivalents: | |||||||||||||||||
| ICE Futures Europe | $ | 100 | $ | 100 | |||||||||||||
| ICE Clear Europe | 50 | 730 | |||||||||||||||
| CFTC Regulated Entities | 292 | 287 |
| As of December 31, | |||||||||||||||||
| 2023 | 2022 | ||||||||||||||||
| Other Regulated Entities | 79 | 73 | |||||||||||||||
| Other | 10 | 4,959 | |||||||||||||||
| Total short-term restricted cash and cash equivalents | 531 | 6,149 | |||||||||||||||
| Restricted short-term investments: | |||||||||||||||||
| ICE Clear Europe | 680 | — | |||||||||||||||
| Total restricted short-term investments | 680 | — | |||||||||||||||
| Long-term restricted cash and cash equivalents: | |||||||||||||||||
| ICE Clearing House Portion of the Guaranty Fund Contribution | 340 | 405 | |||||||||||||||
| Total long-term restricted cash and cash equivalents | 340 | 405 | |||||||||||||||
| Total restricted cash, cash equivalents, and investments | $ | 1,551 | $ | 6,554 |
Short-Term Restricted Cash, Cash Equivalents, and Investments
Our short-term restricted cash and cash equivalents and restricted short-term investments in the table above consist of the following:
-
ICE Futures Europe: ICE Futures Europe operates as a U.K. Recognized Investment Exchange, and is required by the U.K. Financial Conduct Authority to maintain financial resources sufficient to properly perform its relevant functions equivalent to a minimum of six months of operating costs, subject to certain deductions.
-
ICE Clear Europe: ICE Clear Europe operates as a U.K. Recognized Clearing House. As such, ICE Clear Europe is required by the BOE and the European Market Infrastructure Regulation, or EMIR, to restrict as cash, cash equivalents or investments in an amount to reflect an estimate of the capital required to wind down or restructure the activities of the clearing house, cover operational, legal and business risks and to reserve capital to meet credit, counterparty and market risks not covered by the members' margin and guaranty funds. As such, it is calculated taking into account the operating expenditures, revenues and credit exposures associated with the assets and investments. ICE Clear Europe, in addition to being regulated by the BOE, is also regulated by the CFTC as a U.S. Derivatives Clearing Organization, or DCO, and by the European Securities and Markets Authority, or ESMA, as a third-country central counterparty. The regulatory capital available to ICE Clear Europe, as described above, exceeds the CFTC requirements.
-
CFTC Regulated Entities:** Our CFTC regulated U.S. Designated Contract Market, or DCM, ICE Futures U.S., our CFTC regulated U.S. DCOs, ICE Clear U.S. and ICE Clear Credit, our CFTC regulated U.S. Swap Data Repository, or SDR, ICE Trade Vault, LLC, and our U.S. Swap Execution Facility, or SEF, ICE Swap Trade, are required to maintain financial resources including cash, in an amount that would cover certain operating costs for a one-year period, subject to certain deductions, to satisfy at least six months of such operating costs at all times. For our U.S. DCOs, ICE Clear U.S. and ICE Clear Credit, these amounts include voluntarily-held additional reserves consistent with the EMIR requirements to cover operational, legal and business risks and to reserve capital to meet credit, counterparty and market risks not covered by the member margin and guaranty funds. In addition, ICE NGX is registered by the CFTC as a Foreign Board of Trade and a DCO and the CFTC requires ICE NGX to maintain financial resources including cash, in an amount that would cover certain operating costs for a one-year period. ICE NGX is regulated by both the CFTC and the Alberta Securities Commission.
-
Other Regulated Entities:** Restricted cash on our various regulated entities and exchanges includes ICE Benchmark Administration, ICE Clear Netherlands, ICE Trade Vault Europe Limited, ICE Endex, ICE Futures Singapore and ICE Futures Abu Dhabi. It also includes the clearing member requirements of ICE Securities Executions & Clearing, LLC.
-
Other: Other restricted cash as of December 31, 2022 was primarily related to $4.9 billion of net proceeds from the Notes issued for the Black Knight acquisition that were separately invested (see Note 10).
Long-Term Restricted Cash and Cash Equivalents
Our long-term restricted cash and cash equivalents in the table above consist of the following:
- ICE Clearing House Portion of the Guaranty Fund Contribution: Our clearing houses, other than ICE NGX, require each clearing member to make deposits to a fund known as the guaranty fund. Included in the total contribution to ICE Clear U.S. as of December 31, 2022, was $15 million from Bakkt, solely applicable to any losses associated with a default in Bitcoin contracts and other digital assets. The requirement ceased when our
agreement with Bakkt to clear Bitcoin terminated in 2023. In addition, included in the total contribution to ICE Clear Europe as of December 31, 2022, was a $50 million guaranty fund contribution related to CDS clearing. This requirement was removed when CDS clearing ceased at ICE Clear Europe during the year. We have a $15 million first-loss amount related to ICE NGX insurance and included in our contribution to its guaranty fund. See Note 14 for additional information on the guaranty funds and our contributions of cash to our clearing houses guaranty funds.
8. Property and Equipment
Property and equipment consisted of the following (in millions):
| As of December 31, | Depreciation Period (Years) | ||||||||||||||||
| 2023 | 2022 | ||||||||||||||||
| Software and internally developed software | $ | 1,834 | $ | 1,632 | 3 to 7 | ||||||||||||
| Computer and network equipment | 1,033 | 957 | 3 to 5 | ||||||||||||||
| Land | 180 | 155 | N/A | ||||||||||||||
| Buildings and building improvements | 389 | 352 | 15 to 30 | ||||||||||||||
| Right-of-use lease assets | 305 | 278 | 1 to 30 | ||||||||||||||
| Leasehold improvements | 372 | 336 | 4 to 15 | ||||||||||||||
| Equipment, aircraft and office furniture | 156 | 155 | 4 to 12 | ||||||||||||||
| Total property and equipment | 4,269 | 3,865 | |||||||||||||||
| Less accumulated depreciation and amortization | (2,346) | (2,098) | |||||||||||||||
| Property and equipment, net | $ | 1,923 | $ | 1,767 |
In 2023, 2022 and 2021, amortization of software and internally developed software was $284 million, $247 million and $213 million, respectively, and depreciation of all other property and equipment was $182 million, $174 million and $174 million, respectively. As of December 31, 2023 and 2022, unamortized software and internally developed software was $535 million and $501 million, respectively.
9. Goodwill and Other Intangible Assets
The following is a summary of the activity in our goodwill balance by segment (in millions):
| Exchanges Segment | Fixed Income and Data Services Segment | Mortgage Technology Segment | Total Consolidated | ||||||||||||||||||||
| Goodwill balance at January 1, 2022 | $ | 8,185 | $ | 4,816 | $ | 8,122 | $ | 21,123 | |||||||||||||||
| Acquisitions | — | 41 | 5 | 46 | |||||||||||||||||||
| Foreign currency translation | (51) | (4) | — | (55) | |||||||||||||||||||
| Other activity, net | — | (3) | — | (3) | |||||||||||||||||||
| Goodwill balance at December 31, 2022 | $ | 8,134 | $ | 4,850 | $ | 8,127 | $ | 21,111 | |||||||||||||||
| Acquisitions | — | — | 9,417 | 9,417 | |||||||||||||||||||
| Foreign currency translation | 21 | 3 | — | 24 | |||||||||||||||||||
| Other activity, net | — | 1 | — | 1 | |||||||||||||||||||
| Goodwill balance at December 31, 2023 | $ | 8,155 | $ | 4,854 | $ | 17,544 | $ | 30,553 |
The following is a summary of the activity in our other intangible assets balance (in millions):
| Other intangible assets balance at January 1, 2022 | $ | 13,736 | |||
| Acquisitions | 14 | ||||
| Foreign currency translation | (53) | ||||
| Amortization of other intangible assets | (610) | ||||
| Other activity, net | 3 | ||||
| Other intangible assets balance at December 31, 2022 | $ | 13,090 | |||
| Acquisitions | 4,953 | ||||
| Foreign currency translation | 21 | ||||
| Amortization of other intangible assets | (749) | ||||
| Other activity, net | 2 | ||||
| Other intangible assets balance at December 31, 2023 | $ | 17,317 |
We completed our acquisition of Black Knight during 2023 (see Note 3).
Foreign currency translation adjustments result from a portion of our goodwill and other intangible assets being held at our U.K., EU and Canadian subsidiaries, whose functional currencies are not the U.S. dollar. The changes in other activity, net, in the tables above primarily relate to adjustments to the fair value of the net tangible and intangible assets made within one year of acquisitions, with a corresponding adjustment to goodwill.
Other intangible assets and the related accumulated amortization consisted of the following (in millions):
| As of December 31, 2023 | As of December 31, 2022 | ||||||||||||||||||||||||||||||||||
| Gross | Accumulated Amortization | Net Book Value | Gross | Accumulated Amortization | Net Book Value | ||||||||||||||||||||||||||||||
| Finite-lived intangible assets: | |||||||||||||||||||||||||||||||||||
| Customer relationships | $ | 10,870 | $ | (2,641) | $ | 8,229 | $ | 7,966 | $ | (2,280) | $ | 5,686 | |||||||||||||||||||||||
| Technology | 2,497 | (934) | 1,563 | 1,380 | (761) | 619 | |||||||||||||||||||||||||||||
| Trading products with finite lives | 205 | (141) | 64 | 242 | (172) | 70 | |||||||||||||||||||||||||||||
| Data/databases | 745 | (170) | 575 | 150 | (146) | 4 | |||||||||||||||||||||||||||||
| Trademarks/Tradenames | 386 | (67) | 319 | 229 | (47) | 182 | |||||||||||||||||||||||||||||
| Other | 51 | (42) | 9 | 78 | (55) | 23 | |||||||||||||||||||||||||||||
| Total finite-lived intangible assets | 14,754 | (3,995) | 10,759 | 10,045 | (3,461) | 6,584 | |||||||||||||||||||||||||||||
| Indefinite-lived intangible assets: | |||||||||||||||||||||||||||||||||||
| Exchange registrations, licenses and contracts with indefinite lives | 6,223 | — | 6,223 | 6,218 | — | 6,218 | |||||||||||||||||||||||||||||
| Trade names and trademarks with indefinite lives | 280 | — | 280 | 280 | — | 280 | |||||||||||||||||||||||||||||
| In-process research and development | 47 | — | 47 | — | — | — | |||||||||||||||||||||||||||||
| Other | 8 | — | 8 | 8 | — | 8 | |||||||||||||||||||||||||||||
| Total indefinite-lived intangible assets | 6,558 | — | 6,558 | 6,506 | — | 6,506 | |||||||||||||||||||||||||||||
| Total other intangible assets | $ | 21,312 | $ | (3,995) | $ | 17,317 | $ | 16,551 | $ | (3,461) | $ | 13,090 |
In 2023, 2022 and 2021, amortization expense of other intangible assets was $749 million, $610 million and $622 million, respectively, and is recorded in depreciation and amortization expense in our consolidated statements of income. Collectively, the remaining weighted average useful lives of the finite-lived intangible assets is 14.2 years as of December 31, 2023. We expect future amortization expense from the finite-lived intangible assets as of December 31, 2023 to be as follows (in millions):
| 2024 | $ | 1,007 | |||
| 2025 | 984 | ||||
| 2026 | 935 | ||||
| 2027 | 889 | ||||
| 2028 | 794 | ||||
| Thereafter | 6,150 | ||||
| $ | 10,759 |
We performed an analysis of impairment indicators and other than an impairment on certain trademark intangible assets, we did not recognize any impairment losses on goodwill or other intangible assets in 2023, 2022 or 2021. We considered potential indicators of impairment to goodwill and other intangible assets for each of our reporting units, which included continued global inflation concerns and changing interest rates, including their effect on our forecasts and discount rates, among other things.
**10.**Debt
Our total debt, including short-term and long-term debt, consisted of the following (in millions):
| As of December 31, | ||||||||||||||
| 2023 | 2022 | |||||||||||||
| Debt: | ||||||||||||||
| Short-term debt: | ||||||||||||||
| Commercial Paper | $ | 1,954 | $ | — | ||||||||||
| Other short-term debt | — | 4 | ||||||||||||
| Total short-term debt | 1,954 | 4 | ||||||||||||
| Long-term debt: | ||||||||||||||
| 2025 Term Loan due August 31, 2025 | 1,600 | — | ||||||||||||
| 2025 Senior Notes (3.65% senior notes due May 23, 2025) | 1,246 | 1,243 | ||||||||||||
| 2025 Senior Notes (3.75% senior notes due December 1, 2025) | 1,248 | 1,247 | ||||||||||||
| 2027 Senior Notes (4.00% senior notes due September 15, 2027) | 1,489 | 1,487 | ||||||||||||
| 2027 Senior Notes (3.10% senior notes due September 15, 2027) | 498 | 498 | ||||||||||||
| 2028 Senior Notes (3.625% senior notes due September 1, 2028) | 920 | — | ||||||||||||
| 2028 Senior Notes (3.75% senior notes due September 21, 2028) | 596 | 594 | ||||||||||||
| 2029 Senior Notes (4.35% senior notes due June 15, 2029) | 1,241 | 1,240 | ||||||||||||
| 2030 Senior Notes (2.10% senior notes due June 15, 2030) | 1,238 | 1,235 | ||||||||||||
| 2032 Senior Notes (1.85% senior notes due September 15, 2032) | 1,486 | 1,485 | ||||||||||||
| 2033 Senior Notes (4.60% senior notes due March 15, 2033) | 1,489 | 1,488 | ||||||||||||
| 2040 Senior Notes (2.65% senior notes due September 15, 2040) | 1,232 | 1,231 | ||||||||||||
| 2048 Senior Notes (4.25% senior notes due September 21, 2048) | 1,232 | 1,231 | ||||||||||||
| 2050 Senior Notes (3.00% senior notes due June 15, 2050) | 1,222 | 1,221 | ||||||||||||
| 2052 Senior Notes (4.95% senior notes due June 15, 2052) | 1,466 | 1,464 | ||||||||||||
| 2060 Senior Notes (3.00% senior notes due September 15, 2060) | 1,472 | 1,471 | ||||||||||||
| 2062 Senior Notes (5.20% senior notes due June 15, 2062) | 984 | 983 | ||||||||||||
| Total long-term debt | 20,659 | 18,118 | ||||||||||||
| Total debt | $ | 22,613 | $ | 18,122 | ||||||||||
Black Knight Senior Notes
As of December 31, 2023, Black Knight's $1.0 billion principal amount of its 3.625% senior notes due in 2028 were outstanding. The notes became part of ICE's consolidated long-term debt on the acquisition date of September 5, 2023.
Credit Facilities
- Credit Facility:** We have a $3.9 billion senior unsecured revolving credit facility, or the Credit Facility, with future capacity to increase our borrowings under the Credit Facility by an additional $1.0 billion, subject to the consent of the lenders funding the increase and certain other conditions. On May 25, 2022, we agreed with the lenders to extend the maturity date of the Credit Facility from October 15, 2026, to May 25, 2027 and also exercised our option to increase the amount of the Credit Facility from $3.8 billion to $3.9 billion, among other items. We incurred new debt issuance costs of $4 million during 2022 relating to the Credit Facility, increased deferred debt issuance costs carried forward from previous Credit Facility extensions, and these costs are represented in the accompanying consolidated balance sheet as other non-current assets and will be amortized over the remaining life of the Credit Facility. No amounts were outstanding under the Credit Facility as of December 31, 2023.
As of December 31, 2023, of the $3.9 billion that was available for borrowing under the Credit Facility, $2.0 billion was required to backstop the amount outstanding under the Commercial Paper Program, and $172 million was required to support certain broker-dealer and other subsidiary commitments. Amounts required to back-stop notes outstanding under the Commercial Paper Program will fluctuate as we increase or decrease our commercial paper borrowings. The remaining $1.8 billion is available for working capital and general corporate purposes including, but not limited to, acting as a back-stop to future increases in the amounts outstanding under the Commercial Paper Program.
We also pay an annual commitment fee for unutilized amounts under the Credit Facility, payable in arrears at a rate that ranges from 0.08% to 0.20% determined based on our current long-term debt rating. As of December 31, 2023, the applicable rate for commitments to May 2027 was 0.125%. Amounts borrowed under the Credit Facility may be prepaid at any time without premium or penalty.
The Credit Facility also contains customary representations and warranties, covenants and events of default, including a leverage ratio, limitations on liens on our assets, indebtedness of non-obligor subsidiaries, the sale of all or substantially all of our assets, and other matters.
-
2022 Term Loan:** On May 25, 2022, we entered into a $2.4 billion two-year senior unsecured delayed draw term loan facility, or the Term Loan. Draws under the Term Loan bear interest on the principal amount outstanding at either (a) Term Secured Overnight Financing Rate, or Term SOFR, plus an applicable margin plus a credit spread adjustment of 8.75 basis points or (b) a "base rate" plus an applicable margin. The applicable margin ranges from 0.625% to 1.125% for Term SOFR loans and from 0.000% to 0.125% for base rate loans, in each case, based on a ratings-based pricing grid. The proceeds from borrowings under the Term Loan were used to fund a portion of the purchase price for the Black Knight acquisition. We incurred new debt issuance costs of $4 million relating to the Term Loan and these costs are represented in the accompanying consolidated balance sheet as other non-current assets and will be amortized over the remaining life of the Term Loan. We have the option to prepay outstanding amounts under the Term Loan in whole or in part at any time. As of December 31, 2023, $1.6 billion was outstanding under the Term Loan.
-
Other:** Our India subsidiaries maintain $14 million of credit lines for their general corporate purposes. As of December 31, 2023, there were no outstanding borrowings.
Commercial Paper Program
Our Commercial Paper Program is currently backed by the borrowing capacity available under the Credit Facility, as described above. The effective interest rate of commercial paper issuances does not materially differ from short-term interest rates, which fluctuate due to market conditions and as a result may impact our interest expense.
In 2023, we issued $2.6 billion under the Commercial Paper Program to fund a portion of the purchase price for the Black Knight acquisition, offset by net repayments of $600 million funded primarily by cash flows from operations. We had net repayments of $1.0 billion under the Commercial Paper program during 2022 funded, in part, by the net proceeds from our senior notes issued in May 2022.
As of December 31, 2023, commercial paper notes of $2.0 billion with original maturities ranging from 4 to 45 days were outstanding with a weighted average interest rate of 5.70% per annum, and a weighted average remaining maturity of 32 days. As of December 31, 2022, we did not have any notes outstanding under our Commercial Paper Program.
Senior Notes
- Senior Notes Issued in May 2022
On May 23, 2022, we issued $8.0 billion in aggregate principal amount of new fixed rate senior notes, comprised of the following:
-
$1.25 billion in aggregate principal amount of 3.65% senior notes due in 2025, or the 2025 Notes;
-
$1.5 billion in aggregate principal amount of 4.00% senior notes due in 2027, or the 2027 Notes;
-
$1.25 billion in aggregate principal amount of 4.35% senior notes due in 2029, or the 2029 Notes;
-
$1.5 billion in aggregate principal amount of 4.60% senior notes due in 2033, or the 2033 Notes;
-
$1.5 billion in aggregate principal amount of 4.95% senior notes due in 2052, or the 2052 Notes; and
-
$1.0 billion in aggregate principal amount of 5.20% senior notes due in 2062, or the 2062 Notes, collectively, the Notes.
We used the net proceeds of $4.9 billion from the offering of the 2025 Notes, the 2027 Notes, the 2029 Notes and the 2062 Notes, together with the issuance of commercial paper and/or borrowings under the Credit Facility, cash on hand and borrowings under the Term Loan, discussed below, to finance the cash portion of the purchase price for Black Knight.
We used the $3.0 billion of net proceeds from the offering of the 2033 Notes and the 2052 Notes to redeem $2.7 billion aggregate principal amount of four series of senior notes that would have matured in 2022 and 2023. The balance of the net proceeds was used for general corporate purposes, which included paying down a portion of the amounts outstanding under our Commercial Paper Program. We recorded $30 million in costs associated with the extinguishment and re-financing of our existing debt in connection with our May 2022 debt refinancing which included a make-whole redemption of $18 million, duplicative interest of $7 million and $5 million of accelerated unamortized deferred debt costs. These costs were included in interest expense in our consolidated statements of income for 2022.
We incurred debt issuance costs of $67 million relating to the issuance of the Notes and these costs are presented in the accompanying consolidated balance sheet as a deduction from the carrying amount of the related debt liability and will be amortized over the remaining term of each series of the Notes. The Notes contain affirmative and negative covenants, including, but not limited to, certain redemption rights, limitations on liens and indebtedness and limitations on certain mergers, sales, dispositions and lease-back transactions.
- Senior Notes Issued in August 2020: On August 20, 2020, we issued $6.5 billion in aggregate principal amount of new senior notes, comprised of $1.25 billion in aggregate principal amount of floating rate senior notes due in 2023, or the Floating Rate Notes, $1.0 billion in aggregate principal amount of 0.70% senior notes due in 2023, $1.5 billion in aggregate principal amount of 1.85% senior notes due in 2032, $1.25 billion in aggregate principal amount of 2.65% senior notes due in 2040, and $1.5 billion in aggregate principal amount of 3.00% senior notes due in 2060 (collectively, the August 2020 Notes). We used the net proceeds to fund a portion of the purchase price for the Ellie Mae acquisition.
We incurred debt issuance costs of $53 million relating to the issuance of the August 2020 Notes and these costs are presented in the accompanying consolidated balance sheet as a deduction from the carrying amount of the related debt liability and will be amortized over the remaining term of each series of the August 2020 Notes.
In September 2021, we used the proceeds from commercial paper issuances and cash on hand to fund the redemption of $1.25 billion of the Floating Rate Notes and recorded $4 million of accelerated unamortized deferred loan costs, included in interest expense in our consolidated statements of income for 2021.
In May 2022, we used the proceeds from the notes to fund the redemption of $1.0 billion in aggregate principal amount of 0.70% senior notes due in 2023.
- Senior Notes Issued in May 2020: On May 26, 2020, we issued $2.5 billion in aggregate principal amount of new senior notes comprised of $1.25 billion in aggregate principal amount of 2.10% senior notes due in 2030 and $1.25 billion in aggregate principal amount of 3.00% senior notes due in 2050 (collectively, the May 2020 Notes).
We used the net proceeds of the May 2020 Notes for general corporate purposes, including to fund the redemption of our $1.25 billion aggregate principal amount of 2.75% senior notes due December 2020, or the 2020 Senior Notes, which were redeemed in accordance with their terms on June 25, 2020, and to pay down a portion of our commercial paper outstanding.
We incurred debt issuance costs of $23 million relating to the issuance of the May 2020 Notes and these costs are presented in the accompanying consolidated balance sheet as a deduction from the carrying amount of the related debt liability and will be amortized over the remaining term of each note series.
- Senior Notes Issued in August 2018: In August 2018, we issued $2.25 billion in new aggregate unsecured fixed-rate senior notes, including $400 million, 3.45% notes due in 2023, $600 million, 3.75% notes due in 2028, and $1.25 billion, 4.25% notes due in 2048. We used the proceeds for general corporate purposes, including to fund the redemption of the $600 million, 2.50% Senior Notes due October 2018 and to refinance all of our issuances under our Commercial Paper Program that resulted from acquisitions and investments in 2018. We
incurred debt issuance costs of $21 million relating to these notes that we recorded as a deduction from the carrying amount of the debt and which is being amortized over the respective note lives.
In June 2022, we used the proceeds from the notes to fund the redemption of $400 million in aggregate principal amount of 3.45% notes due in 2023.
- Senior Notes Issued in August 2017:** In August 2017, we issued $1.0 billion in aggregate senior unsecured fixed-rate notes, including $500 million, 2.35% notes due in 2022 and $500 million, 3.10% notes due in 2027. We used the majority of the proceeds of the offering to fund the redemption of $850 million, 2.00% senior unsecured fixed-rate NYSE Notes prior to the October 2017 maturity date. We incurred debt issuance costs of $8 million relating to these notes that we recorded as a deduction from the carrying amount of the debt and which is being amortized over the respective note lives.
In June 2022, we used the proceeds from the notes to fund the redemption of $500 million in aggregate principal amount of 2.35% notes due in 2022.
- Senior Notes Issued in November 2015:** In November 2015, we issued $2.5 billion in aggregate senior unsecured fixed-rate notes, including the 2020 Senior Notes, and $1.25 billion, 3.75% notes due 2025. We used the proceeds, together with $1.6 billion of borrowings under our Commercial Paper Program, to finance the cash portion of the purchase price of Interactive Data. The 2020 Senior Notes were paid off in June 2020 with net proceeds from the offering of the May 2020 Notes.
All of our Senior Notes contain affirmative and negative covenants, including, but not limited to, certain redemption rights, limitations on liens and indebtedness and limitations on certain mergers, sales, dispositions and lease-back transactions.
Debt Repayment Schedule
As of December 31, 2023, the outstanding debt repayment schedule is as follows (in millions):
| 2024 | $ | 1,964 | |||
| 2025 | 4,100 | ||||
| 2026 | — | ||||
| 2027 | 2,000 | ||||
| 2028 | 1,600 | ||||
| Thereafter | 13,250 | ||||
| Principal amounts repayable | 22,914 | ||||
| Debt issuance costs | (202) | ||||
| Unamortized balance discounts on bonds, net | (89) | ||||
| Discount on Commercial Paper | (10) | ||||
| Total debt outstanding | $ | 22,613 |
**11.**Share-Based Compensation
The non-cash compensation expenses recognized in our consolidated statements of income for stock options, restricted stock and under our employee stock purchase plan were $257 million, $155 million and $188 million in 2023, 2022 and 2021, respectively, net of $18 million, $16 million and $13 million, respectively, that was capitalized as software development costs. The 2023 expense includes the expense related to the portion of the Black Knight replacement awards that were accelerated on the Divestiture Date, described below. The 2021 expense includes the expense related to the Bakkt Incentive Units, described below. As of December 31, 2023, we had 37.8 million shares in total under various equity plans available for future issuance as stock option and restricted stock awards.
Stock Option Plans
Stock options are granted with an exercise price equal to the fair value of our common stock on the grant date. We may grant, under provisions of the plans, both incentive stock options and nonqualified stock options. The options generally vest over three or four years and may generally be exercised up to ten years after the date of grant, but generally expire either 14 or 60 days after termination of employment. The shares of common stock issued under our stock option plans are made available from authorized and unissued common stock or treasury shares.
The fair value is based on our closing stock price on the date of grant as well as certain other assumptions. Compensation expense arising from option grants is recognized ratably over the vesting period based on the grant date fair value, net of estimated forfeitures.
The following is a summary of our stock option activity:
| Number of Options (in thousands) | Weighted Average Exercise Price per Option | ||||||||||
| Outstanding at January 1, 2021 | 3,147 | $ | 58.96 | ||||||||
| Granted | 310 | $ | 114.19 | ||||||||
| Exercised | (493) | $ | 34.80 | ||||||||
| Forfeited | — | $ | — | ||||||||
| Outstanding at December 31, 2021 | 2,964 | $ | 68.77 | ||||||||
| Granted | 266 | $ | 129.76 | ||||||||
| Exercised | (417) | $ | 53.30 | ||||||||
| Forfeited | (26) | $ | 123.77 | ||||||||
| Outstanding at December 31, 2022 | 2,787 | $ | 76.38 | ||||||||
| Granted | 280 | $ | 107.66 | ||||||||
| Exercised | (508) | $ | 58.05 | ||||||||
| Forfeited | (20) | $ | 114.19 | ||||||||
| Outstanding at December 31, 2023 | 2,539 | $ | 83.20 |
Details of stock options outstanding as of December 31, 2023 are as follows:
| Number of Options (in thousands) | Weighted Average Exercise Price | Weighted Average Remaining Contractual Life (Years) | Aggregate Intrinsic Value (In millions) | ||||||||||||||||||||
| Vested or expected to vest | 2,539 | $ | 83.20 | 4.9 | $ | 115 | |||||||||||||||||
| Exercisable | 2,000 | $ | 74.49 | 4.0 | $ | 108 |
Details of stock options exercised during 2023, 2022 and 2021 are as follows:
| Year Ended December 31, | ||||||||||||||||||||
| Options exercised: | 2023 | 2022 | 2021 | |||||||||||||||||
| Total intrinsic value of options exercised (in millions) | $ | 25 | $ | 28 | $ | 41 |
| As of December 31, | ||||||||||||||||||||
| Options outstanding: | 2023 | 2022 | 2021 | |||||||||||||||||
| Number of options exercisable (in millions) | 2.0 | 2.2 | 2.2 | |||||||||||||||||
| Weighted-average exercise price | $ | 74.49 | $ | 65.97 | $ | 59.03 |
As of December 31, 2023, there were $8 million in total unrecognized compensation costs related to stock options, which are expected to be recognized over a weighted average period of 1.4 years as the stock options vest.
We use the Black-Scholes option pricing model to value our stock option awards. During 2023, 2022 and 2021, we used the assumptions in the table below to compute the value:
| Year Ended December 31, | ||||||||||||||||||||
| Assumptions: | 2023 | 2022 | 2021 | |||||||||||||||||
| Risk-free interest rate | 3.47% | 1.72% | 0.64% | |||||||||||||||||
| Expected life in years | 6.1 | 6.0 | 5.7 | |||||||||||||||||
| Expected volatility | 24% | 23% | 24% |
| Year Ended December 31, | ||||||||||||||||||||
| Expected dividend yield | 1.56% | 1.17% | 1.16% | |||||||||||||||||
| Estimated weighted-average fair value of options granted per share | $27.39 | $28.18 | $22.70 |
The risk-free interest rate is based on the zero-coupon U.S. Treasury yield curve in effect at the date of grant. The expected life is derived from historical and anticipated future exercise patterns. Expected volatility is based on historical volatility data of our stock.
Restricted Stock Plans
Restricted shares are used as an incentive to attract and retain qualified employees and to align our and our stockholders' interests by linking actual performance to both short and long-term stockholder return. We issue awards that may contain a combination of time, performance and/or market conditions. The grant date fair value of each award is based on the closing stock price of our stock at the date of grant.
Granted but unvested shares are generally forfeited upon termination of employment, whereby compensation costs previously recognized for unvested shares are reversed. Until the shares vest and are issued, participants have no voting or dividend rights and the shares may not be sold, assigned, transferred, pledged or otherwise encumbered. Unvested restricted stock earns dividend equivalents which are paid in cash on the vesting date.
The grant date fair value of time-based restricted stock units is recognized as expense ratably over the vesting period, which is typically three or four years, net of forfeitures. Our equity plans include a change in control provision that may accelerate vesting on both the time-based and performance-based restricted shares if the awards are not assumed by an acquirer in the case of a change in control.
For awards with performance conditions, we recognize compensation costs, net of forfeitures, using an accelerated attribution method over the vesting period. Compensation costs are recognized only if it is probable that the performance condition will be satisfied. If we initially determine that it is not probable of being satisfied and later determine that it is, or vice versa, a cumulative catch-up adjustment is recorded in the period of change based on the new estimate. We recognize the remaining compensation costs over the remaining vesting period.
For awards with a market condition, fair value is estimated based on a simulation of various outcomes and includes inputs such as our stock price on the grant date, the valuation of historical awards with market conditions, the probability that the market condition will affect the number of shares granted (as the market condition only affects shares granted in excess of certain financial performance targets), and our expectation of achieving the financial performance targets.
In February 2023, we reserved a maximum of 0.9 million restricted shares for potential issuance as performance-based restricted shares to certain of our employees. The number of shares ultimately granted under this award is based on our actual financial performance as compared to financial performance targets set by our Board and the Compensation Committee for the year ending December 31, 2023, and is also subject to a market condition reduction based on how our 2023 total stockholder return, or TSR, compared to that of the S&P 500 Index. In 2023, we performed at a performance level "above-target". Based on our actual 2023 financial performance as compared to the 2023 financial performance level thresholds, and with a required TSR haircut since we were "above-target", but underperformed against the S&P 500 Index TSR, 0.6 million restricted shares will be awarded. This results in $74 million in compensation expenses that will be expensed over the three-year accelerated vesting period, including $41 million expensed during 2023.
In October 2023, we granted performance-based restricted awards to certain of our employees. We reserved shares for potential issuance of these awards with vesting terms over five years.
The following is a summary of nonvested restricted shares under all plans discussed above:
| Number of Restricted Stock Shares (in thousands) | Weighted Average Grant-Date Fair Value per Share | ||||||||||
| Nonvested at January 1, 2021 | 3,236 | $ | 82.73 | ||||||||
| Granted | 1,869 | 115.28 | |||||||||
| Vested | (1,619) | 78.07 | |||||||||
| Forfeited | (169) | 101.47 | |||||||||
| Nonvested at December 31, 2021 | 3,317 | 101.72 | |||||||||
| Granted | 1,477 | 126.98 |
| Number of Restricted Stock Shares (in thousands) | Weighted Average Grant-Date Fair Value per Share | ||||||||||
| Vested | (1,541) | 93.94 | |||||||||
| Forfeited | (307) | 118.23 | |||||||||
| Nonvested at December 31, 2022 | 2,946 | 117.14 | |||||||||
| Granted | 3,561 | 110.96 | |||||||||
| Vested | (1,942) | 112.39 | |||||||||
| Forfeited | (269) | 114.88 | |||||||||
| Nonvested at December 31, 2023 | 4,296 | 114.31 |
| Year Ended December 31, | ||||||||||||||||||||
| 2023 | 2022 | 2021 | ||||||||||||||||||
| Time-based restricted stock units granted (in thousands) (1) | 1,191 | 1,067 | 1,196 | |||||||||||||||||
| Total fair value of restricted stock vested under all restricted stock plans (in millions) | $ | 150 | $ | 191 | $ | 184 |
(1) The remaining shares granted are performance-based.
Performance-based restricted shares have been presented in the table above to reflect the actual shares issued based on the achievement of past performance targets, also considering the impact of any market conditions. Non-vested performance-based restricted shares granted are presented in the table above at the target number of restricted shares that would vest if the performance targets are met. Time-based awards reflected in the table above include the Black Knight unvested awards that converted to our awards on the date of acquisition, as discussed below. As of December 31, 2023, there were $232 million in total unrecognized compensation costs related to time-based and performance-based restricted stock. These costs are expected to be recognized over a weighted-average period of 1.9 years as the restricted stock vests.
Black Knight Restricted Stock Awards
In connection with our Black Knight acquisition in September 2023, certain restricted stock awards held by Black Knight employees were converted to ICE restricted stock awards and included in the table above. The replacement awards contain the same terms and conditions as were applicable to the awards immediately prior to the merger. These awards will be fully vested by 2026. Our stock compensation expense for December 31, 2023 related to these awards was $18 million. In connection with the Divestitures and certain terminations, $55 million of replacement restricted stock awards accelerated for the period between the acquisition date of September 5, 2023, through December 31, 2023, which we recorded as an acquisition-related costs (see Note 3).
Employee Stock Purchase Plan
We offer our employees participation in our ESPP, under which we have reserved and may sell up to 25 million shares of our common stock to employees. The ESPP grants participating employees the right to acquire our stock in increments of 1% of eligible pay, with a maximum contribution of 25% of eligible pay, subject to applicable annual Internal Revenue Service, or IRS, limitations. Under our ESPP, participating employees are limited to $25,000 of common stock annually, and a maximum of 1,250 shares of common stock each offering period. There are two offering periods each year, from January 1st (or the first trading day thereafter) through June 30th (or the last trading day prior to such date) and from July 1st (or the first trading day thereafter) through December 31st (or the last trading day prior to such date). The purchase price per share of common stock is 85% of the lesser of the fair market value of the stock on the first or the last trading day of each offering period. We recorded compensation expenses of $13 million, $13 million and $11 million during 2023, 2022 and 2021, respectively, related to the discount given to our participating employees.
Bakkt Incentive Units
Prior to the Bakkt merger with VIH (see Note 3), we sponsored the Bakkt Equity Incentive Plan under which Bakkt issued various Bakkt preferred, common and phantom, or participation, equity unit awards. These awards were made to certain employees and board members of Bakkt. The units were unvested at the issuance date, were subject to the vesting terms in the award agreements and upon vesting were converted into Bakkt equity or cash.
During 2021, the merger of Bakkt and VIH triggered a market condition of these Bakkt equity incentive awards. As a result, during 2021, we incurred $31 million of non-cash compensation expense related to these awards which we recorded as an acquisition-related cost prior to deconsolidating Bakkt in 2021.
**12.**Equity
Common Stock
We are authorized to issue 1.5 billion shares with a par value of $0.01 per share. Each holder of common stock is entitled to one vote for each share of common stock held of record by such holder on all matters on which stockholders are entitled to vote, including the election and removal of directors. There were 649 million and 573 million shares of common stock issued and outstanding, respectively, as of December 31, 2023. There were 634 million and 559 million shares of common stock issued and outstanding, respectively, as of December 31, 2022.
Preferred Stock
We are authorized to issue 100 million shares of preferred stock with a par value of $0.01 per share. The holders of a series of preferred stock shall be entitled only to such voting rights as shall expressly be granted thereto by the Certificate of Incorporation (including any certificate of designation relating to such series of preferred stock). As of December 31, 2023, no shares of preferred stock have been issued.
Treasury Stock
During each of 2023, 2022 and 2021, we received 1.0 million shares of common stock from employees to satisfy tax withholdings we made on their behalf for restricted stock and stock option exercises. We recorded the receipt of the shares as treasury stock.
Non-Controlling Interest
For consolidated subsidiaries in which our ownership is less than 100%, and for which we have control over the assets, liabilities and management of the entity, the outside stockholders' interests are shown as non-controlling interests. As of December 31, 2023, our non-controlling interests included those related to the non-ICE limited partners' interest in our CDS clearing subsidiaries and non-controlling interest in ICE Futures Abu Dhabi.
As of December 31, 2020, we also had redeemable non-controlling interests, reflected as redeemable non-controlling interests in temporary equity within our consolidated balance sheet, related to a put option held by non-ICE partners in Bakkt to require us to repurchase their interests. Following the October 2021 Bakkt merger discussed above, we no longer consolidate Bakkt and therefore did not record a redeemable non-controlling interest in Bakkt as of December 31, 2023, 2022, or 2021.
Stock Repurchase Program
We periodically review whether to repurchase our stock. In making a determination regarding the timing and extent of any stock repurchases, we consider multiple factors that may include: overall stock market conditions, our common stock price performance, the remaining amount authorized for repurchases by our Board, the potential impact of a stock repurchase program on our debt ratings, our expected free cash flow and working capital needs, our current and future planned strategic growth initiatives, and other potential uses of our cash and capital resources.
Repurchases may be made from time to time on the open market, through established trading plans, in privately-negotiated transactions or otherwise, in accordance with all applicable securities laws, rules and regulations. We may begin or discontinue stock repurchases at any time and may amend or terminate a Rule 10b5-1 trading plan at any time or enter into additional plans.
In December 2021, our Board approved an aggregate of $3.15 billion for future repurchases of our common stock with no fixed expiration date that became effective January 1, 2022. In December 2021 we entered into a new Rule 10b5-1 trading plan that became effective in February 2022. In connection with our acquisition of Black Knight, on May 4, 2022, we terminated our Rule 10b5-1 trading plan and suspended share repurchases.
We did not have any share repurchases in 2023. During 2022 and 2021, we repurchased 5.0 million shares and 1.8 million shares, respectively, of our outstanding common stock at a cost of $632 million and $250 million, respectively, excluding shares withheld upon vesting of equity awards. The shares repurchased are held in treasury stock.
As of December 31, 2023, the remaining balance of Board approved funds for future repurchase was $2.5 billion. The approval of our Board for stock repurchases does not obligate us to acquire any particular amount of our common stock. In addition, our Board may increase or decrease the amount available for repurchases from time to time.
The table below sets forth the information with respect to purchases made by or on behalf of ICE or any “affiliated purchaser” (as defined in Rule 10b-18(a)(3) under the Exchange Act) of our common stock during the periods presented as follows:
| Shares Repurchased (in thousands) | Average Repurchase Price Per Share | Amount of Repurchases (in millions) | Total cumulative year-to-date shares purchased as part of publicly announced plans or programs (in thousands) | Approximate dollar value of shares that may yet be purchased under the plans or programs as of the end of the quarter (in millions) | |||||||||||||||||||||||||
| 2023 | |||||||||||||||||||||||||||||
| Fourth quarter | — | $ | — | $ | — | — | $ | 2,518 | |||||||||||||||||||||
| Third quarter | — | $ | — | $ | — | — | $ | 2,518 | |||||||||||||||||||||
| Second quarter | — | $ | — | $ | — | — | $ | 2,518 | |||||||||||||||||||||
| First quarter | — | $ | — | $ | — | — | $ | 2,518 | |||||||||||||||||||||
| Total common stock repurchases | — | $ | — | $ | — | ||||||||||||||||||||||||
| 2022 | |||||||||||||||||||||||||||||
| Fourth quarter | — | $ | — | $ | — | 4,955 | $ | 2,518 | |||||||||||||||||||||
| Third quarter | — | $ | — | $ | — | 4,955 | $ | 2,518 | |||||||||||||||||||||
| Second quarter | 1,281 | $ | 122.54 | $ | 157 | 4,955 | $ | 2,518 | |||||||||||||||||||||
| First quarter | 3,674 | $ | 129.30 | $ | 475 | 3,674 | $ | 2,675 | |||||||||||||||||||||
| Total common stock repurchases(1) | 4,955 | $ | 127.56 | $ | 632 | ||||||||||||||||||||||||
| 2021 | |||||||||||||||||||||||||||||
| Fourth quarter | 1,834 | $ | 136.31 | $ | 250 | 1,834 | $ | 903 | |||||||||||||||||||||
| Third quarter | — | $ | — | — | — | $ | — | ||||||||||||||||||||||
| Second quarter | — | $ | — | — | — | $ | — | ||||||||||||||||||||||
| First quarter | — | $ | — | — | — | $ | — | ||||||||||||||||||||||
| Total common stock repurchases(2) | 1,834 | $ | 136.31 | $ | 250 |
(1) Includes 0.4 million shares purchased on the open market at a cost of $50 million and 4.6 million shares purchased under our Rule 10b5-1 trading plan at a cost of $582 million.
(2) All 1.8 million shares were purchased on the open market at a cost of $250 million.
Dividends
Our Board has adopted a quarterly dividend declaration policy providing that the declaration of any dividends will be determined quarterly by the Board or the Audit Committee, taking into account such factors as our evolving business model, prevailing business conditions, our financial results and capital requirements, and other considerations which our Board deems relevant, without a predetermined annual net income payout ratio. We declared and paid cash dividends per share during the periods presented as follows:
| Dividends Per Share | Amount (in millions) | ||||||||||
| 2023 | |||||||||||
| Fourth quarter | $ | 0.42 | $ | 242 | |||||||
| Third quarter | 0.42 | 241 | |||||||||
| Second quarter | 0.42 | 236 | |||||||||
| First quarter | 0.42 | 236 | |||||||||
| Total cash dividends declared and paid | $ | 1.68 | $ | 955 | |||||||
| 2022 | |||||||||||
| Fourth quarter | $ | 0.38 | $ | 214 | |||||||
| Third quarter | 0.38 | 213 | |||||||||
| Second quarter | 0.38 | 213 | |||||||||
| First quarter | 0.38 | 213 | |||||||||
| Total cash dividends declared and paid | $ | 1.52 | $ | 853 | |||||||
| 2021 | |||||||||||
| Fourth quarter | $ | 0.33 | $ | 186 | |||||||
| Third quarter | 0.33 | 187 | |||||||||
| Second quarter | 0.33 | 187 | |||||||||
| First quarter | 0.33 | 187 | |||||||||
| Total cash dividends declared and paid | $ | 1.32 | $ | 747 |
Accumulated Other Comprehensive Income/(Loss)
The following tables present changes in the accumulated balances for each component of other comprehensive income/(loss) (in millions):
| Changes in Accumulated Other Comprehensive Income/(Loss) by Component | ||||||||||||||||||||||||||
| Foreign currency translation adjustments | Comprehensive income from equity method investment | Employee benefit plans adjustments | Total | |||||||||||||||||||||||
| Balance, as of January 1, 2021 | $ | (134) | $ | 1 | $ | (59) | $ | (192) | ||||||||||||||||||
| Other comprehensive income/(loss) | (16) | 1 | 15 | — | ||||||||||||||||||||||
| Income tax benefit/(expense) | — | — | (4) | (4) | ||||||||||||||||||||||
| Net current period other comprehensive income/(loss) | (16) | 1 | 11 | (4) | ||||||||||||||||||||||
| Balance, as of December 31, 2021 | (150) | 2 | (48) | (196) | ||||||||||||||||||||||
| Other comprehensive income/(loss) | (130) | — | (10) | (140) | ||||||||||||||||||||||
| Income tax benefit/(expense) | 2 | — | 3 | 5 | ||||||||||||||||||||||
| Net current period other comprehensive income/(loss) | (128) | — | (7) | (135) | ||||||||||||||||||||||
| Balance, as of December 31, 2022 | (278) | 2 | (55) | (331) | ||||||||||||||||||||||
| Other comprehensive income/(loss) | 49 | — | (15) | 34 | ||||||||||||||||||||||
| Income tax benefit/(expense) | (1) | — | 4 | 3 | ||||||||||||||||||||||
| Net current period other comprehensive income/(loss) | 48 | — | (11) | 37 | ||||||||||||||||||||||
| Balance, as of December 31, 2023 | $ | (230) | $ | 2 | $ | (66) | $ | (294) |
**13.**Income Taxes
Income before income taxes and the income tax provision consisted of the following (in millions), and our consolidated income tax provision for 2021 was elevated due to the income tax expense associated with the gains we recognized from the Coinbase and Bakkt transactions.
| Year Ended December 31, | |||||||||||||||||
| 2023 | 2022 | 2021 | |||||||||||||||
| Income before income taxes | |||||||||||||||||
| Domestic | $ | 1,016 | $ | 184 | $ | 4,179 | |||||||||||
| Foreign | 1,878 | 1,624 | 1,519 | ||||||||||||||
| Total | $ | 2,894 | $ | 1,808 | $ | 5,698 | |||||||||||
| Income tax provision | |||||||||||||||||
| Current tax expense: | |||||||||||||||||
| Federal | $ | 287 | $ | 366 | $ | 533 | |||||||||||
| State | 27 | 206 | 267 | ||||||||||||||
| Foreign | 471 | 331 | 292 | ||||||||||||||
| Total | $ | 785 | $ | 903 | $ | 1,092 | |||||||||||
| Deferred tax expense/(benefit): | |||||||||||||||||
| Federal | $ | (124) | $ | (413) | $ | 258 | |||||||||||
| State | (197) | (165) | 92 | ||||||||||||||
| Foreign | (8) | (15) | 187 | ||||||||||||||
| $ | (329) | $ | (593) | $ | 537 | ||||||||||||
| Total income tax expense | $ | 456 | $ | 310 | $ | 1,629 |
A reconciliation of the statutory U.S. federal income tax rate to our effective income tax rate is as follows:
| Year Ended December 31, | |||||||||||||||||
| 2023 | 2022 | 2021 | |||||||||||||||
| Statutory federal income tax rate | 21 | % | 21 | % | 21 | % | |||||||||||
| State and local income taxes, net of federal benefit | 2 | 5 | 4 | ||||||||||||||
| Foreign tax rate differential | 2 | (1) | — | ||||||||||||||
| Current year tax benefit from foreign derived intangible income | (2) | (3) | (1) | ||||||||||||||
| Deferred tax from foreign tax law change and Bakkt transaction | — | — | 4 | ||||||||||||||
| Unrecognized tax benefits | (1) | 1 | 1 | ||||||||||||||
| State apportionment changes | (6) | — | — | ||||||||||||||
| State deferred benefit of Bakkt impairment | — | (5) | — | ||||||||||||||
| Other | — | (1) | — | ||||||||||||||
| Total provision for income taxes | 16 | % | 17 | % | 29 | % |
The 16% effective tax rate in 2023 was below the statutory federal income tax rate primarily due to the following items: favorable audit settlements for historical years, favorable state apportionment changes and the application of the high-tax exception to Global Intangible Low-Taxed Income. These tax benefits were partially offset by the impact of the U.K. corporate income tax increase from 19% to 25% effective April 1, 2023 and the tax impact of certain non-deductible Black Knight acquisition costs. In conjunction with the increase in the U.K. corporate income tax rate, we intend to elect the high-tax exception to Global Intangible Low-Taxed Income in 2023. Our 2023 tax provision includes the impacts of this election.
The 17% effective tax rate in 2022 was below the statutory federal income tax rate primarily due to the deferred income tax benefit from the impairment of equity investment in Bakkt in 2022. For 2021, our effective tax rate was significantly above the statutory federal income tax rate primarily due to state taxes and the deferred income tax expenses from the U.K. corporate income tax rate increase from 19% to 25% that was enacted in 2021.
The OECD Global Anti-Base Erosion Pillar Two minimum tax rules, or Pillar Two, which generally provide for a minimum effective tax rate of 15%, are intended to apply to tax years beginning in 2024. The European Union member states and many other countries, including the U.K. our most significant non-US jurisdiction, have committed to implement or have
already enacted legislation adopting the Pillar Two rules. In July 2023, the U.K. enacted the U.K. Finance Act 2023, effective as of January 1, 2024, which included provisions to implement certain portions of the OECD Global Anti-Base Erosion Pillar Two minimum tax rules and included an election to apply a transitional safe harbor to extend certain effective dates to accounting periods ending on or before June 30, 2028. These new U.K. Pillar Two rules did not have a material impact on our income tax provision as of December 31, 2023.
Deferred Tax Assets and Liabilities
Deferred income taxes reflect the net tax effects of temporary differences between the carrying amounts of assets and liabilities for financial reporting purposes and the amounts used for income tax purposes. Certain unrecognized tax benefits associated with our acquisition of Ellie Mae are presented as a reduction to related deferred tax assets. As a result of our acquisition of Black Knight (see Note 3), compared to the prior year, the net deferred tax liabilities as of December 31, 2023 increased significantly. The property and equipment deferred moved from a deferred tax liability to a significant deferred tax asset due to the continued impacts of the capitalized research and experimental expenditure requirements that became effective in 2022 under the Tax Cuts and Jobs Act. The following table summarizes the significant components of our deferred tax liabilities and assets as of December 31, 2023 and 2022 (in millions):
| As of December 31, | |||||||||||
| 2023 | 2022 | ||||||||||
| Deferred tax assets: | |||||||||||
| Deferred and stock-based compensation | $ | 98 | $ | 78 | |||||||
| Liability reserve | 60 | 66 | |||||||||
| Tax credits | 10 | 7 | |||||||||
| Loss carryforward | 275 | 91 | |||||||||
| Deferred revenue | 25 | 19 | |||||||||
| Lease liability | 64 | 77 | |||||||||
| Property and equipment | 118 | — | |||||||||
| Other | 81 | 31 | |||||||||
| Total | 731 | 369 | |||||||||
| Valuation allowance | (166) | (92) | |||||||||
| Total deferred tax assets, net of valuation allowance | $ | 565 | $ | 277 | |||||||
| Deferred tax liabilities: | |||||||||||
| Property and equipment | $ | — | $ | (60) | |||||||
| Acquired intangibles | (4,507) | (3,527) | |||||||||
| Right of use asset | (48) | (62) | |||||||||
| Equity investment | (90) | (121) | |||||||||
| Total deferred tax liabilities | $ | (4,645) | $ | (3,770) | |||||||
| Net deferred tax liabilities | $ | (4,080) | $ | (3,493) | |||||||
| Reported as: | |||||||||||
| Net non-current deferred tax liabilities | $ | (4,080) | $ | (3,493) | |||||||
A reconciliation of the beginning and ending amount of deferred income tax valuation allowance is as follows (in millions):
| Year Ended December 31, | |||||||||||||||||
| 2023 | 2022 | 2021 | |||||||||||||||
| Beginning balance of deferred income tax valuation allowance | $ | 92 | $ | 99 | $ | 95 | |||||||||||
| Charges against goodwill | 102 | — | — | ||||||||||||||
| Increases/(Decreases) | (28) | (7) | 4 | ||||||||||||||
| Ending balance of deferred income tax valuation allowance | $ | 166 | $ | 92 | $ | 99 |
We recognize valuation allowances on deferred tax assets if, based on the weight of the evidence, we believe that it is more likely than not that some or all of the deferred tax assets will not be realized. We recorded a valuation allowance for deferred tax assets of $166 million and $92 million as of December 31, 2023 and 2022, respectively. The increase of valuation allowance charged against goodwill in 2023 is primarily related to certain deferred tax assets arising from the Black Knight acquisition that we believe are not more likely than not to be realized in the foreseeable future. The decrease
of valuation allowance in 2023 is primarily due to certain foreign subsidiaries being liquidated in the current period with associated deferred tax assets being extinguished.
The majority of our undistributed earnings of our non-U.S. subsidiaries for the period from January 1, 2018 through December 31, 2022 were subject to the Global Intangible Low-Taxed Income provisions and, as such, were subject to immediate U.S. income taxation and can be distributed to the U.S. with no material additional income tax consequences in the future. In 2023, we intend to elect the high-tax exception to Global Intangible Low-Taxed Income, and thus, the majority of the earnings of our non-U.S. subsidiaries are not expected to be subject to immediate U.S. income taxation. However, the majority of these 2023 foreign earnings can also be distributed to the U.S. with no material additional U.S. income tax consequences due to the availability of full dividends received deductions.
We remain indefinitely reinvested in our non-U.S. subsidiaries’ cumulative undistributed earnings as of December 31, 2023 that are not subject to the Global Intangible Low-Taxed Income provisions and would be subject to additional U.S. income tax consequences upon distribution to the U.S. Accordingly, no provision for U.S. federal and state income taxes has been made in the accompanying consolidated financial statements. Further, a determination of the unrecognized deferred tax liability is not practicable. An estimate of these indefinitely reinvested undistributed earnings as of December 31, 2023, based on post-income tax earnings under U.S. GAAP, is $5.8 billion.
As of December 31, 2023 and 2022, we have gross U.S. federal net operating loss carryforwards of $88 million and $100 million, respectively, and gross state and local net operating loss carryforwards of $76 million for both 2023 and 2022. The net decrease of federal net operating loss carryforwards are primarily due to losses utilized in the current year. The net operating loss carryforwards and credit carryforwards are available to offset future taxable income until they begin to expire in 2027. In addition, as of December 31, 2023 and 2022, we have gross foreign net operating loss carryforwards of $214 million and $280 million, respectively. The decrease in foreign net operating losses is primarily due to certain foreign subsidiaries being liquidated in the current period with the associated attributes being extinguished. The majority of the remaining gross foreign net operating losses are not expected to be realizable in future periods and have related valuation allowances.
A reconciliation of the beginning and ending amount of unrecognized tax benefits is as follows (in millions):
| Year Ended December 31, | |||||||||||||||||
| 2023 | 2022 | 2021 | |||||||||||||||
| Beginning balance of unrecognized tax benefits | 247 | 229 | $ | 188 | |||||||||||||
| Additions/(reductions) related to acquisitions | 25 | — | (1) | ||||||||||||||
| Additions based on tax positions taken in current year | 31 | 30 | 41 | ||||||||||||||
| Additions based on tax positions taken in prior years | 33 | — | 3 | ||||||||||||||
| Reductions based on tax positions taken in prior years | (18) | (3) | (2) | ||||||||||||||
| Reductions resulting from statute of limitation lapses | (7) | (9) | — | ||||||||||||||
| Reductions related to settlements with taxing authorities | (43) | — | — | ||||||||||||||
| Ending balance of unrecognized tax benefits | $ | 268 | $ | 247 | $ | 229 |
As of December 31, 2023 and 2022, the balance of unrecognized tax benefits which would, if recognized, affect our effective tax rate was $228 million and $208 million, respectively. It is reasonably possible, as a result of settlements of ongoing audits or statute of limitations expirations, that unrecognized tax benefits could increase as much as $31 million and decrease as much as $25 million within the next 12 months. Of the $268 million in unrecognized tax benefits as of December 31, 2023, $244 million is recorded within other non-current liabilities and $24 million is recorded within other current liabilities.
We recognize interest and penalties accrued on income tax uncertainties as a component of income tax expense/(benefit). In 2023, 2022 and 2021, we recognized ($30 million), $12 million and $10 million, respectively, of income tax expense/(benefit) for interest and penalties. As of December 31, 2023 and 2022, accrued interest and penalties were $32 million and $61 million, respectively. Of the $32 million in accrued interest and penalties as of December 31, 2023, $28 million is recorded within other non-current liabilities and $4 million is recorded within other current liabilities in the accompanying consolidated balance sheet.
We or one of our subsidiaries files income tax returns in the U.S. federal jurisdiction and various state and foreign jurisdictions. The following table summarizes open tax years by major jurisdiction:
| Jurisdiction | Open Tax Years | |||||||
| U.S. Federal | 2020 - 2023 |
| U.S. States | 2011 - 2023 | |||||||
| U.K. | 2021 - 2023 |
We have filed amended U.S. federal returns for the years prior to 2020 to claim additional credits and deductions and the associated refund claims are subject to review by the U.S. taxing authorities. Although the outcome of tax audits is always uncertain, we believe that adequate amounts of tax, including interest and penalties, have been provided for any adjustments expected to result from open tax years.
**14.**Clearing Operations
We operate six clearing houses, each of which acts as a central counterparty that becomes the buyer to every seller and the seller to every buyer for its clearing members or participants, or Members. Through this central counterparty function, the clearing houses provide financial security for each transaction for the duration of the position by limiting counterparty credit risk.
Our clearing houses are responsible for providing clearing services to each of our futures exchanges, and in some cases to third-party execution venues, and are as follows, referred to herein collectively as "the ICE Clearing Houses":
| Clearing House | Products Cleared | Exchange where Executed | Location | |||||||||||||||||
| ICE Clear Europe | Energy, agricultural, interest rates and equity index futures and options contracts | ICE Futures Europe, ICE Futures U.S., ICE Endex, ICE Futures Abu Dhabi and third-party venues | U.K. | |||||||||||||||||
| ICE Clear U.S. | Agricultural, metals, foreign exchange, or FX, interest rate and equity index futures and/or options contracts | ICE Futures U.S. | U.S. | |||||||||||||||||
| ICE Clear Credit | OTC North American, European, Asian-Pacific and Emerging Market CDS instruments | Creditex and third-party venues | U.S. | |||||||||||||||||
| ICE Clear Netherlands | Derivatives on equities and equity indices traded on regulated markets | ICE Endex | The Netherlands | |||||||||||||||||
| ICE Clear Singapore | Energy, metals and financial futures products | ICE Futures Singapore | Singapore | |||||||||||||||||
| ICE NGX | Physical North American natural gas and electricity | ICE NGX | Canada |
In 2022, we announced our decision to cease our CDS clearing service at ICE Clear Europe, our clearing house in the U.K. All cleared CDS positions at ICE Clear Europe were successfully closed out with the majority re-established at ICE Clear Credit in October 2023. Moving forward, our sole CDS clearing offering is our ICE Clear Credit clearing house in the U.S. All CDS products have been delisted at ICE Clear Europe and the final de-registration occurred in November 2023.
Original and Variation Margin
Each of the ICE Clearing Houses generally requires all Members to deposit collateral in cash or certain pledged assets. The collateral deposits are known as “original margin.” In addition, the ICE Clearing Houses may make intraday original margin calls in circumstances where market conditions require additional protection. The daily profits and losses to and from the ICE Clearing Houses due to the marking-to-market of open contracts is known as “variation margin.” The ICE Clearing Houses mark all outstanding contracts to market, and, with the exception of ICE NGX’s physical natural gas and physical power products discussed separately below, pay and collect variation margin at least once daily.
The amounts that Members are required to maintain are determined by proprietary risk models established by each ICE Clearing House and reviewed by the relevant regulators, independent model validators, risk committees and the boards of directors of the respective ICE Clearing House. The amounts required may fluctuate over time. Each of the ICE Clearing Houses is a separate legal entity and is not subject to the liabilities of the others, or the obligations of Members of the other ICE Clearing Houses.
Should a particular Member fail to deposit its original margin or fail to make a variation margin payment, when and as required, the relevant ICE Clearing House may liquidate or hedge the defaulting Member's open positions and use their original margin and guaranty fund deposits to pay any amount owed. In the event that the defaulting Member's deposits are not sufficient to pay the amount owed in full, the ICE Clearing Houses will first use their respective contributions to the guaranty fund, often referred to as Skin In The Game, or SITG, to pay any remaining amount owed. In the event that the SITG is not sufficient, the ICE Clearing Houses may utilize the respective guaranty fund deposits and default insurance, or
collect limited additional funds from their respective non-defaulting Members on a pro-rata basis, to pay any remaining amount owed.
As of December 31, 2023 and 2022, the ICE Clearing Houses had received or had been pledged $175.9 billion and $273.3 billion, respectively, in cash and non-cash collateral in original margin and guaranty fund deposits to cover price movements of underlying contracts for both periods.
Guaranty Funds and ICE Contribution
As described above, mechanisms have been created, called guaranty funds, to provide partial protection in the event of a Member default. With the exception of ICE NGX, each of the ICE Clearing Houses requires that each Member make deposits into a guaranty fund.
In addition, we have contributed our own capital that could be used if a defaulting Member’s original margin and guaranty fund deposits are insufficient. Such amounts are recorded as long-term restricted cash and cash equivalents in our balance sheets and are as follows (in millions):
| ICE Portion of Guaranty Fund Contribution | Default insurance | |||||||||||||||||||||||||||||||
| As of December 31, | As of December 31, | |||||||||||||||||||||||||||||||
| Clearing House | 2023 | 2022 | 2023 | 2022 | ||||||||||||||||||||||||||||
| ICE Clear Europe (1) | $197 | $247 | $100 | $100 | ||||||||||||||||||||||||||||
| ICE Clear U.S. (2) | 75 | 90 | 25 | 25 | ||||||||||||||||||||||||||||
| ICE Clear Credit | 50 | 50 | 75 | 75 | ||||||||||||||||||||||||||||
| ICE Clear Netherlands | 2 | 2 | N/A | N/A | ||||||||||||||||||||||||||||
| ICE Clear Singapore | 1 | 1 | N/A | N/A | ||||||||||||||||||||||||||||
| ICE NGX | 15 | 15 | 200 | 200 | ||||||||||||||||||||||||||||
| Total | $340 | $405 | $400 | $400 |
(1) The decrease in the ICE portion of the guaranty fund contribution from 2022 to 2023 at ICE Clear Europe was driven by ceasing CDS clearing at ICE Clear Europe and the related requirement for ICE Clear Europe to maintain a $50 million guaranty fund contribution related to CDS clearing.
(2) The decrease in the ICE portion of the guaranty fund contribution from 2022 to 2023 at ICE Clear U.S. was driven by the termination of our agreement with Bakkt to clear Bitcoin, and the related requirement for us to maintain a $15 million guaranty fund contribution.
We also maintain default insurance at ICE Clear Europe. ICE Clear, U.S. and ICE Clear Credit as an additional layer of clearing member default protection which is reflected in the table above. The default insurance was renewed in September 2022 and has a three-year term for the following clearing houses in the following amounts: ICE Clear Europe - $100 million; ICE Clear U.S. - $25 million; and ICE Clear Credit - $75 million. The default insurance layer resides after and in addition to the ICE Clear Europe, ICE Clear U.S. and ICE Clear Credit SITG contributions and before the guaranty fund contributions of the non-defaulting Members.
Similar to SITG, the default insurance layer is not intended to replace or reduce the position risk-based amount of the guaranty fund. As a result, the default insurance layer is not a factor that is included in the calculation of the Members’ guaranty fund contribution requirement. Instead, it serves as an additional, distinct, and separate default resource that should serve to further protect the non-defaulting Members’ guaranty fund contributions from being mutualized in the event of a default.
As of December 31, 2023, ICE NGX maintained a guaranty fund of $215 million, comprising $15 million in cash and a $200 million letter of credit backed by a default insurance policy of the same amount, discussed below.
Below is a depiction of our Default Waterfall which summarizes the lines of defense and layers of protection we maintain for our mutualized clearing houses.
ICE Clearing House Default Waterfall
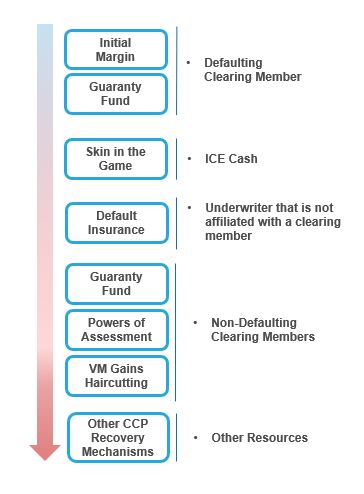
Cash and Invested Margin Deposits
We have recorded cash and invested margin and guaranty fund deposits and amounts due in our balance sheets as current assets with corresponding current liabilities to the Members. As of December 31, 2023, our cash and invested margin deposits were as follows (in millions):
| ICE Clear Europe (1) | ICE Clear Credit | ICE Clear U.S. | ICE NGX | Other ICE Clearing Houses | Total | ||||||||||||||||||||||||||||||
| Original margin | $ | 40,170 | $ | 28,353 | $ | 4,693 | $ | — | $ | 5 | $ | 73,221 | |||||||||||||||||||||||
| Unsettled variation margin, net | — | — | — | 984 | — | 984 | |||||||||||||||||||||||||||||
| Guaranty fund | 2,358 | 3,017 | 609 | — | 5 | 5,989 | |||||||||||||||||||||||||||||
| Delivery contracts receivable/payable, net | — | — | — | 600 | — | 600 | |||||||||||||||||||||||||||||
| Total | $ | 42,528 | $ | 31,370 | $ | 5,302 | $ | 1,584 | $ | 10 | $ | 80,794 |
As of December 31, 2022, our cash and invested margin deposits, were as follows (in millions):
| ICE Clear Europe (2) | ICE Clear Credit | ICE Clear U.S. | ICE NGX | Other ICE Clearing Houses | Total | ||||||||||||||||||||||||||||||
| Original margin | $ | 101,243 | $ | 31,277 | $ | 4,141 | $ | — | $ | 5 | $ | 136,666 | |||||||||||||||||||||||
| Unsettled variation margin, net | — | — | — | 749 | — | 749 | |||||||||||||||||||||||||||||
| Guaranty fund | 4,162 | 3,177 | 597 | — | 4 | 7,940 | |||||||||||||||||||||||||||||
| Delivery contracts receivable/payable, net | — | — | — | 2,017 | — | 2,017 | |||||||||||||||||||||||||||||
| Total | $ | 105,405 | $ | 34,454 | $ | 4,738 | $ | 2,766 | $ | 9 | $ | 147,372 |
(1) Amount is entirely related to futures/options.
(2) $97.6 billion and $7.8 billion is related to futures/options and CDS, respectively.
Our cash and invested margin and guaranty fund deposits are maintained in accounts with national banks and highly-rated financial institutions or secured through direct investments, primarily in U.S. Treasury and other highly-rated foreign
government securities, or reverse repurchase agreements with primarily overnight maturities. We primarily use Level 1 inputs when evaluating the fair value of the non-cash equivalent direct investments, as highly-rated government securities are quoted in active markets. The carrying value of these deposits are deemed to approximate fair value.
To provide a tool to address the liquidity needs of our clearing houses and manage the liquidation of margin and guaranty fund deposits held in the form of cash and high quality sovereign debt, ICE Clear Europe, ICE Clear Credit and ICE Clear U.S. have entered into Committed Repurchase Agreement Facilities, or Committed Repo. Additionally, ICE Clear Credit and ICE Clear Netherlands have entered into Committed FX Facilities to support these liquidity needs. As of December 31, 2023 the following facilities were in place:
-
ICE Clear Europe: $1.0 billion in Committed Repo to finance U.S. dollar, euro and pound sterling deposits.
-
ICE Clear Credit: $300 million in Committed Repo (U.S. dollar based) to finance U.S. dollar denominated sovereign debt and euro deposits, €250 million in Committed Repo (euro based) to finance euro and U.S. dollar denominated sovereign debt deposits, and €1.9 billion in Committed FX Facilities to finance euro payment obligations.
-
ICE Clear U.S.: $250 million in Committed Repo to finance U.S. dollar denominated sovereign debt deposits.
-
ICE Clear Netherlands: €10 million in Committed FX Facilities to finance euro payment obligations.
Details of our deposits are as follows (in millions):
| Cash and Cash Equivalent Margin Deposits and Guaranty Funds | ||||||||||||||||||||
| Clearing House | Investment Type | As of December 31, 2023 | As of December 31, 2022 | |||||||||||||||||
| ICE Clear Europe | National bank account (1) | $ | 5,819 | $ | 17,390 | |||||||||||||||
| ICE Clear Europe | Reverse repo | 32,695 | 65,352 | |||||||||||||||||
| ICE Clear Europe | Sovereign debt | 3,745 | 19,894 | |||||||||||||||||
| ICE Clear Europe | Demand deposits | 40 | 153 | |||||||||||||||||
| ICE Clear Credit | National bank account | 22,754 | 27,145 | |||||||||||||||||
| ICE Clear Credit | Reverse repo | 5,381 | 3,916 | |||||||||||||||||
| ICE Clear Credit | Demand deposits | 3,235 | 3,393 | |||||||||||||||||
| ICE Clear U.S. | Reverse repo | 4,955 | 4,266 | |||||||||||||||||
| ICE Clear U.S. | Sovereign debt | 347 | 472 | |||||||||||||||||
| Other ICE Clearing Houses | Demand deposits | 9 | 9 | |||||||||||||||||
| Total cash and cash equivalent margin deposits and guaranty funds | $ | 78,980 | $ | 141,990 | ||||||||||||||||
| Invested Deposits, Delivery Contracts Receivable and Unsettled Variation Margin | ||||||||||||||||||||
| Clearing House | Investment Type | As of December 31, 2023 | As of December 31, 2022 | |||||||||||||||||
| ICE NGX | Unsettled variation margin and delivery contracts receivable/payable | $ | 1,584 | $ | 2,766 | |||||||||||||||
| ICE Clear Europe | Invested deposits - sovereign debt | 230 | 2,616 | |||||||||||||||||
| Total invested deposits, delivery contracts receivable and unsettled variation margin | $ | 1,814 | $ | 5,382 |
(1) As of December 31, 2023, ICE Clear Europe held €11 million ($12.0 million based on the euro/U.S. dollar exchange rate of 1.1037 as of December 31, 2023) at the European Central Bank, or ECB, £4.6 billion ($5.8 billion based on the pound sterling/U.S. dollar exchange rate of 1.2732 as of December 31, 2023) at the Bank of England, or BOE, and €10 million ($11 million based on the above exchange rate) at the BOE. As of December 31, 2022, ICE Clear Europe held €11.7 billion ($12.5 billion based on the euro/U.S. dollar exchange rate of 1.0704 as of December 31, 2022) at ECB, £4.0 billion ($4.9 billion based on the pound sterling/U.S. dollar exchange rate of 1.2093 as of December 31, 2022) at the BOE and €10 million ($11 million based on the above exchange rate) at the BOE.
Other Deposits
In addition to the cash and invested deposits above, the ICE Clearing Houses have also received other assets from Members, which include government obligations, and may include other non-cash collateral such as letters of credit at ICE NGX, European emission allowance certificates or gold on rare occasions at ICE Clear Europe, to mitigate credit risk. For certain deposits, we may impose discount or “haircut” rates to ensure adequate collateral if market values fluctuate. These
other deposits are not reflected in the accompanying consolidated balance sheets as the risks and rewards of these assets remain with the Members unless the clearing houses have sold or re-pledged the assets or in the event of a clearing member default, where the Member is no longer entitled to redeem the assets. Any income, gain or loss accrues to the Members. The ICE Clearing Houses do not, in the ordinary course, rehypothecate or re-pledge these assets. These pledged assets are not reflected in our balance sheets, and are as follows (in millions):
| As of December 31, 2023 | |||||||||||||||||||||||||||||||||||
| ICE Clear Europe | ICE Clear Credit | ICE Clear U.S. | ICE NGX | Total | |||||||||||||||||||||||||||||||
| Original margin: | |||||||||||||||||||||||||||||||||||
| Government securities at face value | $ | 45,698 | $ | 26,992 | $ | 13,062 | $ | — | $ | 85,752 | |||||||||||||||||||||||||
| Letters of credit and other | — | — | — | 5,006 | 5,006 | ||||||||||||||||||||||||||||||
| Emissions certificates at fair value | 904 | — | — | — | 904 | ||||||||||||||||||||||||||||||
| ICE NGX cash deposits | — | — | — | 1,219 | 1,219 | ||||||||||||||||||||||||||||||
| Total | $ | 46,602 | $ | 26,992 | $ | 13,062 | $ | 6,225 | $ | 92,881 | |||||||||||||||||||||||||
| Guaranty fund: | |||||||||||||||||||||||||||||||||||
| Government securities at face value | $ | 765 | $ | 1,119 | $ | 345 | $ | — | $ | 2,229 | |||||||||||||||||||||||||
| As of December 31, 2022 | |||||||||||||||||||||||||||||||||||
| ICE Clear Europe | ICE Clear Credit | ICE Clear U.S. | ICE NGX | Total | |||||||||||||||||||||||||||||||
| Original margin: | |||||||||||||||||||||||||||||||||||
| Government securities at face value | $ | 74,964 | $ | 26,601 | $ | 14,855 | $ | — | $ | 116,420 | |||||||||||||||||||||||||
| Letters of credit | — | — | — | 5,434 | 5,434 | ||||||||||||||||||||||||||||||
| ICE NGX cash deposits | — | — | — | 2,357 | 2,357 | ||||||||||||||||||||||||||||||
| Total | $ | 74,964 | $ | 26,601 | $ | 14,855 | $ | 7,791 | $ | 124,211 | |||||||||||||||||||||||||
| Guaranty fund: | |||||||||||||||||||||||||||||||||||
| Government securities at face value | $ | 641 | $ | 805 | $ | 269 | $ | — | $ | 1,715 | |||||||||||||||||||||||||
ICE NGX
ICE NGX owns a clearing house which administers the physical delivery of energy trading contracts. ICE NGX is the central counterparty to Members on opposite sides of its physically-settled contracts, and the balance related to delivered but unpaid contracts is recorded as a delivery contract net receivable, with an offsetting delivery contract net payable in our balance sheets. Unsettled variation margin equal to the fair value of open contracts is recorded as of each balance sheet date. There is no impact on our consolidated statements of income as an equal amount is recognized as both an asset and a liability. ICE NGX marks all of its outstanding physical natural gas and physical power contracts to market daily and requires full collateralization of net accrued variation losses. Due to the highly liquid nature and the short period of time to maturity, the fair values of our delivery contract net payable and net receivable are determined to approximate carrying value.
ICE NGX requires Members to maintain cash or letters of credit to serve as collateral in the event of default. The cash is maintained in a segregated bank account for the benefit of the Member, and remains the property of the Member and, therefore, it is not included in our balance sheets. ICE NGX maintains a committed daylight-overnight liquidity facility in the amount of $100 million with an additional $200 million uncommitted with a third-party Canadian chartered bank which provides liquidity in the event of a settlement shortfall, subject to certain conditions.
As of December 31, 2023, ICE NGX maintains a guaranty fund of $215 million funded by a $200 million letter of credit issued by a major Canadian chartered bank and backed by default insurance underwritten by Export Development Canada, or EDC, a Crown corporation operated at arm’s length from the Canadian government, plus $15 million held as restricted cash to fund the first loss amount the ICE NGX is responsible for under the default insurance policy. In the event of a participant default where the Member’s collateral is depleted, the shortfall would be covered by a draw down on the letter of credit following which ICE NGX would file a claim under the default insurance to recover additional losses up to $200 million beyond the $15 million first-loss amount that ICE NGX is responsible for under the default insurance policy.
Clearing House Exposure
The net notional value of unsettled contracts was $2.1 trillion as of December 31, 2023. Each ICE Clearing House bears financial counterparty credit risk and provides a central counterparty guarantee, or performance guarantee, to its Members. In its guarantor role, each ICE Clearing House has equal and offsetting claims to and from Members on opposite sides of each contract, standing as an intermediary on every contract cleared. To reduce their exposure, the ICE Clearing Houses have a risk management program with both initial and ongoing membership standards. With the exception of ICE NGX, the ICE Clearing Houses mark all outstanding contracts to market and pay and collect variation margin at least once daily.
Excluding the effects of original and variation margin, guaranty fund and collateral requirements and default insurance, the ICE Clearing Houses’ maximum estimated exposure for this guarantee would be the intra-day or full day change in fair value if all Members who have open positions with unrealized losses simultaneously defaulted which is an extremely unlikely scenario. The levels of original margin are calibrated such that a portfolio the ICE Clearing House may be required to liquidate post Member default can be closed or auctioned without recourse to resources other than those deposited by the defaulting Member, assuming an appropriate risk confidence level and liquidation period. In addition to the base margin model, each ICE Clearing House, depending on its products, employs a number of margin add-ons related to position concentration, clearing member capital, volatility, spread responses, recovery rate sensitivity, jump-to-default, and wrong way risk.
We also performed calculations to determine the fair value of our counterparty performance guarantee taking into consideration factors such as daily settlement of contracts, margining and collateral requirements, other elements of our risk management program, historical evidence of default payments, and estimated probability of potential default payouts by the ICE Clearing Houses. Based on these analyses, the estimated counterparty performance guarantee liability was determined to be nominal and no liability was recorded as of December 31, 2023 or 2022. The ICE Clearing Houses have never experienced an incident of a clearing member default which has required the use of the guaranty funds of non-defaulting clearing members or the assets of the ICE Clearing Houses.
Interest on Margin Deposits and Fees Charged for Non-Cash Margin
The net interest income on cash margin and fees charged for non-cash margin retained by the ICE Clearing Houses is recorded in our exchanges revenues and fixed income and data services revenues in our consolidated statements of income. We recognized a combined $369 million and $341 million as our revenues during the years ended December 31, 2023 and 2022, respectively,
15. Leases
We have lease agreements for office space and data center facilities. All of our leases are classified as operating leases and we do not have any significant leases classified as finance leases.
As of December 31, 2023, the weighted-average remaining lease term was 6.7 years and the weighted average discount rate was 5.1%. As of December 31, 2022, the weighted-average remaining lease term was 4.7 years and the weighted average discount rate was 3.0%.
We recognized $58 million, $52 million and $61 million of rent expense for office space as rent and occupancy expense in 2023, 2022, and 2021, respectively, and $32 million, $26 million and $24 million for data center facilities as technology and communication expense in 2023, 2022, and 2021, respectively, within our consolidated income statements. We do not have any significant variable lease costs related to building and maintenance costs, real estate taxes, or other charges.
Our lease assets are included within property, plant and equipment and our lease liabilities are included in current and noncurrent liabilities within our consolidated balance sheets. Details of our lease asset and liability balances are as follows (in millions):
| As of December 31, 2023 | As of December 31, 2022 | As of January 1, 2022 | |||||||||||||||
| Right-of-use lease assets | $ | 305 | $ | 278 | $ | 278 | |||||||||||
| Current operating lease liability | 60 | 65 | 72 | ||||||||||||||
| Non-current operating lease liability | 299 | 254 | 252 | ||||||||||||||
| Total operating lease liability | $ | 359 | $ | 319 | $ | 324 |
As of December 31, 2023, we estimate that our operating lease liability will be recognized in the following years (in millions):
| 2024 | $ | 73 | |||
| 2025 | 75 | ||||
| 2026 | 56 | ||||
| 2027 | 64 | ||||
| 2028 | 39 | ||||
| Thereafter | 135 | ||||
| Lease liability amounts repayable | $ | 442 | |||
| Interest costs | (83) | ||||
| Total operating lease liability | $ | 359 |
Supplemental cash flow information and non-cash activity related to our operating leases are as follows:
| Year Ended December 31, 2023 | Year Ended December 31, 2022 | ||||||||||||||||
| Cash paid for amounts included in the measurement of operating lease liability | $ | 85 | $ | 89 | |||||||||||||
| Right-of-use assets obtained in exchange for operating lease obligations | $ | 115 | $ | 92 |
16. Commitments and Contingencies
Legal Proceedings
In the ordinary course of our business, from time to time we are subject to legal proceedings, lawsuits, government investigations and other claims with respect to a variety of matters. In addition, we are subject to periodic reviews, inspections, examinations and investigations by regulators in the U.S. and other jurisdictions, any of which may result in claims, legal proceedings, assessments, fines, penalties, restrictions on our business or other sanctions. We record estimated expenses and reserves for legal or regulatory matters or other claims when these matters present loss contingencies that are probable and the related amount is reasonably estimable, and gain contingencies when they become certain. Any such accruals may be adjusted as circumstances change. Assessments of losses are inherently subjective and involve unpredictable factors. While the outcome of legal and regulatory matters is inherently difficult to predict and/or the range of loss often cannot be reasonably estimable, we do not believe that the liabilities, if any, which may ultimately result from the resolution of the various legal and regulatory matters that arise in the ordinary course of our business, including the matters described below, are likely to have a material adverse effect on our consolidated financial condition, results of operations, or liquidity. It is possible, however, that future results of operations for any particular quarterly or annual period could be materially and adversely affected by any developments relating to these legal and regulatory matters.
Black Knight Transaction Litigation
On March 9, 2023, the Federal Trade Commission, or the FTC, filed an administrative complaint alleging that the proposed transaction between ICE and Black Knight, if consummated, would be an unfair method of competition in violation of Section 5 of the Federal Trade Commission Act, and that it would substantially lessen competition, or tend to create a monopoly, in violation of Section 7 of the Clayton Act. The complaint sought a variety of injunctive relief, including, among other things, a prohibition on the completion of the transaction without the FTC’s consent and, if the transaction is completed, a divestiture or reconstitution of assets in a manner that restores such separate and independent businesses as the parties had operated prior to the completion of the transaction. On April 10, 2023, the FTC filed a complaint in the United States District Court for the Northern District of California for a temporary restraining order and preliminary injunction enjoining the completion of the transaction. On April 21, 2023, the court entered a temporary restraining order, or TRO, enjoining the completion of the transaction until the court ruled on the FTC’s motion for a preliminary injunction. In their answers to the administrative and court complaints, filed on March 20, 2023 and April 25, 2023, respectively, ICE and Black Knight denied the FTC’s substantive allegations; asserted numerous affirmative defenses; described the pro-competitive aspects and significant lender, servicer, investor, vendor and consumer benefits relating to this transaction; and denied that the combination of their respective businesses would violate any laws. Additionally, the answers to the court complaint contained counterclaims by ICE and Black Knight against the FTC seeking declaratory relief that the FTC’s administrative process is unconstitutional and should be enjoined. On July 17, 2023, the district court entered an order granting a joint motion by the parties to continue the evidentiary hearing on the FTC's motion for a preliminary injunction, noting that the parties were discussing a potential resolution of the matter resulting from the announcement of the planned divestiture of the Optimal Blue business (Note 3) and the FTC’s analysis
of the implications of the divestiture for this case and the administrative complaint. On July 25, 2023, the FTC granted an unopposed motion filed by FTC counsel to withdraw the administrative complaint from adjudication, and, on August 7, 2023, the parties announced a joint stipulation to dismiss the federal court complaint and dissolve the TRO. ICE and Black Knight entered into an Agreement Containing Consent Orders with the FTC's Bureau of Competition on August 25, 2023, which fully and finally resolved the matter upon completion of the transaction effective as of September 5, 2023.
PennyMac Arbitration
In 2019, Black Knight Servicing Technologies, LLC, or BKST, an indirect, wholly-owned subsidiary of Black Knight, filed a Complaint and Demand for Jury Trial, or the Black Knight Complaint, against PennyMac Loan Services, LLC, or PennyMac, in Florida state court. The Black Knight Complaint includes causes of action for breach of contract and misappropriation of MSP® System trade secrets by PennyMac for it to develop a mortgage servicing system (known as SSE) intended to replace the MSP® System. The Black Knight Complaint seeks damages for breach of contract and misappropriation of trade secrets, injunctive relief under the Florida Uniform Trade Secrets Act and a declaratory judgment that BKST owns all intellectual property and software developed by or on behalf of PennyMac as a result of its wrongful use of and access to the MSP® System and related trade secret and confidential information. PennyMac filed a motion to compel arbitration of the action, and the trial court granted the motion in 2020. The trial court’s order compelling arbitration was confirmed on appeal.
Shortly after the filing of the Black Knight Complaint, PennyMac filed an Antitrust Complaint, or the PennyMac Complaint, against Black Knight in the United States District Court for the Central District of California. The PennyMac Complaint includes causes of action for alleged monopolization and attempted monopolization under Section 2 of the Sherman Antitrust Act, violation of California’s Cartwright Act, violation of California’s Unfair Competition Law and common law unfair competition under California law. The PennyMac Complaint seeks equitable remedies, damages and other monetary relief, including treble and punitive damages. Generally, PennyMac alleges that Black Knight relies on various anticompetitive, unfair and discriminatory practices to maintain and to enhance its dominance in the mortgage servicing platform market and in an attempt to monopolize the platform software applications market. Black Knight moved to dismiss the PennyMac Complaint or have the action transferred to Florida based upon a forum selection clause in the agreement with BKST. In 2020, the judge granted Black Knight's motion to transfer the case to Florida and denied as moot the motion to dismiss, and PennyMac filed a notice of dismissal of this action without prejudice and indicated that it intended to bring the claims raised in the dismissed PennyMac Complaint as defenses, third party claims and/or counterclaims in arbitration. Following PennyMac’s submission of this matter in 2020 to the American Arbitration Association, PennyMac filed an amended arbitration demand and Black Knight filed an answering statement. A multi-week arbitration hearing was held on Black Knight’s and PennyMac’s respective claims, and the hearing concluded in June 2023.
On November 29, 2023, the arbitrator issued an Interim Award that, among other things, found that PennyMac, in developing its SSE software, engaged in the unauthorized use of Black Knight’s confidential information; granted Black Knight’s breach of contract claim on this basis; and awarded Black Knight $155.2 million in damages (reduced to $150.2 million by a subsequent order dated January 3, 2024 clarifying the period through which damages applied). The Interim Award denied Black Knight’s claim for misappropriation of trade secrets and granted or denied (or denied as moot) various of the parties’ respective other claims. On January 12, 2024, the arbitrator entered a Final Award stating that an additional $7.0 million is owed to Black Knight for prejudgment interest for a total award of $157.2 million. The arbitrator further found Black Knight is owed post-judgment interest to run beginning the day after the Interim Award (which, as of this filing, amounts to more than $2.5 million, and continues to accrue). We expect PennyMac to pay Black Knight the amount owed in the first quarter of 2024.
Tax Audits
We are engaged in ongoing discussions and audits with taxing authorities on various tax matters, the resolutions of which are uncertain. Currently, there are matters that may lead to assessments involving us or one of our subsidiaries, some of which may not be resolved for several years. Based on currently available information, we believe we have adequately provided for any assessments that could result from those proceedings where it is more likely than not that we will be assessed. We continuously review our positions as these matters progress.
17. Pension and Other Benefit Programs
Defined Benefit Pension Plan
We have a pension plan covering employees in certain of our U.S. operations whose benefit accrual has been frozen. Retirement benefits are derived from a formula, which is based on length of service and compensation.
We did not make any contributions to our pension plan during 2023, 2022 or 2021. The plan’s target allocation is 5% equity securities and 95% fixed income securities. The fixed income allocation includes corporate bonds of companies from diversified industries and U.S. government bonds. Our long-term objective is to keep the plan at or near full funding, while minimizing the risk inherent in pension plans. As a result, we don't anticipate that there will be a strong need for contributions in future years, and the pension plan will not be required to pay the Pension Benefit Guaranty Corporation variable rate premiums. We do not expect to make contributions to the pension plan in 2024. We will continue to monitor the plan’s funded status, and we will consider modifying the plan’s investment policy based on the actuarial and funding characteristics of the retirement plan, the demographic profile of plan participants, and our business objectives.
The fair values of our plan assets as of December 31, 2023, by asset category, are as follows (in millions):
| Fair Value Measurements | ||||||||||||||||||||||||||
| Asset Category | Quoted Prices in Active Markets for Identical Assets (Level 1) | Significant Observable Inputs (Level 2) | Significant Unobservable Inputs (Level 3) | Total | ||||||||||||||||||||||
| Cash | $ | 8 | $ | — | $ | — | $ | 8 | ||||||||||||||||||
| Equity securities: | ||||||||||||||||||||||||||
| U.S. large-cap | — | 18 | — | 18 | ||||||||||||||||||||||
| U.S. small-cap | — | 6 | — | 6 | ||||||||||||||||||||||
| International | — | 11 | — | 11 | ||||||||||||||||||||||
| Fixed income securities | 154 | 542 | 5 | 701 | ||||||||||||||||||||||
| Total | $ | 162 | $ | 577 | $ | 5 | $ | 744 |
The above table includes a total of $50 million of net unsettled securities purchases as of December 31, 2023. These trades settled in January 2024.
The fair values of our plan assets as of December 31, 2022, by asset category, are as follows (in millions):
| Fair Value Measurements | ||||||||||||||||||||||||||
| Asset Category | Quoted Prices in Active Markets for Identical Assets (Level 1) | Significant Observable Inputs (Level 2) | Significant Unobservable Inputs (Level 3) | Total | ||||||||||||||||||||||
| Cash | $ | 8 | $ | — | $ | — | $ | 8 | ||||||||||||||||||
| Equity securities: | ||||||||||||||||||||||||||
| U.S. large-cap | — | 20 | — | 20 | ||||||||||||||||||||||
| U.S. small-cap | — | 5 | — | 5 | ||||||||||||||||||||||
| International | — | 12 | — | 12 | ||||||||||||||||||||||
| Fixed income securities | 118 | 526 | 6 | 650 | ||||||||||||||||||||||
| Total | $ | 126 | $ | 563 | $ | 6 | $ | 695 |
The above table includes a total of $8 million of net unsettled securities purchases as of December 31, 2022. These trades settled in January 2023.
The measurement dates for the pension plan are December 31, 2023 and 2022. The following table provides a summary of the changes in the pension plan’s benefit obligations and the fair value of assets measured using the valuation techniques described in Note 18, as of December 31, 2023 and 2022 and a statement of funded status of the pension plan as of December 31, 2023 and 2022 (in millions):
| As of December 31, | |||||||||||
| 2023 | 2022 | ||||||||||
| Change in benefit obligation: | |||||||||||
| Benefit obligation at beginning of year | $ | 647 | $ | 846 | |||||||
| Interest cost | 30 | 17 | |||||||||
| Actuarial (gain)/loss | 14 | (169) | |||||||||
| Benefits paid | (47) | (47) | |||||||||
| Benefit obligation at year end | $ | 644 | $ | 647 | |||||||
| Change in plan assets: | |||||||||||
| Fair value of plan assets at beginning of year | $ | 687 | $ | 920 | |||||||
| Actual return on plan assets | 54 | (186) | |||||||||
| Benefits paid | (47) | (47) | |||||||||
| Fair value of plan assets at end of year | $ | 694 | $ | 687 | |||||||
| Funded status | $ | 50 | $ | 40 | |||||||
| Accumulated benefit obligation | $ | 644 | $ | 647 | |||||||
| Amounts recognized in the accompanying consolidated balance sheets: | |||||||||||
| Accrued pension plan asset | $ | 50 | $ | 40 |
The following shows the components of the pension plan expense for 2023, 2022 and 2021 (in millions):
| Year Ended December 31, | |||||||||||||||||
| 2023 | 2022 | 2021 | |||||||||||||||
| Interest cost | $ | 30 | $ | 17 | $ | 14 | |||||||||||
| Estimated return on plan assets | (35) | (21) | (19) | ||||||||||||||
| Amortization of loss | — | 2 | 6 | ||||||||||||||
| Aggregate pension (benefit)/expense | $ | (5) | $ | (2) | $ | 1 |
We use a market-related value of plan assets when determining the estimated return on plan assets. Gains/losses on plan assets are amortized over a four-year period and accumulate in other comprehensive income. We recognize deferred gains and losses in future net income based on a “corridor” approach, where the corridor is equal to 10% of the greater of the benefit obligation or the market-related value of plan assets at the beginning of the year.
The following shows the projected payments for the pension plan based on actuarial assumptions (in millions):
| 2024 | $ | 50 | |||
| 2025 | 51 | ||||
| 2026 | 50 | ||||
| 2027 | 50 | ||||
| 2028 | 49 | ||||
| Next 5 years | 232 |
Supplemental Executive Retirement Plan
We have a U.S. nonqualified supplemental executive retirement plan, or SERP, which provides supplemental retirement benefits for certain employees. The future benefit accrual of the SERP plan is frozen. To provide for the future payments of these benefits, we have purchased insurance on the lives of certain of the participants through company-owned policies. As of both December 31, 2023 and 2022, the cash surrender value of such policies was $64 million and is included in other non-current assets in the accompanying consolidated balance sheets. We also acquired a SERP through both the
ICE NGX and CHX acquisitions. The following table provides a summary of the changes in the SERP benefit obligations (in millions):
| As of December 31, | |||||||||||
| 2023 | 2022 | ||||||||||
| Change in benefit obligation: | |||||||||||
| Benefit obligation at beginning of year | $ | 26 | $ | 33 | |||||||
| Interest cost | 1 | 1 | |||||||||
| Actuarial (gain)/loss | — | (3) | |||||||||
| Benefits paid | (4) | (5) | |||||||||
| Benefit obligation at year end | $ | 23 | $ | 26 | |||||||
| Funded status | $ | (23) | $ | (26) | |||||||
| Amounts recognized in the accompanying consolidated balance sheets: | |||||||||||
| Other current liabilities | $ | (4) | $ | (4) | |||||||
| Accrued employee benefits | (19) | (22) |
SERP plan expense in the accompanying consolidated statements of income was $1 million each year in 2023, 2022 and 2021 and primarily consisted of interest cost. The following table shows the projected payments for the SERP plan based on the actuarial assumptions (in millions):
| Projected SERP Plan Payments | |||||
| 2024 | $ | 4 | |||
| 2025 | 3 | ||||
| 2026 | 3 | ||||
| 2027 | 2 | ||||
| 2028 | 2 | ||||
| Next 5 years | 9 |
Pension and SERP Plans Assumptions
The weighted-average assumptions used to develop the actuarial present value of the projected benefit obligation and net periodic pension/SERP costs in 2023, 2022 and 2021 are set forth below:
| Year Ended December 31, | |||||||||||||||||
| 2023 | 2022 | 2021 | |||||||||||||||
| Weighted-average discount rate for determining benefit obligations (pension/SERP plans) | 4.7% / 4.6% | 4.9% / 4.8% | 2.6% / 2.1% | ||||||||||||||
| Weighted-average discount rate for determining interest costs (pension/SERP plans) | 4.8% / 4.7% | 2.1% / 1.6% | 1.6% / 1.1% | ||||||||||||||
| Expected long-term rate of return on plan assets (pension/SERP plans) | 4.4% / N/A | 2.5% / N/A | 2.3% / N/A | ||||||||||||||
| Rate of compensation increase | N/A | N/A | N/A |
The assumed discount rate reflects the market rates for high-quality corporate bonds currently available. The discount rate was determined by considering the average of pension yield curves constructed on a large population of high quality corporate bonds. The resulting discount rates reflect the matching of plan liability cash flows to yield curves. To develop the expected long-term rate of return on assets assumption, we considered the historical returns and the future expectations for returns for each asset class as well as the target asset allocation of the pension portfolio.
The determination of the interest cost component utilizes a full yield curve approach by applying the specific spot rates along the yield curve used in the determination of the benefit obligation to each year’s discounted cash flow.
Post-retirement Benefit Plans
Our defined benefit plans provide certain health care and life insurance benefits for certain eligible retired NYSE U.S. employees. These post-retirement benefit plans, which may be modified in accordance with their terms, are fully frozen. The net periodic post-retirement benefit costs were $3 million, $3 million and $2 million in 2023, 2022 and 2021, respectively. The defined benefit plans are unfunded and we currently do not expect to fund the post-retirement benefit plans. The weighted-average discount rate for determining the benefit obligation as of December 31, 2023 and 2022 was 4.7% and 4.9%, respectively. The weighted-average discount rate for determining the interest cost as of December 31, 2023 and 2022 was 4.8% and 2.1%, respectively. The following table shows the actuarial determined benefit obligation,
interest costs, employee contributions, actuarial (gain)/loss, benefits paid during the periods and the accrued employee benefits (in millions):
| As of December 31, | |||||||||||
| 2023 | 2022 | ||||||||||
| Benefit obligation at the end of year | $ | 129 | $ | 116 | |||||||
| Interest cost | 5 | 3 | |||||||||
| Actuarial (gain)/loss | 19 | (22) | |||||||||
| Employee contributions | 2 | 2 | |||||||||
| Benefits paid | (13) | (12) | |||||||||
| Amounts recognized in the accompanying consolidated balance sheets: | |||||||||||
| Other current liabilities | $ | (9) | $ | (8) | |||||||
| Accrued employee benefits | (120) | (108) |
The following table shows the payments projected for our post-retirement benefit plans (net of expected Medicare subsidy receipts of $9 million in aggregate over the next ten fiscal years) based on actuarial assumptions (in millions):
| Projected Post-Retirement Benefit by Year: | Projected Payment | |||||||
| 2024 | $ | 9 | ||||||
| 2025 | 9 | |||||||
| 2026 | 10 | |||||||
| 2027 | 10 | |||||||
| 2028 | 10 | |||||||
| Next 5 years | 48 |
For measurement purposes, we assumed a 6.5% annual rate of increase in the per capita cost of covered health care benefits in 2023 which will decrease on a graduated basis to 3.9% in the year 2047 and thereafter.
Accumulated Other Comprehensive Loss
The accumulated other comprehensive loss, after tax, as of December 31, 2023, consisted of the following amounts that have not yet been recognized in net periodic benefit cost (in millions):
| Pension Plans | SERP Plans | Post-retirement Benefit Plans | Total | ||||||||||||||||||||
| Unrecognized net actuarial losses/(gains), after tax | $ | 77 | $ | 3 | $ | (14) | $ | 66 |
Other Benefit Plans and Defined Contribution Plans
Our U.S. employees are eligible to participate in 401(k) and profit sharing plans and our non-U.S. employees are eligible to participate in defined contribution pension plans. Total contributions under the 401(k), profit sharing and defined contribution pension plans were $69 million, $64 million and $63 million in 2023, 2022 and 2021, respectively. No discretionary or profit sharing contributions were made during 2023, 2022 or 2021.
18. Fair Value Measurements
Financial assets and liabilities recorded or disclosed at fair value in the accompanying consolidated balance sheets as of December 31, 2023 and 2022 were classified in their entirety based on the lowest level of input that is significant to the asset or liability’s fair value measurement.
Our mutual funds are equity and fixed income mutual funds held for the purpose of providing future payments for the supplemental executive savings plan and SERP. These mutual funds are classified as equity investments and measured at fair value using Level 1 inputs with adjustments recorded in net income (see Note 17). Our debt securities held at certain of our clearing houses for purposes of meeting regulatory capital requirements are primarily U.S. Treasury securities or other high quality sovereign debt and are measured at fair value using Level 1 inputs with adjustments recorded in net income.
Excluding our equity investments without a readily determinable fair value, all other financial instruments are determined to approximate carrying value due to the short period of time to their maturities. Our equity investment in D&B (Note 4) was measured at fair value on a recurring basis using Level 2 inputs including the directly observable D&B stock price,
adjusted for a lack of marketability factor associated with the investment. We sold this investment in 2023 and no longer held it as of December 31, 2023.
As described in Note 3, we measured the Promissory Note obtained in connection with the Optimal Blue sale using Level 3 inputs. The valuation technique used was a discounted cash flow model using key unobservable assumptions included an estimated prepayment rate and a discount rate at the Divestiture Date. For subsequent measurement as of December 31, 2023, we used a combination of the Level 3 inputs, a prepayment rate of 2% and discount rate of 30.8%, and indicative price points from the ongoing Promissory Note sale process resulting in a fair value loss of $160 million recorded in other income/(expense), net in the consolidated statements of income. Increases to the prepayment rate and/or discount rate, in isolation, would result in a decrease in a fair value measurement.
Prior to the Divestiture Date, and excluding the Promissory Note, we did not use Level 3 inputs to determine the fair value of assets or liabilities measured at fair value on a recurring basis as of December 31, 2023 or 2022.
We measure certain assets, such as intangible assets and equity method investments, at fair value on a non-recurring basis. These assets are recognized at fair value if they are deemed to be impaired. During 2022, we evaluated these intangible assets and investments and determined that the value of our equity method investment in Bakkt was impaired using a Level 1 input, which was the publicly-traded closing stock price of Bakkt on December 30, 2022, the last trading day of 2022. As of December 31, 2023 and 2022, no other intangible assets or equity method investments were required to be recorded at fair value since no other impairments were recorded, except for an impairment on certain trademark intangible assets which is recorded in depreciation and amortization in our consolidated statements of income.
We measure certain equity investments at fair value on a non-recurring basis using our policy election under ASU 2016-01 (see Note 2). No fair value adjustments were required under our accounting policy election related to these investments (see Note 4) during 2023 or 2022.
See Note 14 for the fair value considerations related to our margin deposits, guaranty funds and delivery contracts receivable.
The table below displays the fair value of our debt as of December 31, 2023 and December 31, 2022. The fair values of our fixed rate notes were estimated using Level 2 inputs including quoted market prices for these instruments. The fair value of our commercial paper as of December 31, 2023 and 2022 includes a discount and other short-term debt approximates par value since the interest rates on this short-term debt approximate market rates as of December 31, 2023 and December 31, 2022.
| As of December 31, 2023 | As of December 31, 2022 | ||||||||||||||||||||||
| (in millions) | (in millions) | ||||||||||||||||||||||
| Carrying Amount | Fair value | Carrying Amount | Fair value | ||||||||||||||||||||
| Debt: | |||||||||||||||||||||||
| Commercial Paper | $ | 1,954 | $ | 1,954 | $ | — | $ | — | |||||||||||||||
| Other short-term debt | — | — | 4 | 4 | |||||||||||||||||||
| 2025 Term Loan due Aug 31, 2025 | 1,600 | 1,600 | — | — | |||||||||||||||||||
| 3.65% Senior Notes due May 23, 2025 | 1,246 | 1,227 | 1,243 | 1,224 | |||||||||||||||||||
| 3.75% Senior Notes due December 1, 2025 | 1,248 | 1,229 | 1,247 | 1,218 | |||||||||||||||||||
| 4.00% Senior Notes due September 15, 2027 | 1,489 | 1,474 | 1,487 | 1,450 | |||||||||||||||||||
| 3.10% Senior Notes due September 15, 2027 | 498 | 477 | 498 | 465 | |||||||||||||||||||
| 3.625% Senior Notes due September 1, 2028 | 920 | 915 | — | — | |||||||||||||||||||
| 3.75% Senior Notes due September 21, 2028 | 596 | 584 | 594 | 568 | |||||||||||||||||||
| 4.35% Senior Notes due June 15, 2029 | 1,241 | 1,246 | 1,240 | 1,210 | |||||||||||||||||||
| 2.10% Senior Notes due June 15, 2030 | 1,238 | 1,082 | 1,235 | 1,022 | |||||||||||||||||||
| 1.85% Senior Notes due September 15, 2032 | 1,486 | 1,205 | 1,485 | 1,130 | |||||||||||||||||||
| 4.60% Senior Notes due March 15, 2033 | 1,489 | 1,499 | 1,488 | 1,440 | |||||||||||||||||||
| 2.65% Senior Notes due September 15, 2040 | 1,232 | 935 | 1,231 | 871 | |||||||||||||||||||
| 4.25% Senior Notes due September 21, 2048 | 1,232 | 1,125 | 1,231 | 1,052 | |||||||||||||||||||
| 3.00% Senior Notes due June 15, 2050 | 1,222 | 898 | 1,221 | 841 | |||||||||||||||||||
| 4.95% Senior Notes due June 15, 2052 | 1,466 | 1,503 | 1,464 | 1,395 | |||||||||||||||||||
| 3.00% Senior Notes due September 15, 2060 | 1,472 | 1,019 | 1,471 | 938 | |||||||||||||||||||
| 5.20% Senior Notes due June 15, 2062 | 984 | 1,026 | 983 | 951 | |||||||||||||||||||
| Total debt | $ | 22,613 | $ | 20,998 | $ | 18,122 | $ | 15,779 | |||||||||||||||
19. Segment Reporting
Our business is conducted through three reportable business segments, comprised of the following:
-
Exchanges:** We operate regulated marketplace technology for the listing, trading and clearing of a broad array of derivatives contracts and financial securities as well as data and connectivity services related to those venues;
-
Fixed Income and Data Services:** We provide fixed income pricing, reference data, indices, analytics and execution services, as well as global CDS clearing and multi-asset class data delivery technology; and
-
Mortgage Technology:** We provide a technology platform that offers customers comprehensive, digital workflow tools that aim to address inefficiencies and mitigate risks that exist in the U.S. residential mortgage market life cycle, from application through closing, servicing and the secondary market.
While revenues are recorded specifically in the segment in which they are earned or to which they relate, a significant portion of our operating expenses are not solely related to a specific segment because the expenses serve functions that are necessary for the operation of more than one segment. We directly allocate expenses when reasonably possible to do so. Otherwise, we use a pro-rata revenue approach as the allocation method for the expenses that do not relate solely to one segment and serve functions that are necessary for the operation of all segments.
Our chief operating decision maker does not review total assets or statements of income below operating income by segments; therefore, such information is not presented below. Our three segments do not engage in intersegment transactions.
During 2023, we reclassified certain revenues within our Mortgage Technology segment that were previously included in other revenues to closing solutions, origination technology and data and analytics revenues. Closing solutions revenues now include membership dues, and origination technology revenues and data and analytics revenues now include their related professional services revenues. As of December 31, 2023, other revenues are no longer separately presented. We believe this is a more accurate reflection of the nature of these revenues. The impact of this change was not material, and
the prior year periods have been adjusted for comparability. Additionally, following the acquisition of Black Knight in the third quarter of 2023, we have added servicing software to our Mortgage Technology segment revenues.
Financial data for our business segments is as follows for 2023, 2022 and 2021 (in millions):
| Year Ended December 31, 2023 | ||||||||||||||||||||||||||
| Exchanges | Fixed Income and Data Services | Mortgage Technology | Consolidated | |||||||||||||||||||||||
| Revenues: | ||||||||||||||||||||||||||
| Energy futures and options | $ | 1,498 | $ | — | $ | — | $ | 1,498 | ||||||||||||||||||
| Agricultural and metals futures and options | 271 | — | — | 271 | ||||||||||||||||||||||
| Financial futures and options | 460 | — | — | 460 | ||||||||||||||||||||||
| Cash equities and equity options | 2,298 | — | — | 2,298 | ||||||||||||||||||||||
| OTC and other | 398 | — | — | 398 | ||||||||||||||||||||||
| Data and connectivity services | 933 | — | — | 933 | ||||||||||||||||||||||
| Listings | 497 | — | — | 497 | ||||||||||||||||||||||
| Fixed income execution | — | 124 | — | 124 | ||||||||||||||||||||||
| CDS clearing | — | 360 | — | 360 | ||||||||||||||||||||||
| Fixed income data and analytics | — | 1,118 | — | 1,118 | ||||||||||||||||||||||
| Other data and network services | — | 629 | — | 629 | ||||||||||||||||||||||
| Origination technology | — | — | 694 | 694 | ||||||||||||||||||||||
| Closing solutions | — | — | 179 | 179 | ||||||||||||||||||||||
| Servicing software | — | — | 288 | 288 | ||||||||||||||||||||||
| Data and analytics | — | — | 156 | 156 | ||||||||||||||||||||||
| Revenues | 6,355 | 2,231 | 1,317 | 9,903 | ||||||||||||||||||||||
| Transaction-based expenses | 1,915 | — | — | 1,915 | ||||||||||||||||||||||
| Revenues, less transaction-based expenses | 4,440 | 2,231 | 1,317 | 7,988 | ||||||||||||||||||||||
| Operating expenses | 1,281 | 1,420 | 1,593 | 4,294 | ||||||||||||||||||||||
| Operating income | $ | 3,159 | $ | 811 | $ | (276) | $ | 3,694 | ||||||||||||||||||
| Year Ended December 31, 2022 | ||||||||||||||||||||||||||
| Exchanges | Fixed Income and Data Services | Mortgage Technology | Consolidated | |||||||||||||||||||||||
| Revenues: | ||||||||||||||||||||||||||
| Energy futures and options | $ | 1,162 | $ | — | $ | — | $ | 1,162 | ||||||||||||||||||
| Agricultural and metals futures and options | 235 | — | — | 235 | ||||||||||||||||||||||
| Financial futures and options | 475 | — | — | 475 | ||||||||||||||||||||||
| Cash equities and equity options | 2,722 | — | — | 2,722 | ||||||||||||||||||||||
| OTC and other | 429 | — | — | 429 | ||||||||||||||||||||||
| Data and connectivity services | 877 | — | — | 877 | ||||||||||||||||||||||
| Listings | 515 | — | — | 515 | ||||||||||||||||||||||
| Fixed income execution | — | 101 | — | 101 | ||||||||||||||||||||||
| CDS clearing | — | 305 | — | 305 | ||||||||||||||||||||||
| Fixed income data and analytics | — | 1,098 | — | 1,098 | ||||||||||||||||||||||
| Other data and network services | — | 588 | — | 588 | ||||||||||||||||||||||
| Origination technology | — | — | 798 | 798 | ||||||||||||||||||||||
| Closing solutions | — | — | 239 | 239 | ||||||||||||||||||||||
| Servicing software | — | — | — | — | ||||||||||||||||||||||
| Data and analytics | — | — | 92 | 92 | ||||||||||||||||||||||
| Revenues | 6,415 | 2,092 | 1,129 | 9,636 | ||||||||||||||||||||||
| Transaction-based expenses | 2,344 | — | — | 2,344 | ||||||||||||||||||||||
| Revenues, less transaction-based expenses | 4,071 | 2,092 | 1,129 | 7,292 | ||||||||||||||||||||||
| Operating expenses | 1,209 | 1,373 | 1,072 | 3,654 | ||||||||||||||||||||||
| Operating income | $ | 2,862 | $ | 719 | $ | 57 | $ | 3,638 | ||||||||||||||||||
| Year Ended December 31, 2021 | ||||||||||||||||||||||||||
| Exchanges | Fixed Income and Data Services | Mortgage Technology | Consolidated | |||||||||||||||||||||||
| Revenues: | ||||||||||||||||||||||||||
| Energy futures and options | $ | 1,236 | $ | — | $ | — | $ | 1,236 | ||||||||||||||||||
| Agricultural and metals futures and options | 228 | — | — | 228 | ||||||||||||||||||||||
| Financial futures and options | 394 | — | — | 394 | ||||||||||||||||||||||
| Cash equities and equity options | 2,377 | — | — | 2,377 | ||||||||||||||||||||||
| OTC and other | 326 | — | — | 326 | ||||||||||||||||||||||
| Data and connectivity services | 838 | — | — | 838 | ||||||||||||||||||||||
| Listings | 479 | — | — | 479 | ||||||||||||||||||||||
| Fixed income execution | — | 52 | — | 52 | ||||||||||||||||||||||
| CDS clearing | — | 192 | — | 192 | ||||||||||||||||||||||
| Fixed income data and analytics | — | 1,082 | — | 1,082 | ||||||||||||||||||||||
| Other data and network services | — | 557 | — | 557 | ||||||||||||||||||||||
| Origination technology | — | — | 1,012 | 1,012 | ||||||||||||||||||||||
| Closing solutions | — | — | 319 | 319 | ||||||||||||||||||||||
| Servicing software | — | — | — | — | ||||||||||||||||||||||
| Data and analytics | — | — | 76 | 76 | ||||||||||||||||||||||
| Revenues | 5,878 | 1,883 | 1,407 | 9,168 | ||||||||||||||||||||||
| Transaction-based expenses | 2,022 | — | — | 2,022 | ||||||||||||||||||||||
| Revenues, less transaction-based expenses | 3,856 | 1,883 | 1,407 | 7,146 | ||||||||||||||||||||||
| Operating expenses | 1,333 | 1,354 | 1,010 | 3,697 | ||||||||||||||||||||||
| Operating income | $ | 2,523 | $ | 529 | $ | 397 | $ | 3,449 | ||||||||||||||||||
Revenue from one clearing member of our Exchanges segment comprised $541 million or 12% of our Exchanges revenue, less transaction-based expenses during 2023. No customers or clearing members accounted for more than 10% of our revenues, less transaction-based expenses during 2022. Revenue from one member of our Exchanges segment comprised $443 million or 11% of our Exchanges revenue, less transaction-based expenses during 2021. Clearing members are primarily intermediaries and represent a broad range of principal trading firms. If a clearing member ceased its operations, we believe that the trading firms would continue to conduct transactions and would clear those transactions through another clearing member firm. No additional customers or clearing members accounted for more than 10% of our segment revenues or consolidated revenues in 2023 or 2021.
Geographical Information
The following represents our revenues, less transaction-based expenses, net assets and net property and equipment based on the geographic location (in millions):
| United States | Foreign Countries | Total | |||||||||||||||
| Revenues, less transaction-based expenses: | |||||||||||||||||
| Year ended December 31, 2023 | $ | 5,246 | $ | 2,742 | $ | 7,988 | |||||||||||
| Year ended December 31, 2022 | $ | 4,867 | $ | 2,425 | $ | 7,292 | |||||||||||
| Year ended December 31, 2021 | $ | 4,832 | $ | 2,314 | $ | 7,146 | |||||||||||
| Net assets: | |||||||||||||||||
| As of December 31, 2023 | $ | 18,327 | $ | 7,459 | $ | 25,786 | |||||||||||
| As of December 31, 2022 | $ | 15,226 | $ | 7,535 | $ | 22,761 | |||||||||||
| Property and equipment, net: | |||||||||||||||||
| As of December 31, 2023 | $ | 1,688 | $ | 235 | $ | 1,923 | |||||||||||
| As of December 31, 2022 | $ | 1,598 | $ | 169 | $ | 1,767 |
The foreign countries category above primarily relates to the U.K. and to a lesser extent, EU, India, Israel, Canada and Singapore.
20. Earnings Per Common Share
The following is a reconciliation of the numerators and denominators of the basic and diluted earnings per common share computations in 2023, 2022 and 2021 (in millions, except per share amounts):
| Year Ended December 31, | |||||||||||||||||
| 2023 | 2022 | 2021 | |||||||||||||||
| Basic: | |||||||||||||||||
| Net income attributable to Intercontinental Exchange, Inc. | $ | 2,368 | $ | 1,446 | $ | 4,058 | |||||||||||
| Weighted average common shares outstanding | 564 | 559 | 562 | ||||||||||||||
| Basic earnings per common share | $ | 4.20 | $ | 2.59 | $ | 7.22 | |||||||||||
| Diluted: | |||||||||||||||||
| Weighted average common shares outstanding | 564 | 559 | 562 | ||||||||||||||
| Effect of dilutive securities - stock options and restricted stock | 1 | 2 | 3 | ||||||||||||||
| Diluted weighted average common shares outstanding | 565 | 561 | 565 | ||||||||||||||
| Diluted earnings per common share | $ | 4.19 | $ | 2.58 | $ | 7.18 |
Basic earnings per common share is calculated using the weighted average common shares outstanding during the periods. Changes in the weighted average common shares outstanding between years was primarily due to stock repurchases and the Black Knight acquisition in 2023.
Common equivalent shares from stock options and restricted stock awards, calculated using the treasury stock method, are included in the diluted per share calculations unless the effect of their inclusion would be antidilutive. During 2023, 2022 and 2021 outstanding stock options of 791,000, 531,000 and 281,000, respectively, were not included in the computation of diluted earnings per common share because to do so would have had an antidilutive effect. As of December 31, 2023 and 2022, there were 4,000 and 50,000, respectively, restricted stock units that were vested but have not been issued that are included in the computation of diluted earnings per share. Certain figures in the table above may not recalculate due to rounding.
21. Subsequent Events
We have evaluated subsequent events and determined that no events or transactions met the definition of a subsequent event for purposes of recognition or disclosure in the accompanying financial statements.
ITEM 9. CHANGES IN AND DISAGREEMENTS WITH ACCOUNTANTS ON ACCOUNTING AND FINANCIAL DISCLOSURE
None.
ITEM 9 (A). CONTROLS AND PROCEDURES
(a) Evaluation of Disclosure Controls and Procedures. As of the end of the period covered by this report, an evaluation was carried out by our management, with the participation of our Chief Executive Officer and Chief Financial Officer, of the effectiveness of our disclosure controls and procedures (as defined in Rule 13a-15(e) under the Securities Exchange Act of 1934). Based upon that evaluation, our Chief Executive Officer and Chief Financial Officer concluded that these disclosure controls and procedures were effective as of the end of the period covered by this report.
(b) Management’s Annual Report on Internal Control over Financial Reporting and the Attestation Report of the Independent Registered Public Accounting Firm. Management is responsible for establishing and maintaining adequate control over financial reporting and has evaluated the effectiveness of the system of internal control using the Committee of Sponsoring Organizations of the Treadway Commission 2013 framework. Management’s report on its assessment of the effectiveness of our internal control over financial reporting as of December 31, 2023 and the attestation report of Ernst & Young LLP on our internal control over financial reporting are set forth in Part II, Item 8 of this Annual Report.
(c) Changes in Internal Controls over Financial Reporting. Except as described below, there were no changes in our internal controls over financial reporting that occurred during our most recent fiscal quarter that have materially affected, or are reasonably likely to materially affect, our internal controls over financial reporting. As a result, no corrective actions were taken. In September 2023, we acquired Black Knight and are in the process of integrating the acquired business into our overall internal control over financial reporting process. As permitted under applicable regulations, we have excluded Black Knight from our assessment of internal control over financial reporting as of December 31, 2023.
Previous: Item 7. MANAGEMENT’S DISCUSSION AND ANALYSIS OF FINANCIAL CONDITION AND RESULTS OF OPERATIONS · Next: Item 9. (B). OTHER INFORMATION