 filings.tools
Item 2. MANAGEMENT’S DISCUSSION AND ANALYSIS OF FINANCIAL CONDITION AND RESULTS OF OPERATIONS
164K characters. Original on sec.gov · Markdown
Item 2. MANAGEMENT’S DISCUSSION AND ANALYSIS OF FINANCIAL CONDITION AND RESULTS OF OPERATIONS
In this Quarterly Report on Form 10-Q, or Quarterly Report, unless otherwise indicated, the terms “Intercontinental Exchange,” “ICE,” “we,” “us,” “our,” “our company” and “our business” refer to Intercontinental Exchange, Inc., together with its consolidated subsidiaries. References to “ICE Products” mean products listed on one or more of our markets. All references to “options” or “options contracts” in the context of our futures products refer to options on futures contracts. Solely for convenience, references in this Quarterly Report to any trademarks, service marks and trade names owned by ICE are listed without the ®, ™ and © symbols, but we will assert, to the fullest extent under applicable law, our rights to these trademarks, service marks and trade names.
We also include references to third-party trademarks, trade names and service marks in this Quarterly Report. Except as otherwise expressly noted, our use or display of any such trademarks, trade names or service marks is not an endorsement or sponsorship and does not indicate any relationship between us and the parties that own such marks and names.
The following discussion should be read in conjunction with our consolidated financial statements and related notes included elsewhere in this Quarterly Report. Due to rounding, figures in tables may not sum exactly.
Forward-Looking Statements
This Quarterly Report, including the sections entitled “Notes to Consolidated Financial Statements,” “Legal Proceedings” and “Management’s Discussion and Analysis of Financial Condition and Results of Operations,” contains “forward-looking statements” as defined in the Private Securities Litigation Reform Act of 1995. Any statements contained herein that are not statements of historical fact may be forward-looking statements.
These forward-looking statements relate to future events or our future financial performance and are based on our present beliefs and assumptions as well as the information currently available to us. They involve known and unknown risks, uncertainties and other factors that may cause our results, levels of activity, performance, cash flows, financial position or achievements to differ materially from those expressed or implied by these statements.
Forward-looking statements may be introduced by or contain terminology such as “may,” “will,” “should,” “could,” “would,” “targets,” “goal,” “expect,” “intend,” “plan,” “anticipate,” “believe,” “estimate,” “predict,” “potential,” “continue,” or the antonyms of these terms or other comparable terminology. Although we believe that the expectations reflected in the forward-looking statements are reasonable, we cannot guarantee future results, levels of activity, performance, cash flows, financial position or achievements. Accordingly, we caution you not to place undue reliance on any forward-looking statements we may make.
Factors that may affect our performance and the accuracy of any forward-looking statements include, but are not limited to, those listed below:
-
conditions in global financial markets and domestic and international economic and social conditions, political uncertainty and discord;
-
the impact of the introduction of or any changes in laws, regulations, rules or government policies with respect to financial markets, climate change, increased regulatory scrutiny or enforcement actions and our ability to comply with these requirements;
-
volatility in commodity prices, equity prices and price volatility of financial benchmarks and instruments such as interest rates, credit spreads, equity indices, foreign exchange rates, and mortgage origination trends;
-
the business environment in which we operate and trends in our industry, including trading volumes, prevalence of clearing, demand for data services, mortgage lending activity, fees, changing regulations, competition and consolidation;
-
our ability to minimize the risks associated with operating clearing houses in multiple jurisdictions;
-
our exchanges’ and clearing houses' compliance with their respective regulatory and oversight responsibilities;
-
the resilience of our electronic platforms and soundness of our business continuity and disaster recovery plans;
-
our ability to execute our growth strategy, identify and effectively pursue, implement and integrate acquisitions and strategic alliances and realize the synergies and benefits of such transactions within the expected time frame;
-
the performance and reliability of our trading, clearing and mortgage technologies and those of third-party service providers;
-
our ability to keep pace with technological developments and client preferences;
-
our ability to ensure that the technology we utilize is not vulnerable to cyberattacks, hacking and other cybersecurity risks or other disruptive events or to minimize the impact of any such events;
-
our ability to keep information and data relating to the customers of the users of the software and services provided by our ICE Mortgage Technology business confidential;
-
the impacts of the COVID-19 pandemic on our business, results of operations and financial condition as well as the broader business environment;
-
our ability to identify trends and adjust our business to benefit from such trends, including trends in the U.S. mortgage industry such as interest rates, new home purchases, refinancing activity, and home builder and buyer sentiment, among others;
-
our ability to evolve our benchmarks and indices in a manner that maintains or enhances their reliability and relevance;
-
the accuracy of our cost and other financial estimates and our belief that cash flows from operations will be sufficient to service our debt and to fund our operational and capital expenditure needs;
-
our ability to incur additional debt and pay off our existing debt in a timely manner;
-
our ability to maintain existing market participants and data and mortgage technology customers, and to attract new ones;
-
our ability to offer additional products and services, leverage our risk management capabilities and enhance our technology in a timely and cost-effective fashion;
-
our ability to attract and retain key talent;
-
our ability to protect our intellectual property rights and to operate our business without violating the intellectual property rights of others;
-
potential adverse results of threatened or pending litigation and regulatory actions and proceedings;
-
our ability to realize the expected benefits of our acquisition of Ellie Mae and our investment in Bakkt, which could result in additional unanticipated costs and risks; and
-
our ability to detect illegal activity such as fraud, money laundering, tax evasion and ransomware scams through digital currency transactions that are easily exploited.
These risks and other factors include those set forth in Part 1, Item 1(A) under the caption “Risk Factors” in our 2020 Form 10-K, as filed with the SEC on February 4, 2021. Due to the uncertain nature of these factors, management cannot assess the impact of each factor on the business or the extent to which any factor, or combination of factors, may cause actual results to differ materially from those contained in any forward-looking statements.
Any forward-looking statement speaks only as of the date on which such statement is made, and we undertake no obligation to update any of these statements to reflect events or circumstances occurring after the date of this Quarterly Report. New factors may emerge and it is not possible to predict all factors that may affect our business and prospects.
Overview
We are a provider of market infrastructure, data services and technology solutions to a broad range of customers including financial institutions, corporations and government entities. These products, which span major asset classes including futures, equities, fixed income and U.S. residential mortgages, provide our customers with access to mission critical tools that are designed to increase asset class transparency and workflow efficiency. Prior to October 2020, we reported our results in two segments. We now report our results in three segments: Exchanges, Fixed Income and Data Services, and Mortgage Technology. The majority of our identifiable assets are located in the U.S. and U.K.
-
In our Exchanges segment, we operate regulated marketplaces for the listing, trading and clearing of a broad array of derivatives contracts and financial securities.
-
In our Fixed Income and Data Services segment, we provide fixed income pricing, reference data, indices and execution services, as well as global CDS clearing and multi-asset class data delivery solutions.
-
In our Mortgage Technology segment, we provide an end-to-end technology platform that offers customers comprehensive, digital workflow tools that aim to address the inefficiencies that exist in the U.S. residential mortgage market.
Recent Developments
Bakkt Transaction
On October 15, 2021, Bakkt, a trusted digital asset marketplace we launched in 2018 enabling institutions and consumers to buy, sell, store and spend digital assets, completed its merger with VIH, a special purpose acquisition company sponsored by VPC.
The business combination between Bakkt and VIH results in an enterprise value of approximately $2.1 billion, including approximately $479 million of cash on the combined company’s balance sheet, reflecting a contribution of approximately $123 million of cash held in VIH’s trust account, a $325 million PIPE of Class A common stock of the combined company, and $31 million of cash held in Bakkt accounts. The PIPE was priced at $10.00 per share and included a $47 million commitment from us. The newly combined company has been renamed Bakkt Holdings, Inc. and is listed on the NYSE.
As part of the transaction, Bakkt’s existing equity holders and management rolled 100% of their equity into the combined company and are subject to a six-month lockup period. Certain shareholders of VIH exercised their redemption rights, and at closing, Bakkt equity holders, including ICE, owned approximately 81% of the combined company, VIH’s public shareholders owned approximately 5%, VPC owned 2%, and PIPE investors (a group that also includes us) owned approximately 12% of the issued and outstanding common stock of the combined company.
Following the transaction, we continue to maintain an approximately 68% economic interest and a minority voting interest in the combined company. Following the closing, as a consequence of holding a minority voting interest in the combined company, during the fourth quarter of 2021 we expect to deconsolidate Bakkt and treat it as an equity method investment within our financial statements. We expect to record a pre-tax gain on the transaction of approximately $1.3 billion during the fourth quarter of 2021, which will be included in other non-operating income within our consolidated income statement.
Agreement to Sell Stake in Euroclear
We originally purchased our 9.8% stake in Euroclear for $631 million, and as of September 30, 2021, the adjusted fair value of our Euroclear investment was $701 million. On October 18, 2021, we announced that we had reached an agreement to sell our entire 9.8% stake in Euroclear for €709 million ($821 million based on the euro/U.S. dollar exchange rate of 1.1578 as of September 30, 2021). The sale is subject to customary closing conditions and regulatory approval.
Launch of ICE Futures Abu Dhabi
On March 29, 2021, we launched trading in ICE Murban crude oil futures, the world’s first Murban futures contract on our new exchange, ICE Futures Abu Dhabi Limited, or IFAD. IFAD was launched with the Abu Dhabi National Oil Company, or ADNOC, and nine of the world’s largest energy traders.
ICE Murban crude oil futures opened for trading along with 18 Murban-related cash settled derivatives and inter-commodity spreads. Murban futures investors from jurisdictions including Abu Dhabi Global Market, or ADGM, the U.S., Singapore, the U.K., Switzerland, the Netherlands, France, Norway, Australia, Japan and South Korea, are able to trade on IFAD. As of September 30, 2021 IFAD had 33 Exchange Members and 23 Clearing Members. Contracts traded on IFAD are cleared at ICE Clear Europe alongside ICE’s global energy futures platform, allowing customers to benefit from critical margin offsets to enhance capital efficiency. As of September 30, 2021, open interest was 41,055 contracts and a total of 832,925 contracts had traded with 78 firms having traded on IFAD since the launch.
Regulation
Our activities and the markets in which we operate are subject to regulations that impact us as well as our customers, and, in turn, meaningfully influence our activities, the manner in which we operate and our strategy. We are primarily subject to the jurisdiction of regulatory agencies in the U.S., U.K., EU, Canada, Singapore and Abu Dhabi. Failure to satisfy regulatory requirements can or may give rise to sanctions by the applicable regulator.
Global policy makers have undertaken reviews of their existing legal framework governing financial markets in connection with regulatory reform, and have either passed new laws and regulations, or are in the process of debating and/or enacting new laws and regulations that apply to our business and to our customers’ businesses. Legislative and regulatory actions may impact the way in which we or our customers conduct business and may create uncertainty, which could affect trading volumes or demand for market data. See Part 1, Item 1 “Business - Regulation” and Part 1, Item 1(A) "Risk Factors" included in our 2020 Form 10-K for a discussion of the primary regulations applicable to our business and certain risks associated with those regulations.
Domestic and foreign policy makers continue to review their legal frameworks governing financial markets, and periodically change the laws and regulations that apply to our business and to our customers’ businesses. Our key areas of focus on these evolving efforts are:
-
Brexit implications.** On January 1, 2021, the U.K. completed its withdrawal from the EU, commonly referred to as Brexit. As a result, as of January 1, 2021, EU law no longer applies in and to the U.K. In connection with the completion of the U.K.'s withdrawal, the U.K. and EU finalized a trade and cooperation agreement, which is now in force. The trade and cooperation agreement does not cover financial services. The EU and U.K. continue discussions to agree on a memorandum of understanding, or MoU, on financial services cooperation. This MoU, once signed and ratified by both parties, will establish a Joint U.K.-EU Financial Regulatory forum, which will serve as a platform to facilitate dialogue on financial services issues. Although the MoU does not lead to any market access or equivalence decisions, it is a necessary condition for any future equivalence determinations by the European Commission or the U.K. Accordingly, there continues to be uncertainty surrounding specific terms that may impact the financial services industry and our business operations.
-
Requirement that European and U.K. exchanges and CCPs offer non-discriminatory access.** The non-discriminatory access provisions of the U.K.'s Markets in Financial Instruments Directive II, or U.K. MiFID II, and the EU Markets in Financial Instruments Directive II, or EU MiFID II, required both our U.K. and European exchanges and central counterparties, or CCPs, to offer access to third parties on commercially reasonable terms. In addition, both the U.K. MiFID II and the EU MiFID II could require our U.K. and European exchanges and CCPs to allow participants to trade and/or clear at other venues, which may encourage competing venues to offer lookalikes of our products. In May 2021, the U.K. Treasury concluded that the non-discriminatory access requirements for exchange-traded derivatives are not suitable in a U.K.-only context and the U.K. government therefore intends to permanently remove the open access regime for U.K. exchange-traded derivatives when parliamentary time allows. With regard to EU MiFID II, in July 2021, the European Securities and Markets Authority, or ESMA, issued no-action guidance to the national competent authorities until the European Parliament and Council formalize a further delay in the application of these non-discriminatory access requirements for EU exchange-traded derivatives under EU MiFID II until July 2023.
-
Continued access by EU market participants to U.K. CCPs and exchanges.** The European Commission adopted an 18-month temporary equivalence decision for U.K. CCPs, which began to apply as of January 1, 2021. ICE Clear Europe has been recognized by ESMA as a third-country CCP in accordance with the European Markets Infrastructure Regulation, or EMIR. ESMA is conducting a comprehensive review of the systemic importance of ICE Clear Europe, currently designated as a Tier 2 U.K. CCP, under Article 25(2c) of EMIR before the expiry of the equivalence decision. Separately, ICE Futures Europe and ICE Endex will continue to be able to permit access by EU and U.K. persons to transact on their platforms. The absence of an equivalence decision by the EU for U.K. trading venues, however, may result in increased costs for certain EU market participants, which could impact trading on ICE Futures Europe. In June 2021, ICE completed the transition of ICE EU Emission Allowance futures and options from ICE Futures Europe to ICE Endex. Additional impacts to our business and the potential for regulatory changes remain uncertain at this time.
-
Benchmarks Regulation.** In April 2021, as part of the U.K.'s Financial Services Act 2021, the U.K. Parliament approved amendments to the U.K. Benchmarks Regulation, or U.K. BMR, to provide the Financial Conduct Authority, or FCA, with new and enhanced powers to manage and direct any wind-down period prior to a cessation of critical benchmarks, such as the London Interbank Offered Rate, or LIBOR, including powers to direct a methodology change for a critical benchmark and extend its publication on a basis that is no longer representative of its original underlying market or economic reality. The exercise of these powers could result in increased risks to ICE Benchmark Administration and users of LIBOR. In September 2021, the FCA announced that it would compel LIBOR's administrator, ICE Benchmark Administration, to publish 1-, 3-, and 6-month Sterling and Japanese Yen LIBOR settings under a "synthetic" change methodology until the end of 2022.
In February 2021, amendments to the EU Benchmarks Regulation, or EU BMR came into force to provide the European Commission the power to designate a replacement benchmark that covers all references to a widely used reference rate that is phased out, including LIBOR, when necessary to avoid disruption of the financial markets in the EU and to further extend the transition period for the use of benchmarks provided by third-country administrators until at least December 31, 2023.
In April 2021, New York State enacted a law designed to reduce uncertainty and economic impacts of the permanent cessation of LIBOR for specified contracts, securities, and other agreements that are economically linked to LIBOR that are governed by New York state law. The New York law generally tracks the legislation proposed by the Alternative Reference Rates Committee, or ARRC, and received broad industry support.
- U.S. Listing and Trading Prohibitions on Certain Foreign Companies.** On November 12, 2020, the former President of the United States issued an Executive Order that prohibits, subject to certain exceptions, transactions by
U.S. persons in the securities of certain Chinese companies identified as having ties to the People's Liberation Army, and in securities that are derivatives of, or any securities that are designated to provide investment exposure to, such Chinese companies. To comply with the Executive Order and guidance from the U.S. Department of the Treasury, the NYSE suspended trading in four of its listed companies and commenced delisting proceedings. All of these companies were subsequently delisted by the NYSE.
On December 18, 2020, the Holding Foreign Companies Accountable Act became U.S. law. For each company required to file periodic reports with the SEC, this Act requires the SEC to identify any company that retains a registered public accounting firm that is located in a foreign jurisdiction and that the Public Company Accounting Oversight Board, or PCAOB, is unable to inspect or investigate because of a position taken in such foreign jurisdiction. If the SEC determines that the PCAOB has been unable to inspect or investigate such accounting firm for three consecutive years, it is required to prohibit such company from trading its securities on a U.S. securities exchange or in any “over-the-counter” market. As a consequence, the NYSE exchanges may be required to suspend trading in certain of their listed companies. On March 24, 2021, the SEC adopted rules to implement certain disclosure requirements of the Holding Foreign Companies Accountable Act for foreign registrants.
On June 3, 2021, President Biden signed an Executive Order, or the June Order, that, beginning on August 2, 2021, prohibits U.S. persons from purchasing or selling the publicly traded securities of 59 companies determined to (i) operate in defense and related material sector, or the surveillance technology sector, of China, or (ii) to own or control, or be owned or controlled by, an individual or entity that operates in such sectors. President Biden’s June Order supersedes the operative provisions of President Trump’s November 2020 Executive Order. There is one NYSE-listed company that is covered by the prohibitions in President Biden’s June Order and, in the future, there may be other NYSE-listed companies covered by the prohibitions, though the impact is not expected to be material.
Consolidated Financial Highlights
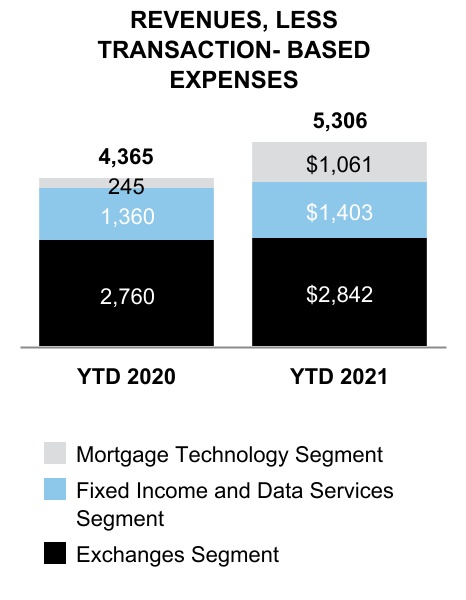
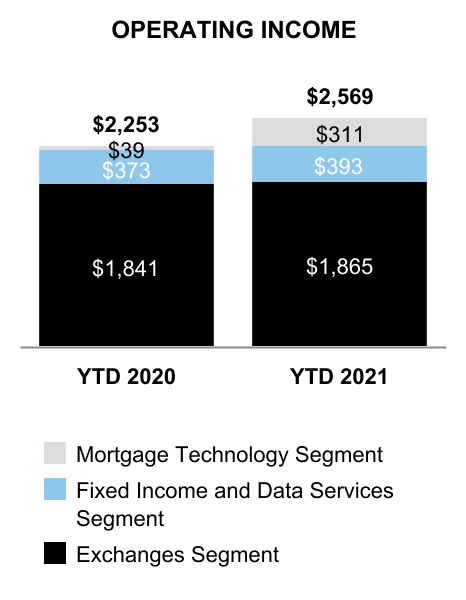
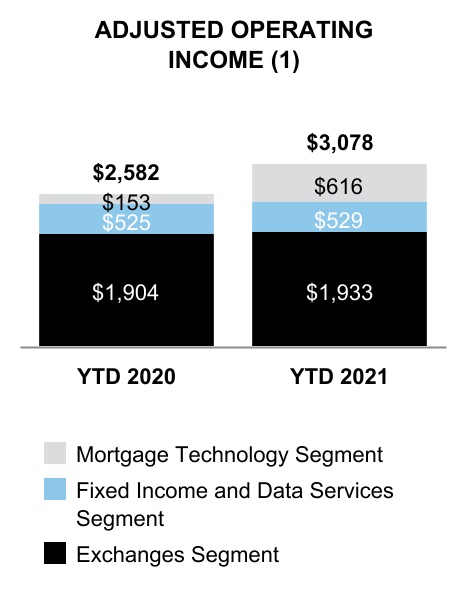
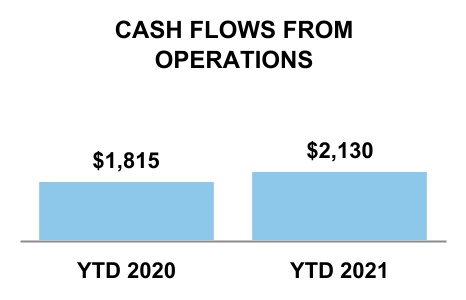
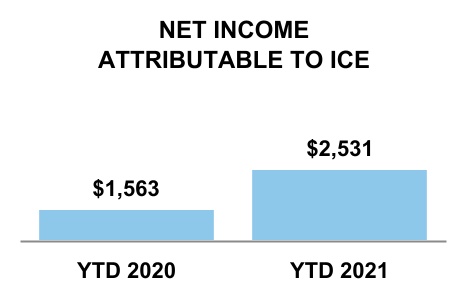
The following summarizes our results and significant changes in our consolidated financial performance for the periods presented (dollars in millions, except per share amounts and YTD represents the nine-month periods ended September 30th).

| Nine Months Ended September 30, | Three Months Ended September 30, | ||||||||||||||||||||||||||||||||||
| 2021 | 2020 | Change | 2021 | 2020 | Change | ||||||||||||||||||||||||||||||
| Revenues, less transaction-based expenses | $ | 5,306 | $ | 4,365 | 22 % | $ | 1,802 | $ | 1,411 | 28 % | |||||||||||||||||||||||||
| Operating expenses | $ | 2,737 | $ | 2,112 | 30 % | $ | 924 | $ | 784 | 18 % | |||||||||||||||||||||||||
| Adjusted operating expenses(1) | $ | 2,228 | $ | 1,783 | 25 % | $ | 755 | $ | 611 | 24 % | |||||||||||||||||||||||||
| Operating income | $ | 2,569 | $ | 2,253 | 14 % | $ | 878 | $ | 627 | 40 % | |||||||||||||||||||||||||
| Adjusted operating income(1) | $ | 3,078 | $ | 2,582 | 19% | $ | 1,047 | $ | 800 | 31% | |||||||||||||||||||||||||
| Operating margin | 48 | % | 52 | % | (4 pts) | 49 | % | 44 | % | 5 pts | |||||||||||||||||||||||||
| Adjusted operating margin(1) | 58 | % | 59 | % | (1 pt) | 58 | % | 57 | % | 1 pt | |||||||||||||||||||||||||
| Other income (expense), net | $ | 1,020 | $ | (161) | n/a | $ | (54) | $ | (44) | 22 % | |||||||||||||||||||||||||
| Income tax expense | $ | 1,049 | $ | 512 | 105 % | $ | 187 | $ | 189 | (1) % | |||||||||||||||||||||||||
| Effective tax rate | 29 | % | 24 | % | 5 pts | 23 | % | 32 | % | (9 pts) | |||||||||||||||||||||||||
| Net income attributable to ICE | $ | 2,531 | $ | 1,563 | 62 % | $ | 633 | $ | 390 | 62 % | |||||||||||||||||||||||||
| Adjusted net income attributable to ICE(1) | $ | 2,150 | $ | 1,800 | 19 % | $ | 735 | $ | 533 | 38 % | |||||||||||||||||||||||||
| Diluted earnings per share attributable to ICE common stockholders | $ | 4.48 | $ | 2.83 | 58 % | $ | 1.12 | $ | 0.71 | 58 % | |||||||||||||||||||||||||
| Adjusted diluted earnings per share attributable to ICE common stockholders(1) | $ | 3.80 | $ | 3.26 | 17 % | $ | 1.30 | $ | 0.97 | 34 % | |||||||||||||||||||||||||
| Cash flows from operating activities | $ | 2,130 | $ | 1,815 | 17 % |
(1) The adjusted figures exclude items that are not reflective of our ongoing core operations and business performance. Adjusted net income attributable to ICE and adjusted diluted earnings per share attributable to ICE common stockholders are presented net of taxes. These adjusted numbers are not calculated in accordance with U.S. GAAP. See “- Non-GAAP Financial Measures” below.
-
Revenues, less transaction-based expenses, increased $941 million and $391 million for the nine and three months ended September 30, 2021, respectively, from the comparable periods in 2020. See "-Exchanges Segment", "Fixed Income and Data Services Segment" and "Mortgage Technology Segment" below for a discussion of the significant changes in our revenues. The increase in revenues during the nine and three months ended September 30, 2021 includes $47 million and $9 million, respectively, in favorable foreign exchange effects arising from fluctuations in the U.S. dollar from the comparable period in 2020. See Item 3 "Quantitative and Qualitative Disclosures About Market Risk-Foreign Currency Exchange Rate Risk" below for additional information on the impact of currency fluctuations.
-
Operating expenses increased $625 million and $140 million for the nine and three months ended September 30, 2021, respectively, from the comparable periods in 2020. See "-Consolidated Operating Expenses" below for a discussion of the significant changes in our operating expenses. The increase in operating expenses during the nine and three months ended September 30, 2021 includes $21 million and $5 million, respectively, in unfavorable foreign exchange effects arising from fluctuations in the U.S. dollar from the comparable periods in 2020. See Item 3 "Quantitative and Qualitative Disclosures About Market Risk-Foreign Currency Exchange Rate Risk" below for additional information on the impact of currency fluctuations.
Variability in Quarterly Comparisons
Our business environment has been characterized by:
-
globalization of marketplaces, customers and competitors;
-
growing customer demand for workflow efficiency and automation;
-
commodity, interest rate and financial markets uncertainty;
-
growing demand for data to inform customers' risk management and investment decisions;
-
evolving, increasing and disparate regulation across multiple jurisdictions;
-
price volatility increasing customers' demand for risk management services;
-
increasing focus on capital and cost efficiencies;
-
customers' preference to manage risk in markets demonstrating the greatest depth of liquidity and product diversity;
-
the evolution of existing products and new product innovation to serve emerging customer needs and changing industry agreements;
-
rising demand for speed, data, data capacity and connectivity by market participants, necessitating increased investment in technology; and
-
consolidation and increasing competition among global markets for trading, clearing and listings.
For additional information regarding the factors that affect our results of operations, see Item 1(A) “Risk Factors” included in our 2020 Form 10-K, and Part II, Item 1(A) "Risk Factors" below.
Segment Results
We previously operated as two reportable business segments, but effective October 1, 2020, we realigned our businesses as part of a review of, and changes in, our organizational structure following our acquisition of Ellie Mae. As a result, we changed our internal financial reporting and determined that a change in reportable segments had occurred. Prior periods have been adjusted to reflect this change. Our segments do not engage in intersegment transactions.
Our business is now conducted through three reportable business segments, comprised of the following:
-
Our Exchanges segment includes our trade execution and clearing within our global futures network and NYSE businesses, various data and connectivity services that are directly related to those exchange platforms, administration fees and our NYSE listings business. Trade execution and clearing products include energy, agricultural and metals, financial futures and options, cash equities, equity options, OTC and other;
-
Our Fixed Income and Data Services segment includes pricing and reference data, analytics, indices, trade execution and clearing within our ICE Bonds and CDS businesses, consolidated feeds and our ICE Global Network businesses; and
-
Our Mortgage Technology segment includes our ICE Mortgage Technology businesses. This segment includes origination technology, closing solutions, data and analytics and other. In addition, beginning in the first quarter of 2021, origination technology revenues include those related to our ICE Mortgage Technology network (previously reported in closing solutions revenues) and closing solutions revenues now include registration revenues related to MERSCORP Holdings, Inc., or MERS, (previously reported in other revenues). We believe these changes more accurately reflect how we operate the business. The prior year periods have been adjusted to reflect these changes.
While revenues are recorded specifically in the segment in which they are earned or to which they relate, a significant portion of our operating expenses are not solely related to a specific segment because the expenses serve functions that are necessary for the operation of more than one segment. We directly allocate expenses when reasonably possible to do so. Otherwise, we use a pro-rata revenue approach as the allocation method for the expenses that do not relate solely to one segment and serve functions that are necessary for the operation of all segments. Our October 1, 2020 change in business segment presentation triggered a reallocation of our segment operating expenses. Prior periods have been adjusted to reflect this change.
Exchanges Segment
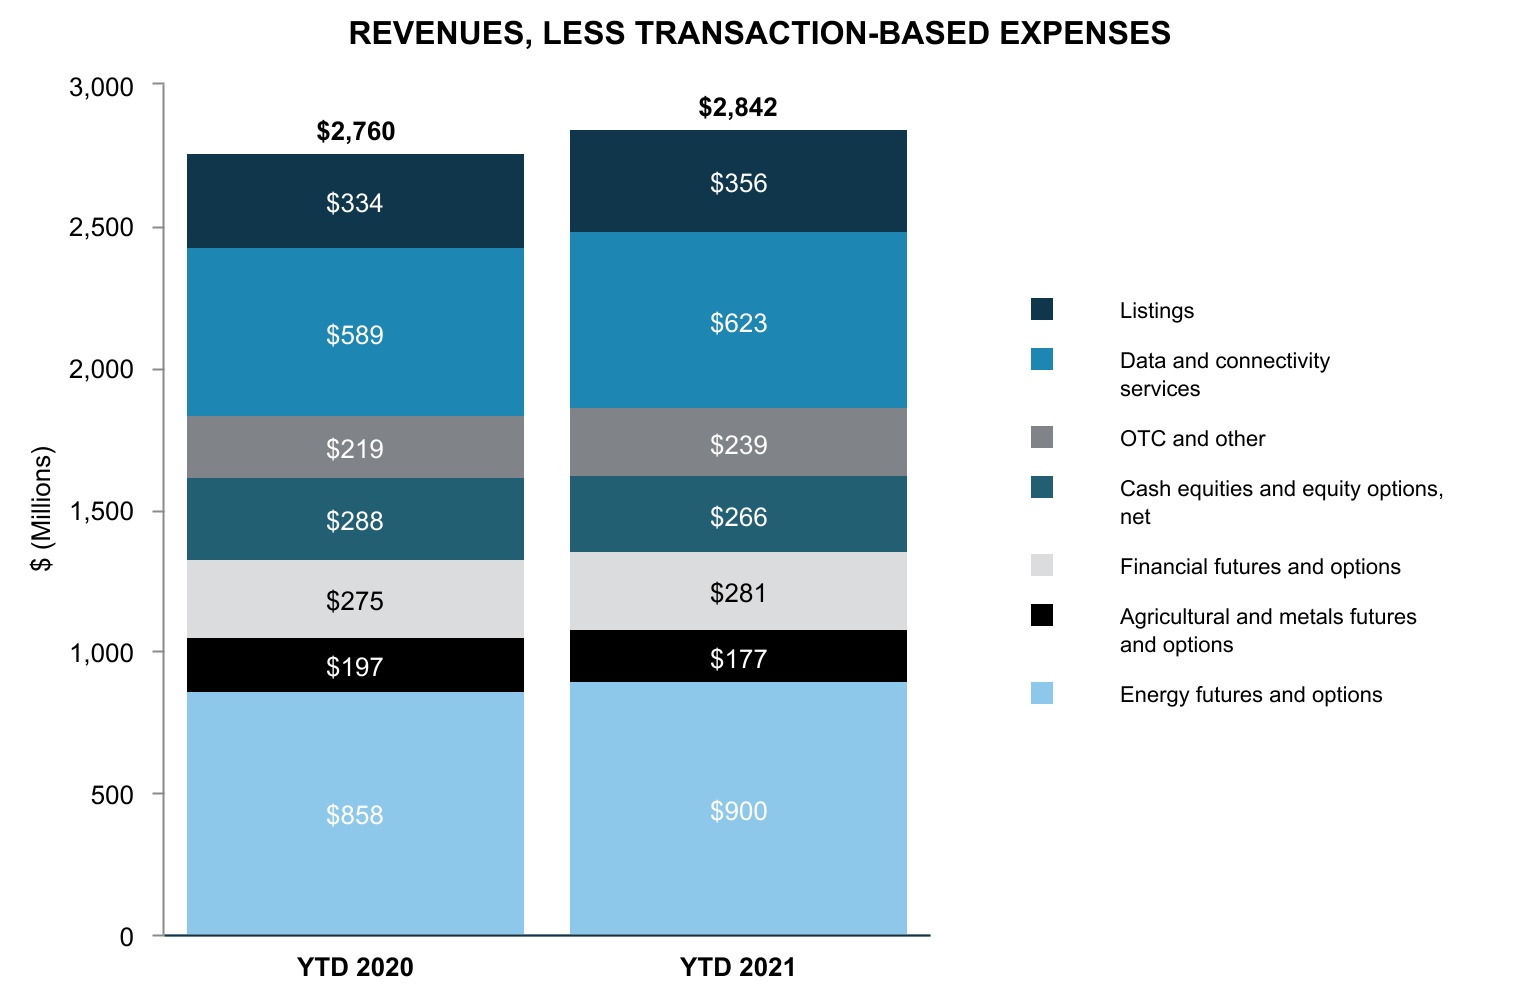
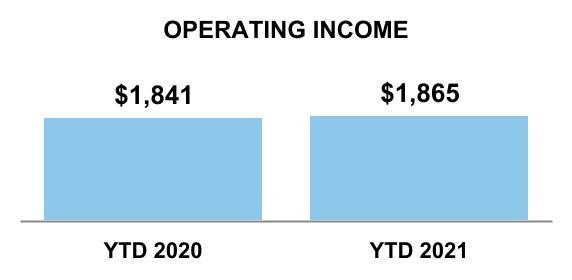
The following presents selected statements of income data for our Exchanges segment (dollars in millions and YTD represents the nine-month periods ended September 30th):
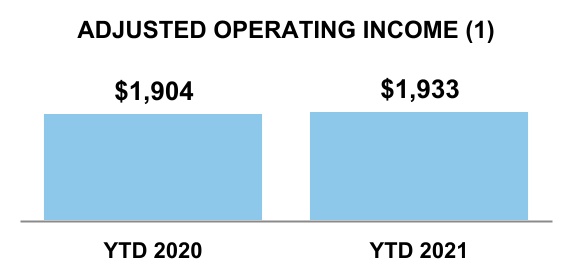
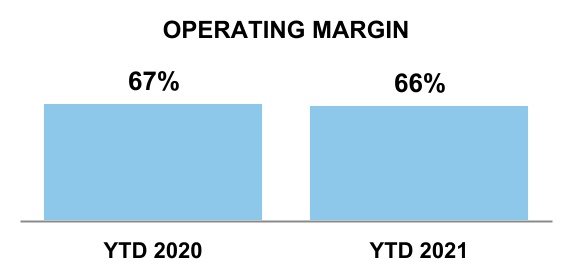
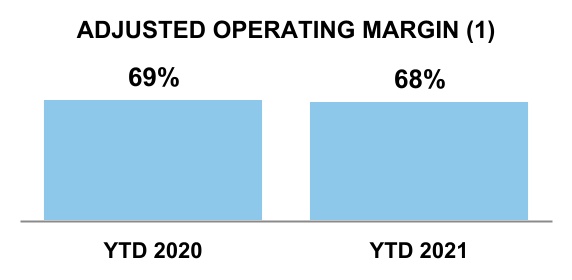
(1) The adjusted numbers in the charts above are calculated by excluding items that are not reflective of our cash operations and core business performance. As a result, these adjusted numbers are not calculated in accordance with U.S. GAAP. See “- Non-GAAP Financial Measures” below.
| Nine Months Ended September 30, | Three Months Ended September 30, | |||||||||||||||||||||||||||||||||||||||||||
| 2021 | 2020 | Change | 2021 | 2020 | Change | |||||||||||||||||||||||||||||||||||||||
| Revenues: | ||||||||||||||||||||||||||||||||||||||||||||
| Energy futures and options | $ | 900 | $ | 858 | 5 | % | $ | 316 | $ | 229 | 38 | % | ||||||||||||||||||||||||||||||||
| Agricultural and metals futures and options | 177 | 197 | (10) | 56 | 54 | 5 | ||||||||||||||||||||||||||||||||||||||
| Financial futures and options | 281 | 275 | 2 | 93 | 76 | 24 | ||||||||||||||||||||||||||||||||||||||
| Futures and options | 1,358 | 1,330 | 2 | 465 | 359 | 30 | ||||||||||||||||||||||||||||||||||||||
| Cash equities and equity options | 1,800 | 1,934 | (7) | 554 | 593 | (7) | ||||||||||||||||||||||||||||||||||||||
| OTC and other | 239 | 219 | 9 | 84 | 73 | 14 | ||||||||||||||||||||||||||||||||||||||
| Transaction and clearing, net | 3,397 | 3,483 | (2) | 1,103 | 1,025 | 8 | ||||||||||||||||||||||||||||||||||||||
| Data and connectivity services | 623 | 589 | 6 | 208 | 201 | 3 | ||||||||||||||||||||||||||||||||||||||
| Listings | 356 | 334 | 7 | 123 | 111 | 10 | ||||||||||||||||||||||||||||||||||||||
| Revenues | 4,376 | 4,406 | (1) | 1,434 | 1,337 | 7 | ||||||||||||||||||||||||||||||||||||||
| Transaction-based expenses(1) | 1,534 | 1,646 | (7) | 475 | 519 | (8) | ||||||||||||||||||||||||||||||||||||||
| Revenues, less transaction-based expenses | 2,842 | 2,760 | 3 | 959 | 818 | 17 | ||||||||||||||||||||||||||||||||||||||
| Other operating expenses | 778 | 717 | 8 | 265 | 236 | 12 | ||||||||||||||||||||||||||||||||||||||
| Depreciation and amortization | 186 | 189 | (2) | 62 | 62 | — | ||||||||||||||||||||||||||||||||||||||
| Acquisition-related transaction and integration costs | 13 | 13 | 6 | 3 | (1) | n/a | ||||||||||||||||||||||||||||||||||||||
| Operating expenses | 977 | 919 | 6 | 330 | 297 | 11 | ||||||||||||||||||||||||||||||||||||||
| Operating income | $ | 1,865 | $ | 1,841 | 1 | % | $ | 629 | $ | 521 | 21 | % |
(1)Transaction-based expenses are largely attributable to our cash equities and options business.
Exchanges Revenues
Our Exchanges segment includes transaction and clearing revenues from our futures and NYSE exchanges, related data and connectivity services, and our listings business. Transaction and clearing revenues consist of fees collected from derivatives, cash equities and equity options trading and derivatives clearing, and are reported on a net basis, except for the NYSE transaction-based expenses discussed below. Rates per-contract, or RPC, are driven by the number of contracts or securities traded and the fees charged per contract, net of certain rebates. Our per-contract transaction and clearing revenues will depend upon many factors, including, but not limited to, market conditions, transaction and clearing volume, product mix, pricing, applicable revenue sharing and market making agreements, and new product introductions. Because transaction and clearing revenues are generally assessed on a per-contract basis, revenues and profitability fluctuate with changes in contract volume and product mix. Our data and connectivity services revenues are recurring subscription fees related to the various data and connectivity services that we provide which are directly attributable to our exchange venues. Our listings revenues are also recurring subscription fees that we earn for the provision of NYSE listings services for public companies and ETFs, and related corporate actions for listed companies.
For the nine months ended September 30, 2021 and 2020, 16% and 14%, respectively, of our Exchanges segment revenues, less transaction-based expenses, were billed in pounds sterling or euros. For the three months ended September 30, 2021 and 2020, 18% and 14%, respectively, of our Exchanges segment revenues, less transaction-based expenses, were billed in pounds sterling or euros. Due to the fluctuations of the pound sterling and euro compared to the U.S. dollar, our Exchanges segment revenues, less transaction-based expenses, were higher by $32 million and $6 million for the nine and three months ended September 30, 2021, respectively, from the comparable periods in 2020.
Our exchange transaction and clearing revenues are presented net of rebates. We recorded rebates of $790 million and $742 million for the nine months ended September 30, 2021 and 2020, respectively, and $264 million and $217 million for the three months ended September 30, 2021 and 2020, respectively. We offer rebates in certain of our markets primarily to support market liquidity and trading volume by providing qualified participants in those markets a discount to the applicable commission rate. Such rebates are calculated based on volumes traded. The increase in rebates for the nine and three months ended September 30, 2021 is primarily due to the launch of new products, including ICE Murban crude oil futures and Sterling Overnight Index Average, or SONIA.
- Energy Futures and Options: Total energy volume decreased 3% and revenues increased 5% for the nine months ended September 30, 2021 from the comparable period in 2020 and volume increased 23% and revenues increased 38% for the three months ended September 30, 2021 from the comparable period in 2020.
–Total oil volume decreased 3% and increased 26% for the nine and three months ended September 30, 2021, respectively, from the comparable periods in 2020, as the first half of 2020 benefited from a sharp increase in price volatility related to various geopolitical events as well as the emergence of COVID-19. The third quarter of 2021 benefited from price volatility related to oil supply and demand dynamics and macroeconomic uncertainty.
**–**Our global natural gas futures and options volume decreased 7% and increased 17% for the nine and three months ended September 30, 2021, respectively, from the comparable periods in 2020. Similar to oil volumes, the first half of 2020 benefited from elevated volatility related to COVID-19. The third quarter of 2021 benefited from continued growth in our TTF and Asian JKM gas complexes driven by price volatility related to natural gas supply and demand dynamics in the U.K. and Europe.
**–**Our environmentals and other futures and options volume increased 13% and 29% for the nine and three months ended September 30, 2021, respectively, from the comparable periods in 2020, driven by an increase in the price of carbon and continued demand for market-based mechanisms to price climate risk and help enable greenhouse gas reduction goals.
- Agricultural and Metals Futures and Options: Total volume in our agricultural and metals futures and options markets decreased 12% for the nine months ended September 30, 2021 and increased 1% for the three months ended September 30, 2021 from the comparable periods in 2020 and revenues decreased 10% for the nine months ended September 30, 2021 and increased 5% for the three months ended September 30, 2021 from the comparable periods in 2020. The first half of 2020 benefited from elevated volatility related to COVID-19 and a sharp decline in oil prices. Revenues increased in the third quarter of 2021 due to elevated price volatility as a result of weather-related supply and demand dynamics impacting our Coffee and Cotton markets, as well as geopolitical events impacting our Cocoa markets.
**–**Sugar futures and options volumes decreased 23% and 6% for the nine and three months ended September 30, 2021, respectively, from the comparable periods in 2020.
**–**Other agricultural and metal futures and options volume decreased 2% for the nine months ended September 30, 2021 from the comparable period in 2020 and increased 6% for the three months ended September 30, 2021 from the comparable period in 2020.
- Financial Futures and Options: Total volume decreased 2% for the nine months ended September 30, 2021 from the comparable period in 2020 and increased 15% for the three months ended September 30, 2021 from the comparable period in 2020, and revenues increased 2% and 24% for the nine and three months ended September 30, 2021, respectively, from the comparable periods in 2020 in our financial futures and options markets.
**–**Interest rate futures and options volume increased 1% and 18% for the nine and three months ended September 30, 2021, respectively, from the comparable periods in 2020, and revenue increased 8% and 38% for the nine and three months ended September 30, 2021, respectively, from the comparable periods in 2020. The increases in volume and revenue were driven by interest rate volatility from increased speculation of central bank activity due to post-pandemic global economic reopening and inflation concerns. Interest rate futures and options revenues were $163 million and $151 million for the nine months ended September 30, 2021 and 2020, respectively, and $55 million and $40 million for the three months ended September 30, 2021 and 2020, respectively.
**–**Other financial futures and options volume, which includes our MSCI®, FTSE® and NYSE FANG+ equity index products, decreased 13% for the nine months ended September 30, 2021, and increased 2% for the three months ended September 30, 2021, from the comparable periods in 2020. Financial futures and options revenue decreased 5% for the nine months ended September 30, 2021, and increased 7% for the three months ended September 30, 2021, from the comparable periods in 2020. The first half of 2020 benefited from elevated volatility across global equity markets driven by the emergence of COVID-19. The third quarter of 2021 benefited from higher equity market volatility and record volume in our NYSE FANG+ complex. Other financial futures and options revenues were $118 million and $124 million for the nine
months ended September 30, 2021 and 2020, respectively, and $38 million and $36 million for the three months ended September 30, 2021 and 2020, respectively.
-
Cash Equities and Equity Options: Cash equities volume decreased 7% and 6% for the nine and three months ended September 30, 2021, respectively, from the comparable periods in 2020. The first half of 2020 benefited from elevated volatility across global equity markets driven by the emergence of COVID-19. Cash equities revenues, net of transaction-based expenses, were $184 million and $216 million for the nine months ended September 30, 2021 and 2020, respectively, and $54 million and $53 million for the three months ended September 30, 2021 and 2020, respectively. Equity options volume increased 43% and 33% for the nine and three months ended September 30, 2021, respectively, from the comparable periods in 2020 driven by increased participation and higher market share. Equity options revenues, net of transaction-based expenses, were $81 million and $72 million for the nine months ended September 30, 2021 and 2020, respectively, and $24 million and $21 million for the three months ended September 30, 2021 and 2020, respectively.
-
OTC and Other:** OTC and other transactions include revenues from our OTC energy business and other trade confirmation services, as well as interest income on certain clearing margin deposits, regulatory penalties and fines, fees for use of our facilities, regulatory fees charged to member organizations of our U.S. securities exchanges, designated market maker service fees, exchange membership fees and agricultural grading and certification fees. Our OTC and other revenues increased 9% for the nine months ended September 30, 2021 from the comparable period in 2020 primarily due to the February 2020 acquisition of Bridge2 Solutions. Our OTC and other revenues increased 14% for the three months ended September 30, 2021 from the comparable period in 2020. Following the October 2021 Bakkt transaction, Bakkt revenues will no longer be included within our OTC and other revenues.
-
Data and Connectivity Services: Our data and connectivity services revenues increased 6% and 3% for the nine and three months ended September 30, 2021, respectively, from the comparable periods in 2020. The increase in revenue was driven by the strong retention rate of existing customers and increased purchases by existing customers.
-
Listings Revenues: Through NYSE, NYSE American and NYSE Arca, we generate listings revenue related to the provision of listings services for public companies and ETFs, and related corporate actions for listed companies. Listings revenues increased 7% and 10% for the nine and three months ended September 30, 2021, respectively, from the comparable periods in 2020, driven by equity capital markets activity, including an increase in demand for special purpose acquisition company, or SPAC, listings.
Listings revenues in our securities markets arise from fees applicable to companies listed on our cash equities exchanges– original listing fees and annual listing fees. Original listing fees consist of two components: initial listing fees and fees related to corporate actions. Initial listing fees, subject to a minimum and maximum amount, are based on the number of shares that a company initially lists. All listings fees are billed upfront and the identified performance obligations are satisfied over time. Revenue related to the investor relations performance obligation is recognized ratably over the period these services are provided, with the remaining revenue recognized ratably over time as customers continue to list on our exchanges.
In addition, we earn corporate actions-related listing fees in connection with actions involving the issuance of new shares, such as stock splits, rights issues and sales of additional securities, as well as mergers and acquisitions. Listings fees related to other corporate actions are considered contract modifications of our listing contracts and are recognized ratably over time as customers continue to list on our exchanges.
Selected Operating Data
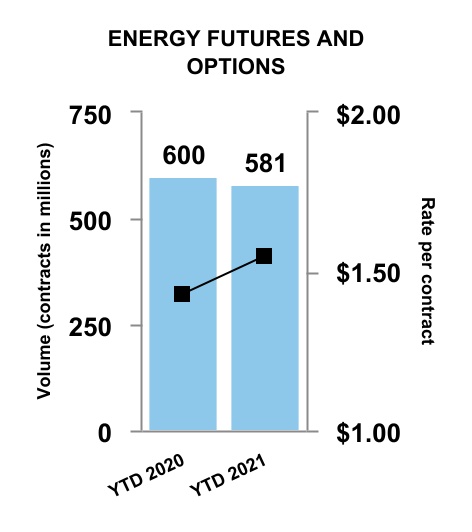
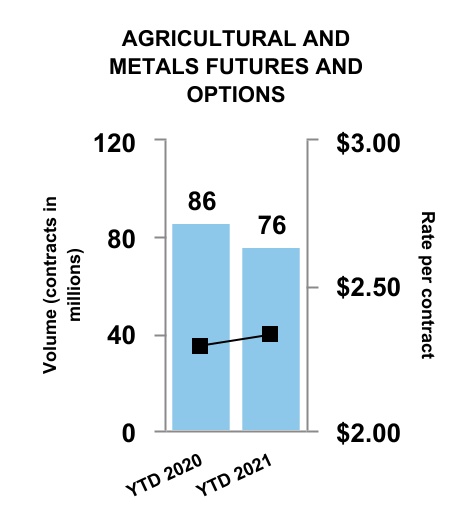
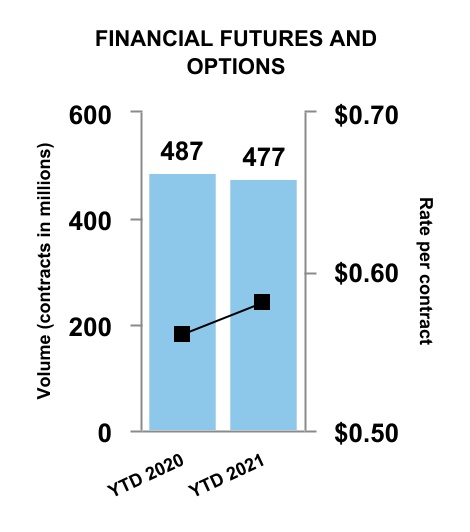
The following charts and tables present trading activity in our futures and options markets by commodity type based on the total number of contracts traded, as well as futures and options rate per contract (in millions, except for percentages and rate per contract amounts and YTD represents the nine-month periods ended September 30th):
| Volume and Rate per Contract |
| Nine Months Ended September 30, | Three Months Ended September 30, | ||||||||||||||||||||||||||||||||||
| 2021 | 2020 | Change | 2021 | 2020 | Change | ||||||||||||||||||||||||||||||
| Number of contracts traded (in millions): | |||||||||||||||||||||||||||||||||||
| Energy futures and options | 581 | 600 | (3) | % | 200 | 163 | 23 | % | |||||||||||||||||||||||||||
| Agricultural and metals futures and options | 76 | 86 | (12) | 24 | 24 | 1 | |||||||||||||||||||||||||||||
| Financial futures and options | 477 | 487 | (2) | 152 | 133 | 15 | |||||||||||||||||||||||||||||
| Total | 1,134 | 1,173 | (3) | % | 376 | 320 | 18 | % | |||||||||||||||||||||||||||
| Nine Months Ended September 30, | Three Months Ended September 30, | ||||||||||||||||||||||||||||||||||
| 2021 | 2020 | Change | 2021 | 2020 | Change | ||||||||||||||||||||||||||||||
| Average Daily Volume of contracts traded (in thousands): | |||||||||||||||||||||||||||||||||||
| Energy futures and options | 3,089 | 3,176 | (3) | % | 3,126 | 2,545 | 23 | % | |||||||||||||||||||||||||||
| Agricultural and metals futures and options | 404 | 456 | (11) | 379 | 376 | 1 | |||||||||||||||||||||||||||||
| Financial futures and options | 2,495 | 2,531 | (1) | 2,320 | 2,024 | 15 | |||||||||||||||||||||||||||||
| Total | 5,988 | 6,163 | (3) | % | 5,825 | 4,945 | 18 | % | |||||||||||||||||||||||||||
| Nine Months Ended September 30, | Three Months Ended September 30, | ||||||||||||||||||||||||||||||||||
| 2021 | 2020 | Change | 2021 | 2020 | Change | ||||||||||||||||||||||||||||||
| Rate per contract: | |||||||||||||||||||||||||||||||||||
| Energy futures and options | $ | 1.55 | $ | 1.43 | 9 | % | $ | 1.58 | $ | 1.40 | 12 | % | |||||||||||||||||||||||
| Agricultural and metals futures and options | $ | 2.33 | $ | 2.29 | 2 | % | $ | 2.33 | $ | 2.23 | 4 | % | |||||||||||||||||||||||
| Financial futures and options | $ | 0.58 | $ | 0.56 | 4 | % | $ | 0.61 | $ | 0.56 | 8 | % | |||||||||||||||||||||||
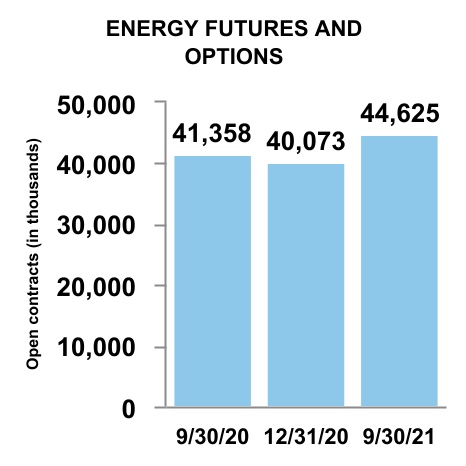
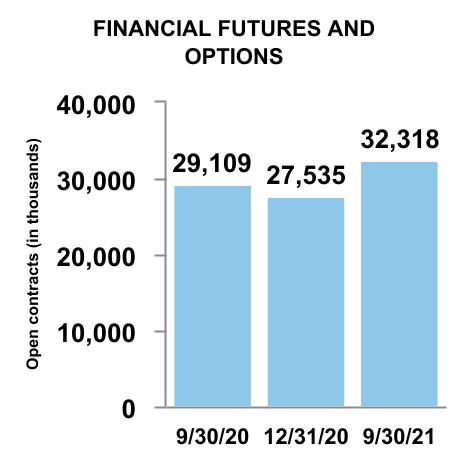
Open interest is the aggregate number of contracts (long or short) that clearing members hold either for their own account or on behalf of their clients. Open interest refers to the total number of contracts that are currently “open,” – in other words, contracts that have been entered into but not yet liquidated by either an offsetting trade, exercise, expiration or assignment. Open interest is also a measure of the future activity remaining to be closed out in terms of the number of contracts that members and their clients continue to hold in the particular contract and by the number of contracts held for each contract month listed by the exchange. The following charts and table present our quarter-end open interest for our futures and options contracts (in thousands, except for percentages):
| Open Interest |

| As of September 30, | |||||||||||||||||
| 2021 | 2020 | Change | |||||||||||||||
| Open interest — in thousands of contracts: | |||||||||||||||||
| Energy futures and options | 44,625 | 41,358 | 8 | % | |||||||||||||
| Agricultural and metals futures and options | 4,056 | 3,607 | 12 | ||||||||||||||
| Financial futures and options | 32,318 | 29,109 | 11 | ||||||||||||||
| Total | 80,999 | 74,074 | 9 | % |
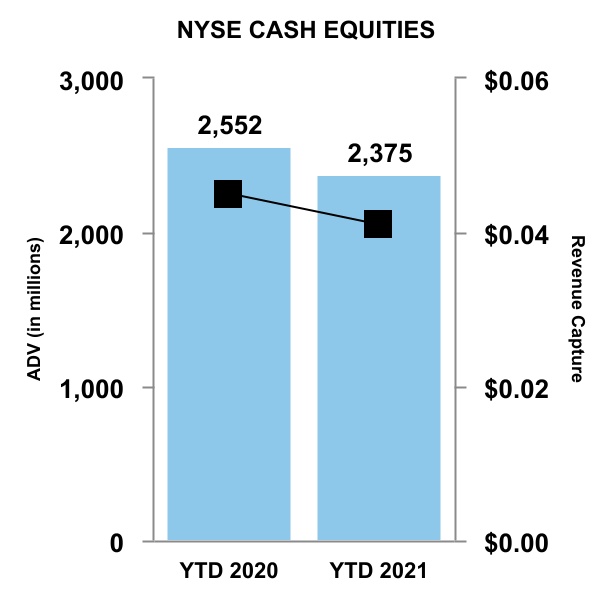
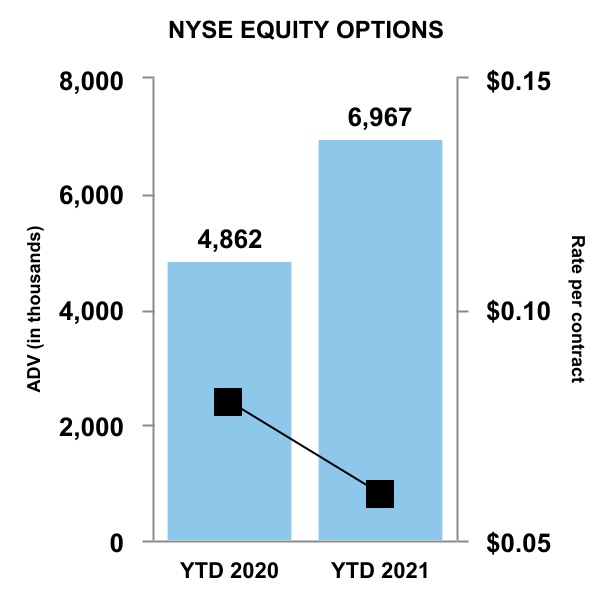
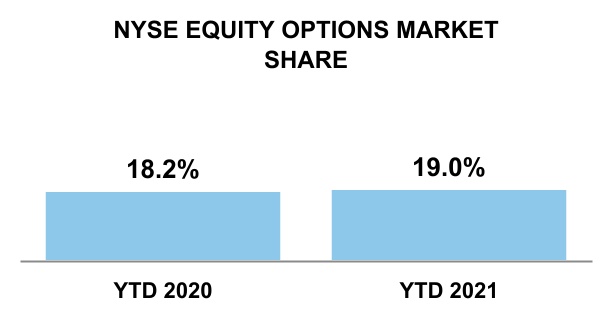
The following charts and table present selected cash and equity options trading data (all trading volume below is presented as average net daily trading volume, or ADV, and is single counted and YTD represents the nine-month periods ended September 30th):

| Nine Months Ended September 30, | Three Months Ended September 30, | ||||||||||||||||||||||||||||||||||
| 2021 | 2020 | Change | 2021 | 2020 | Change | ||||||||||||||||||||||||||||||
| NYSE cash equities (shares in millions): | |||||||||||||||||||||||||||||||||||
| Total cash handled volume | 2,375 | 2,552 | (7) | % | 2,022 | 2,151 | (6) | % | |||||||||||||||||||||||||||
| Total cash market share matched | 20.0 | % | 22.6 | % | (2.6 pts) | 20.3 | % | 21.2 | % | (0.9 pts) | |||||||||||||||||||||||||
| NYSE equity options (contracts in thousands): | |||||||||||||||||||||||||||||||||||
| NYSE equity options volume | 6,967 | 4,862 | 43 | % | 7,078 | 5,328 | 33 | % | |||||||||||||||||||||||||||
| Total equity options volume | 36,684 | 26,701 | 37 | % | 35,546 | 28,085 | 27 | % | |||||||||||||||||||||||||||
| NYSE share of total equity options | 19.0 | % | 18.2 | % | 0.8 pts | 19.9 | % | 19.0 | % | 0.9 pts | |||||||||||||||||||||||||
| Revenue capture or rate per contract: | |||||||||||||||||||||||||||||||||||
| Cash equities rate per contract (per 100 shares) | $0.041 | $0.045 | (8) | % | $0.042 | $0.038 | 9 | % | |||||||||||||||||||||||||||
| Equity options rate per contract | $0.06 | $0.08 | (22) | % | $0.05 | $0.06 | (15) | % |
Handled volume represents the total number of shares of equity securities, ETFs and crossing session activity internally matched on our exchanges or routed to and executed on an external market center. Matched volume represents the total number of shares of equity securities, ETFs and crossing session activity executed on our exchanges.
Transaction-Based Expenses
Our equities and equity options markets pay fees to the SEC pursuant to Section 31 of the Exchange Act. Section 31 fees are recorded on a gross basis as a component of transaction and clearing fee revenue. These Section 31 fees are assessed to recover the government’s costs of supervising and regulating the securities markets and professionals and are subject to change. We, in turn, collect corresponding activity assessment fees from member organizations clearing or settling trades on the equities and options exchanges, and recognize these amounts in our transaction and clearing revenues when invoiced. The activity assessment fees are designed to equal the Section 31 fees. As a result, activity assessment fees and the corresponding Section 31 fees do not have an impact on our net income, although the timing of payment by us will vary from collections. Section 31 fees were $204 million and $465 million for the nine months
ended September 30, 2021 and 2020, respectively, and $38 million and $145 million for the three months ended September 30, 2021 and 2020, respectively. The decrease in Section 31 fees was primarily due to a decline in rates, which were revised in February of each year. The fees we collect are included in cash at the time of receipt and we remit the amounts to the SEC semi-annually as required. The total amount is included in accrued liabilities and was $14 million as of September 30, 2021.
We make liquidity payments to cash and options trading customers, as well as routing charges made to other exchanges which are included in transaction-based expenses. We incur routing charges when we do not have the best bid or offer in the market for a security that a customer is trying to buy or sell on one of our securities exchanges. In that case, we route the customer’s order to the external market center that displays the best bid or offer. The external market center charges us a fee per share (denominated in tenths of a cent per share) for routing to its system. We record routing charges on a gross basis as a component of transaction and clearing fee revenue. Cash liquidity payments, routing and clearing fees were $1.3 billion and $1.2 billion for the nine months ended September 30, 2021 and 2020, respectively, and $437 million and $374 million for the three months ended September 30, 2021 and 2020, respectively.
Operating Expenses, Operating Income and Operating Margin
The following chart summarizes our Exchanges segment's operating expenses, operating income and operating margin (dollars in millions). See “- Consolidated Operating Expenses” below for a discussion of the significant changes in our operating expenses.
| Exchanges Segment: | Nine Months Ended September 30, | Three Months Ended September 30, | ||||||||||||||||||||||||||||||||||||
| 2021 | 2020 | Change | 2021 | 2020 | Change | |||||||||||||||||||||||||||||||||
| Operating expenses | $ | 977 | $ | 919 | 6 | % | $ | 330 | $ | 297 | 11 | % | ||||||||||||||||||||||||||
| Adjusted operating expenses(1) | $ | 909 | $ | 856 | 6 | % | $ | 309 | $ | 279 | 11 | % | ||||||||||||||||||||||||||
| Operating income | $ | 1,865 | $ | 1,841 | 1 | % | $ | 629 | $ | 521 | 21 | % | ||||||||||||||||||||||||||
| Adjusted operating income(1) | $ | 1,933 | $ | 1,904 | 1 | % | $ | 650 | $ | 539 | 20 | % | ||||||||||||||||||||||||||
| Operating margin | 66 | % | 67 | % | (1 pt) | 66 | % | 64 | % | 2 pts | ||||||||||||||||||||||||||||
| Adjusted operating margin(1) | 68 | % | 69 | % | (1 pt) | 68 | % | 66 | % | 2 pts |
(1) The adjusted figures exclude items that are not reflective of our ongoing core operations and business performance. These adjusted numbers are not calculated in accordance with U.S. GAAP. See “- Non-GAAP Financial Measures” below.
Fixed Income and Data Services Segment
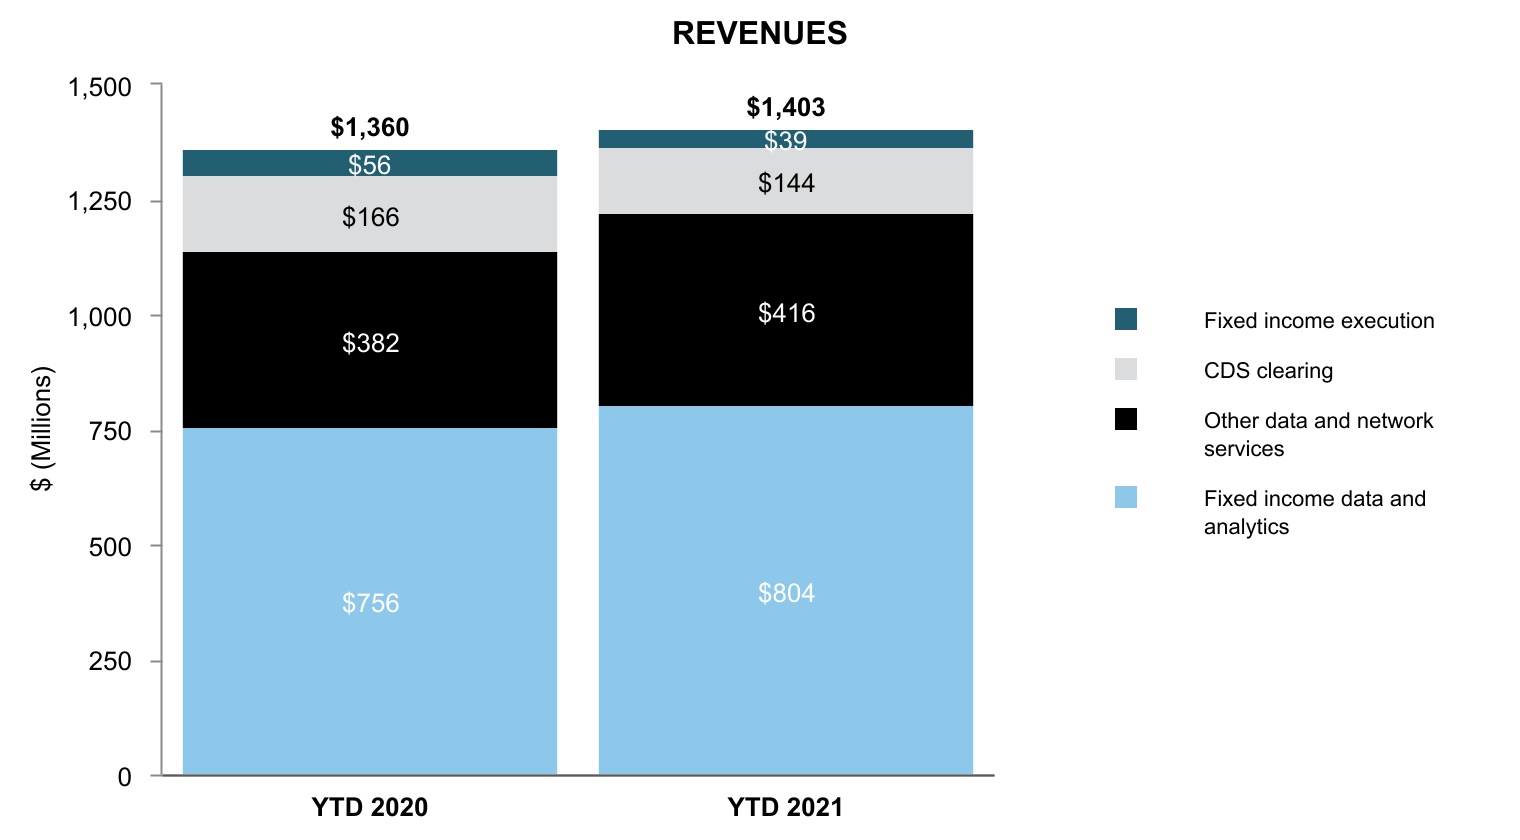
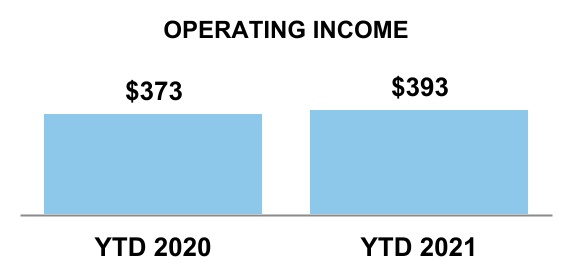
The following charts and table present our selected statements of income data for our Fixed Income and Data Services segment (dollars in millions and YTD represents the nine-month periods ended September 30th):
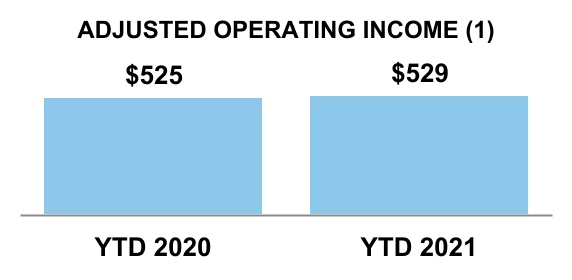
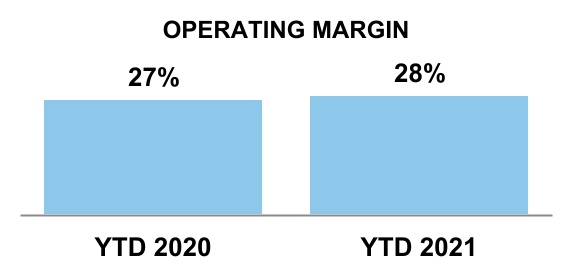
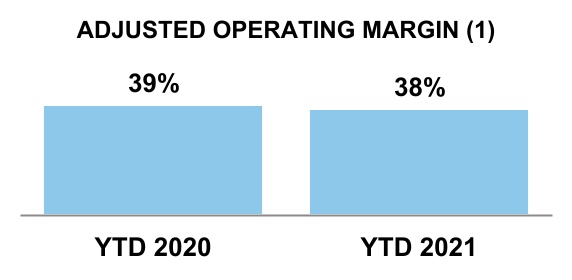
(1) The adjusted figures in the charts above are calculated by excluding items that are not reflective of our cash operations and core business performance. As a result, these adjusted numbers are not calculated in accordance with U.S. GAAP. See “- Non-GAAP Financial Measures” below.
| Nine Months Ended September 30, | Three Months Ended September 30, | ||||||||||||||||||||||||||||||||||||||||
| 2021 | 2020 | Change | 2021 | 2020 | Change | ||||||||||||||||||||||||||||||||||||
| Revenues: | |||||||||||||||||||||||||||||||||||||||||
| Fixed income execution | $ | 39 | $ | 56 | (29) | % | $ | 12 | $ | 15 | (18) | % | |||||||||||||||||||||||||||||
| CDS clearing | 144 | 166 | (14) | 51 | 47 | 9 | |||||||||||||||||||||||||||||||||||
| Fixed income data and analytics | 804 | 756 | 6 | 272 | 259 | 5 | |||||||||||||||||||||||||||||||||||
| Fixed income and credit | 987 | 978 | 1 | 335 | 321 | 5 | |||||||||||||||||||||||||||||||||||
| Other data and network services | 416 | 382 | 9 | 142 | 129 | 10 | |||||||||||||||||||||||||||||||||||
| Revenues | 1,403 | 1,360 | 3 | 477 | 450 | 6 | |||||||||||||||||||||||||||||||||||
| Other operating expenses | 752 | 725 | 4 | 252 | 244 | 4 | |||||||||||||||||||||||||||||||||||
| Depreciation and amortization | 257 | 262 | (2) | 85 | 87 | (3) | |||||||||||||||||||||||||||||||||||
| Acquisition-related transaction and integration costs | 1 | — | 78 | 1 | — | n/a | |||||||||||||||||||||||||||||||||||
| Operating expenses | 1,010 | 987 | 2 | 338 | 331 | 2 | |||||||||||||||||||||||||||||||||||
| Operating income | $ | 393 | $ | 373 | 5 | % | $ | 139 | $ | 119 | 17 | % |
Our Fixed Income and Data Services segment represents fixed income and credit trading and clearing as well as subscription-based, or recurring, revenues related to our fixed income data and analytics offerings as well as other multi-asset class data and network services.
For the nine months ended September 30, 2021 and 2020, 14% and 13%, respectively, of our Fixed Income and Data Services segment revenues were billed in pounds sterling or euros and for both the three months ended September 30, 2021 and 2020, 13% of our Fixed Income and Data Services segment revenues were billed in pounds sterling or euros. As the pound sterling or euro exchange rate changes, the U.S. equivalent of revenues denominated in foreign currencies changes accordingly. Due to the fluctuations of the pound sterling and euro compared to the U.S. dollar, our Fixed Income and Data Services revenues were higher by $14 million and $3 million for the nine and three months ended September 30, 2021, respectively, from the comparable periods in 2020.
Fixed Income and Data Services Revenues
Our Fixed Income and Data Services revenues increased 3% and 6% for the nine and three months ended September 30, 2021, respectively, from the comparable periods in 2020, primarily due to growth in our fixed income data and analytics products and our other data and network services.
-
Fixed Income Execution: Fixed income execution includes revenues from ICE Bonds. Execution fees are reported net of rebates, which were nominal for both the nine and three months ended September 30, 2021 and 2020. Our fixed income execution revenues decreased 29% and 18% for the nine and three months ended September 30, 2021, respectively, from the comparable periods in 2020 as 2020 had benefited from the price volatility related to COVID-19, as well as due to decreased retail activity, particularly in municipal and corporate bonds, in the first half of 2021 as a result of low interest rates.
-
CDS Clearing: CDS clearing revenues decreased 14% for the nine months ended September 30, 2021 from the comparable period in 2020 and increased 9% for the three months ended September 30, 2021 from the comparable period in 2020. The notional value of CDS cleared was $12.6 trillion and $14.6 trillion for the nine months ended September 30, 2021 and 2020, respectively, and $4.5 trillion and $3.6 trillion for the three months ended September 30, 2021 and 2020, respectively. Elevated volatility in 2020 related to COVID-19 benefited first and second quarter 2020 revenues, with volatility and cleared volumes generally returning to more normal levels in the second and third quarters of 2021.
-
Fixed Income Data and Analytics: Our fixed income data and analytics revenues increased 6% and 5% for the nine and three months ended September 30, 2021, respectively, from the comparable periods in 2020. The increase in revenue was due to strength in our index business and continued growth in our pricing and reference data business driven by the strong retention rate of existing customers, the addition of new customers and increased purchases by existing customers.
-
Other Data and Network Services: Our other data and network services revenues increased 9% and 10% for the nine and three months ended September 30, 2021, respectively, from the comparable periods in 2020. The increase in revenues was driven primarily by growth in our ICE Global Network offering, coupled with strength in our consolidated feeds and stronger desktop revenues.
Annual Subscription Value, or ASV, represents, at a point in time, the data services revenues, which includes fixed income data and analytics as well as other data and network services, subscribed for the succeeding 12 months. ASV does not include new sales, contract terminations or price changes that may occur during that 12-month period. However, while it is an indicative forward-looking metric, it does not provide a precise growth forecast of the next 12 months of data services revenues.
As of September 30, 2021, ASV was $1.624 billion, which increased 5.6% compared to the ASV as of September 30, 2020. ASV represents nearly 100% of total data services revenues for this segment. This does not adjust for year-over-year foreign exchange fluctuations.
Operating Expenses, Operating Income and Operating Margin
The following chart summarizes our Fixed Income and Data Services segment's operating expenses, operating income and operating margin (dollars in millions). See “- Consolidated Operating Expenses” below for a discussion of the significant changes in our operating expenses.
| Fixed Income and Data Services Segment: | Nine Months Ended September 30, | Three Months Ended September 30, | ||||||||||||||||||||||||||||||||||||
| 2021 | 2020 | Change | 2021 | 2020 | Change | |||||||||||||||||||||||||||||||||
| Operating expenses | $ | 1,010 | $ | 987 | 2 | % | $ | 338 | $ | 331 | 2 | % | ||||||||||||||||||||||||||
| Adjusted operating expenses(1) | $ | 874 | $ | 835 | 5 | % | $ | 293 | $ | 280 | 5 | % | ||||||||||||||||||||||||||
| Operating income | $ | 393 | $ | 373 | 5 | % | $ | 139 | $ | 119 | 17 | % | ||||||||||||||||||||||||||
| Adjusted operating income(1) | $ | 529 | $ | 525 | 1 | % | $ | 184 | $ | 170 | 9 | % | ||||||||||||||||||||||||||
| Operating margin | 28 | % | 27 | % | 1 pt | 29 | % | 26 | % | 3 pts | ||||||||||||||||||||||||||||
| Adjusted operating margin(1) | 38 | % | 39 | % | (1 pt) | 39 | % | 38 | % | 1 pt |
(1) The adjusted figures exclude items that are not reflective of our ongoing core operations and business performance. These adjusted numbers are not calculated in accordance with U.S. GAAP. See “- Non-GAAP Financial Measures” below.
Mortgage Technology Segment
The following charts and table present our selected statements of income data for our Mortgage Technology segment (dollars in millions and YTD represents the nine-month periods ended September 30th):
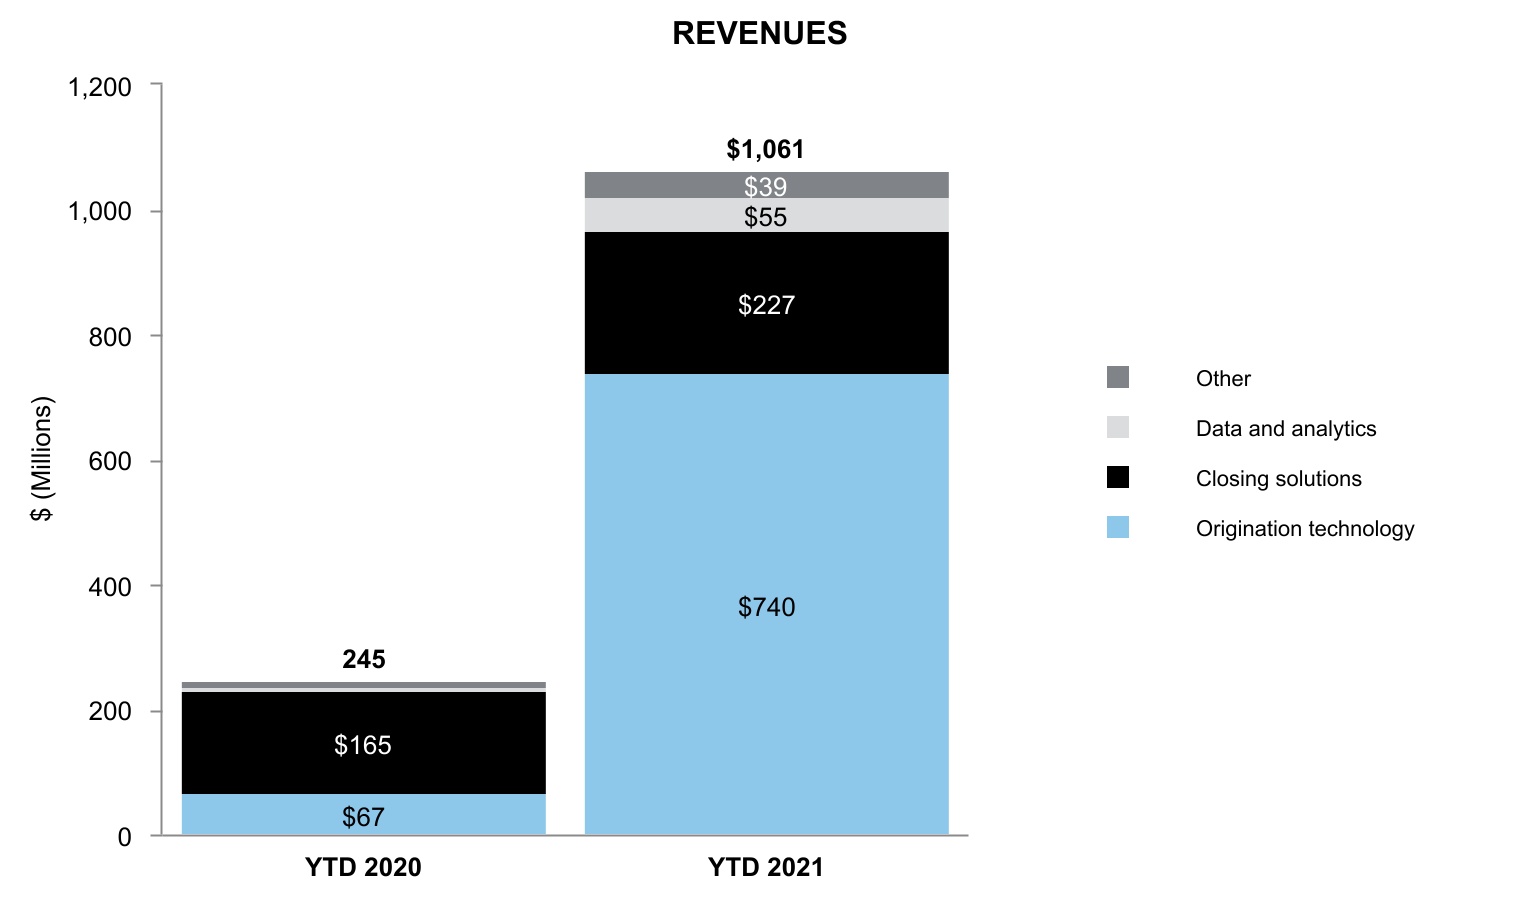
*Data and analytics and Other revenues were $5 million and $8 million for the nine months ended September, 2020, respectively.
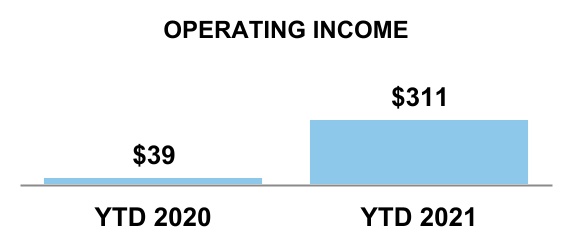
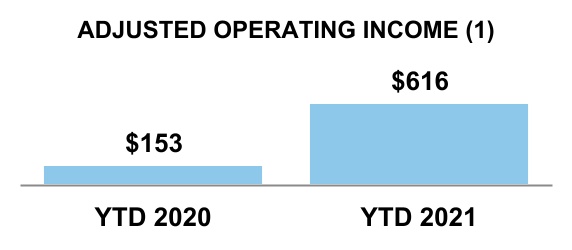
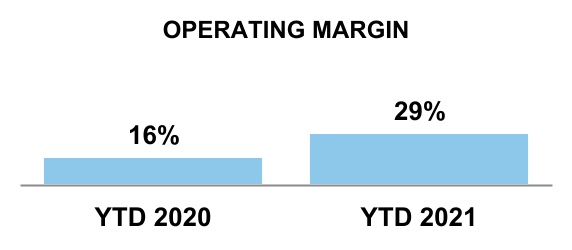
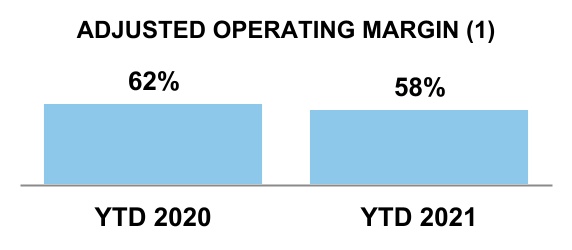
(1) The adjusted figures in the charts above are calculated by excluding items that are not reflective of our cash operations and core business performance. As a result, these adjusted numbers are not calculated in accordance with U.S. GAAP. See “- Non-GAAP Financial Measures” below.
| Nine Months Ended September 30, | Three Months Ended September 30, | ||||||||||||||||||||||||||||||||||||||||
| 2021 | 2020 | Change* | 2021 | 2020 | Change* | ||||||||||||||||||||||||||||||||||||
| Revenues: | |||||||||||||||||||||||||||||||||||||||||
| Origination technology | 740 | 67 | n/a | 245 | 67 | n/a | |||||||||||||||||||||||||||||||||||
| Closing solutions | 227 | 165 | 37% | 88 | 67 | 31 | |||||||||||||||||||||||||||||||||||
| Data and analytics | 55 | 5 | n/a | 19 | 5 | n/a | |||||||||||||||||||||||||||||||||||
| Other | 39 | 8 | n/a | 14 | 4 | n/a | |||||||||||||||||||||||||||||||||||
| Revenues | 1,061 | 245 | n/a | 366 | 143 | n/a | |||||||||||||||||||||||||||||||||||
| Other operating expenses | 406 | 86 | n/a | 140 | 48 | n/a | |||||||||||||||||||||||||||||||||||
| Depreciation and amortization | 316 | 43 | n/a | 106 | 31 | n/a | |||||||||||||||||||||||||||||||||||
| Acquisition-related transaction and integration costs | 28 | 77 | (63) | 10 | 77 | (85) | |||||||||||||||||||||||||||||||||||
| Operating expenses | 750 | 206 | n/a | 256 | 156 | n/a | |||||||||||||||||||||||||||||||||||
| Operating income | $ | 311 | $ | 39 | n/a | $ | 110 | $ | (13) | n/a |
*Percentage changes in the table above deemed "n/a" are not meaningful due to the acquisition of Ellie Mae in September 2020.
Mortgage Technology Revenues
Our mortgage technology revenues are derived from our comprehensive, end-to-end U.S. residential mortgage platform. Our mortgage technology business is intended to enable greater workflow efficiency for customers focused on originating U.S. residential mortgage loans. Mortgage technology revenues increased $816 million for the nine months ended September 30, 2021 from the comparable period in 2020 and $223 million for the three months ended September 30, 2021 from the comparable period in 2020. In September 2020, we acquired Ellie Mae and, as a result, our Mortgage Technology segment results for the nine months ended September 30, 2020 only include a contribution from this acquisition from the acquisition date.
Beginning in the first quarter of 2021, origination technology revenues include those related to our ICE Mortgage Technology network (previously reported in closing solutions revenues) and closing solutions revenues now include registration revenues related to MERS, (previously reported in other revenues) with prior periods restated to reflect these changes.
- Origination technology:** Our origination technology acts as a system of record for the mortgage origination, automating the gathering, reviewing, and verifying of mortgage-related information and enabling automated enforcement of rules and business practices designed to help ensure that each completed loan transaction is of high quality and adheres to secondary market standards. These revenues are based on recurring Software as a Service, or SaaS, subscription fees, with an additive Success-Based Pricing fee as lenders exceed the number of loans closed that are included with their monthly base subscription.
In addition, the ICE Mortgage Technology network provides originators connectivity to the mortgage supply chain and facilitates the secure exchange of information between our customers and a broad ecosystem of third-party service providers, as well as lenders and investors that are critical to consummating the millions of loan transactions that occur on our origination network each year. Revenue from the ICE Mortgage Technology network is largely transaction-based.
-
Closing solutions:** Our closing solutions uniquely connect key participants, such as lenders, title and settlement agents and individual county recorders, to digitize the traditionally manual and paper-based closing and recording process. Our closing solutions also include revenues from the MERS database, a leading system of record for recording and tracking changes in mortgage servicing rights and beneficial ownership interests in loans secured by U.S. residential real estate. Revenues from closing solutions are largely transaction-based.
-
Data and Analytics**: Revenues include those related to ICE Mortgage Technology’s Automation, Intelligence, Quality,
or AIQ offering, which applies machine learning and artificial intelligence, or AI, to the entire loan origination process, offering customers greater efficiency by streamlining data collection and validation through our automated document recognition and data extraction capabilities. AIQ revenues can be both recurring and transaction-based in nature. In addition, our data offerings include real-time industry and peer benchmarking tools, which provide originators a granular view into the real-time trends of nearly half the U.S. residential mortgage market. We also provide a Data as a Service, or DaaS, offering through private data clouds for lenders to access their own data and origination information. Revenues related to our data products are largely subscription-based and recurring in nature.
- Other:** Other revenues include professional services fees, as well as revenues from ancillary products. Other revenues are transaction-based.
The following chart summarizes our Mortgage Technology segment's operating expenses, operating income and operating margin (dollars in millions). See “- Consolidated Operating Expenses” below for a discussion of the significant changes in our operating expenses.
| Mortgage Technology Segment: | Nine Months Ended September 30, | Three Months Ended September 30, | |||||||||||||||||||||||||||||||||||||||
| 2021 | 2020 | Change | 2021 | 2020 | Change | ||||||||||||||||||||||||||||||||||||
| Operating expenses | $ | 750 | $ | 206 | n/a | $ | 256 | $ | 156 | n/a | |||||||||||||||||||||||||||||||
| Adjusted operating expenses(1) | $ | 445 | $ | 92 | n/a | $ | 153 | $ | 52 | n/a | |||||||||||||||||||||||||||||||
| Operating income | $ | 311 | $ | 39 | n/a | $ | 110 | $ | (13) | n/a | |||||||||||||||||||||||||||||||
| Adjusted operating income(1) | $ | 616 | $ | 153 | n/a | $ | 213 | $ | 91 | n/a | |||||||||||||||||||||||||||||||
| Operating margin | 29 | % | 16 | % | 13 pts | 30 | % | (9) | % | 39 pts | |||||||||||||||||||||||||||||||
| Adjusted operating margin(1) | 58 | % | 62 | % | (4 pts) | 58 | % | 64 | % | (6 pts) | |||||||||||||||||||||||||||||||
*Percentage changes in the table above deemed "n/a" are not meaningful due to the acquisition of Ellie Mae in September 2020.
(1) The adjusted figures exclude items that are not reflective of our ongoing core operations and business performance. These adjusted numbers are not calculated in accordance with GAAP. See “- Non-GAAP Financial Measures”
Consolidated Operating Expenses
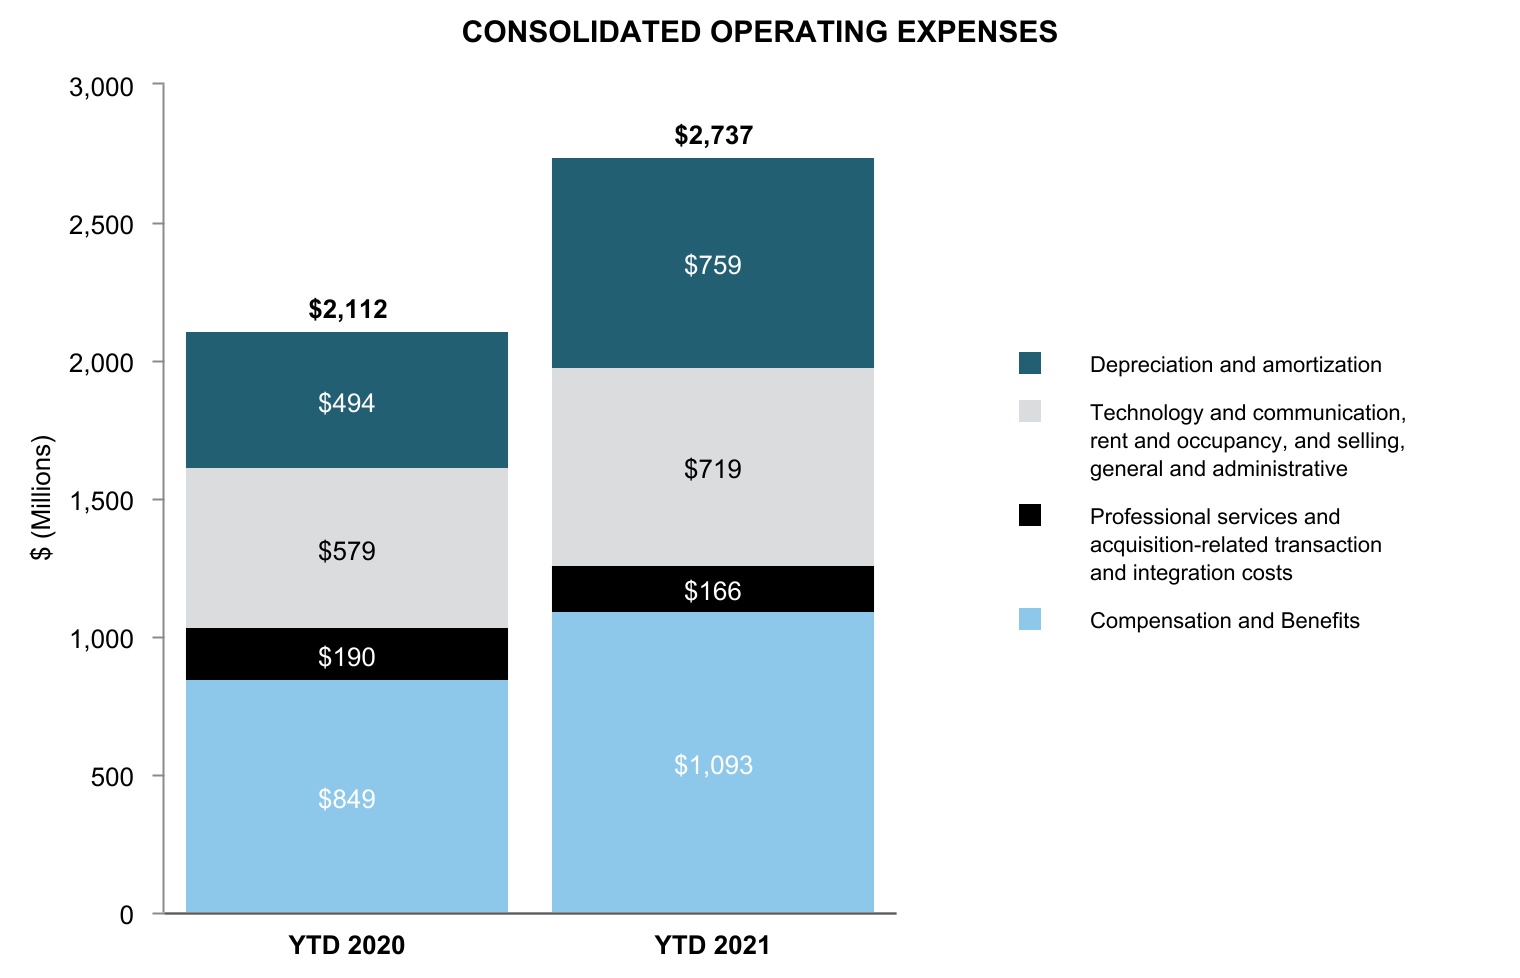
The following presents our consolidated operating expenses (dollars in millions and YTD represents the nine-month periods ended September 30th):
| Nine Months Ended September 30, | Three Months Ended September 30, | ||||||||||||||||||||||||||||||||||||||||
| 2021 | 2020 | Change | 2021 | 2020 | Change | ||||||||||||||||||||||||||||||||||||
| Compensation and benefits | $ | 1,093 | $ | 849 | 29 | % | $ | 374 | $ | 298 | 25 | % | |||||||||||||||||||||||||||||
| Professional services | 124 | 100 | 24 | 43 | 37 | 15 | |||||||||||||||||||||||||||||||||||
| Acquisition-related transaction and integration costs | 42 | 90 | (53) | 14 | 76 | (81) | |||||||||||||||||||||||||||||||||||
| Technology and communication | 495 | 388 | 28 | 168 | 131 | 28 | |||||||||||||||||||||||||||||||||||
| Rent and occupancy | 61 | 59 | 4 | 20 | 19 | 6 | |||||||||||||||||||||||||||||||||||
| Selling, general and administrative | 163 | 132 | 23 | 52 | 43 | 22 | |||||||||||||||||||||||||||||||||||
| Depreciation and amortization | 759 | 494 | 54 | 253 | 180 | 41 | |||||||||||||||||||||||||||||||||||
| Total operating expenses | $ | 2,737 | $ | 2,112 | 30 | % | $ | 924 | $ | 784 | 18 | % |
The majority of our operating expenses do not vary directly with changes in our volume and revenues, except for certain technology and communication expenses, including data acquisition costs, licensing and other fee-related arrangements and a portion of our compensation expense that is tied directly to our data sales or overall financial performance. The results of our September 2020 Ellie Mae acquisition are included in our consolidated operating expenses for the nine and three months ended September 30, 2021, but only in partial comparable pre-acquisition prior year periods.
We expect our operating expenses to increase in absolute terms in future periods in connection with the growth of our business, and to vary from year-to-year based on the type and level of our acquisitions, our integrations and other investments.
For the nine months ended September 30, 2021 and 2020, 10% and 11%, respectively, of our operating expenses were billed in pounds sterling or euros and for both the three months ended September 30, 2021 and 2020, 10% of our operating expenses were billed in pounds sterling or euros. Due to fluctuations in the U.S. dollar compared to the pound sterling and euro, our consolidated operating expenses increased $21 million and $5 million during the nine and three months ended September 30, 2021, respectively, from the comparable periods in 2020. See Item 3 “— Quantitative and Qualitative Disclosures About Market Risk - Foreign Currency Exchange Rate Risk” below for additional information.
Compensation and Benefits Expenses
Compensation and benefits expense is our most significant operating expense and includes non-capitalized employee wages, bonuses, non-cash or stock compensation, certain severance costs, benefits and employer taxes. The bonus component of our compensation and benefits expense is based on both our financial performance and individual employee performance. The performance-based restricted stock compensation expense is also based on our financial performance. Therefore, our compensation and benefits expense will vary year-to-year based on our financial performance and fluctuations in our number of employees. The below chart summarizes the significant drivers of our compensation and benefits expense results for the periods presented (dollars in millions, except employee headcount).
| Nine Months Ended September 30, | Three Months Ended September 30, | ||||||||||||||||||||||||||||||||||||||||
| 2021 | 2020 | Change | 2021 | 2020 | Change | ||||||||||||||||||||||||||||||||||||
| Employee headcount | 9,381 | 8,445 | 11 | % | |||||||||||||||||||||||||||||||||||||
| Stock-based compensation expenses | $ | 112 | $ | 95 | 18 | % | $ | 39 | $ | 32 | 22 | % |
Headcount increases were primarily driven by 538 new employees at Ellie Mae and 288 new employees at Bakkt. Ellie Mae compensation and benefits expenses increased $169 million and $46 million for the nine and three months ended September 30, 2021, respectively, from the comparable periods in the prior year, following our September 2020 acquisition. Bakkt compensation and benefits costs increased $23 million and $8 million for the nine and three months ended September 30, 2021, respectively, from the comparable periods in 2020, due to the acquisition of Bridge2 Solutions in February 2020 and other increases in employee headcount.
In addition, compensation and benefits expense increased for the nine and three months ended September 30, 2021, due to merit pay increases, above target performance-based compensation and higher employee insurance costs than in 2020 due to the impact of COVID-19. The stock-based compensation expenses in the table above relate to employee stock option and restricted stock awards and exclude stock-based compensation related to acquisition-related transaction and integration costs.
Professional Services Expenses
Professional services expense includes fees for consulting services received on strategic and technology initiatives, temporary labor, as well as regulatory, legal and accounting fees, and may fluctuate as a result of changes in the use of these services in our business.
Professional services expenses increased due to the inclusion of Ellie Mae expenses, which were $25 million and $8 million higher for the nine and three months ended September 30, 2021, respectively, than the comparable periods in 2020. In addition, professional service expenses related to Bakkt increased $6 million and $2 million during the nine and three months ended September 30, 2021. These increases were offset by lower legal expenses for 2021.
Acquisition-Related Transaction and Integration Costs
Acquisition-related transaction and integration costs during the nine and three months ended September 30, 2021 were primarily related to our integration of Ellie Mae and the Bakkt transaction. Acquisition-related transaction costs for the nine and three months ended September 30, 2020 were primarily related to our acquisition of Ellie Mae in September 2020. Acquisition-related transaction and integration costs for the nine months ended September 30, 2020 were also related to the February 2020 Bakkt acquisition of Bridge2 Solutions. The Bridge2 Solutions acquisition costs include $10 million of expenses resulting from a Bakkt incentive award market condition estimation adjustment that was directly related to the March 2020 capital call to fund the acquisition of Bridge2 Solutions.
We expect to continue to explore and pursue various potential acquisitions and other strategic opportunities to strengthen our competitive position and support our growth. As a result, we may incur acquisition-related transaction costs in future periods.
Technology and Communication Expenses
Technology support services consist of costs for running our wholly-owned data centers, hosting costs paid to third-party data centers and maintenance of our computer hardware and software required to support our technology and cybersecurity. These costs are driven by system capacity, functionality and redundancy requirements. Communication expenses consist of costs of network connections for our electronic platforms and telecommunications costs.
Technology and communications expense also includes fees paid for access to external market data, licensing and other fee agreement expenses. Technology and communications expenses may be impacted by growth in electronic contract volume, our capacity requirements, changes in the number of telecommunications hubs and connections with customers to access our electronic platforms directly.
Technology and communications expenses increased due to the inclusion of Ellie Mae expenses, which were $81 million and $23 million higher for the nine and three months ended September 30, 2021, respectively, from the comparable periods in 2020. In addition, technology and communication expenses increased $20 million and $10 million for the nine and three months ended September 30, 2021, respectively, from the comparable periods in 2020, due to increased license fees and data acquisition costs.
Rent and Occupancy Expenses
Rent and occupancy expense relates to leased and owned property and includes rent, maintenance, real estate taxes, utilities and other related costs. We have significant operations located in and around Atlanta, New York, Pleasanton, London and Hyderabad with smaller offices located throughout the world.
Rent and occupancy expenses include the expenses of Ellie Mae, which increased $7 million and $2 million for the nine and three months ended September 30, 2021, respectively, from the comparable periods in 2020. These expenses were partially offset by a decrease due to the early termination expense of our NYSE Chicago office lease during the nine months ended September 30, 2020, as well as a reduction in other occupancy expenses during the nine months ended September 30, 2021.
Selling, General and Administrative Expenses
Selling, general and administrative expenses include marketing, advertising, public relations, insurance, bank service charges, dues and subscriptions, travel and entertainment, non-income taxes and other general and administrative costs.
Selling, general and administrative expenses increased, due to the inclusion of Ellie Mae expenses, which were $12 million and $3 million higher for the nine and three months ended September 30, 2021 from the comparable periods in 2020. Bakkt related expenses were $15 million and $3 million higher for the nine and three months ended September 30, 2021 from the comparable periods in 2020 due to increased marketing expenses related to the launch of Bakkt's digital wallet, Bakkt App.
In addition, marketing expenses increased $13 million and $3 million for the nine and three months ended September 30, 2021 from the comparable periods in 2020 primarily due to higher NYSE initial public offering, or IPO, marketing expenses, which were partially offset by a charitable contribution in support of COVID-19 relief efforts of $10 million during the nine months ended September 30, 2020.
Depreciation and Amortization Expenses
Depreciation and amortization expense results from depreciation of long-lived assets such as buildings, leasehold improvements, aircraft, hardware and networking equipment, software, furniture, fixtures and equipment over their estimated useful lives. This expense includes amortization of intangible assets obtained in our acquisitions of businesses, as well as on various licensing agreements, over their estimated useful lives. Intangible assets subject to amortization consist primarily of customer relationships, trading products with finite lives and technology. This expense also includes amortization of internally-developed and purchased software over its estimated useful life.
We recorded amortization expenses on intangible assets acquired as part of our acquisitions, as well as on other intangible assets, of $470 million and $236 million for the nine months ended September 30, 2021 and 2020, respectively and $156 million and $95 million for the three months ended September 30, 2021 and 2020, respectively. The increase in amortization expense was primarily due to amortization of Ellie Mae intangible assets of $240 million and $64 million for the nine and three months ended September 30, 2021, respectively, from the comparable periods in 2020.
We recorded depreciation expenses on our fixed assets of $289 million and $258 million for the nine months ended September 30, 2021 and 2020, respectively, and $97 million and $85 million for the three months ended September 30, 2021 and 2020, respectively. The increase in depreciation expense was primarily due to depreciation of Ellie Mae fixed
assets of $26 million and $9 million for the nine and three months ended September 30, 2021, respectively, from the comparable periods in 2020.
Consolidated Non-Operating Income (Expense)
Income and expenses incurred through activities outside of our core operations are considered non-operating. The following tables present our non-operating income (expenses) (dollars in millions):
| Nine Months Ended September 30, | Three Months Ended September 30, | ||||||||||||||||||||||||||||||||||||||||
| 2021 | 2020 | Change | 2021 | 2020 | Change | ||||||||||||||||||||||||||||||||||||
| Other income (expense): | |||||||||||||||||||||||||||||||||||||||||
| Interest income | $ | — | $ | 9 | (95)% | $ | — | $ | 1 | (88)% | |||||||||||||||||||||||||||||||
| Interest expense | (321) | (245) | 31 | (108) | (89) | 22 | |||||||||||||||||||||||||||||||||||
| Other income (expense), net | 1,341 | 75 | n/a | 54 | 44 | 25 | |||||||||||||||||||||||||||||||||||
| Total other income (expense), net | $ | 1,020 | $ | (161) | n/a | $ | (54) | $ | (44) | 22% | |||||||||||||||||||||||||||||||
| Net income attributable to non-controlling interest | $ | (9) | $ | (17) | (47)% | $ | (4) | $ | (4) | (6)% |
Interest Income
Interest income decreased for the nine and three months ended September 30, 2021 from the comparable periods in 2020 primarily due to a decrease in short-term interest rates on various investments.
Interest Expense
Interest expense increased for the nine and three months ended September 30, 2021 from the comparable periods in 2020 primarily due to the issuance of senior notes in May 2020 to refinance existing debt and the issuance of senior notes in August 2020 related to the Ellie Mae acquisition, and $4 million in accelerated unamortized costs related to the early payoff of the June 2023 floating rate notes, partially offset by a $14 million extinguishment payment we incurred related to the June 2020 early redemption of senior notes with an original maturity of December 1, 2020, or the December 2020 Senior Notes. See “- Debt” below.
Other income (expense), net
During the nine months ended September 30, 2021, Coinbase completed an IPO and we sold our investment in Coinbase for $1.24 billion, and recorded a gain of $1.23 billion as other income.
During the nine months ended September 30, 2021, we recorded a gain of $7 million related to the settlement of an acquisition-related indemnification claim from a prior acquisition as other income.
During the nine and three months ended September 30, 2021, we accrued approximately $16 million related to a legal settlement.
We own a 40% interest in OCC which we treat as an equity method investment. OCC is regulated by the SEC and the CFTC. We recognized $42 million and $84 million during the nine months ended September 30, 2021 and 2020, respectively, and $8 million and $49 million for the three months ended September 30, 2021 and 2020, respectively, of equity earnings as our share of OCC's estimated profits, which is included in other income. Included within the amount recognized during the nine months ended 2021 is a $16 million earnings adjustment to reflect higher than reported 2020 net income than originally estimated by OCC. Similarly, included within the amount recognized during the nine months ended 2020 is a $7 million earnings adjustment to reflect higher than reported 2019 net income than originally estimated. Included within the amount recognized during the three months ended September 30, 2020 is a $36 million earnings adjustment to reflect higher than reported 2020 net income than originally estimated.
In connection with our equity investment in Euroclear, we recognized dividend income of $60 million and $30 million during the nine and three months ended September 30, 2021, respectively, which is included in other income. As a result of a 2020 European regulation limiting dividend payments, we did not receive a Euroclear dividend in 2020, but have now received two dividend payments during the nine months ended September 30, 2021. In addition, during the three months ended September 30, 2021 we became aware of an observable price change in orderly transactions of similar Euroclear investments by a third party. The transactions resulted in a fair value adjustment of our Euroclear investment, and we recorded a gain of $34 million in other income, including the impact of foreign currency exchange.
We incurred foreign currency transaction losses of $11 million and $2 million for the nine months ended September 30, 2021 and 2020, respectively, and $2 million and $3 million and for the three months ended September 30, 2021 and 2020,
respectively, primarily attributable to the fluctuations of the pound sterling and euro relative to the U.S. dollar. Foreign currency transaction gains and losses are recorded in other income (expense), net, when the settlement of foreign currency assets, liabilities and payables occur in non-functional currencies and there is an increase or decrease in the period-end foreign currency exchange rates between periods. See Item 3 “- Quantitative and Qualitative Disclosures About Market Risk - Foreign Currency Exchange Rate Risk” included elsewhere in this Quarterly Report for more information on these items.
Non-controlling Interest
For consolidated subsidiaries in which our ownership is less than 100%, and for which we have control over the assets, liabilities and management of the entity, the outside stockholders’ interests are shown as non-controlling interests. As of September 30, 2021, our non-controlling interests included those related to the non-ICE limited partners' 26.7% ownership interest in our CDS clearing subsidiaries, non-controlling interests in ICE Futures Abu Dhabi and redeemable non-controlling interests of the non-ICE partners in Bakkt. On October 15, 2021, Bakkt completed its merger with VIH and we no longer hold a majority interest.
Consolidated Income Tax Provision
Consolidated income tax expense was $1.0 billion and $512 million for the nine months ended September 30, 2021 and 2020, respectively, and $187 million and $189 million for the three months ended September 30, 2021 and 2020, respectively. The change in consolidated income tax expense between periods is primarily due to the tax impact of changes in our pre-tax income and the changes in our effective tax rate each period.
Our effective tax rate was 29% and 24% for the nine months ended September 30, 2021 and 2020, respectively, and 23% and 32% for the three months ended September 30, 2021 and 2020, respectively. The effective tax rate for the nine months ended September 30, 2021 was higher than the effective tax rate for the comparable period in 2020 primarily due to the deferred income tax impact resulting from the U.K. tax law changes enacted in June 2021, which increased the U.K. corporate income tax rate from 19% to 25% effective April 1, 2023. The effective tax rate for the three months ended September 30, 2021 was lower than the effective tax rate for the comparable period in 2020 primarily due to the deferred income tax impact resulting from the U.K. tax law changes enacted in July 2020, which increased the U.K. corporate income tax rate from 17% to 19% effective April 1, 2020.
On March 11, 2021, the American Rescue Plan Act, or ARPA, was signed into law. The ARPA enacted certain provisions that are relevant to corporate income tax. These provisions did not have a material impact on our income tax provision for the nine and three months ended September 30, 2021.
Quarterly Results of Operations
The following quarterly unaudited condensed consolidated statements of income data has been prepared on substantially the same basis as our audited consolidated financial statements and includes all adjustments, consisting only of normal recurring adjustments, necessary for the fair presentation of our consolidated results of operations for the quarters presented. The historical results for any quarter do not necessarily indicate the results expected for any future period. The following table sets forth quarterly consolidated statements of income data (in millions):
| Three Months Ended | ||||||||||||||||||||||||||||||||
| September 30, 2021 | June 30, 2021 | March 31, 2021 | December 31, 2020 | September 30, 2020 | ||||||||||||||||||||||||||||
| Revenues: | ||||||||||||||||||||||||||||||||
| Energy futures and options | $ | 316 | $ | 274 | $ | 310 | $ | 262 | $ | 229 | ||||||||||||||||||||||
| Agricultural and metals futures and options | 56 | 62 | 59 | 48 | 54 | |||||||||||||||||||||||||||
| Financial futures and options | 93 | 83 | 105 | 82 | 76 | |||||||||||||||||||||||||||
| Cash equities and equity options | 554 | 512 | 734 | 651 | 593 | |||||||||||||||||||||||||||
| OTC and other | 84 | 78 | 77 | 77 | 73 | |||||||||||||||||||||||||||
| Data and connectivity services | 208 | 208 | 207 | 201 | 201 | |||||||||||||||||||||||||||
| Listings | 123 | 119 | 114 | 112 | 111 | |||||||||||||||||||||||||||
| Total exchanges revenues | 1,434 | 1,336 | 1,606 | 1,433 | 1,337 | |||||||||||||||||||||||||||
| Fixed income execution | 12 | 13 | 14 | 14 | 15 | |||||||||||||||||||||||||||
| CDS Clearing | 51 | 38 | 55 | 42 | 47 | |||||||||||||||||||||||||||
| Fixed income data and analytics | 272 | 268 | 264 | 262 | 259 | |||||||||||||||||||||||||||
| Other data and network services | 142 | 139 | 135 | 132 | 129 | |||||||||||||||||||||||||||
| Total fixed income and data services revenues | 477 | 458 | 468 | 450 | 450 | |||||||||||||||||||||||||||
| Origination technology | 245 | 241 | 254 | 249 | 67 | |||||||||||||||||||||||||||
| Closing solutions | 88 | 69 | 70 | 73 | 67 | |||||||||||||||||||||||||||
| Data and analytics | 19 | 18 | 18 | 17 | 5 | |||||||||||||||||||||||||||
| Other | 14 | 12 | 13 | 11 | 4 | |||||||||||||||||||||||||||
| Total mortgage technology revenues | 366 | 340 | 355 | 350 | 143 | |||||||||||||||||||||||||||
| Total revenues | 2,277 | 2,134 | 2,429 | 2,233 | 1,930 | |||||||||||||||||||||||||||
| Transaction-based expenses | 475 | 427 | 632 | 562 | 519 | |||||||||||||||||||||||||||
| Total revenues, less transaction-based expenses | 1,802 | 1,707 | 1,797 | 1,671 | 1,411 | |||||||||||||||||||||||||||
| Compensation and benefits | 374 | 365 | 354 | 339 | 298 | |||||||||||||||||||||||||||
| Professional services | 43 | 37 | 44 | 44 | 37 | |||||||||||||||||||||||||||
| Acquisition-related transaction and integration costs | 14 | 10 | 18 | 15 | 76 | |||||||||||||||||||||||||||
| Technology and communication | 168 | 165 | 162 | 161 | 131 | |||||||||||||||||||||||||||
| Rent and occupancy | 20 | 20 | 21 | 22 | 19 | |||||||||||||||||||||||||||
| Selling, general and administrative | 52 | 60 | 51 | 53 | 43 | |||||||||||||||||||||||||||
| Depreciation and amortization | 253 | 251 | 255 | 257 | 180 | |||||||||||||||||||||||||||
| Total operating expenses | 924 | 908 | 905 | 891 | 784 | |||||||||||||||||||||||||||
| Operating income | 878 | 799 | 892 | 780 | 627 | |||||||||||||||||||||||||||
| Other income (expense), net | (54) | 1,133 | (59) | (106) | (44) | |||||||||||||||||||||||||||
| Income tax expense | 187 | 679 | 183 | 146 | 189 | |||||||||||||||||||||||||||
| Net income | $ | 637 | $ | 1,253 | $ | 650 | $ | 528 | $ | 394 | ||||||||||||||||||||||
| Net income attributable to non-controlling interest | (4) | (1) | (4) | (2) | (4) | |||||||||||||||||||||||||||
| Net income attributable to Intercontinental Exchange, Inc. | $ | 633 | $ | 1,252 | $ | 646 | $ | 526 | $ | 390 |
Liquidity and Capital Resources
Below are charts that reflect our outstanding debt and capital allocation. The acquisition and integration costs in the chart below include cash paid for acquisitions, net of cash received for divestitures, cash paid for equity and equity method investments, cash paid for non-controlling interest and redeemable non-controlling interest, and acquisition-related transaction and integration costs, in each period (YTD represents the nine-month periods ended September 30th).

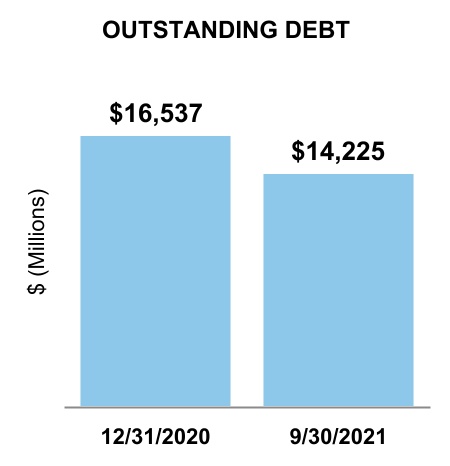
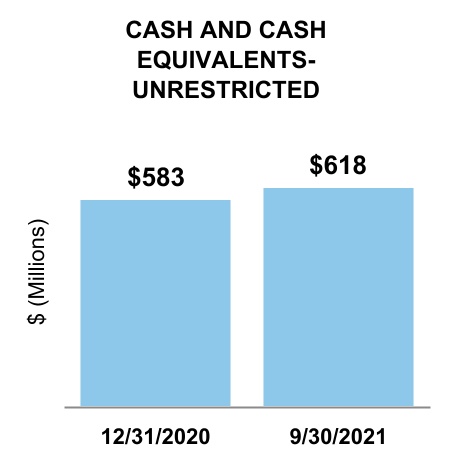
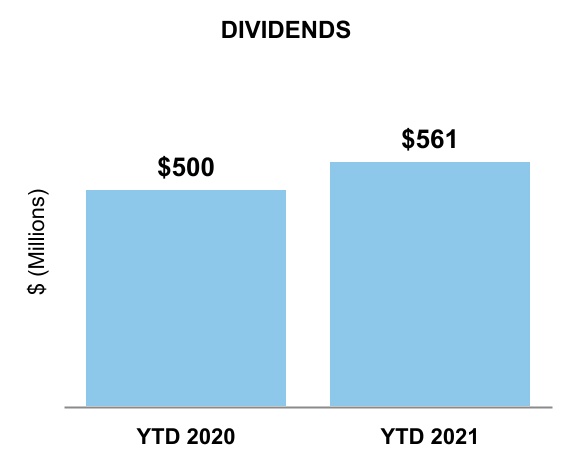

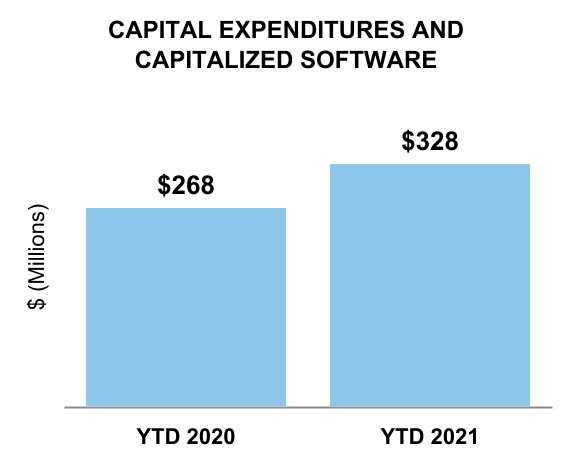

We have financed our operations, growth and cash needs primarily through income from operations and borrowings under our various debt facilities. Our principal capital requirements have been to fund capital expenditures, working capital, strategic acquisitions and investments, stock repurchases, dividends and the development of our technology platforms. We believe that our cash on hand and cash flows from operations will be sufficient to repay our outstanding debt, but we
may also need to incur additional debt or issue additional equity securities in the future. See “- Future Capital Requirements” below.
See “– Cash Flow” below for a discussion of our capital expenditures and capitalized software development costs.
Consolidated cash and cash equivalents were $618 million and $583 million as of September 30, 2021 and December 31, 2020, respectively. We had $1.4 billion in short-term and long-term restricted cash and cash equivalents as of both September 30, 2021 and December 31, 2020.
As of September 30, 2021, the amount of unrestricted cash held by our non-U.S. subsidiaries was $400 million. Due to U.S. tax reform, the majority of our foreign earnings since January 1, 2018 have been subject to immediate U.S. income taxation, and the existing non-U.S. unrestricted cash balance can be distributed to the U.S. in the future with no material additional income tax consequences.
Our cash and cash equivalents and financial investments are managed as a global treasury portfolio of non-speculative financial instruments that are readily convertible into cash, such as overnight deposits, term deposits, money market funds, mutual funds for treasury investments, short duration fixed income investments and other money market instruments, thus ensuring high liquidity of financial assets. We may invest a portion of our cash in excess of short-term operating needs in investment-grade marketable debt securities, including government or government-sponsored agencies and corporate debt securities. As of September 30, 2021, we held $17 million of unrestricted cash that was set aside for legal, regulatory, and surveillance operations at NYSE.
Cash Flow
The following table presents the major components of net changes in cash, cash equivalents, and restricted cash and cash equivalents (in millions):
| Nine Months Ended September 30, | ||||||||||||||
| 2021 | 2020 | |||||||||||||
| Net cash provided by (used in): | ||||||||||||||
| Operating activities | $ | 2,130 | $ | 1,815 | ||||||||||
| Investing activities | 872 | (9,702) | ||||||||||||
| Financing activities | (2,928) | 7,709 | ||||||||||||
| Effect of exchange rate changes | (4) | 1 | ||||||||||||
| Net increase/(decrease) in cash, cash equivalents and restricted cash and cash equivalents | $ | 70 | $ | (177) |
Operating Activities
Net cash provided by operating activities primarily consists of net income adjusted for certain items, including depreciation and amortization, deferred taxes, stock based compensation and the effects of changes in working capital.
The $315 million increase in net cash provided by operating activities during the nine months ended September 30, 2021 from the comparable period in 2020 was driven by the timing of accounts receivable collections of $119 million, primarily due to a prior period COVID-19-related decision to allow customers to defer payment of their 2020 listings invoices, as well as a $407 million increase in net income, adjusted for depreciation and amortization, deferred taxes and the gain from the sale of our Coinbase investment, net of taxes, of $898 million. These increases were partially offset by a decrease in Section 31 fee collections of $108 million, primarily due to lower rates, which were revised in February of each year. The remaining change is due to fluctuations in our working capital and the timing of various payments such as transaction-related expenses and taxes payable on the sale of our Coinbase investment.
Investing Activities
Consolidated net cash provided by investing activities for the nine months ended September 30, 2021 primarily relates to $1.2 billion of proceeds from the sale of our Coinbase investment, partially offset by $117 million of capital expenditures, $211 million of capitalized software development costs, and $23 million for the purchase of an equity method investment.
Consolidated net cash used in investing activities for the nine months ended September 30, 2020 primarily relates to $9.4 billion cash paid for acquisitions, primarily Ellie Mae, net of cash acquired, $114 million of capital expenditures and $154 million of capitalized software development costs.
The capital expenditures primarily relate to hardware and software purchases to continue the development and expansion of our electronic platforms, data services and clearing houses, and leasehold improvements. The software development
expenditures primarily relate to the development and expansion of our electronic trading platforms, data services, mortgage services and clearing houses.
Financing Activities
Consolidated net cash used in financing activities for the nine months ended September 30, 2021 primarily relates to $1.2 billion in repayments of debt facilities, $1.1 billion in net repayments under our Commercial Paper Program, $561 million in dividend payments to stockholders and $69 million in cash payments related to treasury shares received for restricted stock tax payments and stock option exercises.
Consolidated net cash provided by financing activities for the nine months ended September 30, 2020 primarily relates to $9.6 billion in net proceeds from the issuances of our senior notes issued in May 2020 (i.e., the 2030 Senior Notes and the 2050 Senior Notes) and the August 2020 Notes, borrowings under our term loan facility maturing on February 21, 2022 and $1.1 billion in net issuances under our Commercial Paper Program, partially offset by $1.3 billion in repayments of our December 2020 Senior Notes, $1.2 billion in repurchases of common stock, $500 million in dividend payments to stockholders and $72 million in cash payments related to treasury shares received for restricted stock tax payments and stock option exercises.
Debt
As of September 30, 2021, we had $14.2 billion in outstanding debt, consisting of $12.9 billion of fixed rate senior notes, $1.3 billion under the Commercial Paper Program and $8 million under credit lines at our India subsidiaries. Our fixed rate senior notes of $12.9 billion have a weighted average maturity of 15 years and a weighted average cost of 3.0% per annum. The commercial paper notes had original maturities ranging from one to 75 days as of September 30, 2021, with a weighted average interest rate of 0.24% per annum, and a weighted average remaining maturity of 28 days. As of December 31, 2020, we had $16.5 billion in outstanding debt, consisting of $12.9 billion of fixed rate senior notes, $1.2 billion of floating rate senior notes, $2.4 billion under the Commercial Paper Program and $6 million under credit lines at our India subsidiaries. The commercial paper notes had original maturities ranging from four to 266 days as of December 31, 2020, with a weighted average interest rate of 0.40% per annum, and a weighted average remaining maturity of 82 days.
During the three months ended September 30, 2021, we used the proceeds from commercial paper issuances and cash on hand to fund the redemption of our $1.25 billion aggregate principal amount of senior floating rate notes due in June 2023, or the Floating Rate Notes. We delivered a notice of redemption of the Floating Rate Notes to Wells Fargo Bank, National Association, as trustee, under the indenture governing the Floating Rate Notes, which was delivered to the holders of the Floating Rate Notes on September 17, 2021, and they were subsequently redeemed on September 27, 2021. In connection with this redemption, we recorded $4 million in accelerated unamortized costs, which are included in interest expense in our consolidated statements of income for the three months ended September 30, 2021.
We have a $3.8 billion senior unsecured revolving credit facility, or the Credit Facility, pursuant to a credit agreement with Wells Fargo Bank, N.A., as primary administrative agent, issuing lender and swing-line lender, Bank of America, N.A., as syndication agent, backup administrative agent and swing-line lender, and the other lenders party thereto. As of September 30, 2021, of the $3.8 billion that is currently available for borrowing under the Credit Facility, $1.3 billion is required to back-stop the amount outstanding under our Commercial Paper Program and $172 million is required to support certain broker-dealer and other subsidiary commitments. The amount required to back-stop the amounts outstanding under the Commercial Paper Program will fluctuate as we increase or decrease our commercial paper borrowings. The remaining $2.3 billion is available for working capital and general corporate purposes including, but not limited to, acting as a back-stop to future increases in the amounts outstanding under the Commercial Paper Program. On October 15, 2021, we agreed with the lenders to extend the maturity date of the Credit Facility to October 15, 2026, among other items.
Our Commercial Paper Program enables us to borrow efficiently at reasonable short-term interest rates and provides us with the flexibility to de-lever using our strong annual cash flows from operating activities whenever our leverage becomes elevated as a result of investment or acquisition activities. We had net repayments of $1.1 billion under our Commercial Paper Program during the nine months ended September 30, 2021. We used $1.2 billion of proceeds received from the sale of our Coinbase investment to pay down the commercial paper balance.
Upon maturity of our commercial paper and to the extent old issuances are not repaid by cash on hand, we are exposed to the rollover risk of not being able to issue new commercial paper. To mitigate this risk, we maintain the Credit Facility for an aggregate amount which meets or exceeds the amount issued under our Commercial Paper Program at any time. If we were not able to issue new commercial paper, we have the option of drawing on the back-stop revolving facility. However, electing to do so would result in higher interest expense.
For additional details of our debt instruments, refer to Note 9 to our consolidated unaudited financial statements, included in this Quarterly Report, and Note 10 to our consolidated financial statements included in our 2020 Form 10-K.
Capital Return
In December 2019, our Board approved an aggregate of $2.4 billion for future repurchases of our common stock with no fixed expiration date that became effective January 1, 2020. The $2.4 billion replaced the previous amount approved by the Board.
For the nine months ended September 30, 2021, we did not repurchase any of our outstanding common stock. For the nine months ended September 30, 2020, we repurchased 13.6 million shares of our outstanding common stock at a cost of $1.2 billion, including 10.4 million shares at a cost of $948 million under our Rule 10b5-1 trading plan and 3.2 million shares at a cost of $299 million on the open market. Shares repurchased are held in treasury stock.
We discontinued stock repurchases and terminated our Rule 10b5-1 trading plan in August 2020 in connection with the Ellie Mae acquisition. The remaining balance of Board approved funds for future repurchase as of September 30, 2021 is $1.2 billion. The approval of our Board for the share repurchases does not obligate us to acquire any particular amount of our common stock. In addition, our Board may increase or decrease the amount available for repurchases from time to time.
From time to time, we enter into Rule 10b5-1 trading plans, as authorized by our Board, to govern some or all of the repurchases of our shares of common stock. The timing and extent of future repurchases that are not made pursuant to a Rule 10b5-1 trading plan will be at our discretion and will depend upon many conditions. In making a determination regarding any stock repurchases, management considers multiple factors, including overall stock market conditions, our common stock price performance, the remaining amount authorized for repurchases by our Board, the potential impact of a stock repurchase program on our corporate debt ratings, our expected free cash flow and working capital needs, our current and future planned strategic growth initiatives, and other potential uses of our cash and capital resources.
During the third quarter of 2021, we paid a quarterly dividend of $0.33 per share of our common stock for an aggregate payout of $187 million, which includes the payment of dividend equivalents on unvested employee restricted stock units.
Future Capital Requirements
Our future capital requirements will depend on many factors, including the rate of growth across our segments, strategic plans and acquisitions, available sources for financing activities, required and discretionary technology and clearing initiatives, regulatory requirements, the timing and introduction of new products and enhancements to existing products, the geographic mix of our business and potential stock repurchases.
We currently expect to incur capital expenditures (including operational and real estate capital expenditures) and to incur software development costs that are eligible for capitalization ranging in the aggregate between $430 million and $450 million in 2021, which we believe will support the enhancement of our technology, business integration and the continued growth of our businesses.
As of September 30, 2021, we had $1.2 billion authorized for future repurchases of our common stock. Refer to Note 11 to our consolidated financial statements included in this Quarterly Report for additional details on our stock repurchase program.
Our Board has adopted a quarterly dividend policy providing that dividends will be approved quarterly by the Board or the Audit Committee taking into account factors such as our evolving business model, prevailing business conditions, our current and future planned strategic growth initiatives and our financial results and capital requirements, without a predetermined net income payout ratio. On October 28, 2021, we announced a $0.33 per share dividend for the fourth quarter of 2021 with the dividend payable on December 31, 2021 to stockholders of record as of December 17, 2021.
Other than the facilities for the ICE Clearing Houses, our Credit Facility and our Commercial Paper Program are currently the only significant agreements or arrangements that we have for liquidity and capital resources with third parties. See Notes 9 and 13 to our consolidated financial statements for further discussion. In the event of any strategic acquisitions, mergers or investments, or if we are required to raise capital for any reason or desire to return capital to our stockholders, we may incur additional debt, issue additional equity to raise necessary funds, repurchase additional shares of our common stock or pay a dividend. However, we cannot provide assurance that such financing or transactions will be available or successful, or that the terms of such financing or transactions will be favorable to us. See “—Debt" above.
Non-GAAP Measures
We use certain financial measures internally to evaluate our performance and make financial and operational decisions that are presented in a manner that adjusts from their equivalent GAAP measures or that supplement the information provided by our GAAP measures. We use these adjusted results because we believe they more clearly highlight trends in our business that may not otherwise be apparent when relying solely on GAAP financial measures, since these measures eliminate from our results specific financial items that have less bearing on our core operating performance.
We use these measures in communicating certain aspects of our results and performance, including in this Quarterly Report, and believe that these measures, when viewed in conjunction with our GAAP results and the accompanying reconciliation, can provide investors with greater transparency and a greater understanding of factors affecting our financial condition and results of operations than GAAP measures alone. In addition, we believe the presentation of these measures is useful to investors for making period-to-period comparisons of results because the adjustments to GAAP are not reflective of our core business performance.
These financial measures are not presented in accordance with, or as an alternative to, GAAP financial measures and may be different from non-GAAP measures used by other companies. We encourage investors to review the GAAP financial measures included in this Quarterly Report, including our consolidated financial statements, to aid in their analysis and understanding of our performance and in making comparisons.
The table below outlines our adjusted operating expenses, adjusted operating income, adjusted operating margin, adjusted net income attributable to ICE common stockholders and adjusted earnings per share, which are non-GAAP measures that are calculated by making adjustments for items we view as not reflective of our cash operations and core business performance. These measures, including the adjustments and their related income tax effect and other tax adjustments (in millions, except for percentages and per share amounts), are as follows:
| Exchanges Segment | Fixed Income and Data Services Segment | Mortgage Technology Segment | Consolidated | |||||||||||||||||||||||||||||||||||||||||||||||||||||
| Nine Months Ended September 30, | ||||||||||||||||||||||||||||||||||||||||||||||||||||||||
| 2021 | 2020 | 2021 | 2020 | 2021 | 2020 | 2021 | 2020 | |||||||||||||||||||||||||||||||||||||||||||||||||
| Total revenues, less transaction-based expenses | $ | 2,842 | $ | 2,760 | $ | 1,403 | $ | 1,360 | $ | 1,061 | $ | 245 | $ | 5,306 | $ | 4,365 | ||||||||||||||||||||||||||||||||||||||||
| Operating expenses | 977 | 919 | 1,010 | 987 | 750 | 206 | 2,737 | 2,112 | ||||||||||||||||||||||||||||||||||||||||||||||||
| Less: Amortization of acquisition-related intangibles | 56 | 53 | 136 | 144 | 277 | 38 | 469 | 235 | ||||||||||||||||||||||||||||||||||||||||||||||||
| Less: Transaction and integration costs and acquisition-related success fees | 12 | 10 | — | — | 28 | 76 | 40 | 86 | ||||||||||||||||||||||||||||||||||||||||||||||||
| Less: Accrual relating to regulatory settlement | — | — | — | 8 | — | — | — | 8 | ||||||||||||||||||||||||||||||||||||||||||||||||
| Adjusted operating expenses | $ | 909 | $ | 856 | $ | 874 | $ | 835 | $ | 445 | $ | 92 | $ | 2,228 | $ | 1,783 | ||||||||||||||||||||||||||||||||||||||||
| Operating income | $ | 1,865 | $ | 1,841 | $ | 393 | $ | 373 | $ | 311 | $ | 39 | $ | 2,569 | $ | 2,253 | ||||||||||||||||||||||||||||||||||||||||
| Adjusted operating income | $ | 1,933 | $ | 1,904 | $ | 529 | $ | 525 | $ | 616 | $ | 153 | $ | 3,078 | $ | 2,582 | ||||||||||||||||||||||||||||||||||||||||
| Operating margin | 66 | % | 67 | % | 28 | % | 27 | % | 29 | % | 16 | % | 48 | % | 52 | % | ||||||||||||||||||||||||||||||||||||||||
| Adjusted operating margin | 68 | % | 69 | % | 38 | % | 39 | % | 58 | % | 62 | % | 58 | % | 59 | % | ||||||||||||||||||||||||||||||||||||||||
| Net income attributable to ICE common stockholders | $ | 2,531 | $ | 1,563 | ||||||||||||||||||||||||||||||||||||||||||||||||||||
| Add: Amortization of acquisition-related intangibles | 469 | 235 | ||||||||||||||||||||||||||||||||||||||||||||||||||||||
| Add: Transaction and integration costs and acquisition-related success fees | 40 | 86 | ||||||||||||||||||||||||||||||||||||||||||||||||||||||
| Add: Accelerated unamortized costs related to the early payoff of the June 2023 floating rate senior notes | 4 | — | ||||||||||||||||||||||||||||||||||||||||||||||||||||||
| Add: Extinguishment of December 2020 Senior Notes | — | 14 | ||||||||||||||||||||||||||||||||||||||||||||||||||||||
| Add: Pre-acquisition interest expense on debt issued for Ellie Mae acquisition | — | 5 | ||||||||||||||||||||||||||||||||||||||||||||||||||||||
| Add: Accrual relating to legal settlement | 16 | — | ||||||||||||||||||||||||||||||||||||||||||||||||||||||
| Add: Accrual relating to regulatory settlement | — | 8 | ||||||||||||||||||||||||||||||||||||||||||||||||||||||
| Add: Impairment of CAT promissory notes | — | 2 | ||||||||||||||||||||||||||||||||||||||||||||||||||||||
| Less: Gain on sale of Coinbase equity investment | (1,227) | — | ||||||||||||||||||||||||||||||||||||||||||||||||||||||
| Less: Gain on value of equity investment | (34) | — | ||||||||||||||||||||||||||||||||||||||||||||||||||||||
| Less: Gain related to the settlement of an acquisition-related indemnification claim | (7) | — | ||||||||||||||||||||||||||||||||||||||||||||||||||||||
| Less: Net income from unconsolidated investees | (42) | (84) | ||||||||||||||||||||||||||||||||||||||||||||||||||||||
| Add/(Less): Income tax effect for the above items | 204 | (62) | ||||||||||||||||||||||||||||||||||||||||||||||||||||||
| Add: Deferred tax adjustments on acquisition-related intangibles | 196 | 33 | ||||||||||||||||||||||||||||||||||||||||||||||||||||||
| Adjusted net income attributable to ICE common stockholders | $ | 2,150 | $ | 1,800 | ||||||||||||||||||||||||||||||||||||||||||||||||||||
| Basic earnings per share attributable to ICE common stockholders | $ | 4.50 | $ | 2.85 | ||||||||||||||||||||||||||||||||||||||||||||||||||||
| Diluted earnings per share attributable to ICE common stockholders | $ | 4.48 | $ | 2.83 | ||||||||||||||||||||||||||||||||||||||||||||||||||||
| Adjusted basic earnings per share attributable to ICE common stockholders | $ | 3.82 | $ | 3.28 | ||||||||||||||||||||||||||||||||||||||||||||||||||||
| Adjusted diluted earnings per share attributable to ICE common stockholders | $ | 3.80 | $ | 3.26 | ||||||||||||||||||||||||||||||||||||||||||||||||||||
| Basic weighted average common shares outstanding | 563 | 549 | ||||||||||||||||||||||||||||||||||||||||||||||||||||||
| Diluted weighted average common shares outstanding | 565 | 552 |
| Exchanges Segment | Fixed Income and Data Services Segment | Mortgage Technology Segment | Consolidated | |||||||||||||||||||||||||||||||||||||||||||||||||||||
| Three Months Ended September 30, | ||||||||||||||||||||||||||||||||||||||||||||||||||||||||
| 2021 | 2020 | 2021 | 2020 | 2021 | 2020 | 2021 | 2020 | |||||||||||||||||||||||||||||||||||||||||||||||||
| Total revenues, less transaction-based expenses | $ | 959 | $ | 818 | $ | 477 | $ | 450 | $ | 366 | $ | 143 | $ | 1,802 | $ | 1,411 | ||||||||||||||||||||||||||||||||||||||||
| Operating expenses | 330 | 297 | 338 | 331 | 256 | 156 | 924 | 784 | ||||||||||||||||||||||||||||||||||||||||||||||||
| Less: Amortization of acquisition-related intangibles | 19 | 18 | 45 | 48 | 92 | 28 | 156 | 94 | ||||||||||||||||||||||||||||||||||||||||||||||||
| Less: Transaction and integration costs | 2 | — | — | — | 11 | 76 | 13 | 76 | ||||||||||||||||||||||||||||||||||||||||||||||||
| Less: Accrual relating to regulatory settlement | — | — | — | 3 | — | — | — | 3 | ||||||||||||||||||||||||||||||||||||||||||||||||
| Adjusted operating expenses | $ | 309 | $ | 279 | $ | 293 | $ | 280 | $ | 153 | $ | 52 | $ | 755 | $ | 611 | ||||||||||||||||||||||||||||||||||||||||
| Operating income | $ | 629 | $ | 521 | $ | 139 | $ | 119 | $ | 110 | $ | (13) | $ | 878 | $ | 627 | ||||||||||||||||||||||||||||||||||||||||
| Adjusted operating income | $ | 650 | $ | 539 | $ | 184 | $ | 170 | $ | 213 | $ | 91 | $ | 1,047 | $ | 800 | ||||||||||||||||||||||||||||||||||||||||
| Operating margin | 66 | % | 64 | % | 29 | % | 26 | % | 30 | % | (9) | % | 49 | % | 44 | % | ||||||||||||||||||||||||||||||||||||||||
| Adjusted operating margin | 68 | % | 66 | % | 39 | % | 38 | % | 58 | % | 64 | % | 58 | % | 57 | % | ||||||||||||||||||||||||||||||||||||||||
| Net income attributable to ICE common stockholders | $ | 633 | $ | 390 | ||||||||||||||||||||||||||||||||||||||||||||||||||||
| Add: Amortization of acquisition-related intangibles | 156 | 94 | ||||||||||||||||||||||||||||||||||||||||||||||||||||||
| Add: Transaction and integration costs | 13 | 76 | ||||||||||||||||||||||||||||||||||||||||||||||||||||||
| Add: Accrual related to legal settlement | 16 | — | ||||||||||||||||||||||||||||||||||||||||||||||||||||||
| Add: Accrual related to regulatory settlement | — | 3 | ||||||||||||||||||||||||||||||||||||||||||||||||||||||
| Add: Accelerated unamortized costs related to the early payoff of the June 2023 floating rate senior notes | 4 | — | ||||||||||||||||||||||||||||||||||||||||||||||||||||||
| Add: Pre-acquisition interest expense on debt issued for Ellie Mae acquisition | — | 5 | ||||||||||||||||||||||||||||||||||||||||||||||||||||||
| Less: Gain on value of equity investment | (34) | — | ||||||||||||||||||||||||||||||||||||||||||||||||||||||
| Less: Net income from unconsolidated investees | (8) | (49) | ||||||||||||||||||||||||||||||||||||||||||||||||||||||
| Less: Income tax effect for the above items | (44) | (29) | ||||||||||||||||||||||||||||||||||||||||||||||||||||||
| Add/(Less): Deferred tax adjustments on acquisition-related intangibles | (1) | 43 | ||||||||||||||||||||||||||||||||||||||||||||||||||||||
| Adjusted net income attributable to ICE common stockholders | $ | 735 | $ | 533 | ||||||||||||||||||||||||||||||||||||||||||||||||||||
| Basic earnings per share attributable to ICE common stockholders | $ | 1.12 | $ | 0.71 | ||||||||||||||||||||||||||||||||||||||||||||||||||||
| Diluted earnings per share attributable to ICE common stockholders | $ | 1.12 | $ | 0.71 | ||||||||||||||||||||||||||||||||||||||||||||||||||||
| Adjusted basic earnings per share attributable to ICE common stockholders | $ | 1.31 | $ | 0.97 | ||||||||||||||||||||||||||||||||||||||||||||||||||||
| Adjusted diluted earnings per share attributable to ICE common stockholders | $ | 1.30 | $ | 0.97 | ||||||||||||||||||||||||||||||||||||||||||||||||||||
| Basic weighted average common shares outstanding | 563 | 548 | ||||||||||||||||||||||||||||||||||||||||||||||||||||||
| Diluted weighted average common shares outstanding | 566 | 551 |
Amortization of acquisition-related intangibles are included in non-GAAP adjustments as excluding these non-cash expenses provides greater clarity regarding our financial strength and stability of cash operating results.
Acquisition-related transaction and integration costs are included as part of our core business expenses, except for those that are directly related to the announcement, closing, financing, or termination of a transaction. However, we adjust for the acquisition-related transaction and integration costs for acquisitions such as Ellie Mae given the magnitude of the $11.4 billion purchase price of the acquisition. We also adjust for the acquisition-related transaction costs related to the merger between Bakkt and VIH due to the significance of the transaction. During the nine months ended September 30, 2020, we included a $10 million adjustment for Bridge2 Solutions acquisition costs resulting from a Bakkt incentive award market condition estimation adjustment as an acquisition-related success fee. This adjustment was directly related to the March 2020 capital call to fund the acquisition of Bridge2 Solutions and we believe is therefore appropriate since we exclude costs directly related to financing a transaction.
The acceleration of unamortized costs related to the early payoff of the June 2023 floating rate senior notes is included as a non-GAAP adjustment during the three months ended September 30, 2021 as it relates to the September 2021 early redemption of our June 2023 floating rate senior notes. The extinguishment payment on the December 2020 Senior Notes is included as a non-GAAP adjustment during the nine months ended September 30, 2020 as it relates to the June 2020 early redemption of the December 2020 Senior Notes, which had an original maturity of December 1, 2020, as a result of our new senior notes offering in May 2020. Those costs included both a make-whole redemption payment and duplicative interest. We also adjust for pre-acquisition interest expense on the August 2020 debt issued to fund a portion of the purchase price of our Ellie Mae acquisition. We do not consider any of these adjustments to be reflective of our normal operations.
We also include accruals relating to legal and regulatory settlements as non-GAAP adjustments, and during the nine months ended September 30, 2021, we adjust for a gain related to the settlement of an acquisition-related indemnification claim from a prior acquisition. We do not consider any of these events to be reflective of our core business operations.
During the nine months ended September 30, 2020, we included an additional consolidated audit trail, or CAT, promissory note impairment charge on work performed by a subsequent plan processor. Consistent with past practice, this is included as a non-GAAP adjustment as this is not considered a part of our core business operations.
During the nine months ended September 30, 2021, we exclude the gain on the sale of our Coinbase investment, and during the nine and three months ended September 30, 2021 we also exclude the fair value adjustment gain on our Euroclear equity investment. Such transactions are not considered a part of our core business operations.
Effective during the nine months ended September 30, 2021, we exclude net income from our unconsolidated equity method investees for purposes of calculating non-GAAP measures, and have retroactively restated the prior year periods for comparability purposes. As of September 30, 2021, this adjustment includes our share of net income from OCC and BondLink, and as of September 30, 2020, it included only OCC. Similar to the treatment of our investment in OCC, following the merger between Bakkt and VIH, we will exclude our equity method investment in Bakkt. This is consistent with how we treat changes in the fair value of our equity investments. We believe these adjustments provide greater clarity of our performance given that equity investments are non-cash and not a part of our core operations.
The income tax effects relating to all non-GAAP adjustments above are included as non-GAAP adjustments. We also include non-GAAP adjustments for deferred tax adjustments on acquisition-related intangibles. The deferred tax adjustment of $196 million for the nine months ended September 30, 2021 relates primarily to current year U.K. corporate income tax rate increase from 19% to 25% effective April 1, 2023. The deferred tax adjustments of $33 million and $43 million for the nine and three months ending September 30, 2020, respectively, were due to the prior year U.K. corporate income tax rate increase from 17% to 19% effective April 1, 2020 and to U.S. state apportionment changes.
For additional information on these items, refer to our consolidated financial statements included in this Quarterly Report and “—Consolidated Operating Expenses”, above.
Contractual Obligations and Commercial Commitments
During the nine months ended September 30, 2021, there were no significant changes to our contractual obligations and commercial commitments from those disclosed in the section “Management’s Discussion and Analysis of Financial Condition and Results of Operations” in our 2020 Form 10-K.
Off-Balance Sheet Arrangements
As described in Note 13 to our consolidated financial statements, which are included elsewhere in this Quarterly Report, certain clearing house collateral is reported off-balance sheet. In addition, and as described in Note 3 of our 2020 Form 10-K, Bakkt custodial assets are reported off-balance sheet. We do not have any relationships with unconsolidated entities or financial partnerships, often referred to as structured finance or special purpose entities.
New and Recently Adopted Accounting Pronouncements
During the nine months ended September 30, 2021, there were no significant changes to the new and recently adopted accounting pronouncements applicable to us from those disclosed in Note 2 of our 2020 Form 10-K.
Critical Accounting Policies
During the nine months ended September 30, 2021, there were no significant changes to our critical accounting policies and estimates from those disclosed in the section “Management’s Discussion and Analysis of Financial Condition and Results of Operations” in our 2020 Form 10-K.
Previous: Item 1. Consolidated Financial Statements (Unaudited) · Next: Item 3. QUANTITATIVE AND QUALITATIVE DISCLOSURES ABOUT MARKET RISK