 filings.tools
Item 1. Consolidated Financial Statements
122K characters. Original on sec.gov · Markdown
Item 1. Consolidated Financial Statements
Intercontinental Exchange, Inc. and Subsidiaries
Consolidated Balance Sheets
(In millions, except per share amounts)
| As of | As of December 31, 2022 | ||||||||||
| March 31, 2023 | |||||||||||
| (Unaudited) | |||||||||||
| Assets: | |||||||||||
| Current assets: | |||||||||||
| Cash and cash equivalents | $ | 2,069 | $ | 1,799 | |||||||
| Short-term restricted cash and cash equivalents | 6,145 | 6,149 | |||||||||
| Cash and cash equivalent margin deposits and guaranty funds | 102,072 | 141,990 | |||||||||
| Invested deposits, delivery contracts receivable and unsettled variation margin | 1,897 | 5,382 | |||||||||
| Customer accounts receivable, net of allowance for doubtful accounts of $21 and $22 at March 31, 2023 and December 31, 2022, respectively | 1,650 | 1,169 | |||||||||
| Prepaid expenses and other current assets | 503 | 458 | |||||||||
| Total current assets | 114,336 | 156,947 | |||||||||
| Property and equipment, net | 1,727 | 1,767 | |||||||||
| Other non-current assets: | |||||||||||
| Goodwill | 21,120 | 21,111 | |||||||||
| Other intangible assets, net | 12,946 | 13,090 | |||||||||
| Long-term restricted cash and cash equivalents | 405 | 405 | |||||||||
| Other non-current assets | 1,016 | 1,018 | |||||||||
| Total other non-current assets | 35,487 | 35,624 | |||||||||
| Total assets | $ | 151,550 | $ | 194,338 | |||||||
| Liabilities and Equity: | |||||||||||
| Current liabilities: | |||||||||||
| Accounts payable and accrued liabilities | $ | 949 | $ | 866 | |||||||
| Section 31 fees payable | 118 | 223 | |||||||||
| Accrued salaries and benefits | 146 | 352 | |||||||||
| Deferred revenue | 562 | 170 | |||||||||
| Short-term debt | — | 4 | |||||||||
| Margin deposits and guaranty funds | 102,072 | 141,990 | |||||||||
| Invested deposits, delivery contracts payable and unsettled variation margin | 1,897 | 5,382 | |||||||||
| Other current liabilities | 262 | 184 | |||||||||
| Total current liabilities | 106,006 | 149,171 | |||||||||
| Non-current liabilities: | |||||||||||
| Non-current deferred tax liability, net | 3,409 | 3,493 | |||||||||
| Long-term debt | 18,123 | 18,118 | |||||||||
| Accrued employee benefits | 157 | 160 | |||||||||
| Non-current operating lease liability | 233 | 254 | |||||||||
| Other non-current liabilities | 411 | 381 | |||||||||
| Total non-current liabilities | 22,333 | 22,406 | |||||||||
| Total liabilities | 128,339 | 171,577 | |||||||||
| Commitments and contingencies | |||||||||||
| Equity: | |||||||||||
| Intercontinental Exchange, Inc. stockholders’ equity: | |||||||||||
| Preferred stock, $0.01 par value; 100 shares authorized; none issued or outstanding | — | — | |||||||||
| Common stock, $0.01 par value; 1,500 shares authorized; 635 and 634 issued at March 31, 2023 and December 31, 2022, respectively, and 559 shares outstanding for both March 31, 2023 and December 31, 2022 | 6 | 6 | |||||||||
| Treasury stock, at cost; 76 and 75 shares at March 31, 2023 and December 31, 2022, respectively | (6,274) | (6,225) | |||||||||
| Additional paid-in capital | 14,388 | 14,313 | |||||||||
| Retained earnings | 15,362 | 14,943 | |||||||||
| Accumulated other comprehensive loss | (315) | (331) | |||||||||
| Total Intercontinental Exchange, Inc. stockholders’ equity | 23,167 | 22,706 | |||||||||
| Non-controlling interest in consolidated subsidiaries | 44 | 55 | |||||||||
| Total equity | 23,211 | 22,761 | |||||||||
| Total liabilities and equity | $ | 151,550 | $ | 194,338 |
See accompanying notes.
Intercontinental Exchange, Inc. and Subsidiaries
Consolidated Statements of Income
(In millions, except per share amounts)
(Unaudited)
| Three Months Ended March 31, | |||||||||||||||||||||||||||||||||||
| 2023 | 2022 | ||||||||||||||||||||||||||||||||||
| Revenues: | |||||||||||||||||||||||||||||||||||
| Exchanges | $ | 1,673 | $ | 1,643 | |||||||||||||||||||||||||||||||
| Fixed income and data services | 563 | 509 | |||||||||||||||||||||||||||||||||
| Mortgage technology | 236 | 307 | |||||||||||||||||||||||||||||||||
| Total revenues | 2,472 | 2,459 | |||||||||||||||||||||||||||||||||
| Transaction-based expenses: | |||||||||||||||||||||||||||||||||||
| Section 31 fees | 119 | 51 | |||||||||||||||||||||||||||||||||
| Cash liquidity payments, routing and clearing | 457 | 509 | |||||||||||||||||||||||||||||||||
| Total revenues, less transaction-based expenses | 1,896 | 1,899 | |||||||||||||||||||||||||||||||||
| Operating expenses: | |||||||||||||||||||||||||||||||||||
| Compensation and benefits | 352 | 359 | |||||||||||||||||||||||||||||||||
| Professional services | 28 | 34 | |||||||||||||||||||||||||||||||||
| Acquisition-related transaction and integration costs | 21 | 9 | |||||||||||||||||||||||||||||||||
| Technology and communication | 172 | 175 | |||||||||||||||||||||||||||||||||
| Rent and occupancy | 20 | 21 | |||||||||||||||||||||||||||||||||
| Selling, general and administrative | 74 | 55 | |||||||||||||||||||||||||||||||||
| Depreciation and amortization | 260 | 254 | |||||||||||||||||||||||||||||||||
| Total operating expenses | 927 | 907 | |||||||||||||||||||||||||||||||||
| Operating income | 969 | 992 | |||||||||||||||||||||||||||||||||
| Other income/(expense): | |||||||||||||||||||||||||||||||||||
| Interest income | 91 | 1 | |||||||||||||||||||||||||||||||||
| Interest expense | (176) | (103) | |||||||||||||||||||||||||||||||||
| Other expense, net | (35) | (58) | |||||||||||||||||||||||||||||||||
| Total other income/(expense), net | (120) | (160) | |||||||||||||||||||||||||||||||||
| Income before income tax expense | 849 | 832 | |||||||||||||||||||||||||||||||||
| Income tax expense | 175 | 165 | |||||||||||||||||||||||||||||||||
| Net income | $ | 674 | $ | 667 | |||||||||||||||||||||||||||||||
| Net income attributable to non-controlling interest | (19) | (10) | |||||||||||||||||||||||||||||||||
| Net income attributable to Intercontinental Exchange, Inc. | $ | 655 | $ | 657 | |||||||||||||||||||||||||||||||
| Earnings per share attributable to Intercontinental Exchange, Inc. common stockholders: | |||||||||||||||||||||||||||||||||||
| Basic | $ | 1.17 | $ | 1.17 | |||||||||||||||||||||||||||||||
| Diluted | $ | 1.17 | $ | 1.16 | |||||||||||||||||||||||||||||||
| Weighted average common shares outstanding: | |||||||||||||||||||||||||||||||||||
| Basic | 559 | 561 | |||||||||||||||||||||||||||||||||
| Diluted | 561 | 564 |
See accompanying notes.
Intercontinental Exchange, Inc. and Subsidiaries
Consolidated Statements of Comprehensive Income
(In millions)
(Unaudited)
| Three Months Ended March 31, | |||||||||||||||||||||||||||||||||||
| 2023 | 2022 | ||||||||||||||||||||||||||||||||||
| Net income | $ | 674 | $ | 667 | |||||||||||||||||||||||||||||||
| Other comprehensive income/(loss): | |||||||||||||||||||||||||||||||||||
| Foreign currency translation adjustments | 16 | (25) | |||||||||||||||||||||||||||||||||
| Other comprehensive income/(loss) | 16 | (25) | |||||||||||||||||||||||||||||||||
| Comprehensive income | $ | 690 | $ | 642 | |||||||||||||||||||||||||||||||
| Comprehensive income attributable to non-controlling interest | (19) | (10) | |||||||||||||||||||||||||||||||||
| Comprehensive income attributable to Intercontinental Exchange, Inc. | $ | 671 | $ | 632 |
See accompanying notes.
Intercontinental Exchange, Inc. and Subsidiaries
Consolidated Statements of Changes in Equity and Redeemable Non-Controlling Interest
(In millions)
(Unaudited)
| Intercontinental Exchange, Inc. Stockholders’ Equity | Non- Controlling Interest in Consolidated Subsidiaries | Total Equity | |||||||||||||||||||||||||||||||||||||||||||||||||||||||||
| Common Stock | Treasury Stock | Additional Paid-in Capital | Retained Earnings | Accumulated Other Comprehensive Income/(Loss) | |||||||||||||||||||||||||||||||||||||||||||||||||||||||
| Shares | Value | Shares | Value | ||||||||||||||||||||||||||||||||||||||||||||||||||||||||
| Balance, as of December 31, 2022 | 634 | $ | 6 | (75) | $ | (6,225) | $ | 14,313 | $ | 14,943 | $ | (331) | $ | 55 | $ | 22,761 | |||||||||||||||||||||||||||||||||||||||||||
| Other comprehensive income | — | — | — | — | — | — | 16 | — | 16 | ||||||||||||||||||||||||||||||||||||||||||||||||||
| Exercise of common stock options | — | — | — | — | 10 | — | — | — | 10 | ||||||||||||||||||||||||||||||||||||||||||||||||||
| Payments relating to treasury shares | — | — | (1) | (49) | — | — | — | — | (49) | ||||||||||||||||||||||||||||||||||||||||||||||||||
| Stock-based compensation | — | — | — | — | 47 | — | — | — | 47 | ||||||||||||||||||||||||||||||||||||||||||||||||||
| Issuance under the employee stock purchase plan | — | — | — | — | 18 | — | — | — | 18 | ||||||||||||||||||||||||||||||||||||||||||||||||||
| Issuance of restricted stock | 1 | — | — | — | — | — | — | — | — | ||||||||||||||||||||||||||||||||||||||||||||||||||
| Distributions of profits | — | — | — | — | — | — | — | (30) | (30) | ||||||||||||||||||||||||||||||||||||||||||||||||||
| Dividends paid to stockholders | — | — | — | — | — | (236) | — | — | (236) | ||||||||||||||||||||||||||||||||||||||||||||||||||
| Net income/(loss) attributable to non-controlling interest | — | — | — | — | — | (19) | — | 19 | — | ||||||||||||||||||||||||||||||||||||||||||||||||||
| Net income | — | — | — | — | — | 674 | — | — | 674 | ||||||||||||||||||||||||||||||||||||||||||||||||||
| Balance, as of March 31, 2023 | 635 | $ | 6 | (76) | $ | (6,274) | $ | 14,388 | $ | 15,362 | $ | (315) | $ | 44 | $ | 23,211 |
| Intercontinental Exchange, Inc. Stockholders’ Equity | Non- Controlling Interest in Consolidated Subsidiaries | Total Equity | |||||||||||||||||||||||||||||||||||||||||||||||||||
| Common Stock | Treasury Stock | Additional Paid-in Capital | Retained Earnings | Accumulated Other Comprehensive Income/(Loss) | |||||||||||||||||||||||||||||||||||||||||||||||||
| Shares | Value | Shares | Value | ||||||||||||||||||||||||||||||||||||||||||||||||||
| Balance, as of December 31, 2021 | 631 | $ | 6 | (70) | $ | (5,520) | $ | 14,069 | $ | 14,350 | $ | (196) | $ | 39 | $ | 22,748 | |||||||||||||||||||||||||||||||||||||
| Other comprehensive loss | — | — | — | — | — | — | (25) | — | (25) | ||||||||||||||||||||||||||||||||||||||||||||
| Exercise of common stock options | — | — | — | — | 15 | — | — | — | 15 | ||||||||||||||||||||||||||||||||||||||||||||
| Repurchases of common stock | — | — | (3) | (475) | — | — | — | — | (475) | ||||||||||||||||||||||||||||||||||||||||||||
| Payments relating to treasury shares | — | — | (1) | (69) | — | — | — | — | (69) | ||||||||||||||||||||||||||||||||||||||||||||
| Stock-based compensation | — | — | — | — | 45 | — | — | — | 45 | ||||||||||||||||||||||||||||||||||||||||||||
| Issuance under the employee stock purchase plan | — | — | — | — | 24 | — | — | — | 24 | ||||||||||||||||||||||||||||||||||||||||||||
| Issuance of restricted stock | 2 | — | — | — | — | — | — | — | — | ||||||||||||||||||||||||||||||||||||||||||||
| Distributions of profits | — | — | — | — | — | — | — | (13) | (13) | ||||||||||||||||||||||||||||||||||||||||||||
| Dividends paid to stockholders | — | — | — | — | — | (214) | — | — | (214) | ||||||||||||||||||||||||||||||||||||||||||||
| Net income/(loss) attributable to non-controlling interest | — | — | — | — | — | (10) | — | 10 | — | ||||||||||||||||||||||||||||||||||||||||||||
| Net income | — | — | — | — | — | 667 | — | — | 667 | ||||||||||||||||||||||||||||||||||||||||||||
| Balance, as of March 31, 2022 | 633 | $ | 6 | (74) | $ | (6,064) | $ | 14,153 | $ | 14,793 | $ | (221) | $ | 36 | $ | 22,703 |
See accompanying notes.
Intercontinental Exchange, Inc. and Subsidiaries
Consolidated Statements of Cash Flows
(In millions)
(Unaudited)
| Three Months Ended March 31, | ||||||||||||||
| 2023 | 2022 | |||||||||||||
| Operating activities: | ||||||||||||||
| Net income | $ | 674 | $ | 667 | ||||||||||
| Adjustments to reconcile net income to net cash provided by operating activities: | ||||||||||||||
| Depreciation and amortization | 260 | 254 | ||||||||||||
| Stock-based compensation | 40 | 38 | ||||||||||||
| Deferred taxes | (83) | (86) | ||||||||||||
| Net losses from unconsolidated investees | 35 | 42 | ||||||||||||
| Other | 10 | 9 | ||||||||||||
| Changes in assets and liabilities: | ||||||||||||||
| Customer accounts receivable | (484) | (480) | ||||||||||||
| Other current and non-current assets | (88) | (56) | ||||||||||||
| Section 31 fees payable | (105) | (7) | ||||||||||||
| Deferred revenue | 406 | 411 | ||||||||||||
| Other current and non-current liabilities | (12) | (36) | ||||||||||||
| Total adjustments | (21) | 89 | ||||||||||||
| Net cash provided by operating activities | 653 | 756 | ||||||||||||
| Investing activities: | ||||||||||||||
| Capital expenditures | (21) | (36) | ||||||||||||
| Capitalized software development costs | (64) | (67) | ||||||||||||
| Purchases of invested margin deposits | (463) | (651) | ||||||||||||
| Proceeds from sales of invested margin deposits | 2,605 | 1,709 | ||||||||||||
| Other | (12) | (73) | ||||||||||||
| Net cash provided by investing activities | 2,045 | 882 | ||||||||||||
| Financing activities: | ||||||||||||||
| Repayments of debt | (4) | — | ||||||||||||
| Proceeds from commercial paper, net | — | 256 | ||||||||||||
| Repurchases of common stock | — | (475) | ||||||||||||
| Dividends to stockholders | (236) | (214) | ||||||||||||
| Change in cash and cash equivalent margin deposits and guaranty funds | (42,059) | 14,153 | ||||||||||||
| Payments relating to treasury shares received for restricted stock tax payments and stock option exercises | (49) | (69) | ||||||||||||
| Other | (3) | 27 | ||||||||||||
| Net cash provided by/(used in) financing activities | (42,351) | 13,678 | ||||||||||||
| Effect of exchange rate changes on cash, cash equivalents, restricted cash and cash equivalents, and cash and cash equivalent margin deposits and guaranty funds | 1 | (1) | ||||||||||||
| Net increase/(decrease) in cash, cash equivalents, restricted cash and cash equivalents, and cash and cash equivalent margin deposits and guaranty funds | (39,652) | 15,315 | ||||||||||||
| Cash, cash equivalents, restricted cash and cash equivalents, and cash and cash equivalent margin deposits and guaranty funds at beginning of period | 150,343 | 147,976 | ||||||||||||
| Cash, cash equivalents, restricted cash and cash equivalents, and cash and cash equivalent margin deposits and guaranty funds at end of period | $ | 110,691 | $ | 163,291 | ||||||||||
Intercontinental Exchange, Inc. and Subsidiaries
Consolidated Statements of Cash Flows (Continued)
(In millions)
(Unaudited)
| As of March 31, 2023 | As of March 31, 2022 | ||||||||||||||||
| Supplemental cash flow disclosure: | |||||||||||||||||
| Cash paid for income taxes | $ | 149 | $ | 90 | |||||||||||||
| Cash paid for interest | $ | 167 | $ | 117 | |||||||||||||
| Reconciliation of the components of cash, cash equivalents, restricted cash and cash equivalents, and cash and cash equivalent margin deposits and guaranty funds to the balance sheet: | |||||||||||||||||
| Cash and cash equivalents | $ | 2,069 | $ | 638 | |||||||||||||
| Short-term restricted cash and cash equivalents | 6,145 | 1,101 | |||||||||||||||
| Long-term restricted cash and cash equivalents | 405 | 405 | |||||||||||||||
| Cash and cash equivalent margin deposits and guaranty funds | 102,072 | 161,147 | |||||||||||||||
| Total | $ | 110,691 | $ | 163,291 |
See accompanying notes.
Intercontinental Exchange, Inc. and Subsidiaries
Notes to Consolidated Financial Statements
(Unaudited)
**1.**Description of Business
Nature of Business and Organization
Intercontinental Exchange, Inc. is a provider of market infrastructure, data services and technology solutions to a broad range of customers including financial institutions, corporations and government entities. These products, which span major asset classes including futures, equities, fixed income and United States, or U.S., residential mortgages provide our customers with access to mission critical tools that are designed to increase asset class transparency and workflow efficiency. Our business is conducted through three reportable business segments:
-
Exchanges:** We operate regulated marketplaces for the listing, trading and clearing of a broad array of derivatives contracts and financial securities.
-
Fixed Income and Data Services:** We provide fixed income pricing, reference data, indices, analytics and execution services as well as global credit default swap, or CDS, clearing and multi-asset class data delivery solutions.
-
Mortgage Technology:** We provide a technology platform that offers customers comprehensive, digital workflow tools that aim to address the inefficiencies that exist in the U.S. residential mortgage market, from application through closing and the secondary market.
We operate marketplaces, technology and provide data services in the U.S., United Kingdom, or U.K., European Union, or EU, Canada, Asia Pacific and the Middle East.
2. Summary of Significant Accounting Policies
Basis of Presentation
The accompanying unaudited consolidated financial statements have been prepared in accordance with U.S. generally accepted accounting principles, or U.S. GAAP, pursuant to the rules and regulations of the Securities and Exchange Commission, or SEC, regarding interim financial reporting. Accordingly, the unaudited consolidated financial statements do not include all of the information and footnotes required by U.S. GAAP for complete financial statements and should be read in conjunction with our audited consolidated financial statements and related notes thereto for the year ended December 31, 2022. The accompanying unaudited consolidated financial statements reflect all adjustments that are, in our opinion, necessary for a fair presentation of results for the interim periods presented. We believe that these adjustments are of a normal recurring nature.
Preparing financial statements in conformity with U.S. GAAP requires us to make certain estimates and assumptions that affect the amounts that are reported in our consolidated financial statements and accompanying disclosures. Actual amounts could differ from those estimates. The results of operations for the three months ended March 31, 2023 are not necessarily indicative of the results to be expected for any future period or the full fiscal year.
These statements include the accounts of our wholly-owned and controlled subsidiaries. All intercompany balances and transactions between us and our wholly-owned and controlled subsidiaries have been eliminated in consolidation. For consolidated subsidiaries in which our ownership is less than 100% and for which we have control over the assets and liabilities and the management of the entity, the outside stockholders’ interests are shown as non-controlling interests.
We have considered the impacts of macroeconomic conditions, including recent banking sector events and the uncertainty surrounding the U.S. debt ceiling, as well as the ongoing conflict between Russia, Belarus and Ukraine on our financial statements. As of March 31, 2023, our businesses and operations, including our exchanges, clearing houses, listings venues, data services businesses and mortgage platforms, have not suffered a material negative impact as a result of these events. There continues to be uncertainty surrounding the extent and duration of this ongoing conflict and the impact that it may have on the global economy and on our business.
Recently Adopted Accounting Pronouncements
During the three months ended March 31, 2023, there were no significant changes to the new and recently adopted accounting pronouncements applicable to us from those disclosed in Note 2 to the consolidated financial statements in Part II, Item 8 of our Annual Report on Form 10-K for the year ended December 31, 2022, or the 2022 Form 10-K.
3. Pending Acquisition
Pending Acquisition of Black Knight, Inc.
On May 4, 2022, we announced that we had entered into a definitive agreement to acquire Black Knight, Inc., or Black Knight, a software, data and analytics company that serves the housing finance continuum, including real estate data, mortgage lending and servicing, as well as the secondary markets. Pursuant to that certain Agreement and Plan of Merger, dated as of May 4, 2022, among ICE, Sand Merger Sub Corporation, a wholly owned subsidiary of ICE, or Sub, and Black Knight, which we refer to as the “merger agreement,” Sub will merge with and into Black Knight, which we refer to as the “merger,” with Black Knight surviving as a wholly owned subsidiary of ICE.
On March 7, 2023, ICE and Black Knight announced that, in connection with the merger agreement, Black Knight has entered into an agreement to sell its loan origination business. On March 7, 2023, ICE and Black Knight also entered into an amendment to the merger agreement to reduce the value of the aggregate transaction consideration to approximately $11.7 billion as of March 7, 2023, or $75 per share of Black Knight common stock, with cash comprising 90% of the value of the aggregate transaction consideration and shares of our common stock comprising 10% of the value of the aggregate transaction consideration. The aggregate cash component of the transaction consideration is fixed at $10.5 billion, and the value of the aggregate stock component of the transaction consideration will fluctuate with the market price of our common stock and will be determined based on the average of the volume weighted averages of the trading prices of our common stock on each of the ten consecutive trading days ending three trading days prior to the closing of the merger. If consummated, we expect that this transaction will build on our position as a provider of end-to-end electronic workflow solutions for the rapidly evolving U.S. residential mortgage industry. We believe the Black Knight ecosystem adds value for clients of all sizes across the mortgage and real estate lifecycles by helping organizations lower costs, increase efficiencies, grow their businesses, and reduce risk.
On March 30, 2023, our amended proxy statement/prospectus on Form S-4 was declared effective by the SEC, and on April 28, 2023, Black Knight stockholders approved the amendment to the merger agreement. The transaction is expected to close in the second half of 2023 following the receipt of regulatory approvals, a favorable resolution of the FTC litigation concerning this transaction, and the satisfaction of customary closing conditions. See Note 13 where additional details of this transaction are discussed.
4. Investments
Equity Investments Subject to ASU 2016-01
Our equity investments are subject to valuation under Accounting Standards Update, or ASU, 2016-01, Financial Instruments- Overall (Subtopic 825-10): Recognition and Measurement of Financial Assets and Financial Liabilities, or ASU 2016-01. See Note 14 for a discussion of our determination of fair value of our financial instruments, which were not material as of March 31, 2023.
Equity Method Investments
Our equity method investments include the Options Clearing Corporation, or OCC, and Bakkt Holdings, LLC, or Bakkt, among others. Our equity method investments are included in other non-current assets in the accompanying consolidated balance sheet. We initially record our equity method investments at cost. At the end of each reporting period, we record our share of profits or losses of our equity method investments as equity earnings included in other income, and adjust the carrying value of our equity method investment accordingly. In addition, if and when our equity method investments issue cash dividends to us, we deduct the amount of these dividends from the carrying amount of that investment. We assess the carrying value periodically if impairment indicators are present.
We recognized $35 million and $42 million as our share of estimated losses, net, from our equity method investments during the three months ended March 31, 2023 and 2022, respectively. The estimated losses during both the three months ended March 31, 2023 and March 31, 2022 are primarily related to our investment in Bakkt, partially offset by our share of OCC profits. Both periods include adjustments to reflect the difference between reported prior period actual results from our original estimates.
When performing our assessment of the carrying value of our investments, we consider, among other things, the length of time and the extent to which the market value has been less than our cost basis, if applicable, the investee's financial condition and near-term prospects, the economic or technological environment in which our investees operate, weakening of the general market condition of the related industry, whether an investee can continue as a going concern, any
impairment charges recorded by an investee on goodwill, intangible or long-lived assets, and our intent and ability to retain the investment for a period of time sufficient to allow for any anticipated recovery in market value.
Investment in OCC
We own a 40% interest in OCC through a direct investment by the New York Stock Exchange, or NYSE. OCC is regulated by the SEC as a registered clearing agency and by the Commodity Futures Trading Commission, or CFTC, as a derivatives clearing organization. OCC serves as a clearing house for securities options, security futures, commodity futures and options on futures traded on various independent exchanges. OCC clears securities options traded on NYSE Arca and NYSE Amex Options, along with other non-affiliated exchanges.
Investment in Bakkt
As of March 31, 2023, we held an approximate 66% economic interest in Bakkt. As a result of limitations on ICE from the Bakkt voting agreement entered into in connection with Bakkt's merger with VIH, we hold a minority voting interest in Bakkt and treat it as an equity method investment.
5. Revenue Recognition
Substantially all of our revenues are considered to be revenues from contracts with customers. The related accounts receivable balances are recorded in our balance sheets as customer accounts receivable. We do not have obligations for warranties, returns or refunds to customers, other than rebates, which are settled each period and therefore do not result in variable consideration. We do not have significant revenue recognized from performance obligations that were satisfied in prior periods, and we do not have any transaction price allocated to unsatisfied performance obligations other than in our deferred revenue. Certain judgments and estimates are used in the identification and timing of satisfaction of performance obligations and the related allocation of transaction price. We believe that these represent a faithful depiction of the transfer of services to our customers.
Deferred revenue represents our contract liabilities related to our annual, original and other listings revenues, certain data services, clearing services, mortgage technology services and other revenues. Deferred revenue is our only significant contract liability. See Note 7 for our discussion of deferred revenue balances, activity, and expected timing of recognition.
For all of our contracts with customers, except for listings and certain data, clearing and mortgage services, our performance obligations are short term in nature and there is no significant variable consideration. In addition, we have elected the practical expedient of excluding sales taxes from transaction prices. We have assessed the costs incurred to obtain or fulfill a contract with a customer, which are primarily our sales commissions.
Refer to Note 5 to the consolidated financial statements included in Part II, Item 8 of our 2022 Form 10-K where our primary revenue contract classifications are described in detail.
The following table depicts the disaggregation of our revenue according to business line and segment (in millions). Amounts here have been aggregated as they follow consistent revenue recognition patterns, and are consistent with the segment information in Note 15:
| Exchanges Segment | Fixed Income and Data Services Segment | Mortgage Technology Segment | Total Consolidated | ||||||||||||||||||||
| Three Months Ended March 31, 2023: | |||||||||||||||||||||||
| Total revenues | $ | 1,673 | $ | 563 | $ | 236 | $ | 2,472 | |||||||||||||||
| Transaction-based expenses | 576 | — | — | 576 | |||||||||||||||||||
| Total revenues, less transaction-based expenses | $ | 1,097 | $ | 563 | $ | 236 | $ | 1,896 | |||||||||||||||
| Timing of Revenue Recognition | |||||||||||||||||||||||
| Services transferred at a point in time | $ | 635 | $ | 123 | $ | 67 | $ | 825 | |||||||||||||||
| Services transferred over time | 462 | 440 | 169 | 1,071 | |||||||||||||||||||
| Total revenues, less transaction-based expenses | $ | 1,097 | $ | 563 | $ | 236 | $ | 1,896 |
| Exchanges Segment | Fixed Income and Data Services Segment | Mortgage Technology Segment | Total Consolidated | ||||||||||||||||||||
| Three Months Ended March 31, 2022: | |||||||||||||||||||||||
| Total revenues | $ | 1,643 | $ | 509 | $ | 307 | $ | 2,459 | |||||||||||||||
| Transaction-based expenses | 560 | — | — | 560 | |||||||||||||||||||
| Total revenues, less transaction-based expenses | $ | 1,083 | $ | 509 | $ | 307 | $ | 1,899 | |||||||||||||||
| Timing of Revenue Recognition | |||||||||||||||||||||||
| Services transferred at a point in time | $ | 634 | $ | 76 | $ | 142 | $ | 852 | |||||||||||||||
| Services transferred over time | 449 | 433 | 165 | 1,047 | |||||||||||||||||||
| Total revenues, less transaction-based expenses | $ | 1,083 | $ | 509 | $ | 307 | $ | 1,899 |
The Exchanges segment and the Fixed Income and Data Services segment revenues above include data services revenues. Our data services revenues are transferred over time, and a majority of those revenues are performed over a short period of time of one month or less and relate to subscription-based data services billed monthly, quarterly or annually in advance. These revenues are recognized ratably over time as our data delivery performance obligations are met consistently throughout the period.
The Exchanges segment revenues transferred over time in the table above also include services related to listings, services related to risk management of open interest performance obligations and services related to regulatory fees, trading permits, and software licenses.
The Fixed Income and Data Services segment revenues transferred over time in the table above also include services related to risk management of open interest performance obligations, primarily in our CDS business.
The Mortgage Technology segment revenues transferred over time in the table above primarily relate to our origination technology revenue where performance obligations consist of a series of distinct services and are recognized over the contract terms as subscription performance obligations are satisfied, and to a lesser extent, professional services revenues and revenues from certain of our data and analytics offerings.
The components of services transferred over time for each of our segments are as follows:
| Three Months Ended March 31, | |||||||||||||||||||||||
| 2023 | 2022 | ||||||||||||||||||||||
| Exchanges Segment: | |||||||||||||||||||||||
| Data services revenues | $ | 232 | $ | 214 | |||||||||||||||||||
| Services transferred over time related to risk management of open interest performance obligations | 76 | 76 | |||||||||||||||||||||
| Services transferred over time related to listings | 126 | 129 | |||||||||||||||||||||
| Services transferred over time related to regulatory fees, trading permits, and software licenses | 28 | 30 | |||||||||||||||||||||
| Total | $ | 462 | $ | 449 | |||||||||||||||||||
| Fixed Income Data Services Segment: | |||||||||||||||||||||||
| Data services revenues | $ | 430 | $ | 422 | |||||||||||||||||||
| Services transferred over time related to risk management of open interest performance obligations in our CDS business | 10 | 11 | |||||||||||||||||||||
| Total | $ | 440 | $ | 433 | |||||||||||||||||||
| Mortgage Technology Segment: | |||||||||||||||||||||||
| Subscription revenues | $ | 165 | $ | 156 | |||||||||||||||||||
| Professional service revenues and other | 4 | 9 | |||||||||||||||||||||
| Total | $ | 169 | $ | 165 | |||||||||||||||||||
| Total consolidated revenues transferred over time | $ | 1,071 | $ | 1,047 |
6. Goodwill and Other Intangible Assets
The following is a summary of the activity in our goodwill balance for the three months ended March 31, 2023 (in millions):
| Goodwill balance at December 31, 2022 | $ | 21,111 | |||
| Foreign currency translation | 8 | ||||
| Other activity, net | 1 | ||||
| Goodwill balance at March 31, 2023 | $ | 21,120 |
The following is a summary of the activity in our other intangible assets balance for the three months ended March 31, 2023 (in millions):
| Other intangible assets balance at December 31, 2022 | $ | 13,090 | |||
| Foreign currency translation | 6 | ||||
| Amortization of other intangible assets | (150) | ||||
| Other intangible assets balance at March 31, 2023 | $ | 12,946 |
Foreign currency translation adjustments result from a portion of our goodwill and other intangible assets being held at our U.K., EU and Canadian subsidiaries, whose functional currencies are not the U.S. dollar. The changes in other activity, net, in the table above primarily relate to adjustments to the fair value of the net tangible and intangible assets made within one year of acquisitions, with a corresponding adjustment to goodwill.
During the three months ended March 31, 2023, we considered potential indicators of impairment to goodwill and other intangible assets for each of our reporting units, which included declines in our stock price and recent inflation spikes and rising interest rates, including their effect on our forecasts, among others. As such, we performed this assessment to determine whether it was more-likely-than-not that goodwill and indefinite lived intangibles within each of our reportable business segments were impaired. Additionally, we evaluated whether the carrying value of the finite lived intangible assets within our reportable business segments may not be recoverable. After evaluating events, circumstances and factors which could affect the significant inputs used in our evaluation of cash flows and related fair value, we determined it was not more-likely-than-not that an impairment existed in our goodwill and indefinite lived intangible assets or that the carrying amount of our finite lived intangible assets was not recoverable. We plan to perform our annual impairment testing in the fourth quarter.
7. Deferred Revenue
Our contract liabilities, or deferred revenue, represent consideration received that is yet to be recognized as revenue. Total deferred revenue was $661 million as of March 31, 2023, including $562 million in current deferred revenue and $99 million in other non-current liabilities. The changes in our deferred revenue during the three months ended March 31, 2023 are as follows (in millions):
| Listings Revenues | Data Services and Other Revenues | Mortgage Technology | Total | ||||||||||||||||||||
| Deferred revenue balance at January 1, 2023 | $ | 115 | $ | 88 | $ | 51 | $ | 254 | |||||||||||||||
| Additions | 470 | 159 | 14 | 643 | |||||||||||||||||||
| Amortization | (127) | (89) | (20) | (236) | |||||||||||||||||||
| Deferred revenue balance at March 31, 2023 | $ | 458 | $ | 158 | $ | 45 | $ | 661 |
The changes in our deferred revenue during the three months ended March 31, 2022 are as follows (in millions):
| Listings Revenues | Data Services and Other Revenues | Mortgage Technology | Total | ||||||||||||||||||||
| Deferred revenue balance at January 1, 2022 | $ | 112 | $ | 93 | $ | 79 | $ | 284 | |||||||||||||||
| Additions | 472 | 186 | 26 | 684 | |||||||||||||||||||
| Amortization | (129) | (112) | (32) | (273) | |||||||||||||||||||
| Deferred revenue balance at March 31, 2022 | $ | 455 | $ | 167 | $ | 73 | $ | 695 |
Included in the amortization recognized during the three months ended March 31, 2023 is $67 million related to the deferred revenue balance as of January 1, 2023. Included in the amortization recognized for the three months ended March 31, 2022 is $73 million related to the deferred revenue balance as of January 1, 2022. As of March 31, 2023, the remaining deferred revenue balance will be recognized over the period of time we satisfy our performance obligations as described in Note 5.
8. Debt
Our total debt, including short-term and long-term debt, consisted of the following (in millions):
| As of March 31, 2023 | As of December 31, 2022 | |||||||||||||
| Debt: | ||||||||||||||
| Short-term debt: | ||||||||||||||
| Other short-term debt | $ | — | $ | 4 | ||||||||||
| Total short-term debt | — | 4 | ||||||||||||
| Long-term debt: | ||||||||||||||
| 2025 Senior Notes (3.65% senior unsecured notes due May 23, 2025) | 1,244 | 1,243 | ||||||||||||
| 2025 Senior Notes (3.75% senior unsecured notes due December 1, 2025) | 1,247 | 1,247 | ||||||||||||
| 2027 Senior Notes (4.00% senior unsecured notes due September 15, 2027) | 1,487 | 1,487 | ||||||||||||
| 2027 Senior Notes (3.10% senior unsecured notes due September 15, 2027) | 498 | 498 | ||||||||||||
| 2028 Senior Notes (3.75% senior unsecured notes due September 21, 2028) | 594 | 594 | ||||||||||||
| 2029 Senior Notes (4.35% senior unsecured notes due June 15, 2029) | 1,240 | 1,240 | ||||||||||||
| 2030 Senior Notes (2.10% senior unsecured notes due June 15, 2030) | 1,236 | 1,235 | ||||||||||||
| 2032 Senior Notes (1.85% senior unsecured notes due September 15, 2032) | 1,485 | 1,485 | ||||||||||||
| 2033 Senior Notes (4.60% senior unsecured notes due March 15, 2033) | 1,488 | 1,488 | ||||||||||||
| 2040 Senior Notes (2.65% senior unsecured notes due September 15, 2040) | 1,232 | 1,231 | ||||||||||||
| 2048 Senior Notes (4.25% senior unsecured notes due September 21, 2048) | 1,231 | 1,231 | ||||||||||||
| 2050 Senior Notes (3.00% senior unsecured notes due June 15, 2050) | 1,221 | 1,221 | ||||||||||||
| 2052 Senior Notes (4.95% senior unsecured notes due June 15, 2052) | 1,465 | 1,464 | ||||||||||||
| 2060 Senior Notes (3.00% senior unsecured notes due September 15, 2060) | 1,471 | 1,471 | ||||||||||||
| 2062 Senior Notes (5.20% senior unsecured notes due June 15, 2062) | 984 | 983 | ||||||||||||
| Total long-term debt | 18,123 | 18,118 | ||||||||||||
| Total debt | $ | 18,123 | $ | 18,122 | ||||||||||
Our senior notes of $18.1 billion have a weighted average maturity of 16 years and a weighted average cost of 3.6% per annum.
Credit Facilities
We have a $3.9 billion senior unsecured revolving credit facility, or the Credit Facility, with a maturity date of May 25, 2027, with future capacity to increase our borrowings under the Credit Facility by an additional $1.0 billion, subject to the consent of the lenders funding the increase and certain other conditions. No amounts were outstanding under the Credit Facility as of March 31, 2023.
As of March 31, 2023, of the $3.9 billion that was available for borrowing under the Credit Facility, $151 million was required to support certain broker-dealer and other subsidiary commitments. We did not have any amounts outstanding under our U.S. dollar commercial paper program, or the Commercial Paper Program, as of March 31, 2023. Therefore, there was not an amount required to backstop the Commercial Paper Program. The amount required to backstop the amounts outstanding under the Commercial Paper Program will fluctuate as we increase or decrease our commercial paper borrowings. The remaining $3.7 billion was available for working capital and general corporate purposes including, but not limited to, acting as a backstop to future amounts outstanding under the Commercial Paper Program.
We have a 364-day senior unsecured bridge facility in an aggregate principal amount not to exceed $14.0 billion, or the Bridge Facility, with a maturity date of May 3, 2023. As of March 31, 2023, there were no amounts outstanding under the Bridge Facility.
We have a $2.4 billion two-year senior unsecured delayed draw term loan facility, or the Term Loan, with a maturity date of May 25, 2024. Draws under the Term Loan bear interest on the principal amount outstanding at either (a) Term Secured Overnight Financing Rate, or Term SOFR, plus an applicable margin plus a credit spread adjustment of 10 basis points or (b) a "base rate" plus an applicable margin. The applicable margin ranges from 0.625% to 1.125% for Term SOFR loans and from 0.000% to 0.125% for base rate loans, in each case, based on a ratings-based pricing grid. We expect to use the proceeds from borrowings under the Term Loan to fund a portion of the purchase price for the Black Knight acquisition. We have the option to prepay outstanding amounts under the Term Loan in whole or in part at any time. No amounts were outstanding under the Term Loan as of March 31, 2023.
Our India subsidiaries maintain $14 million of credit lines for their general corporate purposes. As of March 31, 2023, there were no amounts outstanding under these credit lines.
Commercial Paper Program
Our Commercial Paper Program is currently backed by the borrowing capacity available under the Credit Facility, as described above. The effective interest rate of commercial paper issuances does not materially differ from short-term interest rates, which fluctuate due to market conditions and as a result may impact our interest expense. We did not have any notes outstanding under our Commercial Paper Program as of March 31, 2023.
9. Share-Based Compensation
We currently sponsor stock option plans, restricted stock plans and our Employee Stock Purchase Plan to our employees and directors. Stock options and restricted stock are granted at the discretion of the Compensation Committee of our Board of Directors, or Board, based on the estimated fair value on the date of grant. The fair value of the stock options and restricted stock on the date of grant is recognized as expense over the vesting period, net of forfeitures. The non-cash compensation expenses recognized in our consolidated statements of income for stock options, restricted stock and under our employee stock purchase plan, net of amounts classified as capitalized software, were $40 million and $38 million for the three months ended March 31, 2023 and 2022, respectively.
Stock Option Plans
We use the Black-Scholes option pricing model to value our stock option awards. During the three months ended March 31, 2023 and 2022, we used the assumptions in the table below to compute the value:
| Three Months Ended March 31, | |||||||||||
| Assumptions: | 2023 | 2022 | |||||||||
| Risk-free interest rate | 3.47% | 1.72% | |||||||||
| Expected life in years | 6.1 | 6.0 | |||||||||
| Expected volatility | 24% | 23% | |||||||||
| Expected dividend yield | 1.56% | 1.17% | |||||||||
| Estimated weighted-average fair value of options granted per share | $27.39 | $28.18 |
The risk-free interest rate is based on the zero-coupon U.S. Treasury yield curve in effect at the date of grant. The expected life is derived from historical and anticipated future exercise patterns. Expected volatility is based on historical volatility data of our stock.
Restricted Stock Plans
Restricted shares are used as an incentive to attract and retain qualified employees and to align our and our stockholders' interests by linking actual performance to both short and long-term stockholder return. We issue awards that may contain a combination of time, performance and/or market conditions. The grant date fair value of each award is based on the closing stock price of our stock at the date of grant. The grant date fair value of time-based restricted stock is recognized as expense ratably over the vesting period, which is typically three or four years, net of forfeitures.
In February 2023, we reserved a maximum of 0.9 million restricted shares for potential issuance as performance-based restricted shares to certain of our employees. The number of shares ultimately granted under this award will be based on our actual financial performance as compared to financial performance targets set by our Board and the Compensation Committee for the year ending December 31, 2023, and will also be subject to a market condition reduction based on how our 2023 total stockholder return, or TSR, compares to that of the S&P 500 Index. The maximum compensation expense to be recognized under these performance-based restricted shares is $92 million if the maximum financial performance target is met and all 0.9 million shares vest. The compensation expense to be recognized under these performance-based restricted shares will be $46 million if the target financial performance is met, which would result in 0.4 million shares
vesting. For these awards with performance conditions, we recognize expense on an accelerated basis over the three-year vesting period based on our quarterly assessment of the probable 2023 actual financial performance as compared to the 2023 financial performance targets. As of March 31, 2023, our best estimate is that the financial performance level will be at target for 2023. Based on this assessment, we recorded non-cash compensation expense of $4 million for the three months ended March 31, 2023, related to these awards and the remaining $42 million in non-cash compensation expense will be recorded on an accelerated basis over the remaining vesting period, including $21 million which will be recorded over the remainder of 2023.
We also issue awards with a market condition but no performance condition. The fair value of these awards is estimated based on a simulation of various outcomes and includes inputs such as our stock price on the grant date, the valuation of historical awards with market conditions, the relatively low likelihood that the market condition will affect the number of shares granted (as the market condition only affects shares granted in excess of certain financial performance targets), and our expectation of achieving the financial performance targets.
10. Equity
Stock Repurchase Program
In December 2021, our Board approved an aggregate of $3.15 billion for future repurchases of our common stock with no fixed expiration date that became effective on January 1, 2022. The approval of our Board for the share repurchases does not obligate us to acquire any particular amount of our common stock. In addition, our Board may increase or decrease the amount available for repurchases from time to time. We fund repurchases from our operating cash flow or borrowings under our debt facilities or our Commercial Paper Program. Repurchases may be made from time to time on the open market, through established trading plans, in privately-negotiated transactions or otherwise, in accordance with all applicable securities laws, rules and regulations. We may begin or discontinue stock repurchases at any time and may amend or terminate a Rule 10b5-1 trading plan at any time or enter into additional plans, subject to applicable rules.
We did not have any share repurchases during the three months ended March 31, 2023. During the three months ended March 31, 2022, we repurchased a total of 3.7 million shares of our outstanding common stock at a cost of $475 million, consisting of 3.3 million shares at a cost of $425 million under our Rule 10b5-1 trading plan and 0.4 million shares at a cost of $50 million on the open market during an open trading period. As of March 31, 2023, the remaining balance of Board approved funds for future repurchases was $2.5 billion. In connection with our pending acquisition of Black Knight, on May 4, 2022 we terminated our Rule 10b5-1 trading plan and suspended share repurchases.
Dividends
During the three months ended March 31, 2023 and 2022, we declared and paid cash dividends per share of $0.42 and $0.38, respectively, for an aggregate payout of $236 million and $214 million, respectively. The declaration of dividends is subject to the discretion of our Board. Our Board has adopted a quarterly dividend declaration policy providing that the declaration of any dividends will be determined quarterly by the Board or the Audit Committee, taking into account such factors as our evolving business model, prevailing business conditions, our financial results and capital requirements and other considerations which our Board deems relevant, without a predetermined annual net income payout ratio.
Accumulated Other Comprehensive Income/(Loss)
The following tables present changes in the accumulated balances for each component of other comprehensive income/ (loss) (in millions):
| Changes in Accumulated Other Comprehensive Income/(Loss) by Component | ||||||||||||||||||||||||||
| Foreign currency translation adjustments | Comprehensive income from equity method investment | Employee benefit plans adjustments | Total | |||||||||||||||||||||||
| Balance, as of December 31, 2022 | $ | (278) | $ | 2 | $ | (55) | $ | (331) | ||||||||||||||||||
| Other comprehensive income | 16 | — | — | 16 | ||||||||||||||||||||||
| Income tax benefit/(expense) | — | — | — | — | ||||||||||||||||||||||
| Net current period other comprehensive income | 16 | — | — | 16 | ||||||||||||||||||||||
| Balance, as of March 31, 2023 | $ | (262) | $ | 2 | $ | (55) | $ | (315) |
| Changes in Accumulated Other Comprehensive Income/(Loss) by Component | ||||||||||||||||||||||||||
| Foreign currency translation adjustments | Comprehensive income from equity method investment | Employee benefit plans adjustments | Total | |||||||||||||||||||||||
| Balance, as of December 31, 2021 | $ | (150) | $ | 2 | $ | (48) | $ | (196) | ||||||||||||||||||
| Other comprehensive loss | (25) | — | — | (25) | ||||||||||||||||||||||
| Income tax benefit/(expense) | — | — | — | — | ||||||||||||||||||||||
| Net current period other comprehensive loss | (25) | — | — | (25) | ||||||||||||||||||||||
| Balance, as of March 31, 2022 | $ | (175) | $ | 2 | $ | (48) | $ | (221) |
11. Income Taxes
Our effective tax rate was 21% and 20% during the three months ended March 31, 2023 and 2022, respectively. The effective tax rate for the three months ended March 31, 2023 was higher than the effective tax rate for the comparable period in 2022 primarily due to the impact of the U.K. corporate income tax increase from 19% to 25% effective April 1, 2023, partially offset by favorable audit settlements for certain historical years.
In August 2022, the Inflation Reduction Act of 2022, or IRA, was signed into law. The IRA introduced a 15% corporation minimum tax, or CAMT, on adjusted financial statement income for corporations with profits in excess of $1 billion, effective for tax years after December 31, 2022. Based on the current guidance provided by the Internal Revenue Service and Treasury, the implementation of the CAMT does not have a material impact to our financial statements as of March 31, 2023.
The IRA also includes a share buyback excise tax of 1% on share repurchases, which will apply to net share repurchases after December 31, 2022. During the three months ended March 31, 2023, we did not repurchase any shares, therefore, we were not subject to any excise tax. The newly imposed excise tax on share repurchases is not considered an income tax. Any excise tax, as a result of future share repurchases, will be considered part of the cost of the shares repurchased and reflected in the equity section of our consolidated financial statements.
12. Clearing Operations
We operate six clearing houses, each of which acts as a central counterparty that becomes the buyer to every seller and the seller to every buyer for its clearing members or participants, or Members. Through this central counterparty function, the clearing houses provide financial security for each transaction for the duration of the position by limiting counterparty credit risk.
Our clearing houses are responsible for providing clearing services to each of our futures exchanges, and in some cases to third-party execution venues, and are as follows, referred to herein collectively as "the ICE Clearing Houses":
| Clearing House | Products Cleared | Exchange where Executed | Location | |||||||||||||||||
| ICE Clear Europe | Energy, agricultural, interest rates and equity index futures and options contracts and OTC European CDS instruments | ICE Futures Europe, ICE Futures U.S., ICE Endex, ICE Futures Abu Dhabi and third-party venues | U.K. | |||||||||||||||||
| ICE Clear U.S. | Agricultural, metals, foreign exchange, or FX, interest rate, equity index and digital asset futures and/or options contracts | ICE Futures U.S. | U.S. | |||||||||||||||||
| ICE Clear Credit | OTC North American, European, Asian-Pacific and Emerging Market CDS instruments | Creditex and third-party venues | U.S. | |||||||||||||||||
| ICE Clear Netherlands | Derivatives on equities and equity indices traded on regulated markets | ICE Endex | The Netherlands | |||||||||||||||||
| ICE Clear Singapore | Energy, metals and financial futures products and digital asset futures contracts | ICE Futures Singapore | Singapore | |||||||||||||||||
| ICE NGX | Physical North American natural gas and electricity | ICE NGX | Canada |
In 2022, we announced our decision to cease our CDS clearing service at ICE Clear Europe, our clearing house in the U.K., and thereafter our sole CDS clearing offering will be at our ICE Clear Credit clearing house in the U.S. This is expected to be completed in late 2023.
Original and Variation Margin
Each of the ICE Clearing Houses generally requires all Members to deposit collateral in cash or certain pledged assets. The collateral deposits are known as “original margin.” In addition, the ICE Clearing Houses may make intraday original margin calls in circumstances where market conditions require additional protection. The daily profits and losses to and from the ICE Clearing Houses due to the marking-to-market of open contracts is known as “variation margin.” With the exception of ICE NGX’s physical natural gas and physical power products discussed separately below, the ICE Clearing Houses mark all outstanding contracts to market, and therefore pay and collect variation margin, at least once daily.
The amounts that Members are required to maintain are determined by proprietary risk models established by each ICE Clearing House and reviewed by the relevant regulators, independent model validators, risk committees and the boards of directors of the respective ICE Clearing House. The amounts required may fluctuate over time. Each of the ICE Clearing Houses is a separate legal entity and is not subject to the liabilities of the others, or the obligations of Members of the other ICE Clearing Houses.
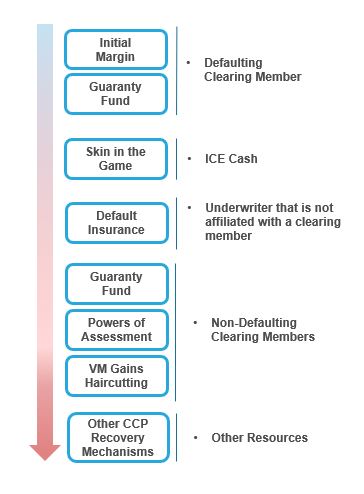
Should a particular Member fail to deposit its original margin or fail to make a variation margin payment, when and as required, the relevant ICE Clearing House may liquidate or hedge the defaulting Member's open positions and use their original margin and guaranty fund deposits to pay any amount owed. In the event that the defaulting Member's deposits are not sufficient to pay the amount owed in full, the ICE Clearing Houses will first use their respective contributions to the guaranty fund, often referred to as Skin In The Game, or SITG, to pay any remaining amount owed. In the event that the SITG is not sufficient, the ICE Clearing Houses may utilize the respective guaranty fund deposits and default insurance, or collect limited additional funds from their respective non-defaulting Members on a pro-rata basis, to pay any remaining amount owed.
As of March 31, 2023 and December 31, 2022, the ICE Clearing Houses had received or had been pledged $209.8 billion and $273.3 billion, respectively, in cash and non-cash collateral in original margin and guaranty fund deposits to cover price movements of underlying contracts for both periods.
Guaranty Funds and ICE Contribution
As described above, mechanisms have been created, called guaranty funds, to provide partial protection in the event of a Member default. With the exception of ICE NGX, each of the ICE Clearing Houses requires that each Member make deposits into a guaranty fund.
In addition, we have contributed our own capital that could be used if a defaulting Member’s original margin and guaranty fund deposits are insufficient. Included in the total contribution to ICE Clear U.S., as of March 31, 2023, is $15 million from Bakkt, solely applicable to any losses associated with a default in Bitcoin contracts and other digital assets that ICE Clear U.S. may clear in the future. Such amounts are recorded as long-term restricted cash and cash equivalents in our balance sheets and are as follows (in millions):
| ICE Portion of Guaranty Fund Contribution | Default insurance | ||||||||||||||||||||||||||||
| Clearing House | As of March 31, 2023 | As of December 31, 2022 | As of March 31, 2023 | As of December 31, 2022 | |||||||||||||||||||||||||
| ICE Clear Europe | $247 | $247 | $100 | $100 | |||||||||||||||||||||||||
| ICE Clear U.S. | 90 | 90 | 25 | 25 | |||||||||||||||||||||||||
| ICE Clear Credit | 50 | 50 | 75 | 75 | |||||||||||||||||||||||||
| ICE Clear Netherlands | 2 | 2 | N/A | N/A | |||||||||||||||||||||||||
| ICE Clear Singapore | 1 | 1 | N/A | N/A | |||||||||||||||||||||||||
| ICE NGX | 15 | 15 | 200 | 200 | |||||||||||||||||||||||||
| Total | $405 | $405 | $400 | $400 |
We also maintain default insurance as an additional layer of clearing member default protection. The default insurance was renewed in September 2022 and has a three-year term for the following clearing houses in the following amounts: ICE Clear Europe - $100 million; ICE Clear U.S. - $25 million; and ICE Clear Credit - $75 million. The default insurance layer resides after and in addition to the ICE Clear Europe, ICE Clear U.S. and ICE Clear Credit SITG contributions and before the guaranty fund contributions of the non-defaulting Members.
Similar to SITG, the default insurance layer is not intended to replace or reduce the position risk-based amount of the guaranty fund. As a result, the default insurance layer is not a factor that is included in the calculation of the Members' guaranty fund contribution requirement. Instead, it serves as an additional, distinct, and separate default resource that
should serve to further protect the non-defaulting Members’ guaranty fund contributions from being mutualized in the event of a default.
As of March 31, 2023, ICE NGX maintained a guaranty fund of $215 million, comprised of $15 million in cash and a $200 million letter of credit backed by a default insurance policy of the same amount, discussed below.
Below is a depiction of our Default Waterfall which summarizes the lines of defense and layers of protection we maintain for our mutualized clearing houses.
ICE Clearing House Default Waterfall
Cash and Invested Margin Deposits
We have recorded cash and invested margin and guaranty fund deposits and amounts due in our balance sheets as current assets with corresponding current liabilities to the Members. As of March 31, 2023, our cash and invested margin deposits were as follows (in millions):
| ICE Clear Europe (1) | ICE Clear Credit | ICE Clear U.S. | ICE NGX | Other ICE Clearing Houses | Total | ||||||||||||||||||||||||||||||
| Original margin | $ | 56,321 | $ | 33,155 | $ | 4,761 | $ | — | $ | 42 | $ | 94,279 | |||||||||||||||||||||||
| Unsettled variation margin, net | — | — | — | 663 | — | 663 | |||||||||||||||||||||||||||||
| Guaranty fund | 4,203 | 3,443 | 616 | — | 5 | 8,267 | |||||||||||||||||||||||||||||
| Delivery contracts receivable/payable, net | — | — | — | 760 | — | 760 | |||||||||||||||||||||||||||||
| Total | $ | 60,524 | $ | 36,598 | $ | 5,377 | $ | 1,423 | $ | 47 | $ | 103,969 |
As of December 31, 2022, our cash and invested margin deposits were as follows (in millions):
| ICE Clear Europe (2) | ICE Clear Credit | ICE Clear U.S. | ICE NGX | Other ICE Clearing Houses | Total | ||||||||||||||||||||||||||||||
| Original margin | $ | 101,243 | $ | 31,277 | $ | 4,141 | $ | — | $ | 5 | $ | 136,666 | |||||||||||||||||||||||
| Unsettled variation margin, net | — | — | — | 749 | — | 749 | |||||||||||||||||||||||||||||
| Guaranty fund | 4,162 | 3,177 | 597 | — | 4 | 7,940 | |||||||||||||||||||||||||||||
| Delivery contracts receivable/payable, net | — | — | — | 2,017 | — | 2,017 | |||||||||||||||||||||||||||||
| Total | $ | 105,405 | $ | 34,454 | $ | 4,738 | $ | 2,766 | $ | 9 | $ | 147,372 |
(1) $54.4 billion and $6.1 billion is related to futures/options and CDS, respectively.
(2) $97.6 billion and $7.8 billion is related to futures/options and CDS, respectively.
Our cash and invested margin and guaranty fund deposits are maintained in accounts with national banks and highly-rated financial institutions or secured through direct investments, primarily in U.S. Treasury and other highly-rated foreign government securities, or reverse repurchase agreements with primarily overnight maturities. We primarily use Level 1 inputs when evaluating the fair value of the non-cash equivalent direct investments, as highly-rated government securities are quoted in active markets. The carrying value of these deposits is deemed to approximate fair value.
To provide a tool to address the liquidity needs of our clearing houses and manage the liquidation of margin and guaranty fund deposits held in the form of cash and high quality sovereign debt, ICE Clear Europe, ICE Clear Credit and ICE Clear U.S. have entered into Committed Repurchase Agreement Facilities, or Committed Repo. Additionally, ICE Clear Credit and ICE Clear Netherlands have entered into Committed FX Facilities to support these liquidity needs. As of March 31, 2023, the following facilities were in place:
-
ICE Clear Europe: $1.0 billion in Committed Repo to finance U.S. dollar, euro and pound sterling deposits.
-
ICE Clear Credit: $300 million in Committed Repo (U.S. dollar based) to finance U.S. dollar denominated sovereign debt and euro deposits, €250 million in Committed Repo (euro based) to finance euro and U.S. dollar denominated sovereign debt deposits, and €1.9 billion in Committed FX Facilities to finance euro payment obligations.
-
ICE Clear U.S.: $250 million in Committed Repo to finance U.S. dollar denominated sovereign debt deposits.
-
ICE Clear Netherlands: €10 million in Committed FX Facilities to finance euro payment obligations.
Details of our deposits are as follows (in millions):
| Cash and Cash Equivalent Margin Deposits and Guaranty Funds | ||||||||||||||||||||||||||
| Clearing House | Investment Type | As of March 31, 2023 | As of December 31, 2022 | |||||||||||||||||||||||
| ICE Clear Europe | National bank account (1) | $ | 5,884 | $ | 17,390 | |||||||||||||||||||||
| ICE Clear Europe | Reverse repo | 50,388 | 65,352 | |||||||||||||||||||||||
| ICE Clear Europe | Sovereign debt | 3,753 | 19,894 | |||||||||||||||||||||||
| ICE Clear Europe | Demand deposits | 27 | 153 | |||||||||||||||||||||||
| ICE Clear Credit | National bank account | 27,814 | 27,145 | |||||||||||||||||||||||
| ICE Clear Credit | Reverse repo | 4,987 | 3,916 | |||||||||||||||||||||||
| ICE Clear Credit | Demand deposits | 3,796 | 3,393 | |||||||||||||||||||||||
| ICE Clear U.S. | Reverse repo | 5,228 | 4,266 | |||||||||||||||||||||||
| ICE Clear U.S. | Sovereign Debt | 149 | 472 | |||||||||||||||||||||||
| Other ICE Clearing Houses | Demand deposits | 46 | 9 | |||||||||||||||||||||||
| Total cash and cash equivalent margin deposits and guaranty funds | $ | 102,072 | $ | 141,990 |
| Invested Deposits, Delivery Contracts Receivable and Unsettled Variation Margin | ||||||||||||||||||||||||||||||||||||||||||||||||||
| Clearing House | Investment Type | As of March 31, 2023 | As of December 31, 2022 | |||||||||||||||||||||||||||||||||||||||||||||||
| ICE NGX | Unsettled variation margin and delivery contracts receivable/payable | 1,423 | 2,766 | |||||||||||||||||||||||||||||||||||||||||||||||
| ICE Clear Europe | Invested deposits - sovereign debt | 474 | 2,616 | |||||||||||||||||||||||||||||||||||||||||||||||
| Total invested deposits, delivery contracts receivable and unsettled variation margin | $ | 1,897 | $ | 5,382 |
(1) As of March 31, 2023, ICE Clear Europe held €201 million ($218 million based on the euro/U.S. dollar exchange rate of 1.0842 as of March 31, 2023) at the European Central Bank, or ECB, £4.6 billion ($5.7 billion based on the pound sterling/U.S. dollar exchange rate of 1.2332 as of March 31, 2023) at the Bank of England, or BOE, and €10 million ($11 million based on the above exchange rate) at the BOE. As of December 31, 2022, ICE Clear Europe held €11.7 billion ($12.5 billion based on the euro/U.S. dollar exchange rate of 1.0704 as of December 31, 2022) at ECB, £4.0 billion ($4.9 billion based on the pound sterling/U.S. dollar exchange rate of 1.2093 as of December 31, 2022) at the BOE and €10 million ($11 million based on the above exchange rate) at the BOE.
Other Deposits
Non-cash original margin and guaranty fund deposits are not reflected in the accompanying consolidated balance sheets as the risks and rewards of these assets remain with the clearing members unless the clearing houses have sold or re-pledged the assets or in the event of a clearing member default, where the clearing member is no longer entitled to redeem the assets. Any income, gain or loss accrues to the clearing members.
In addition to the cash and invested deposits above, the ICE Clearing Houses have also received other assets from Members, which include government obligations, emissions allowances, and may include other non-cash collateral such as letters of credit at ICE NGX to mitigate credit risk. For certain deposits, we may impose discount or “haircut” rates to ensure adequate collateral if market values fluctuate. The value-related risks and rewards of these assets remain with the Members. Any gain or loss accrues to the Member. The ICE Clearing Houses do not, in the ordinary course, rehypothecate or re-pledge these assets. These pledged assets are not reflected in our balance sheets, and are as follows (in millions):
| As of March 31, 2023 | |||||||||||||||||||||||||||||||||||
| ICE Clear Europe | ICE Clear Credit | ICE Clear U.S. | ICE NGX | Total | |||||||||||||||||||||||||||||||
| Original margin: | |||||||||||||||||||||||||||||||||||
| Government securities at face value | $ | 59,429 | $ | 24,762 | $ | 13,667 | $ | — | $ | 97,858 | |||||||||||||||||||||||||
| Letters of credit and other | — | — | — | 4,432 | 4,432 | ||||||||||||||||||||||||||||||
| ICE NGX cash deposits | — | — | — | 1,632 | 1,632 | ||||||||||||||||||||||||||||||
| Total | $ | 59,429 | $ | 24,762 | $ | 13,667 | $ | 6,064 | $ | 103,922 | |||||||||||||||||||||||||
| Guaranty fund: | |||||||||||||||||||||||||||||||||||
| Government securities at face value | $ | 841 | $ | 803 | $ | 295 | $ | — | $ | 1,939 |
| As of December 31, 2022 | |||||||||||||||||||||||||||||||||||
| ICE Clear Europe | ICE Clear Credit | ICE Clear U.S. | ICE NGX | Total | |||||||||||||||||||||||||||||||
| Original margin: | |||||||||||||||||||||||||||||||||||
| Government securities at face value | $ | 74,964 | $ | 26,601 | $ | 14,855 | $ | — | $ | 116,420 | |||||||||||||||||||||||||
| Letters of credit | — | — | — | 5,434 | 5,434 | ||||||||||||||||||||||||||||||
| ICE NGX cash deposits | — | — | — | 2,357 | 2,357 | ||||||||||||||||||||||||||||||
| Total | $ | 74,964 | $ | 26,601 | $ | 14,855 | $ | 7,791 | $ | 124,211 | |||||||||||||||||||||||||
| Guaranty fund: | |||||||||||||||||||||||||||||||||||
| Government securities at face value | $ | 641 | $ | 805 | $ | 269 | $ | — | $ | 1,715 |
ICE NGX
ICE NGX owns a clearing house which primarily administers the physical delivery of energy trading contracts. ICE NGX is the central counterparty to Members on opposite sides of its physically-settled contracts, and the balance related to delivered but unpaid contracts is recorded as a delivery contract net receivable, with an offsetting delivery contract net payable in our balance sheets. Unsettled variation margin equal to the fair value of open contracts is recorded as of each balance sheet date. There is no impact on our consolidated statements of income as an equal amount is recognized as both an asset and a liability. ICE NGX marks all its outstanding physical natural gas and physical power contracts to market daily, but only collects variation margin when a Member's open position falls outside a specified percentage of its pledged collateral. Due to the highly liquid nature and the short period of time to maturity, the fair values of our delivery contract net payable and net receivable are determined to approximate carrying value.
ICE NGX requires Members to maintain cash or letters of credit to serve as collateral in the event of default. The cash is maintained in a segregated bank account for the benefit of the Member, and remains the property of the Member, therefore, it is not included in our balance sheets. ICE NGX maintains a committed daylight-overnight liquidity facility in the amount of $100 million with an additional $200 million uncommitted with a third-party Canadian chartered bank which provides liquidity in the event of a settlement shortfall, subject to certain conditions.
As of March 31, 2023, ICE NGX maintains a guaranty fund of $215 million funded by a $200 million letter of credit issued by a major Canadian chartered bank, and backed by default insurance underwritten by Export Development Canada, or EDC, a Crown corporation operated at arm’s length from the Canadian government, plus $15 million held as restricted cash to fund the first loss amount that ICE NGX is responsible for under the default insurance policy. In the event of a participant default where the Member’s collateral is depleted, the shortfall would be covered by a draw down on the letter of credit following which ICE NGX would file a claim under the default insurance to recover additional losses up to $200 million beyond the $15 million first-loss amount that ICE NGX is responsible for under the default insurance policy.
Clearing House Exposure
The net notional value of unsettled contracts was $2.4 trillion as of March 31, 2023. Each ICE Clearing House bears financial counterparty credit risk and provides a central counterparty guarantee, or performance guarantee, to its Members. To reduce their exposure, the ICE Clearing Houses have a risk management program with both initial and ongoing membership standards. Excluding the effects of original and variation margin, guaranty fund and collateral requirements and default insurance, the ICE Clearing Houses’ maximum estimated exposure for this guarantee is $174.6 billion as of March 31, 2023, which represents the maximum estimated value by the ICE Clearing Houses of a hypothetical one-day movement in pricing of the underlying unsettled contracts. This value was determined using proprietary risk management software that simulates gains and losses based on historical market prices, volatility and other factors present at that point in time for those particular unsettled contracts. Future market price volatility could result in the exposure being significantly different than this amount.
13. Legal Proceedings
In the ordinary course of our business, from time to time we are subject to legal proceedings, lawsuits, government investigations and other claims with respect to a variety of matters. In addition, we are subject to periodic reviews, inspections, examinations and investigations by regulators in the U.S. and other jurisdictions, any of which may result in claims, legal proceedings, assessments, fines, penalties, restrictions on our business or other sanctions. We record estimated expenses and reserves for legal or regulatory matters or other claims when these matters present loss contingencies that are probable and the related amount is reasonably estimable. Any such accruals may be adjusted as circumstances change. Assessments of losses are inherently subjective and involve unpredictable factors. While the outcome of legal and regulatory matters is inherently difficult to predict and/or the range of loss often cannot be reasonably estimable, we do not believe that the liabilities, other than the potential $725 million termination fee payable to Black Knight and our accrual related to a potential $10 million regulatory settlement, which may ultimately result from the resolution of the various legal and regulatory matters that arise in the ordinary course of our business, including the matter described below and those described in Note 16 to the consolidated financial statements in Part II, Item 8 of our 2022 Form 10-K, are likely to have a material adverse effect on our consolidated financial condition, results of operations, or liquidity. It is possible, however, that future results of operations for any particular quarterly or annual period could be materially and adversely affected by any developments relating to these legal and regulatory matters. A range of possible losses related to certain cases cannot be reasonably estimated at this time, except as otherwise disclosed below and in Note 16 to the consolidated financial statements in Part II, Item 8 of our 2022 Form 10-K. Individual matter disclosures in this Form 10-Q are limited to new significant matters or significant updates on existing matters since the 2022 Form 10-K.
Black Knight Transaction Litigation
On March 9, 2023, the Federal Trade Commission, or the FTC, filed an administrative complaint alleging that the proposed transaction between ICE and Black Knight, if consummated, would be an unfair method of competition in violation of Section 5 of the Federal Trade Commission Act, and that it would substantially lessen competition, or tend to create a monopoly, in violation of Section 7 of the Clayton Act. The complaint seeks a variety of injunctive relief, including, among other things, a prohibition on the completion of the transaction without the FTC’s consent and, if the transaction is completed, a divestiture or reconstitution of assets in a manner that restores such separate and independent businesses as the parties had operated prior to the completion of the transaction. On April 10, 2023, the FTC filed a complaint in the United States District Court for the Northern District of California for a temporary restraining order and preliminary injunction enjoining the completion of the transaction. On April 21, 2023, the court entered a temporary restraining order enjoining the completion of the transaction until the court rules on the FTC’s motion for a preliminary injunction. In their answers to the administrative and court complaints, filed on March 20, 2023 and April 25, 2023, respectively, ICE and Black Knight denied the FTC’s substantive allegations; asserted numerous affirmative defenses; described the pro-competitive aspects and significant lender, servicer, investor, vendor and consumer benefits relating to this transaction; and denied that the combination of their respective businesses would violate any laws. Additionally, the answers to the court complaint contained counterclaims by ICE and Black Knight against the FTC seeking declaratory relief that the FTC’s administrative process is unconstitutional and should be enjoined. We plan to vigorously defend against the FTC’s administrative and court complaints.
For further information on our legal and regulatory matters, please see Note 16 to the consolidated financial statements in Part II, Item 8 of our 2022 Form 10-K.
14. Fair Value Measurements
Fair value is the price that would be received from selling an asset or paid to transfer a liability (an exit price) in the principal or most advantageous market for the asset or liability in an orderly transaction between market participants at the measurement date. Our financial instruments consist primarily of certain short-term and long-term assets and liabilities, customer accounts receivable, margin deposits and guaranty funds, equity and equity method investments, and short-term and long-term debt.
The fair value of our financial instruments is measured based on a three-level hierarchy:
-
Level 1 inputs** — quoted prices for identical assets or liabilities in active markets.
-
Level 2 inputs** — observable inputs other than Level 1 inputs such as quoted prices for similar assets and liabilities in active markets or inputs other than quoted prices that are directly observable.
-
Level 3 inputs** — unobservable inputs supported by little or no market activity and that are significant to the fair value of the assets or liabilities.
Financial assets and liabilities recorded or disclosed at fair value in the accompanying consolidated balance sheets as of March 31, 2023 and December 31, 2022 were classified in their entirety based on the lowest level of input that is significant to the asset or liability’s fair value measurement.
Our mutual funds are equity and fixed income mutual funds held for the purpose of providing future payments for our supplemental executive savings plan and the supplemental executive retirement plan. These mutual funds are classified as equity investments and measured at fair value using Level 1 inputs with adjustments recorded in net income.
Excluding our equity investments without a readily determinable fair value, all other financial instruments are determined to approximate carrying value due to the short period of time to their maturities.
We did not use Level 3 inputs to determine the fair value of assets or liabilities measured at fair value on a recurring basis as of March 31, 2023 or December 31, 2022.
We measure certain assets, such as intangible assets and equity method investments, at fair value on a non-recurring basis. These assets are recognized at fair value if they are deemed to be impaired. As of December 31, 2022, certain equity method investments were measured at fair value on a non-recurring basis. As of March 31, 2023, none of our intangible assets or equity method investments were required to be recorded at fair value since no impairments were recorded.
We measure certain equity investments at fair value on a non-recurring basis using our policy election under ASU 2016-01*.* During the three months ended March 31, 2023, we evaluated these investments and determined that no fair value adjustments were required under our accounting policy election related to these investments.
See Note 12 for the fair value considerations related to our margin deposits, guaranty funds and delivery contracts receivable.
The table below displays the fair value of our debt as of March 31, 2023. The fair values of our fixed rate notes were estimated using quoted market prices for these instruments. The fair value of other short-term debt approximates par value since the interest rates on this short-term debt approximate market rates as of March 31, 2023.
| As of March 31, 2023 | |||||||||||
| (in millions) | |||||||||||
| Debt: | Carrying Amount | Fair value | |||||||||
| 3.65% Senior Notes due May 23, 2025 | $ | 1,244 | $ | 1,230 | |||||||
| 3.75% Senior Notes due December 1, 2025 | 1,247 | 1,217 | |||||||||
| 4.00% Senior Notes due September 15, 2027 | 1,487 | 1,486 | |||||||||
| 3.10% Senior Notes due September 15, 2027 | 498 | 473 | |||||||||
| 3.75% Senior Notes due September 21, 2028 | 594 | 578 | |||||||||
| 4.35% Senior Notes due June 15, 2029 | 1,240 | 1,236 | |||||||||
| 2.10% Senior Notes due June 15, 2030 | 1,236 | 1,061 | |||||||||
| 1.85% Senior Notes due September 15, 2032 | 1,485 | 1,187 | |||||||||
| 4.60% Senior Notes due March 15, 2033 | 1,488 | 1,489 | |||||||||
| 2.65% Senior Notes due September 15, 2040 | 1,232 | 911 | |||||||||
| 4.25% Senior Notes due September 21, 2048 | 1,231 | 1,098 | |||||||||
| 3.00% Senior Notes due June 15, 2050 | 1,221 | 884 | |||||||||
| 4.95% Senior Notes due June 15, 2052 | 1,465 | 1,467 | |||||||||
| 3.00% Senior Notes due September 15, 2060 | 1,471 | 988 | |||||||||
| 5.20% Senior Notes due June 15, 2062 | 984 | 1,008 | |||||||||
| Total debt | $ | 18,123 | $ | 16,313 |
15. Segment Reporting
Our business is conducted through three reportable business segments:
-
Exchanges: We operate regulated marketplaces for the listing, trading and clearing of a broad array of derivatives contracts and financial securities;
-
Fixed Income and Data Services: We provide fixed income pricing, reference data, indices, analytics and execution services as well as global CDS clearing and multi-asset class data delivery solutions; and
-
Mortgage Technology: We provide a technology platform that offers customers comprehensive, digital workflow tools that aim to address the inefficiencies that exist in the U.S. residential mortgage market, from application through closing and the secondary market.
While revenues are recorded specifically in the segment in which they are earned or to which they relate, a significant portion of our operating expenses are not solely related to a specific segment because the expenses serve functions that are necessary for the operation of more than one segment. We directly allocate expenses when reasonably possible to do so. Otherwise, we use a pro-rata revenue approach as the allocation method for the expenses that do not relate solely to one segment and serve functions that are necessary for the operation of all segments.
Our chief operating decision maker does not review total assets or statements of income below operating income by segments; therefore, such information is not presented below. Our three segments do not engage in intersegment transactions.
Beginning in the first quarter of 2023, closing solutions revenues within our Mortgage Technology segment now include membership dues that were previously included in other revenues. We believe this is a more accurate reflection of the nature of these revenues. The impact of this change was not material, and the prior year period has been adjusted for comparability.
Financial data for our business segments is as follows for the three months ended March 31, 2023 and 2022 (in millions):
| Three Months Ended March 31, 2023 | ||||||||||||||||||||||||||
| Exchanges | Fixed Income and Data Services | Mortgage Technology | Consolidated | |||||||||||||||||||||||
| Revenues: | ||||||||||||||||||||||||||
| Energy futures and options | $ | 345 | $ | — | $ | — | $ | 345 | ||||||||||||||||||
| Agricultural and metals futures and options | 70 | — | — | 70 | ||||||||||||||||||||||
| Financial futures and options | 128 | — | — | 128 | ||||||||||||||||||||||
| Cash equities and equity options | 671 | — | — | 671 | ||||||||||||||||||||||
| OTC and other | 101 | — | — | 101 | ||||||||||||||||||||||
| Data and connectivity services | 232 | — | — | 232 | ||||||||||||||||||||||
| Listings | 126 | — | — | 126 | ||||||||||||||||||||||
| Fixed income execution | — | 32 | — | 32 | ||||||||||||||||||||||
| CDS clearing | — | 101 | — | 101 | ||||||||||||||||||||||
| Fixed income data and analytics | — | 276 | — | 276 | ||||||||||||||||||||||
| Other data and network services | — | 154 | — | 154 | ||||||||||||||||||||||
| Origination technology | — | — | 167 | 167 | ||||||||||||||||||||||
| Closing solutions | — | — | 40 | 40 | ||||||||||||||||||||||
| Data and analytics | — | — | 21 | 21 | ||||||||||||||||||||||
| Other | — | — | 8 | 8 | ||||||||||||||||||||||
| Revenues | 1,673 | 563 | 236 | 2,472 | ||||||||||||||||||||||
| Transaction-based expenses | 576 | — | — | 576 | ||||||||||||||||||||||
| Revenues, less transaction-based expenses | 1,097 | 563 | 236 | 1,896 | ||||||||||||||||||||||
| Operating expenses | 332 | 343 | 252 | 927 | ||||||||||||||||||||||
| Operating income/(loss) | $ | 765 | $ | 220 | $ | (16) | $ | 969 | ||||||||||||||||||
| Three Months Ended March 31, 2022 | ||||||||||||||||||||||||||
| Exchanges | Fixed Income and Data Services | Mortgage Technology | Consolidated | |||||||||||||||||||||||
| Revenues: | ||||||||||||||||||||||||||
| Energy futures and options | $ | 353 | $ | — | $ | — | $ | 353 | ||||||||||||||||||
| Agricultural and metals futures and options | 61 | — | — | 61 | ||||||||||||||||||||||
| Financial futures and options | 130 | — | — | 130 | ||||||||||||||||||||||
| Cash equities and equity options | 659 | — | — | 659 | ||||||||||||||||||||||
| OTC and other | 97 | — | — | 97 | ||||||||||||||||||||||
| Data and connectivity services | 214 | — | — | 214 | ||||||||||||||||||||||
| Listings | 129 | — | — | 129 | ||||||||||||||||||||||
| Fixed income execution | — | 15 | — | 15 | ||||||||||||||||||||||
| CDS clearing | — | 72 | — | 72 | ||||||||||||||||||||||
| Fixed income data and analytics | — | 277 | — | 277 | ||||||||||||||||||||||
| Other data and network services | — | 145 | — | 145 | ||||||||||||||||||||||
| Origination technology | — | — | 203 | 203 | ||||||||||||||||||||||
| Closing solutions | — | — | 72 | 72 | ||||||||||||||||||||||
| Data and analytics | — | — | 20 | 20 | ||||||||||||||||||||||
| Other | — | — | 12 | 12 | ||||||||||||||||||||||
| Revenues | 1,643 | 509 | 307 | 2,459 | ||||||||||||||||||||||
| Transaction-based expenses | 560 | — | — | 560 | ||||||||||||||||||||||
| Revenues, less transaction-based expenses | 1,083 | 509 | 307 | 1,899 | ||||||||||||||||||||||
| Operating expenses | 299 | 354 | 254 | 907 | ||||||||||||||||||||||
| Operating income | $ | 784 | $ | 155 | $ | 53 | $ | 992 | ||||||||||||||||||
Revenue from one member of the Exchanges segment comprised $123 million, or 11%, of our Exchange revenues, less transaction-based expenses for the three months ended March 31, 2023. Revenue from one member of the Exchanges
segment comprised $124 million, or 11%, of our Exchange revenues, less transaction-based expenses for the three months ended March 31, 2022. Clearing members are primarily intermediaries and represent a broad range of principal trading firms. If a clearing member ceased its operations, we believe that the trading firms would continue to conduct transactions and would clear those transactions through another clearing member firm. No additional customers or clearing members accounted for more than 10% of our segment revenues or consolidated revenues during the three months ended March 31, 2023 or 2022.
16. Earnings Per Common Share
The following is a reconciliation of the numerators and denominators of the basic and diluted earnings per common share computations for the three months ended March 31, 2023 and 2022 (in millions, except per share amounts):
| Three Months Ended March 31, | ||||||||||||||||||||||||||||||||
| 2023 | 2022 | |||||||||||||||||||||||||||||||
| Basic: | ||||||||||||||||||||||||||||||||
| Net income attributable to Intercontinental Exchange, Inc. | $ | 655 | $ | 657 | ||||||||||||||||||||||||||||
| Weighted average common shares outstanding | 559 | 561 | ||||||||||||||||||||||||||||||
| Basic earnings per common share | $ | 1.17 | $ | 1.17 | ||||||||||||||||||||||||||||
| Diluted: | ||||||||||||||||||||||||||||||||
| Weighted average common shares outstanding | 559 | 561 | ||||||||||||||||||||||||||||||
| Effect of dilutive securities - stock options and restricted stock | 2 | 3 | ||||||||||||||||||||||||||||||
| Diluted weighted average common shares outstanding | 561 | 564 | ||||||||||||||||||||||||||||||
| Diluted earnings per common share | $ | 1.17 | $ | 1.16 |
Basic earnings per common share is calculated using the weighted average common shares outstanding during the period.
Common equivalent shares from stock options and restricted stock awards, calculated using the treasury stock method, are included in the diluted per share calculations unless the effect of their inclusion would be antidilutive. During the three months ended March 31, 2023 and 2022, 0.7 million and 0.3 million outstanding stock options and restricted stock awards, respectively, were not included in the computation of diluted earnings per common share, because to do so would have had an antidilutive effect.
17. Subsequent Events
We have evaluated subsequent events, and determined that no events or transactions met the definition of a subsequent event for purposes of recognition or disclosure in the accompanying consolidated financial statements.
Previous: Cover and table of contents · Next: Item 2. MANAGEMENT’S DISCUSSION AND ANALYSIS OF FINANCIAL CONDITION AND RESULTS OF OPERATIONS