 filings.tools
Item 2. Management's Discussion and Analysis of Financial Condition and Results of Operations:
85K characters. Original on sec.gov ·
Item 2. Management's Discussion and Analysis of Financial Condition and Results of Operations:
| A Quarter in Review |
Total revenue of $11.7 billion was down $6.6 billion or 36% from Q1 2022, as CCG revenue decreased 38%, DCAI revenue decreased 39%, and NEX revenue decreased 30%. Q1 2023 results were impacted by an uncertain macroeconomic environment, with slowing consumer and enterprise demand, persistent inflation, and higher interest rates, that we believe impacts our target markets and creates a high level of uncertainty with our customers. We believe CCG, DCAI, and NEX customers, among others, tempered purchases to reduce their existing inventories and adjust to the macroeconomic uncertainty. CCG revenue decreased due to lower notebook and desktop volumes on lower demand, while notebook ASPs decreased due to a higher mix of small core and older generation products. DCAI revenue decreased due to lower server volume resulting from a softening data center market, partially offset by an increase in revenue from the FPGA product line. NEX revenue decreased due to lower demand for Edge, Network Xeon, and Ethernet products.
| Revenue | Gross Margin | Diluted EPS attributable to Intel | Cash Flows | |||||||||||||||||
| ■ GAAP $B | ■ GAAP ■ Non-GAAP | ■ GAAP ■ Non-GAAP | ■ Operating Cash Flow $B ■ Adjusted Free Cash Flow $B |

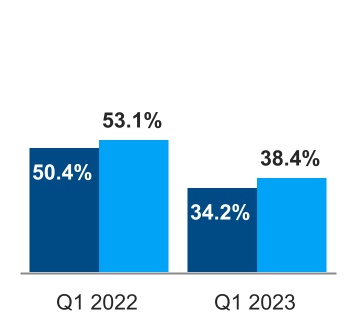
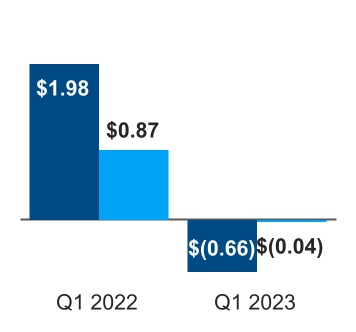
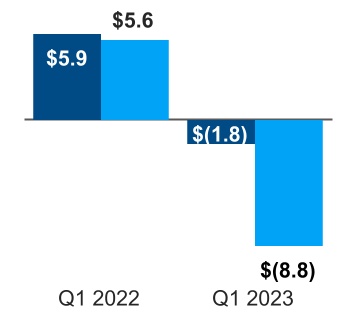
| $11.7B | 34.2% | 38.4% | $(0.66) | $(0.04) | $(1.8)B | $(8.8)B | ||||||||||||||||||||||||||||||||||||||
| GAAP | GAAP | non-GAAP1 | GAAP | non-GAAP1 | GAAP | non-GAAP1 | ||||||||||||||||||||||||||||||||||||||
| Revenue down $6.6B or 36% from Q1 2022 | Gross margin down 16.2 ppts from Q1 2022 | Gross margin down 14.7 ppts from Q1 2022 | Diluted EPS down $2.64 or 133% from Q1 2022 | Diluted EPS down $0.91 or 105% from Q1 2022 | Operating cash flow down $7.7B or 131% from Q1 2022 | Adjusted free cash flow down $14.4B or 257% from Q1 2022 | ||||||||||||||||||||||||||||||||||||||
| Lower revenue in CCG, DCAI, and NEX. | Lower GAAP gross margin from lower revenue, higher unit cost, and higher excess capacity charges, partially offset by a decrease in product ramp costs. | Lower GAAP EPS from lower gross margin, and lack of one-time benefits recognized in Q1 2022 (gains on the sale of McAfee and the NAND divestiture, and the benefit from the EC fine reversal). | Lower operating cash flow driven primarily by a net operating loss. |
Key Developments
▪CCG introduced the 13th Gen Intel® Core™ mobile processor family, led by the launch of the first 24-core processor for a laptop, and introduced the new Intel vPro® platform powered by the full lineup of 13th Gen Intel Core processors.
▪DCAI launched the 4th Gen Intel® Xeon® Scalable processors, a critical part of our heterogeneous hardware and software portfolio to accelerate real-world workloads, including AI, and announced the 5th Gen Xeon Scalable processor.
▪NEX launched the 4th Gen Intel® Xeon® Scalable processors with Intel® vRAN Boost, a new general-purpose chip that fully integrates Layer 1 acceleration into the Xeon SoC and is designed to eliminate the need for external accelerator cards.
▪IFS announced a multigeneration agreement with Arm to enable chip designers to build low-power compute system-on-chips (SoCs) on the Intel 18A process.
1 See "Non-GAAP Financial Measures" within MD&A.
 | A Quarter in Review | 3 |
| Consolidated Condensed Statements of Income | |||||
| Three Months Ended | ||||||||||||||||||||||||||
| (In Millions, Except Per Share Amounts; Unaudited) | Apr 1, 2023 | Apr 2, 2022 | ||||||||||||||||||||||||
| Net revenue | $ | 11,715 | $ | 18,353 | ||||||||||||||||||||||
| Cost of sales | 7,707 | 9,109 | ||||||||||||||||||||||||
| Gross margin | 4,008 | 9,244 | ||||||||||||||||||||||||
| Research and development | 4,109 | 4,362 | ||||||||||||||||||||||||
| Marketing, general, and administrative | 1,303 | 1,752 | ||||||||||||||||||||||||
| Restructuring and other charges | 64 | (1,211) | ||||||||||||||||||||||||
| Operating expenses | 5,476 | 4,903 | ||||||||||||||||||||||||
| Operating income (loss) | (1,468) | 4,341 | ||||||||||||||||||||||||
| Gains (losses) on equity investments, net | 169 | 4,323 | ||||||||||||||||||||||||
| Interest and other, net | 141 | 997 | ||||||||||||||||||||||||
| Income (loss) before taxes | (1,158) | 9,661 | ||||||||||||||||||||||||
| Provision for taxes | 1,610 | 1,548 | ||||||||||||||||||||||||
| Net income (loss) | (2,768) | 8,113 | ||||||||||||||||||||||||
| Less: Net income (loss) attributable to non-controlling interests | (10) | — | ||||||||||||||||||||||||
| Net income (loss) attributable to Intel | $ | (2,758) | $ | 8,113 | ||||||||||||||||||||||
| Earnings (loss) per share attributable to Intel—basic | $ | (0.66) | $ | 1.99 | ||||||||||||||||||||||
| Earnings (loss) per share attributable to Intel—diluted | $ | (0.66) | $ | 1.98 | ||||||||||||||||||||||
| Weighted average shares of common stock outstanding: | ||||||||||||||||||||||||||
| Basic | 4,154 | 4,079 | ||||||||||||||||||||||||
| Diluted | 4,154 | 4,107 |
See accompanying notes.
| Financial Statements | Consolidated Condensed Statements of Income | 4 |
| Consolidated Condensed Statements of Comprehensive Income | |||||
| Three Months Ended | ||||||||||||||||||||||||||
| (In Millions; Unaudited) | Apr 1, 2023 | Apr 2, 2022 | ||||||||||||||||||||||||
| Net income (loss) | $ | (2,768) | $ | 8,113 | ||||||||||||||||||||||
| Changes in other comprehensive income, net of tax: | ||||||||||||||||||||||||||
| Net unrealized holding gains (losses) on derivatives | 142 | (115) | ||||||||||||||||||||||||
| Actuarial valuation and other pension benefits (expenses), net | 1 | 18 | ||||||||||||||||||||||||
| Translation adjustments and other | — | (25) | ||||||||||||||||||||||||
| Other comprehensive income (loss) | 143 | (122) | ||||||||||||||||||||||||
| Total comprehensive income (loss) | (2,625) | 7,991 | ||||||||||||||||||||||||
| Less: comprehensive income (loss) attributable to non-controlling interests | (10) | — | ||||||||||||||||||||||||
| Total comprehensive income (loss) attributable to Intel | $ | (2,615) | $ | 7,991 |
See accompanying notes.
| Financial Statements | Consolidated Condensed Statements of Comprehensive Income | 5 |
| Consolidated Condensed Balance Sheets | |||||
| (In Millions; Unaudited) | Apr 1, 2023 | Dec 31, 2022 | ||||||||||||
| Assets | ||||||||||||||
| Current assets: | ||||||||||||||
| Cash and cash equivalents | $ | 8,232 | $ | 11,144 | ||||||||||
| Short-term investments | 19,302 | 17,194 | ||||||||||||
| Accounts receivable, net | 3,847 | 4,133 | ||||||||||||
| Inventories | 12,993 | 13,224 | ||||||||||||
| Other current assets | 3,940 | 4,712 | ||||||||||||
| Total current assets | 48,314 | 50,407 | ||||||||||||
| Property, plant and equipment, net of accumulated depreciation of $94,550 ($93,386 as of December 31, 2022) | 85,734 | 80,860 | ||||||||||||
| Equity investments | 6,029 | 5,912 | ||||||||||||
| Goodwill | 27,591 | 27,591 | ||||||||||||
| Identified intangible assets, net | 5,567 | 6,018 | ||||||||||||
| Other long-term assets | 12,068 | 11,315 | ||||||||||||
| Total assets | $ | 185,303 | $ | 182,103 | ||||||||||
| Liabilities and stockholders’ equity | ||||||||||||||
| Current liabilities: | ||||||||||||||
| Short-term debt | $ | 1,437 | $ | 4,367 | ||||||||||
| Accounts payable | 8,083 | 9,595 | ||||||||||||
| Accrued compensation and benefits | 2,497 | 4,084 | ||||||||||||
| Income taxes payable | 4,046 | 2,251 | ||||||||||||
| Other accrued liabilities | 11,330 | 11,858 | ||||||||||||
| Total current liabilities | 27,393 | 32,155 | ||||||||||||
| Debt | 48,836 | 37,684 | ||||||||||||
| Long-term income taxes payable | 3,831 | 3,796 | ||||||||||||
| Other long-term liabilities | 4,840 | 5,182 | ||||||||||||
| Contingencies (Note 12) | ||||||||||||||
| Stockholders’ equity: | ||||||||||||||
| Common stock and capital in excess of par value, 4,171 issued and outstanding (4,137 issued and outstanding as of December 31, 2022) | 32,829 | 31,580 | ||||||||||||
| Accumulated other comprehensive income (loss) | (419) | (562) | ||||||||||||
| Retained earnings | 65,649 | 70,405 | ||||||||||||
| Total Intel stockholders' equity | 98,059 | 101,423 | ||||||||||||
| Non-controlling interests | 2,344 | 1,863 | ||||||||||||
| Total stockholders' equity | 100,403 | 103,286 | ||||||||||||
| Total liabilities and stockholders’ equity | $ | 185,303 | $ | 182,103 |
See accompanying notes.
| Financial Statements | Consolidated Condensed Balance Sheets | 6 |
| Consolidated Condensed Statements of Cash Flows | |||||
| Three Months Ended | ||||||||||||||
| (In Millions; Unaudited) | Apr 1, 2023 | Apr 2, 2022 | ||||||||||||
| Cash and cash equivalents, beginning of period | $ | 11,144 | $ | 4,827 | ||||||||||
| Cash flows provided by (used for) operating activities: | ||||||||||||||
| Net income (loss) | (2,768) | 8,113 | ||||||||||||
| Adjustments to reconcile net income to net cash provided by operating activities: | ||||||||||||||
| Depreciation | 1,901 | 2,847 | ||||||||||||
| Share-based compensation | 739 | 707 | ||||||||||||
| Restructuring and other charges | 55 | 17 | ||||||||||||
| Amortization of intangibles | 465 | 501 | ||||||||||||
| (Gains) losses on equity investments, net | (167) | (4,325) | ||||||||||||
| (Gains) losses on divestitures | — | (1,121) | ||||||||||||
| Changes in assets and liabilities: | ||||||||||||||
| Accounts receivable | 286 | 2,384 | ||||||||||||
| Inventories | 231 | (1,147) | ||||||||||||
| Accounts payable | (771) | (128) | ||||||||||||
| Accrued compensation and benefits | (1,560) | (1,884) | ||||||||||||
| Income taxes | 1,344 | 1,219 | ||||||||||||
| Other assets and liabilities | (1,540) | (1,292) | ||||||||||||
| Total adjustments | 983 | (2,222) | ||||||||||||
| Net cash provided by (used for) operating activities | (1,785) | 5,891 | ||||||||||||
| Cash flows provided by (used for) investing activities: | ||||||||||||||
| Additions to property, plant and equipment | (7,413) | (4,604) | ||||||||||||
| Purchases of short-term investments | (16,132) | (19,091) | ||||||||||||
| Maturities and sales of short-term investments | 14,173 | 10,490 | ||||||||||||
| Sales of equity investments | 116 | 4,682 | ||||||||||||
| Proceeds from divestitures | — | 6,544 | ||||||||||||
| Other investing | 735 | (660) | ||||||||||||
| Net cash used for investing activities | (8,521) | (2,639) | ||||||||||||
| Cash flows provided by (used for) financing activities: | ||||||||||||||
| Repayment of commercial paper | (2,930) | — | ||||||||||||
| Payments on finance leases | (15) | (299) | ||||||||||||
| Partner contributions | 449 | — | ||||||||||||
| Issuance of long-term debt, net of issuance costs | 10,968 | — | ||||||||||||
| Proceeds from sales of common stock through employee equity incentive plans | 659 | 589 | ||||||||||||
| Payment of dividends to stockholders | (1,512) | (1,487) | ||||||||||||
| Other financing | (225) | (667) | ||||||||||||
| Net cash provided by (used for) financing activities | 7,394 | (1,864) | ||||||||||||
| Net increase (decrease) in cash and cash equivalents | (2,912) | 1,388 | ||||||||||||
| Cash and cash equivalents, end of period | $ | 8,232 | $ | 6,215 | ||||||||||
| Supplemental disclosures: | ||||||||||||||
| Acquisition of property, plant and equipment included in accounts payable and accrued liabilities | $ | 4,711 | $ | 2,949 | ||||||||||
| Cash paid during the period for: | ||||||||||||||
| Interest, net of capitalized interest | $ | 313 | $ | 177 | ||||||||||
| Income taxes, net of refunds | $ | 267 | $ | 335 | ||||||||||
See accompanying notes.
| Financial Statements | Consolidated Condensed Statements of Cash Flows | 7 |
| Consolidated Condensed Statements of Stockholders' Equity | |||||
| (In Millions, Except Per Share Amounts; Unaudited) | Common Stock and Capital in Excess of Par Value | Accumulated Other Comprehensive Income (Loss) | Retained Earnings | Non-Controlling Interests | Total | |||||||||||||||||||||||||||||||||
| Shares | Amount | |||||||||||||||||||||||||||||||||||||
| Three Months Ended | ||||||||||||||||||||||||||||||||||||||
| Balance as of December 31, 2022 | $ | 4,137 | $ | 31,580 | $ | (562) | $ | 70,405 | $ | 1,863 | $ | 103,286 | ||||||||||||||||||||||||||
| Net income (loss) | — | — | — | (2,758) | (10) | (2,768) | ||||||||||||||||||||||||||||||||
| Other comprehensive income (loss) | — | — | 143 | — | — | 143 | ||||||||||||||||||||||||||||||||
| Net proceeds received from partner contributions | — | — | — | — | — | 449 | 449 | |||||||||||||||||||||||||||||||
| Employee equity incentive plans and other | 36 | 659 | — | — | — | 659 | ||||||||||||||||||||||||||||||||
| Share-based compensation | — | 697 | — | — | 42 | 739 | ||||||||||||||||||||||||||||||||
| Restricted stock unit withholdings | (2) | (107) | — | 38 | — | (69) | ||||||||||||||||||||||||||||||||
| Cash dividends declared ($0.49 per share) | — | — | — | (2,036) | — | (2,036) | ||||||||||||||||||||||||||||||||
| Balance as of April 1, 2023 | $ | 4,171 | $ | 32,829 | $ | (419) | $ | 65,649 | $ | 2,344 | $ | 100,403 | ||||||||||||||||||||||||||
| Balance as of December 25, 2021 | $ | 4,070 | $ | 28,006 | $ | (880) | $ | 68,265 | $ | — | $ | 95,391 | ||||||||||||||||||||||||||
| Net income (loss) | — | — | — | 8,113 | — | 8,113 | ||||||||||||||||||||||||||||||||
| Other comprehensive income (loss) | — | — | (122) | — | — | (122) | ||||||||||||||||||||||||||||||||
| Employee equity incentive plans and other | 20 | 589 | — | — | — | 589 | ||||||||||||||||||||||||||||||||
| Share-based compensation | — | 707 | — | — | — | 707 | ||||||||||||||||||||||||||||||||
| Restricted stock unit withholdings | (1) | (58) | — | 3 | — | (55) | ||||||||||||||||||||||||||||||||
| Cash dividends declared ($0.37 per share) | — | — | — | (1,487) | — | (1,487) | ||||||||||||||||||||||||||||||||
| Balance as of April 2, 2022 | $ | 4,089 | $ | 29,244 | $ | (1,002) | $ | 74,894 | $ | — | $ | 103,136 | ||||||||||||||||||||||||||
See accompanying notes.
| Financial Statements | Consolidated Condensed Statements of Stockholders' Equity | 8 |
| Notes to Consolidated Condensed Financial Statements | |||||
| Note 1 : | Basis of Presentation |
We prepared our interim Consolidated Condensed Financial Statements that accompany these notes in conformity with US GAAP, consistent in all material respects with those applied in our 2022 Form 10-K.
We have a 52- or 53-week fiscal year that ends on the last Saturday in December. Fiscal year 2023 is a 52-week fiscal year; fiscal 2022 was a 53-week fiscal year, with the extra week included in the first quarter of 2022.
We have made estimates and judgments affecting the amounts reported in our Consolidated Condensed Financial Statements and the accompanying notes. The actual results that we experience may differ materially from our estimates. The interim financial information is unaudited, and reflects all normal adjustments that are, in our opinion, necessary to provide a fair statement of results for the interim periods presented. This report should be read in conjunction with the Consolidated Financial Statements in our 2022 Form 10-K where we include additional information on our critical accounting estimates, policies, and the methods and assumptions used in our estimates.
| Note 2 : | Operating Segments |
We previously announced the organizational change to integrate AXG into CCG and DCAI. This change is intended to drive a more effective go-to-market capability and to accelerate the scale of these businesses, while also reducing costs. As a result, we modified our segment reporting in the first quarter of 2023 to align to this and certain other business reorganizations. All prior-period segment data has been retrospectively adjusted to reflect the way our CODM internally receives information and manages and monitors our operating segment performance starting in fiscal year 2023.
We now manage our business through the following operating segments:
**▪**Client Computing (CCG)
**▪**Data Center and AI (DCAI)
**▪**Network and Edge (NEX)
**▪**Mobileye
**▪**Intel Foundry Services (IFS)
We derive a substantial majority of our revenue from our principal products that incorporate various components and technologies, including a microprocessor and chipset, a stand-alone SoC, or a multichip package, which is based on Intel® architecture.
CCG, DCAI and NEX are our reportable operating segments. Mobileye and IFS do not qualify as reportable operating segments; however, we have elected to disclose the results of these non-reportable operating segments. When we enter into federal contracts, they are aligned to the sponsoring operating segment.
We have sales and marketing, manufacturing, engineering, finance, and administration groups. Expenses for these groups are generally allocated to the operating segments.
We have an "all other" category that includes revenue, expenses, and charges such as:
**▪**results of operations from non-reportable segments not otherwise presented, and from start-up businesses that support our initiatives;
**▪**historical results of operations from divested businesses;
**▪**amounts included within restructuring and other charges;
**▪**employee benefits, compensation, impairment charges, and other expenses not allocated to the operating segments; and
**▪**acquisition-related costs, including amortization and any impairment of acquisition-related intangibles and goodwill.
The CODM, who is our CEO, allocates resources to and assesses the performance of each operating segment using information about the operating segment's revenue and operating income (loss). The CODM does not evaluate operating segments using discrete asset information, and we do not identify or allocate assets by operating segments. Based on the interchangeable nature of our manufacturing and assembly and test assets, most of the related depreciation expense is not directly identifiable within our operating segments, as it is included in overhead cost pools and subsequently absorbed into inventory as each product passes through our manufacturing process. Because our products are then sold across multiple operating segments, it is impracticable to determine the total depreciation expense included as a component of each operating segment's operating income (loss) results. We do not allocate gains and losses from equity investments, interest and other income, share-based compensation, or taxes to our operating segments. Although the CODM uses operating income (loss) to evaluate the segments, operating costs included in one segment may benefit other segments. The accounting policies for segment reporting are the same as for Intel as a whole. There have been no changes to our segment accounting policies disclosed in our 2022 Form 10-K except for the organizational change described above.
| Financial Statements | Notes to Financial Statements | 9 |
Net revenue and operating income (loss) for each period were as follows:
| Three Months Ended | |||||||||||||||||
| (In Millions) | Apr 1, 2023 | Apr 2, 2022 | |||||||||||||||
| Net revenue: | |||||||||||||||||
| Client Computing | |||||||||||||||||
| Desktop | $ | 1,879 | $ | 2,641 | |||||||||||||
| Notebook | 3,407 | 5,959 | |||||||||||||||
| Other | 481 | 722 | |||||||||||||||
| 5,767 | 9,322 | ||||||||||||||||
| Data Center and AI | 3,718 | 6,074 | |||||||||||||||
| Network and Edge | 1,489 | 2,139 | |||||||||||||||
| Mobileye | 458 | 394 | |||||||||||||||
| Intel Foundry Services | 118 | 156 | |||||||||||||||
| All other | 165 | 268 | |||||||||||||||
| Total net revenue | $ | 11,715 | $ | 18,353 | |||||||||||||
| Operating income (loss): | |||||||||||||||||
| Client Computing | $ | 520 | $ | 2,722 | |||||||||||||
| Data Center and AI | (518) | 1,393 | |||||||||||||||
| Network and Edge | (300) | 416 | |||||||||||||||
| Mobileye | 123 | 148 | |||||||||||||||
| Intel Foundry Services | (140) | (23) | |||||||||||||||
| All other | (1,153) | (315) | |||||||||||||||
| Total operating income (loss) | $ | (1,468) | $ | 4,341 |
| Note 3 : | Non-Controlling Interests |
Semiconductor Co-Investment Program
In 2022, we closed a transaction with Brookfield Asset Management (Brookfield) resulting in the formation of Arizona Fab LLC (Arizona Fab), a VIE for which we and Brookfield own 51% and 49%, respectively. Because we are the primary beneficiary of the VIE, we fully consolidate the results of Arizona Fab into our consolidated financial statements. Generally, contributions will be made to, and distributions will be received from, Arizona Fab based on both parties’ proportional ownership. We will be the sole operator and majority owner of two new chip factories that will be constructed by Arizona Fab, and we will have the right to purchase 100% of the related factory output. Once production commences, we will be required to operate Arizona Fab at minimum production levels measured in wafer starts per week and will be required to limit excess inventory held on site or we will be subject to certain penalties.
We have an unrecognized commitment to fund our respective share of the total construction costs of Arizona Fab of $29.0 billion.
As of April 1, 2023, a substantial majority of the assets of Arizona Fab consisted of property, plant and equipment. The assets held by Arizona Fab, which can be used only to settle obligations of the VIE and are not available to us, were $2.7 billion as of April 1, 2023 ($1.8 billion as of December 31, 2022).
Non-controlling interest in Arizona Fab was $1.3 billion as of April 1, 2023 ($874 million as of December 31, 2022). Net loss attributable to non-controlling interest in Arizona Fab was $5 million in the first three months of 2023; there was no net income (loss) attributable to non-controlling interest in the first three months of 2022.
Mobileye
In October 2022, Mobileye completed its IPO and certain other equity financing transactions that resulted in net proceeds of $1.0 billion. As of April 1, 2023, Intel held approximately 94% (94% as of December 31, 2022) of the outstanding equity interest in Mobileye. Non-controlling interest in Mobileye was $1.0 billion as of April 1, 2023 ($1.0 billion as of December 31, 2022). Net loss attributable to non-controlling interest in Mobileye was $5 million in the first three months of 2023; there was no net income (loss) attributable to non-controlling interest in the first three months of 2022.
| Financial Statements | Notes to Financial Statements | 10 |
| Note 4 : | Earnings (Loss) Per Share |
We computed basic earnings (loss) per share of common stock based on the weighted average number of shares of common stock outstanding during the period. We computed diluted earnings (loss) per share of common stock based on the weighted average number of shares of common stock outstanding plus potentially dilutive shares of common stock outstanding during the period.
| Three Months Ended | ||||||||||||||
| (In Millions, Except Per Share Amounts) | Apr 1, 2023 | Apr 2, 2022 | ||||||||||||
| Net income (loss) | $ | (2,768) | $ | 8,113 | ||||||||||
| Less: Net income (loss) attributable to non-controlling interests | (10) | — | ||||||||||||
| Net income (loss) attributable to Intel | (2,758) | 8,113 | ||||||||||||
| Weighted average shares of common stock outstanding—basic | 4,154 | 4,079 | ||||||||||||
| Dilutive effect of employee equity incentive plans | — | 28 | ||||||||||||
| Weighted average shares of common stock outstanding—diluted | 4,154 | 4,107 | ||||||||||||
| Earnings (loss) per share attributable to Intel—basic | $ | (0.66) | $ | 1.99 | ||||||||||
| Earnings (loss) per share attributable to Intel—diluted | $ | (0.66) | $ | 1.98 |
Potentially dilutive shares of common stock from employee equity incentive plans are determined by applying the treasury stock method to the assumed exercise of outstanding stock options, the assumed vesting of outstanding RSUs, and the assumed issuance of common stock under the stock purchase plan. Due to our net loss in the first three months of 2023, the assumed exercise of outstanding stock options, the assumed vesting of outstanding RSUs, and the assumed issuance of common stock under the stock purchase plan had an antidilutive effect on diluted earnings per share.
Securities which were anti-dilutive were insignificant and were excluded from the computation of diluted earnings per share in all periods presented.
| Note 5 : | Other Financial Statement Details |
Accounts Receivable
We sell certain of our accounts receivable on a non-recourse basis to third-party financial institutions. We record these transactions as sales of receivables and present cash proceeds as cash provided by operating activities in the Consolidated Condensed Statements of Cash Flows. Accounts receivable sold under non-recourse factoring arrangements were $500 million during the first three months of 2023, and we did not factor accounts receivable during the first three months of 2022. After the sale of our accounts receivable, we will collect payment from the customers and remit it to the third-party financial institution.
Inventories
| (In Millions) | Apr 1, 2023 | Dec 31, 2022 | ||||||||||||
| Raw materials | $ | 1,358 | $ | 1,517 | ||||||||||
| Work in process | 7,415 | 7,565 | ||||||||||||
| Finished goods | 4,220 | 4,142 | ||||||||||||
| Total inventories | $ | 12,993 | $ | 13,224 |
Interest and Other, Net
| Three Months Ended | ||||||||||||||
| (In Millions) | Apr 1, 2023 | Apr 2, 2022 | ||||||||||||
| Interest income | $ | 334 | $ | 47 | ||||||||||
| Interest expense | (193) | (124) | ||||||||||||
| Other, net | — | 1,074 | ||||||||||||
| Total interest and other, net | $ | 141 | $ | 997 |
Interest expense is net of $363 million of interest capitalized in the first three months of 2023 ($142 million in the first three months of 2022). Other, net includes a gain in 2022 of $1.0 billion resulting from the first closing of the divestiture of our NAND memory business.
| Financial Statements | Notes to Financial Statements | 11 |
Property, Plant and Equipment
Effective January 2023, we increased the estimated useful life of certain production machinery and equipment from 5 years to 8 years. We estimate this change resulted in an approximate $360 million increase to gross margin, an approximate $100 million decrease in R&D expenses, and an approximate $525 million decrease in ending inventory values in Q1 2023 when compared to what the impact would have been using the estimated useful life in place prior to this change.
| Note 6 : | Restructuring and Other Charges |
| Three Months Ended | ||||||||||||||||||||||||||
| (In Millions) | Apr 1, 2023 | Apr 2, 2022 | ||||||||||||||||||||||||
| Employee severance and benefit arrangements | $ | (39) | $ | 5 | ||||||||||||||||||||||
| Litigation charges and other | 77 | (1,216) | ||||||||||||||||||||||||
| Asset impairment charges | 26 | — | ||||||||||||||||||||||||
| Total restructuring and other charges | $ | 64 | $ | (1,211) |
The 2022 Restructuring Program was approved in the third quarter of 2022 to rebalance our workforce and operations to create efficiencies and improve our product execution in alignment with our strategy. We expect these actions to be substantially completed by the end of 2023, but this is subject to change. Any changes to the estimates or timing of executing the 2022 Restructuring Program will be reflected in our results of operations.
| Restructuring activity for the 2022 Restructuring Program during the first three months of 2023 was as follows: | ||||||||||||||||||||
| (In Millions) | ||||||||||||||||||||
| Accrued restructuring balance as of December 31, 2022 | $ | 873 | ||||||||||||||||||
| Adjustments | (41) | |||||||||||||||||||
| Cash payments | (487) | |||||||||||||||||||
| Accrued restructuring balance as of April 1, 2023 | $ | 345 |
The accrued restructuring balance as of April 1, 2023, was recorded as a current liability within accrued compensation and benefits on the Consolidated Condensed Balance Sheets*.*
Litigation charges and other includes a $1.2 billion benefit in the first three months of 2022 from the annulled penalty related to an EC fine that was recorded and paid in 2009. Refer to "Note 12: Contingencies" within the Notes to Consolidated Condensed Financial Statements for further information on legal proceedings related to the EC fine.
| Note 7 : | Investments |
Short-term Investments
Short-term investments include marketable debt investments in corporate debt, government debt, and financial institution instruments. Government debt includes instruments such as non-US government bonds and US agency securities. Financial institution instruments include instruments issued or managed by financial institutions in various forms, such as commercial paper, fixed- and floating-rate bonds, money market fund deposits, and time deposits. As of April 1, 2023, and December 31, 2022, substantially all time deposits were issued by institutions outside the US.
For certain of our marketable debt investments, we economically hedge market risks at inception with a related derivative instrument or the marketable debt investment itself is used to economically hedge currency exchange rate risk from remeasurement. These hedged investments are reported at fair value with gains or losses from the investments and the related derivative instruments recorded in interest and other, net. The fair value of our hedged investments was $18.2 billion as of April 1, 2023 ($16.2 billion as of December 31, 2022). For hedged investments still held at the reporting date, we recorded net gains of $90 million in the first three months of 2023 ($411 million of net losses in the first three months of 2022). We recorded net losses on the related derivatives of $102 million in the first three months of 2023 ($377 million of net gains in the first three months of 2022).
Our remaining unhedged marketable debt investments are reported at fair value, with unrealized gains or losses, net of tax, recorded in accumulated other comprehensive income (loss). The adjusted cost of our unhedged investments was $7.0 billion as of April 1, 2023 ($10.2 billion as of December 31, 2022), which approximated the fair value for these periods.
| Financial Statements | Notes to Financial Statements | 12 |
The fair value of marketable debt investments, by contractual maturity, as of April 1, 2023, was as follows:
| (In Millions) | Fair Value | |||||||
| Due in 1 year or less | $ | 15,874 | ||||||
| Due in 1–2 years | 1,805 | |||||||
| Due in 2–5 years | 4,850 | |||||||
| Due after 5 years | 734 | |||||||
| Instruments not due at a single maturity date1 | 1,947 | |||||||
| Total | $ | 25,210 |
1 Instruments not due at a single maturity date is comprised of money market fund deposits, which are classified as either short-term investments or cash and cash equivalents.
Equity Investments
| (In Millions) | Apr 1, 2023 | Dec 31, 2022 | ||||||||||||
| Marketable equity securities1 | $ | 1,421 | $ | 1,341 | ||||||||||
| Non-marketable equity securities | 4,598 | 4,561 | ||||||||||||
| Equity method investments | 10 | 10 | ||||||||||||
| Total | $ | 6,029 | $ | 5,912 |
1 Over 90% of our marketable equity securities are subject to trading-volume or market-based restrictions, which limit the number of shares we may sell in a specified period of time, impacting our ability to liquidate these investments. The trading volume restrictions generally apply for as long as we own more than 1% of the outstanding shares. Market-based restrictions result from the rules of the respective exchange.
The components of gains (losses) on equity investments, net for each period were as follows:
| Three Months Ended | ||||||||||||||||||||||||||||||||||||||
| (In Millions) | Apr 1, 2023 | Apr 2, 2022 | ||||||||||||||||||||||||||||||||||||
| Ongoing mark-to-market adjustments on marketable equity securities | $ | 188 | $ | (430) | ||||||||||||||||||||||||||||||||||
| Observable price adjustments on non-marketable equity securities | 10 | 71 | ||||||||||||||||||||||||||||||||||||
| Impairment charges | (36) | (23) | ||||||||||||||||||||||||||||||||||||
| Sale of equity investments and other1 | 7 | 4,705 | ||||||||||||||||||||||||||||||||||||
| Total gains (losses) on equity investments, net | $ | 169 | $ | 4,323 |
1 Sale of equity investments and other includes initial fair value adjustments recorded upon a security becoming marketable, realized gains (losses) on sales of non-marketable equity investments and equity method investments, and our share of equity method investee gains (losses) and distributions.
Net unrealized gains and losses for our marketable and non-marketable equity securities for each period were as follows:
| Three Months Ended | ||||||||||||||||||||||||||||||||
| (In Millions) | Apr 1, 2023 | Apr 2, 2022 | ||||||||||||||||||||||||||||||
| Net unrealized gains (losses) recognized during the period on equity securities | $ | 166 | $ | (244) | ||||||||||||||||||||||||||||
| Less: Net (gains) losses recognized during the period on equity securities sold during the period | (3) | (17) | ||||||||||||||||||||||||||||||
| Net unrealized gains (losses) recognized during the reporting period on equity securities still held at the reporting date | $ | 163 | $ | (261) |
McAfee Corp.
During the first quarter of 2022, the sale of the McAfee consumer business was completed and we received $4.6 billion in cash for the sale of our remaining share of McAfee, recognizing a $4.6 billion gain in sale of equity investments and other.
| Financial Statements | Notes to Financial Statements | 13 |
| Note 8 : | Acquisitions and Divestitures |
Acquisitions
Acquisition of Tower Semiconductor
During the first quarter of 2022, we entered into a definitive agreement to acquire Tower Semiconductor Ltd. (Tower) in a cash-for-stock transaction. Tower is a leading foundry for analog semiconductor solutions. The acquisition is expected to advance our IDM 2.0 strategy by accelerating our global end-to-end foundry business. Upon completion of the acquisition, each issued and outstanding ordinary share of Tower will be converted into the right to receive $53 per share in cash, representing a total enterprise value of approximately $5.4 billion as of the agreement date. We continue to work to close the transaction, which is subject to certain regulatory approvals and customary closing conditions. If regulatory approvals are not received prior to August 15, 2023, and the agreement is terminated by either party, we may be obligated to pay Tower a termination fee of $353 million. Tower will be included in our IFS operating segment.
Divestitures
NAND Memory Business
On December 29, 2021, we closed the first phase of our agreement with SK hynix Inc. (SK hynix) to divest our NAND memory business for $9.0 billion in cash. Our NAND memory business includes our NAND memory technology and manufacturing business (the NAND OpCo Business), of which we deconsolidated our ongoing interests in as part of the sale. The transaction will be completed in two closings and upon first closing in the first three months 2022, SK hynix paid $7.0 billion of consideration and we recognized a pre-tax gain of $1.0 billion within interest and other, net, and tax expense of $495 million. We recorded a receivable in other long-term assets for the remaining proceeds of $1.9 billion which remains outstanding as of April 1, 2023, and will be received upon the second closing of the transaction, expected to be no earlier than March 2025.
The wafer manufacturing and sale agreement includes incentives and penalties that are contingent on the cost of operation and output of the NAND OpCo Business. These incentives and penalties present a maximum exposure of up to $500 million annually, and $1.5 billion in the aggregate. We are currently in negotiations with SK hynix to update the operating plan of the NAND OpCo Business in light of the current business environment and projections, which may impact the metrics associated with the incentives and penalties and our expectations of the performance of the NAND OpCo Business against those metrics.
As of April 1, 2023, we also have a receivable due from the NAND OpCo Business, a deconsolidated entity, of $184 million recorded within other current assets on the Consolidated Condensed Balance Sheets. We will be reimbursed for costs of approximately $35 million per quarter in 2023 for corporate function services, which include human resources, information technology, finance, supply chain, and other compliance requirements associated with being wholly owned subsidiaries.
| Note 9 : | Borrowings |
In the first quarter of 2023, we issued a total of $11.0 billion aggregate principal amount of senior notes. We also amended both our 5-year $5.0 billion revolving credit facility agreement, extending the maturity date by one year to March 2028, and our 364-day credit facility agreement, extending the maturity date to March 2024. The revolving credit facilities had no borrowings outstanding as of April 1, 2023.
We have an ongoing authorization from our Board of Directors to borrow up to $10.0 billion under our commercial paper program. In the first quarter of 2023, we settled in cash $2.9 billion of our commercial paper and had $1.0 billion outstanding as of April 1, 2023.
Our senior fixed rate notes pay interest semiannually. We may redeem the fixed rate notes prior to their maturity at our option at specified redemption prices and subject to certain restrictions. The obligations under our senior fixed rate notes rank equally in the right of payment with all of our other existing and future senior unsecured indebtedness and effectively rank junior to all liabilities of our subsidiaries.
| Financial Statements | Notes to Financial Statements | 14 |
| Note 10 : | Fair Value |
Assets and Liabilities Measured and Recorded at Fair Value on a Recurring Basis
| Apr 1, 2023 | Dec 31, 2022 | |||||||||||||||||||||||||||||||||||||||||||||||||||||||
| Fair Value Measured and Recorded at Reporting Date Using | Fair Value Measured and Recorded at Reporting Date Using | |||||||||||||||||||||||||||||||||||||||||||||||||||||||
| (In Millions) | Level 1 | Level 2 | Level 3 | Total | Level 1 | Level 2 | Level 3 | Total | ||||||||||||||||||||||||||||||||||||||||||||||||
| Assets | ||||||||||||||||||||||||||||||||||||||||||||||||||||||||
| Cash equivalents: | ||||||||||||||||||||||||||||||||||||||||||||||||||||||||
| Corporate debt | $ | — | $ | 1,395 | $ | — | $ | 1,395 | $ | — | $ | 856 | $ | — | $ | 856 | ||||||||||||||||||||||||||||||||||||||||
| Financial institution instruments¹ | 1,806 | 2,177 | — | 3,983 | 6,899 | 1,474 | — | 8,373 | ||||||||||||||||||||||||||||||||||||||||||||||||
| Government debt² | 233 | 297 | — | 530 | — | — | — | — | ||||||||||||||||||||||||||||||||||||||||||||||||
| Reverse repurchase agreements | — | 1,700 | — | 1,700 | — | 1,301 | — | 1,301 | ||||||||||||||||||||||||||||||||||||||||||||||||
| Short-term investments: | ||||||||||||||||||||||||||||||||||||||||||||||||||||||||
| Corporate debt | — | 5,441 | — | 5,441 | — | 5,381 | — | 5,381 | ||||||||||||||||||||||||||||||||||||||||||||||||
| Financial institution instruments¹ | 141 | 5,019 | — | 5,160 | 196 | 4,729 | — | 4,925 | ||||||||||||||||||||||||||||||||||||||||||||||||
| Government debt² | 49 | 8,652 | — | 8,701 | 48 | 6,840 | — | 6,888 | ||||||||||||||||||||||||||||||||||||||||||||||||
| Other current assets: | ||||||||||||||||||||||||||||||||||||||||||||||||||||||||
| Derivative assets | 78 | 959 | — | 1,037 | — | 1,264 | — | 1,264 | ||||||||||||||||||||||||||||||||||||||||||||||||
| Loans receivable³ | — | 54 | — | 54 | — | 53 | — | 53 | ||||||||||||||||||||||||||||||||||||||||||||||||
| Marketable equity securities | 1,421 | — | — | 1,421 | 1,341 | — | — | 1,341 | ||||||||||||||||||||||||||||||||||||||||||||||||
| Other long-term assets: | ||||||||||||||||||||||||||||||||||||||||||||||||||||||||
| Derivative assets | — | 5 | — | 5 | — | 10 | — | 10 | ||||||||||||||||||||||||||||||||||||||||||||||||
| Total assets measured and recorded at fair value | $ | 3,728 | $ | 25,699 | $ | — | $ | 29,427 | $ | 8,484 | $ | 21,908 | $ | — | $ | 30,392 | ||||||||||||||||||||||||||||||||||||||||
| Liabilities | ||||||||||||||||||||||||||||||||||||||||||||||||||||||||
| Other accrued liabilities: | ||||||||||||||||||||||||||||||||||||||||||||||||||||||||
| Derivative liabilities | $ | 8 | $ | 350 | $ | 81 | $ | 439 | $ | 111 | $ | 485 | $ | 89 | $ | 685 | ||||||||||||||||||||||||||||||||||||||||
| Other long-term liabilities: | ||||||||||||||||||||||||||||||||||||||||||||||||||||||||
| Derivative liabilities | — | 515 | — | 515 | — | 699 | — | 699 | ||||||||||||||||||||||||||||||||||||||||||||||||
| Total liabilities measured and recorded at fair value | $ | 8 | $ | 865 | $ | 81 | $ | 954 | $ | 111 | $ | 1,184 | $ | 89 | $ | 1,384 |
1**Level 1 investments consist of money market funds. Level 2 investments consist primarily of commercial paper, certificates of deposit, time deposits, and notes and bonds issued by financial institutions.
2**Level 1 investments consist primarily of US Treasury securities. Level 2 investments consist primarily of non-US government debt.
3**The fair value of our loans receivable for which we elected the fair value option did not significantly differ from the contractual principal balance.
Assets Measured and Recorded at Fair Value on a Non-Recurring Basis
Our non-marketable equity securities, equity method investments, and certain non-financial assets, such as intangible assets and property, plant and equipment, are recorded at fair value only if an impairment or observable price adjustment is recognized in the current period. If an observable price adjustment or impairment is recognized on our non-marketable equity securities during the period, we classify these assets as Level 3.
Financial Instruments Not Recorded at Fair Value on a Recurring Basis
Financial instruments not recorded at fair value on a recurring basis include non-marketable equity securities and equity method investments that have not been remeasured or impaired in the current period, grants receivable, reverse repurchase agreements with original maturities greater than three months, and issued debt.
| Financial Statements | Notes to Financial Statements | 15 |
We classify the fair value of grants receivable and reverse repurchase agreements with original maturities greater than three months as Level 2. The estimated fair value of these financial instruments approximates their carrying value. The aggregate carrying value of grants receivable as of April 1, 2023 was $459 million (the aggregate carrying value as of December 31, 2022 was $437 million). The aggregate carrying value of reverse repurchase agreements with original maturities greater than three months as of April 1, 2023 was $0 million (the aggregate carrying value as of December 31, 2022 was $400 million).
We classify the fair value of issued debt (excluding any commercial paper) as Level 2. The fair value of our issued debt was $45.9 billion as of April 1, 2023 ($34.3 billion as of December 31, 2022).
| Note 11 : | Derivative Financial Instruments |
Volume of Derivative Activity
Total gross notional amounts for outstanding derivatives (recorded at fair value) at the end of each period were as follows:
| (In Millions) | Apr 1, 2023 | Dec 31, 2022 | ||||||||||||||||||
| Foreign currency contracts | $ | 30,847 | $ | 31,603 | ||||||||||||||||
| Interest rate contracts | 16,590 | 16,011 | ||||||||||||||||||
| Other | 2,058 | 2,094 | ||||||||||||||||||
| Total | $ | 49,495 | $ | 49,708 |
Fair Value of Derivative Instruments in the Consolidated Condensed Balance Sheets
| Apr 1, 2023 | Dec 31, 2022 | |||||||||||||||||||||||||
| (In Millions) | Assets****1 | Liabilities****2 | Assets****1 | Liabilities****2 | ||||||||||||||||||||||
| Derivatives designated as hedging instruments: | ||||||||||||||||||||||||||
| Foreign currency contracts3 | $ | 187 | $ | 185 | $ | 142 | $ | 290 | ||||||||||||||||||
| Interest rate contracts | — | 585 | — | 777 | ||||||||||||||||||||||
| Total derivatives designated as hedging instruments | 187 | 770 | 142 | 1,067 | ||||||||||||||||||||||
| Derivatives not designated as hedging instruments: | ||||||||||||||||||||||||||
| Foreign currency contracts3 | 537 | 156 | 866 | 194 | ||||||||||||||||||||||
| Interest rate contracts | 240 | 20 | 266 | 12 | ||||||||||||||||||||||
| Equity contracts | 78 | 8 | — | 111 | ||||||||||||||||||||||
| Total derivatives not designated as hedging instruments | 855 | 184 | 1,132 | 317 | ||||||||||||||||||||||
| Total derivatives | $ | 1,042 | $ | 954 | $ | 1,274 | $ | 1,384 |
1**Derivative assets are recorded as other assets, current and long-term.
2**Derivative liabilities are recorded as other liabilities, current and long-term.
3**The substantial majority of these instruments mature within 12 months.
| Financial Statements | Notes to Financial Statements | 16 |
Amounts Offset in the Consolidated Condensed Balance Sheets
Agreements subject to master netting arrangements with various counterparties, and cash and non-cash collateral posted under such agreements at the end of each period were as follows:
| Apr 1, 2023 | ||||||||||||||||||||||||||||||||||||||||||||||||||
| Gross Amounts Not Offset in the Balance Sheet | ||||||||||||||||||||||||||||||||||||||||||||||||||
| (In Millions) | Gross Amounts Recognized | Gross Amounts Offset in the Balance Sheet | Net Amounts Presented in the Balance Sheet | Financial Instruments | Cash and Non-Cash Collateral Received or Pledged | Net Amount | ||||||||||||||||||||||||||||||||||||||||||||
| Assets: | ||||||||||||||||||||||||||||||||||||||||||||||||||
| Derivative assets subject to master netting arrangements | $ | 966 | $ | — | $ | 966 | $ | (471) | $ | (495) | $ | — | ||||||||||||||||||||||||||||||||||||||
| Reverse repurchase agreements | 1,700 | — | 1,700 | — | (1,700) | — | ||||||||||||||||||||||||||||||||||||||||||||
| Total assets | 2,666 | — | 2,666 | (471) | (2,195) | — | ||||||||||||||||||||||||||||||||||||||||||||
| Liabilities: | ||||||||||||||||||||||||||||||||||||||||||||||||||
| Derivative liabilities subject to master netting arrangements | 935 | — | 935 | (471) | (392) | 72 | ||||||||||||||||||||||||||||||||||||||||||||
| Total liabilities | $ | 935 | $ | — | $ | 935 | $ | (471) | $ | (392) | $ | 72 |
| Dec 31, 2022 | ||||||||||||||||||||||||||||||||||||||
| Gross Amounts Not Offset in the Balance Sheet | ||||||||||||||||||||||||||||||||||||||
| (In Millions) | Gross Amounts Recognized | Gross Amounts Offset in the Balance Sheet | Net Amounts Presented in the Balance Sheet | Financial Instruments | Cash and Non-Cash Collateral Received or Pledged | Net Amount | ||||||||||||||||||||||||||||||||
| Assets: | ||||||||||||||||||||||||||||||||||||||
| Derivative assets subject to master netting arrangements | $ | 1,231 | $ | — | $ | 1,231 | $ | (546) | $ | (682) | $ | 3 | ||||||||||||||||||||||||||
| Reverse repurchase agreements | 1,701 | — | 1,701 | — | (1,701) | — | ||||||||||||||||||||||||||||||||
| Total assets | 2,932 | — | 2,932 | (546) | (2,383) | 3 | ||||||||||||||||||||||||||||||||
| Liabilities: | ||||||||||||||||||||||||||||||||||||||
| Derivative liabilities subject to master netting arrangements | 1,337 | — | 1,337 | (546) | (712) | 79 | ||||||||||||||||||||||||||||||||
| Total liabilities | $ | 1,337 | $ | — | $ | 1,337 | $ | (546) | $ | (712) | $ | 79 |
We obtain and secure available collateral from counterparties against obligations, including securities lending transactions and reverse repurchase agreements, when we deem it appropriate.
Derivatives in Cash Flow Hedging Relationships
The before-tax net gains or losses attributed to cash flow hedges recognized in other comprehensive income (loss) were $53 million net gains in the first three months of 2023 ($115 million net losses in the first three months of 2022). Substantially all of our cash flow hedges were foreign currency contracts for all periods presented.
During the first three months of 2023 and 2022, the amounts excluded from effectiveness testing were insignificant.
| Financial Statements | Notes to Financial Statements | 17 |
Derivatives in Fair Value Hedging Relationships
The effects of derivative instruments designated as fair value hedges, recognized in interest and other, net for each period were as follows:
| Gains (Losses) Recognized in Consolidated Condensed Statements of Income on Derivatives | ||||||||||||||||||||||||||||||||||||||
| Three Months Ended | ||||||||||||||||||||||||||||||||||||||
| (In Millions) | Apr 1, 2023 | Apr 2, 2022 | ||||||||||||||||||||||||||||||||||||
| Interest rate contracts | $ | 192 | $ | (711) | ||||||||||||||||||||||||||||||||||
| Hedged items | (192) | 711 | ||||||||||||||||||||||||||||||||||||
| Total | $ | — | $ | — |
The amounts recorded on the Consolidated Condensed Balance Sheets related to cumulative basis adjustments for fair value hedges for each period were as follows:
| Line Item in the Consolidated Condensed Balance Sheets in Which the Hedged Item is Included | Carrying Amount of the Hedged Item Asset/(Liabilities) | Cumulative Amount of Fair Value Hedging Adjustment Included in the Carrying Amount Assets/(Liabilities) | |||||||||||||||||||||||||||
| (In Millions) | Apr 1, 2023 | Dec 31, 2022 | Apr 1, 2023 | Dec 31, 2022 | |||||||||||||||||||||||||
| Long-term debt | $ | (11,413) | $ | (11,221) | $ | 584 | $ | 776 |
The total notional amount of pay-variable and receive-fixed interest rate swaps was $12.0 billion as of April 1, 2023 and $12.0 billion as of December 31, 2022.
Derivatives Not Designated as Hedging Instruments
The effects of derivative instruments not designated as hedging instruments on the Consolidated Condensed Statements of Income for each period were as follows:
| Three Months Ended | ||||||||||||||||||||||||||||||||
| (In Millions) | Location of Gains (Losses) Recognized in Income on Derivatives | Apr 1, 2023 | Apr 2, 2022 | |||||||||||||||||||||||||||||
| Foreign currency contracts | Interest and other, net | $ | 1 | $ | 158 | |||||||||||||||||||||||||||
| Interest rate contracts | Interest and other, net | (34) | 94 | |||||||||||||||||||||||||||||
| Other | Various | 115 | (134) | |||||||||||||||||||||||||||||
| Total | $ | 82 | $ | 118 |
Previous: Cover and table of contents · Next: Item 1. Legal Proceedings