 filings.tools
Item 2. MANAGEMENT’S DISCUSSION AND ANALYSIS OF FINANCIAL CONDITION AND RESULTS OF OPERATIONS
76K characters. Original on sec.gov ·
Item 2. MANAGEMENT’S DISCUSSION AND ANALYSIS OF FINANCIAL CONDITION AND RESULTS OF OPERATIONS
Management’s Discussion and Analysis of Financial Condition and Results of Operations (MD&A) is intended to provide readers of our condensed consolidated financial statements with the perspectives of management. This should allow the readers of this report to obtain a comprehensive understanding of our businesses, strategies, current trends, and future prospects. Our MD&A includes the following sections:
| • Executive Overview: High level discussion of our operating results and some of the trends that affect our business. • Critical Accounting Policies and Estimates: Significant changes since our most recent Annual Report on Form 10-K that we believe are important to understanding the assumptions and judgments underlying our financial statements. • Results of Operations: A more detailed discussion of our revenue and expenses. • Liquidity and Capital Resources: Discussion of key aspects of our condensed consolidated statements of cash flows, changes in our condensed consolidated balance sheets, and our financial commitments. |
You should note that this MD&A contains forward-looking statements that involve risks and uncertainties. Please see the section entitled “Forward-Looking Statements” immediately preceding Part I for important information to consider when evaluating such statements.
You should read this MD&A in conjunction with the financial statements and related notes in Part I, Item 1 of this Quarterly Report and our Annual Report on Form 10-K for the fiscal year ended July 31, 2022.
On November 1, 2021, we acquired all of the outstanding equity of The Rocket Science Group LLC (Mailchimp). Mailchimp is part of our Small Business & Self-Employed segment. We have included the results of Mailchimp in our consolidated results of operations from the date of acquisition.
On August 1, 2022, to better align our personal finance strategy, our Mint offering moved from our Consumer segment to our Credit Karma segment. Revenue and operating results for Mint are not material and the previously reported segment results have not been reclassified. Effective August 1, 2022, the operating results for Mint are included in the Credit Karma segment.
On August 1, 2022, we renamed our ProConnect segment as the ProTax segment. This segment continues to serve professional accountants.
| EXECUTIVE OVERVIEW |
This overview provides a high-level discussion of our operating results and some of the trends that affect our business. We believe that an understanding of these trends is important in order to understand our financial results as well as our future prospects. This summary is not intended to be exhaustive, nor is it a substitute for the detailed discussion and analysis provided elsewhere in this Quarterly Report on Form 10-Q.
| About Intuit |
Intuit helps consumers and small businesses prosper by delivering financial management and compliance products and services. We also provide specialized tax products to accounting professionals, who are key partners that help us serve small business customers. We organize our businesses into four reportable segments – Small Business & Self-Employed, Consumer, Credit Karma, and ProTax.
| Intuit Q2 Fiscal 2023 Form 10-Q | 28 |
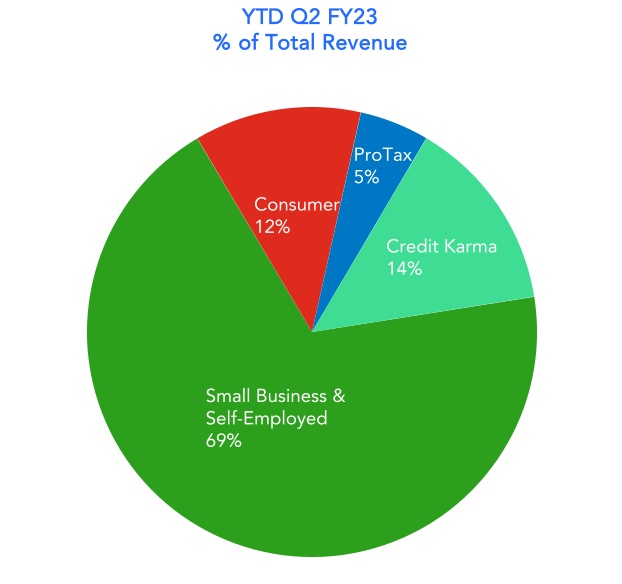
| Small Business & Self-Employed**:** This segment serves small businesses and the self-employed around the world, and the accounting professionals who assist and advise them. Our QuickBooks offerings include financial and business management online services and desktop software, payroll solutions, time tracking, merchant payment processing solutions, and financing for small businesses. Our Mailchimp offerings include e-commerce, marketing automation, and customer relationship management. Consumer**:** This segment serves consumers and includes do-it-yourself and assisted TurboTax income tax preparation products and services sold in the U.S. and Canada. Credit Karma**:** This segment serves consumers with a personal finance platform that provides personalized recommendations of credit card, home, auto and personal loan, and insurance products; online savings and checking accounts through an FDIC member bank partner; and access to their credit scores and reports, credit and identity monitoring, credit report dispute, and data-driven resources. Our Mint offering is a personal finance offering which helps customers track their finances and daily financial behaviors. ProTax**:** This segment serves professional accountants in the U.S. and Canada, who are essential to both small business success and tax preparation and filing. Our professional tax offerings include Lacerte, ProSeries, and ProConnect Tax Online in the U.S., and ProFile and ProTax Online in Canada. |
| Our Business and Growth Strategy |
At Intuit, our strategy starts with customer obsession. We listen to and observe our customers, understand their challenges, and then use advanced technology, including artificial intelligence (AI), to develop innovative solutions to help consumers and small businesses prosper. Our strategy for delivering on our bold goals is to be an AI-driven expert platform where we and others can solve our customers’ most important problems. We plan to accelerate the development of the platform by applying AI in three key areas:
-
An Open Platform: None of us can do it alone, including Intuit. The best way to deliver for customers is by creating an open, collaborative platform. It’s the power of partnerships that accelerates the world’s success. Our open technology platform integrates with partners so, together, we can deliver value and benefits that matter the most to our customers.
-
Application of AI: AI helps our customers work smarter because we can automate, predict and personalize their experience. Using AI technologies, we are: leveraging machine learning to build decision engines and algorithms that learn from rich datasets to transform user experiences; applying knowledge engineering and turning compliance rules into code; and using natural language processing to revolutionize how customers interact with products and services.
-
Incorporating Experts: One of the biggest problems our customers face is lack of confidence. Even with current advances in technology that deliver personalized tools and insights, many customers want to connect with a real person to help give them the confidence they are making the right decision. By bringing experts onto our platform we can solve this massive problem for customers. The power of our virtual expert platform allows us to scale the intelligence of our products, elevating experts to advisors and delivering big benefits for customers.
As we build our AI-driven expert platform, we prioritize our resources on five strategic priorities across the company. These priorities focus on solving the problems that matter most to customers and include:
- Revolutionizing speed to benefit****:** When customers use our products and services, we use the power of data-driven customer insights to help deliver value instantly and aim to make interactions with our offerings frictionless, without the need for customers to manually enter data. We are accelerating the application of AI and investing in decentralized technologies such as blockchain and cryptocurrency, with a goal to revolutionize the customer experience and help customers put more money in their pockets faster. This priority is foundational across our business, and execution against it positions us to succeed with our other four strategic priorities.
| Intuit Q2 Fiscal 2023 Form 10-Q | 29 |
- Connecting people to experts****:** The largest problem our customers face is lack of confidence to file their own taxes or to manage their books. To build their confidence, we connect our customers to experts. We offer customers access to experts to help them make important decisions – and experts, such as accountants, gain access to new customers so they can grow their businesses.
We are also expanding how we think about virtual experiences by exploring metaverse technologies and broadening the segments we serve beyond tax and accounting, to play a more meaningful role in our customers' lives.
-
Unlocking smart money decisions****:** We are creating a comprehensive, self-driving financial platform that propels our members forward wherever they are on their financial journey, so our members can understand their financial picture, make smart financial decisions, and stick to their financial plan in the near and long term.
-
Be the center of small business growth****:** We are focused on helping customers grow their businesses by offering a broad, seamless set of tools that are designed to help them get and retain customers, get paid faster, manage and get access to capital, pay employees with confidence, and use third-party apps to help run their businesses. At the same time, we want to position ourselves to better serve product-based businesses to benefit customers who sell products through multiple channels.
-
Disrupt the small business mid-market****:** We aim to disrupt the mid-market with QuickBooks Online Advanced, our online offering designed to address the needs of small business customers with 10 to 100 employees. This offering enables us to increase retention of these larger customers, and attract new mid-market customers who are over-served by available offerings.
| Industry Trends and Seasonality |
Industry Trends
AI is transforming multiple industries, including financial technology. Disruptive start-ups, emerging ecosystems and mega-platforms are harnessing new technology to create personalized experiences, deliver data-driven insights and increase speed of service. These shifts are creating a more dynamic and highly competitive environment where customer expectations are shifting around the world as more services become digitized and the array of choices continues to increase.
Seasonality
Our Consumer and ProTax offerings have a significant and distinct seasonal pattern as sales and revenue from our income tax preparation products and services are typically concentrated in the period from November through April. This seasonal pattern results in higher net revenues during our second and third quarters ending January 31 and April 30, respectively.
We expect the seasonality of our Consumer and ProTax businesses to continue to have a significant impact on our quarterly financial results in the future.
| Key Challenges and Risks |
Our growth strategy depends upon our ability to initiate and embrace disruptive technology trends, to enter new markets, and to drive broad adoption of the products and services we develop and market. Our future growth also increasingly depends on the strength of our third-party business relationships and our ability to continue to develop, maintain and strengthen new and existing relationships. To remain competitive and continue to grow, we are investing significant resources in our product development, marketing, and sales capabilities, and we expect to continue to do so in the future. Much of our future success also depends on our ability to continue to attract, retain and develop highly skilled employees in a highly competitive talent environment.
As we offer more online services, the ongoing operation and availability of our platforms and systems and those of our external service providers is becoming increasingly important. Because we help customers manage their financial lives, we face risks associated with the hosting, collection, use, and retention of personal customer information and data. We are investing significant management attention and resources in our information technology infrastructure and in our privacy and security capabilities, and we expect to continue to do so in the future.
We operate in industries that are experiencing an increasing amount of fraudulent activities by malicious third parties. We implement additional security measures, and we continue to work with state and federal governments to implement industry-wide security and anti-fraud measures, including sharing information regarding suspicious activity. We received ISO 27001 certification for a portion of our systems, and we continue to invest in security measures and to work with the broader industry and government to protect our customers against this type of fraud.
For a complete discussion of the most significant risks and uncertainties affecting our business, please see “Forward-Looking Statements” immediately preceding Part I and “Risk Factors” in Item 1A of Part II of this Quarterly Report.
| Intuit Q2 Fiscal 2023 Form 10-Q | 30 |
| Overview of Financial Results |
The most important financial indicators that we use to assess our business are revenue growth for the company as a whole and for each reportable segment; operating income growth for the company as a whole; earnings per share; and cash flow from operations. We also track certain non-financial drivers of revenue growth and, when material, identify them in the applicable discussions of segment results below. Service offerings are a significant part of our business. Our total service and other revenue was approximately $11 billion or 86% of our total revenue in fiscal 2022 and we expect our total service and other revenue to continue to grow in the future.
Key highlights for the first six months of fiscal 2023 include the following:
| Revenue of | Small Business & Self-Employed revenue of | Cash, cash equivalents, and investments of | ||||||||||||
| $5.6 B | $3.9 B | $2.1 B | ||||||||||||
| up 20% from the same period of fiscal 2022 | up 28% from the same period of fiscal 2022 | |||||||||||||
| CRITICAL ACCOUNTING POLICIES AND ESTIMATES |
In preparing our financial statements, we make estimates, assumptions and judgments that can have a significant impact on our net revenue, operating income or loss, and net income or loss, as well as on the value of certain assets and liabilities on our condensed consolidated balance sheets. We believe that the estimates, assumptions and judgments involved in the accounting policies described in Management’s Discussion and Analysis of Financial Condition and Results of Operations in Part II, Item 7 of our Annual Report on Form 10-K for the fiscal year ended July 31, 2022 have the greatest potential impact on our financial statements, so we consider them to be our critical accounting policies and estimates. There were no significant changes in those critical accounting policies and estimates during the first six months of fiscal 2023. Senior management has reviewed the development and selection of our critical accounting policies and estimates and their disclosure in this Quarterly Report on Form 10-Q with the Audit and Risk Committee of our Board of Directors.
| Intuit Q2 Fiscal 2023 Form 10-Q | 31 |
| RESULTS OF OPERATIONS |
| Financial Overview | |||||||||||||||||||||||||||||||||||||||||||||||
| (Dollars in millions, except per share amounts) | Q2 FY23 | Q2 FY22 | $ Change | % Change | YTD Q2 FY23 | YTD Q2 FY22 | $ Change | % Change | |||||||||||||||||||||||||||||||||||||||
| Total net revenue | $ | 3,041 | $ | 2,673 | $ | 368 | 14 | % | $ | 5,638 | $ | 4,680 | $ | 958 | 20 | % | |||||||||||||||||||||||||||||||
| Operating income | 270 | 56 | 214 | 382 | % | 346 | 251 | 95 | 38 | % | |||||||||||||||||||||||||||||||||||||
| Net income | 168 | 100 | 68 | 68 | % | 208 | 328 | (120) | (37) | % | |||||||||||||||||||||||||||||||||||||
| Diluted net income per share | $ | 0.60 | $ | 0.35 | $ | 0.25 | 71 | % | $ | 0.73 | $ | 1.16 | $ | (0.43) | (37) | % |
Current Fiscal Quarter
Total net revenue for the second quarter of fiscal 2023 increased $368 million or 14% compared with the same quarter of fiscal 2022. Our Small Business & Self-Employed segment revenue increased during the quarter primarily due to growth in our Online Ecosystem revenue. Consumer revenue increased due to higher TurboTax federal units, reflecting a faster forming tax season this year. These increases were offset by a decrease in Credit Karma segment revenue primarily due to decreases in our personal loan, home loan, auto insurance, and auto loan verticals. See “Segment Results” later in this Item 2 for more information about the results for all of our reportable segments.
Operating income increased $214 million for the second quarter of fiscal 2023 compared to the same quarter of fiscal 2022. The increase in operating income was due to the increase in revenue described above, partially offset by an increase in expenses. Expenses increased primarily due to staffing and share-based compensation, partially offset by a decrease in marketing. See "Cost of Revenue" and “Operating Expenses” later in this Item 2 for more information.
Net income for the second quarter of fiscal 2023 increased $68 million or 68% compared with the same quarter of fiscal 2022. The increase in net income was primarily due to the increase in operating income described above, partially offset by increases in tax expense and interest expense. The increase in tax expense is primarily due to the increase in operating income and the recording of tax shortfalls on share-based compensation in the second quarter of fiscal 2023, while we recorded excess tax benefits on share-based compensation in the same period of the prior year. Interest expense increased as a result of higher interest rates on our term loan. Diluted net income per share was $0.60 for the second quarter of fiscal 2023 compared to diluted net income per share of $0.35 for the same quarter of fiscal 2022.
Fiscal Year to Date
Total net revenue for the first six months of fiscal 2023 increased $958 million or 20% compared with the same period of fiscal 2022. Our Small Business & Self-Employed segment revenue increased during the period due to growth in our Online Ecosystem revenue. Our fiscal 2022 Online Ecosystem revenue includes Mailchimp revenue from the date of acquisition, which was November 1, 2021, and our fiscal 2023 Online Ecosystem revenue includes Mailchimp revenue for the full reporting period. Revenue for our Consumer segment increased compared to the same period in fiscal 2022 due to higher TurboTax federal units, reflecting a faster forming tax season this year. These increases were offset by a decrease in Credit Karma segment revenue primarily due to decreases in our personal loan, home loan, auto insurance, and auto loan verticals. See “Segment Results” later in this Item 2 for more information about the results for all of our reportable segments.
Operating income for the first six months of fiscal 2023 increased $95 million or 38% compared with the same period of fiscal 2022 primarily due to increase in revenue described above, partially offset by increases in expenses for staffing, share-based compensation, and amortization of other acquired intangible assets. See "Cost of Revenue" and “Operating Expenses” later in this Item 2 for more information.
Net income for the first six months of fiscal 2023 decreased $120 million or 37% compared with the same period of fiscal 2022. The decrease in net income was primarily due to increases in tax expense and interest expense, which were partially offset by the increase in operating income described above. The increase in tax expense is primarily due to recording tax shortfalls on share-based compensation for the first six months of fiscal 2023, while we recorded excess tax benefits on share-based compensation in the same period of the prior year. Interest expense increased as a result of higher interest rates on our term loan and the term loan was outstanding during the entire six month period of fiscal 2023, but only for three months during the six month period of fiscal 2022. Diluted net income per share decreased to $0.73 for the first six months of fiscal 2023 compared to $1.16 for the same period in fiscal in 2022, in line with the decrease in net income.
| Intuit Q2 Fiscal 2023 Form 10-Q | 32 |
| Segment Results |
The information below is organized in accordance with our four reportable segments. See “Executive Overview – About Intuit” earlier in this Item 2 and Note 12 to the financial statements in Part I, Item 1 of this Quarterly Report for more information. All of our segments operate and sell to customers primarily in the United States. Total international net revenue was approximately 9% and 10% for the three and six months ended January 31, 2023, respectively. Total international net revenue was approximately 10% and 8% for the three and six months ended January 31, 2022, respectively.
On November 1, 2021, we acquired Mailchimp in a business combination. Mailchimp is part of our Small Business & Self-Employed segment. We have included the results of operations of Mailchimp in our condensed consolidated results of operations from the date of acquisition.
On August 1, 2022, to better align our personal finance strategy, our Mint offering moved from our Consumer segment to our Credit Karma segment. Revenue and operating results for Mint are not material and the previously reported segment results have not been reclassified. Effective August 1, 2022, the operating results for Mint are included in the Credit Karma segment.
On August 1, 2022, we renamed our ProConnect segment as the ProTax segment. This segment continues to serve professional accountants.
Segment operating income or loss is segment net revenue less segment cost of revenue and operating expenses. See “Executive Overview – Industry Trends and Seasonality” earlier in this Item 2 for a description of the seasonality of our business. We include expenses such as corporate selling and marketing, product development, general and administrative, and non-employment related legal and litigation settlement costs, which are not allocated to specific segments, in unallocated corporate items as part of other corporate expenses. For our Credit Karma reportable segment, segment expenses include all direct expenses related to selling and marketing, product development, and general and administrative. Unallocated corporate items for all segments include share-based compensation, amortization of acquired technology, amortization of other acquired intangible assets, goodwill and intangible asset impairment charges, and professional fees and transaction charges related to business combinations. These unallocated corporate items for all segments totaled $2.4 billion in the first six months of fiscal 2023 and $2.0 billion in the first six months of fiscal 2022. Unallocated corporate items increased in the fiscal 2023 period primarily due to increases in share-based compensation expense, selling and marketing expense, and amortization of other acquired intangible assets. See Note 12 to the condensed consolidated financial statements in Part I, Item 1 of this Quarterly Report for reconciliations of total segment operating income or loss to consolidated operating income or loss for each fiscal period presented.
| Intuit Q2 Fiscal 2023 Form 10-Q | 33 |
| Small Business & Self-Employed |
Small Business & Self-Employed segment includes both Online Ecosystem and Desktop Ecosystem revenue.
Our Online Ecosystem includes revenue from:
-
QuickBooks Online, QuickBooks Live, QuickBooks Online Advanced and QuickBooks Self-Employed financial and business management offerings;
-
QuickBooks Online Payroll;
-
Merchant payment processing services for small businesses who use online offerings;
-
Mailchimp’s e-commerce, marketing automation, and customer relationship management offerings;
-
QuickBooks Commerce;
-
QuickBooks Checking; and
-
Financing for small businesses.
Our Desktop Ecosystem includes revenue from:
-
QuickBooks Desktop software subscriptions (QuickBooks Desktop Pro Plus, QuickBooks Desktop Premier Plus, and QuickBooks Enterprise, and ProAdvisor Program memberships for the accounting professionals who serve small businesses);
-
Desktop payroll products (QuickBooks Basic Payroll, QuickBooks Assisted Payroll and QuickBooks Enhanced Payroll);
-
Merchant payment processing services for small businesses who use desktop offerings;
-
QuickBooks Point of Sale;
-
Financial supplies; and
-
Financing for small businesses.
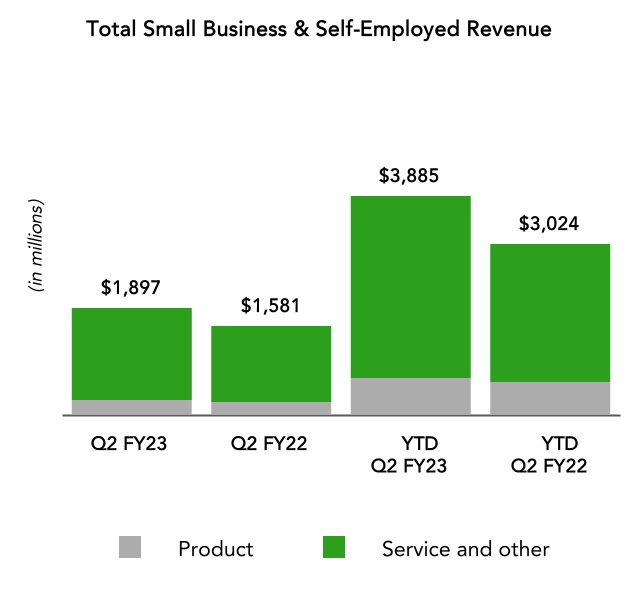
Segment product revenue is primarily derived from revenue related to delivery of software licenses and the related updates, including version protection, for our QuickBooks Desktop subscriptions and desktop payroll offerings which are part of our Desktop Ecosystem. Segment service and other revenue is primarily derived from our Online Ecosystem revenue and revenue from the services and support that are provided as part of our QuickBooks Desktop subscription and desktop payroll offerings as well as merchant payment processing services.
| (Dollars in millions) | Q2 FY23 | Q2 FY22 | % Change | YTD Q2 FY23 | YTD Q2 FY22 | % Change | |||||||||||||||||||||||||||||
| Product revenue | $ | 267 | $ | 233 | 15 | % | $ | 673 | $ | 611 | 10 | % | |||||||||||||||||||||||
| Service and other revenue | 1,630 | 1,348 | 21 | % | 3,212 | 2,413 | 33 | % | |||||||||||||||||||||||||||
| Total segment revenue | $ | 1,897 | $ | 1,581 | 20 | % | $ | 3,885 | $ | 3,024 | 28 | % | |||||||||||||||||||||||
| % of total revenue | 63 | % | 59 | % | 69 | % | 65 | % | |||||||||||||||||||||||||||
| Segment operating income | $ | 1,021 | $ | 773 | 32 | % | $ | 2,200 | $ | 1,694 | 30 | % | |||||||||||||||||||||||
| % of related revenue | 54 | % | 49 | % | 57 | % | 56 | % |
| Intuit Q2 Fiscal 2023 Form 10-Q | 34 |
Revenue classified by significant product and service offerings was as follows:
| (Dollars in millions) | Q2 FY23 | Q2 FY22 | % Change | YTD Q2 FY23 | YTD Q2 FY22 | % Change | |||||||||||||||||||||||||||||
| Net revenue: | |||||||||||||||||||||||||||||||||||
| QuickBooks Online Accounting | $ | 696 | $ | 547 | 27 | % | $ | 1,364 | $ | 1,066 | 28 | % | |||||||||||||||||||||||
| Online Services | 695 | 574 | 21 | % | 1,376 | 900 | 53 | % | |||||||||||||||||||||||||||
| Total Online Ecosystem | 1,391 | 1,121 | 24 | % | 2,740 | 1,966 | 39 | % | |||||||||||||||||||||||||||
| QuickBooks Desktop Accounting | 215 | 169 | 27 | % | 527 | 436 | 21 | % | |||||||||||||||||||||||||||
| Desktop Services and Supplies | 291 | 291 | — | % | 618 | 622 | (1) | % | |||||||||||||||||||||||||||
| Total Desktop Ecosystem | 506 | 460 | 10 | % | 1,145 | 1,058 | 8 | % | |||||||||||||||||||||||||||
| Total Small Business & Self-Employed | $ | 1,897 | $ | 1,581 | 20 | % | $ | 3,885 | $ | 3,024 | 28 | % |
Revenue for our Small Business & Self-Employed segment increased $316 million or 20% in the second quarter of fiscal 2023 and $861 million or 28% in the first six months of fiscal 2023 compared with the same periods of fiscal 2022. The increase in both periods was primarily due to growth in Online Ecosystem revenue. Our fiscal 2022 Online Ecosystem revenue includes Mailchimp revenue from the date of acquisition, which was November 1, 2021, and our fiscal 2023 Online Ecosystem revenue includes Mailchimp revenue for the full reporting period.
Online Ecosystem Revenue
Online Ecosystem revenue increased 24% in the second quarter of fiscal 2023 compared with the same period of fiscal 2022. QuickBooks Online Accounting revenue increased 27% in the second quarter of fiscal 2023 primarily due to an increase in customers, higher effective prices, and a shift in mix to our higher priced offerings. Online Services revenue increased 21% in the second quarter of fiscal 2023 primarily due to an increase in revenue from our payroll, Mailchimp, and payments offerings. Online payroll revenue increased due to an increase in customers and a shift in mix to higher-end offerings. Mailchimp revenue increased due to higher effective prices. Online payments revenue increased due to an increase in customers and an increase in total payment volume per customer.
Online Ecosystem revenue increased 39% in the first six months of fiscal 2023 compared with the same period of fiscal 2022. QuickBooks Online Accounting revenue increased 28% in the first six months of fiscal 2023 primarily due to an increase in customers, higher effective prices, and a shift in mix to our higher priced offerings. Online Services revenue increased 53% in the first six months of fiscal 2023 primarily from higher Mailchimp revenue due to the timing of our acquisition in the second quarter of fiscal 2022 and increases in revenue from our payroll and payments offerings. Online payroll revenue increased due to an increase in customers and a shift in mix to higher-end offerings. Online payments revenue increased due to an increase in customers and an increase in total payment volume per customer.
Desktop Ecosystem Revenue
Desktop Ecosystem revenue increased 10% in the second quarter of fiscal 2023 and 8% in the first six months of fiscal 2023 compared with the same periods of fiscal 2022. The increase was primarily due to growth in our QuickBooks Desktop and Enterprise subscription offerings. In the first quarter of fiscal 2022, we discontinued our QuickBooks Desktop packaged software products and now sell only on a subscription basis.
Small Business & Self-Employed segment operating income increased $248 million or 32% in the second quarter of fiscal 2023 and $506 million or 30% in the first six months of fiscal 2023 compared with the same periods of fiscal 2022, primarily due to the increases in revenue described above, which was partially offset by higher expenses for staffing.
| Intuit Q2 Fiscal 2023 Form 10-Q | 35 |
| Consumer |
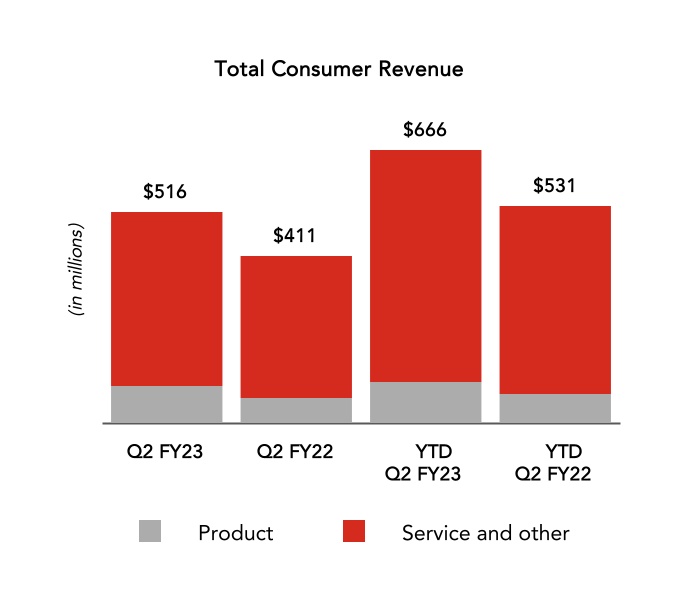
Consumer segment product revenue is derived primarily from TurboTax desktop tax return preparation software and related form updates.
Consumer segment service and other revenue is derived primarily from TurboTax Online and TurboTax Live offerings, electronic tax filing services and connected services.
| (Dollars in millions) | Q2 FY23 | Q2 FY22 | % Change | YTD Q2 FY23 | YTD Q2 FY22 | % Change | |||||||||||||||||||||||||||||
| Product revenue | $ | 94 | $ | 65 | 45 | % | $ | 101 | $ | 72 | 40 | % | |||||||||||||||||||||||
| Service and other revenue | 422 | 346 | 22 | % | 565 | 459 | 23 | % | |||||||||||||||||||||||||||
| Total segment revenue | $ | 516 | $ | 411 | 26 | % | $ | 666 | $ | 531 | 25 | % | |||||||||||||||||||||||
| % of total revenue | 17 | % | 15 | % | 12 | % | 11 | % | |||||||||||||||||||||||||||
| Segment operating income | $ | 177 | $ | 53 | 234 | % | $ | 188 | $ | 42 | 348 | % | |||||||||||||||||||||||
| % of related revenue | 34 | % | 13 | % | 28 | % | 8 | % |
Revenue for our Consumer segment increased $135 million or 25% in the first six months of fiscal 2023 compared with the same period of fiscal 2022, primarily due to higher TurboTax federal units, reflecting a faster forming tax season this year.
Segment operating income increased $146 million or 348% in the first six months of fiscal 2023 compared with the same period of fiscal 2022, primarily due to the increase in revenue described above and lower marketing expenses.
Because of the seasonality of our Consumer revenue, we do not believe that the revenue or operating results for the second quarter of fiscal 2023 is indicative of trends for the current fiscal year. We will not have substantially complete results for the 2022 tax season until the third quarter of fiscal 2023.
Effective August 1, 2022, our Mint offering is part of our Credit Karma segment.
| Intuit Q2 Fiscal 2023 Form 10-Q | 36 |
| Credit Karma |
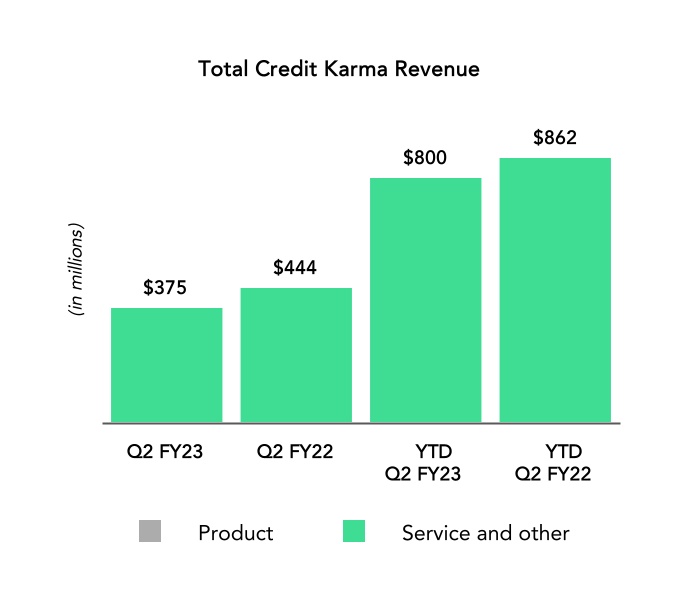
Credit Karma revenue is primarily derived from cost-per-action transactions, which include the delivery of qualified links that result in completed actions such as credit card issuances and personal loan funding; and cost-per-click and cost-per-lead transactions, which include user clicks on advertisements or advertisements that allow for the generation of leads, and primarily relate to mortgage and insurance businesses. Credit Karma also includes revenue from our Mint offering.
| (Dollars in millions) | Q2 FY23 | Q2 FY22 | % Change | YTD Q2 FY23 | YTD Q2 FY22 | % Change | |||||||||||||||||||||||||||||
| Product revenue | $ | — | $ | — | N/A | $ | — | $ | — | N/A | |||||||||||||||||||||||||
| Service and other revenue | 375 | 444 | (16) | % | 800 | 862 | (7) | % | |||||||||||||||||||||||||||
| Total segment revenue | $ | 375 | $ | 444 | (16) | % | $ | 800 | $ | 862 | (7) | % | |||||||||||||||||||||||
| % of total revenue | 12 | % | 17 | % | 14 | % | 18 | % | |||||||||||||||||||||||||||
| Segment operating income | $ | 96 | $ | 141 | (32) | % | $ | 190 | $ | 310 | (39) | % | |||||||||||||||||||||||
| % of related revenue | 26 | % | 32 | % | 24 | % | 36 | % |
Revenue for our Credit Karma segment decreased $69 million or 16% in the second quarter of fiscal 2023 and $62 million or 7% in the first six months of fiscal 2023 compared to the same periods of fiscal 2022, primarily due to decreases in our personal loan, home loan, auto insurance, and auto loan verticals driven by economic uncertainty and rising interest rates. This was partially offset by an increase in our credit card vertical.
Credit Karma segment operating income decreased $45 million or 32% in the second quarter of fiscal 2023 and $120 million or 39% in the first six months of fiscal 2023 compared to the same periods of fiscal 2022 primarily due to the decrease in revenue described above and higher expenses for staffing, partially offset by a decrease in marketing expenses.
Effective August 1, 2022, our Mint offering is part of our Credit Karma segment.
| Intuit Q2 Fiscal 2023 Form 10-Q | 37 |
| ProTax |
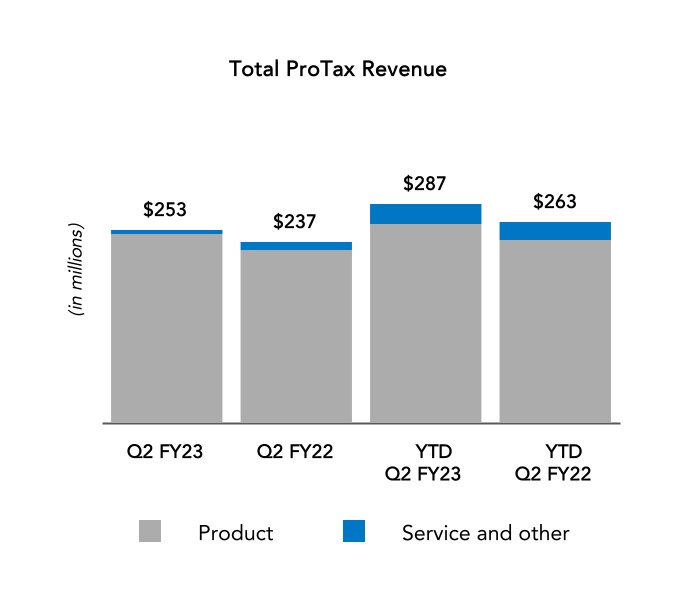
ProTax segment product revenue is derived primarily from Lacerte, ProSeries, and ProFile desktop tax preparation software products and related form updates.
ProTax segment service and other revenue is derived primarily from ProTax Online tax products, electronic tax filing service, connected services and, bank products.
| (Dollars in millions) | Q2 FY23 | Q2 FY22 | % Change | YTD Q2 FY23 | YTD Q2 FY22 | % Change | |||||||||||||||||||||||||||||
| Product revenue | $ | 246 | $ | 227 | 8 | % | $ | 260 | $ | 239 | 9 | % | |||||||||||||||||||||||
| Service and other revenue | 7 | 10 | (30) | % | 27 | 24 | 13 | % | |||||||||||||||||||||||||||
| Total segment revenue | $ | 253 | $ | 237 | 7 | % | $ | 287 | $ | 263 | 9 | % | |||||||||||||||||||||||
| % of total revenue | 8 | % | 9 | % | 5 | % | 6 | % | |||||||||||||||||||||||||||
| Segment operating income | $ | 211 | $ | 195 | 8 | % | $ | 205 | $ | 184 | 11 | % | |||||||||||||||||||||||
| % of related revenue | 83 | % | 82 | % | 71 | % | 70 | % |
Revenue for our ProTax segment revenue increased $24 million or 9% in the first six months of fiscal 2023 compared with the same period of fiscal 2022, primarily due to earlier forms availability. This shifts revenue from our third fiscal quarter to our second fiscal quarter.
Segment operating income increased 11% in the first six months of fiscal 2023 compared with the same period of fiscal 2022 primarily due to the increase in revenue described above. Expenses were relatively flat for both periods.
Because of the seasonality of our ProTax revenue, we do not believe that the revenue or operating results for the second quarter of fiscal 2023 is indicative of trends for the current fiscal year. We will not have substantially complete results for the 2022 tax season until the third quarter of fiscal 2023.
| Intuit Q2 Fiscal 2023 Form 10-Q | 38 |
| Cost of Revenue | |||||||||||||||||||||||||||||||||||||||||||||||
| (Dollars in millions) | Q2 FY23 | % of Related Revenue | Q2 FY22 | % of Related Revenue | YTD Q2 FY23 | % of Related Revenue | YTD Q2 FY22 | % of Related Revenue | |||||||||||||||||||||||||||||||||||||||
| Cost of product revenue | $ | 23 | 4 | % | $ | 20 | 4 | % | $ | 38 | 4 | % | $ | 35 | 4 | % | |||||||||||||||||||||||||||||||
| Cost of service and other revenue | 709 | 29 | % | 503 | 23 | % | 1,329 | 29 | % | 890 | 24 | % | |||||||||||||||||||||||||||||||||||
| Amortization of acquired technology | 41 | n/a | 42 | n/a | 82 | n/a | 57 | n/a | |||||||||||||||||||||||||||||||||||||||
| Total cost of revenue | $ | 773 | 25 | % | $ | 565 | 21 | % | $ | 1,449 | 26 | % | $ | 982 | 21 | % |
Our cost of revenue has three components: (1) cost of product revenue, which includes the direct costs of manufacturing and shipping or electronically downloading our desktop software products; (2) cost of service and other revenue, which includes the direct costs associated with our online and service offerings, such as costs for data processing and storage capabilities from cloud providers, ongoing production support costs, customer support costs, costs for the tax and bookkeeping experts that support our TurboTax Live and QuickBooks Live offerings, and costs related to credit score providers; and (3) amortization of acquired technology which represents the cost of amortizing developed technologies that we have obtained through acquisitions, over their useful lives.
Cost of product revenue as a percentage of product revenue was relatively consistent in the second quarter and first six months of fiscal 2023 compared with the same periods of fiscal 2022.Costs of product revenue are expensed as incurred, and we do not defer any of these costs when product revenue is deferred.
Cost of service and other revenue as a percentage of service and other revenue increased in both the second quarter and first six months of fiscal 2023 compared with the same periods of fiscal 2022. The increase is primarily due to an increase in share-based compensation expense and the decrease in revenue for Credit Karma described above.
| Operating Expenses | |||||||||||||||||||||||||||||||||||||||||||||||
| (Dollars in millions) | Q2 FY23 | % of Total Net Revenue | Q2 FY22 | % of Total Net Revenue | YTD Q2 FY23 | % of Total Net Revenue | YTD Q2 FY22 | % of Total Net Revenue | |||||||||||||||||||||||||||||||||||||||
| Selling and marketing | $ | 924 | 30 | % | $ | 942 | 35 | % | $ | 1,719 | 31 | % | $ | 1,492 | 32 | % | |||||||||||||||||||||||||||||||
| Research and development | 630 | 21 | % | 590 | 22 | % | 1,255 | 22 | % | 1,120 | 24 | % | |||||||||||||||||||||||||||||||||||
| General and administrative | 323 | 11 | % | 399 | 15 | % | 627 | 11 | % | 661 | 14 | % | |||||||||||||||||||||||||||||||||||
| Amortization of other acquired intangible assets | 121 | 4 | % | 121 | 5 | % | 242 | 4 | % | 174 | 4 | % | |||||||||||||||||||||||||||||||||||
| Total operating expenses | $ | 1,998 | 66 | % | $ | 2,052 | 77 | % | $ | 3,843 | 68 | % | $ | 3,447 | 74 | % |
Current Fiscal Quarter
Total operating expenses as a percentage of total net revenue decreased in the second quarter of fiscal 2023 compared to the same period of fiscal 2022. Total net revenue for the second quarter of fiscal 2023 increased $368 million or 14% while total operating expenses for the quarter decreased $54 million or 3%. The decrease in total operating expenses was primarily due to decreases of $108 million for marketing expenses and $56 million for professional fees related to acquisition costs, which were partially offset by increases of $82 million for staffing due to higher headcount and $34 million for share-based compensation.
Fiscal Year to Date
Total operating expenses as a percentage of total net revenue decreased in the first six months of fiscal 2023 compared to the same period of fiscal 2022. Total net revenue for the first six months of fiscal 2023 increased $958 million or 20% while total operating expenses for the period increased $396 million or 11%. The increase in total operating expenses was primarily due to increases of $226 million for staffing due to higher headcount, $117 million for share-based compensation, and $68 million for amortization of other acquired intangible assets, which were partially offset by a decrease of $65 million for professional fees related to acquisition costs.
| Intuit Q2 Fiscal 2023 Form 10-Q | 39 |
| Non-Operating Income and Expenses |
Interest Expense
Interest expense of $114 million for the first six months of fiscal 2023 consisted primarily of interest on our unsecured term loan and senior unsecured notes. Interest expense of $28 million for the first six months of fiscal 2022 consisted primarily of interest on our senior unsecured notes and unsecured term loan.
Interest and Other Income, Net
| (In millions) | Q2 FY23 | Q2 FY22 | YTD Q2 FY23 | YTD Q2 FY22 | |||||||||||||||||||
| Interest income (1) | $ | 15 | $ | — | $ | 29 | $ | 5 | |||||||||||||||
| Net gain (loss) on executive deferred compensation plan assets (2) | 11 | (4) | 1 | — | |||||||||||||||||||
| Other (3) | (3) | (1) | (2) | 40 | |||||||||||||||||||
| Total interest and other income (loss), net | $ | 23 | $ | (5) | $ | 28 | $ | 45 |
(1) Interest income in the second quarter and first six months of fiscal 2023 increased compared to the same period of fiscal 2022 primarily due to higher average invested balances and higher average interest rates.
(2) In accordance with authoritative guidance, we record gains and losses associated with executive deferred compensation plan assets in interest and other income and gains and losses associated with the related liabilities in operating expenses. The total amounts recorded in operating expenses for each period are approximately equal to the total amounts recorded in interest and other income in those periods.
(3) In the six months ended January 31, 2022, we recorded $39 million of net gains on other long-term investments.
Income Taxes
We compute our provision for or benefit from income taxes by applying the estimated annual effective tax rate to income or loss from recurring operations and adding the effects of any discrete income tax items specific to the period.
For the three and six months ended January 31, 2023, we recognized tax shortfalls on share-based compensation of $9 million and $2 million, respectively, in our provision for income taxes. For the three and six months ended January 31, 2022, we recognized excess tax benefits on share-based compensation of $62 million and $109 million, respectively, in our provision for income taxes.
Our effective tax rates for the three and six months ended January 31, 2023 were approximately 26% and 20%, respectively. Excluding discrete tax items primarily related to share-based compensation, our effective tax rate for both periods was approximately 24%. The difference from the federal statutory rate of 21% was primarily due to state income taxes and non-deductible share-based compensation, which were partially offset by the tax benefit we received from the federal research and experimentation credit.
We recorded a $70 million tax benefit on a pretax income of $30 million for the three months ended January 31, 2022. We recorded a $60 million tax benefit on a pretax income of $268 million for the six months ended January 31, 2022. Excluding discrete tax items primarily related to share-based compensation tax benefits including those mentioned above, our effective tax rate for both periods was approximately 25%. The difference from the federal statutory rate of 21% was primarily due to state income taxes and non-deductible share-based compensation, which were partially offset by the tax benefit we received from the federal research and experimentation credit.
Under the 2017 Tax Cuts & Jobs Act, research and experimental costs are no longer fully deductible and are required to be capitalized and amortized for U.S. tax purposes effective August 1, 2022. Unless this provision of the act is repealed or its effectiveness is deferred, the mandatory capitalization requirement significantly increases our deferred tax assets and cash tax payments for fiscal 2023.
The Inflation Reduction Act was enacted on August 16, 2022. This law, among other provisions, provides a corporate alternative minimum tax on adjusted financial statement income, which is effective for us beginning in fiscal 2024. We are continuing to evaluate the impact it may have on our financial position and results of operations.
In the current global tax policy environment, the U.S. and other domestic and foreign governments continue to consider, and in some cases enact, changes in corporate tax laws. As changes occur, we account for finalized legislation in the period of enactment.
| Intuit Q2 Fiscal 2023 Form 10-Q | 40 |
| LIQUIDITY AND CAPITAL RESOURCES |
| Overview |
At January 31, 2023, our cash, cash equivalents and investments totaled $2.1 billion, a decrease of $1.2 billion from July 31, 2022 due to the factors discussed under “Statements of Cash Flows” below. Our primary sources of liquidity have been cash from operations, which entails the collection of accounts receivable for products and services, the issuance of senior unsecured notes, and borrowings under our credit facilities. Our primary uses of cash have been for research and development programs, selling and marketing activities, capital projects, acquisitions of businesses, debt service costs and debt repayment, repurchases of our common stock under our stock repurchase programs, and the payment of cash dividends. As discussed in “Executive Overview – Industry Trends and Seasonality” earlier in this Item 2, our business is subject to significant seasonality. The balance of our cash, cash equivalents, and investments generally fluctuates with that seasonal pattern. We believe the seasonality of our business is likely to continue in the future.
The following table summarizes selected measures of our liquidity and capital resources at the dates indicated:
| (Dollars in millions) | January 31, 2023 | July 31, 2022 | $ Change | % Change | |||||||||||||||||||
| Cash, cash equivalents, and investments | $ | 2,071 | $ | 3,281 | $ | (1,210) | (37) | % | |||||||||||||||
| Long-term investments | $ | 108 | $ | 98 | $ | 10 | 10 | % | |||||||||||||||
| Short-term debt | $ | 501 | $ | 499 | $ | 2 | — | % | |||||||||||||||
| Long-term debt | $ | 6,576 | $ | 6,415 | $ | 161 | 3 | % | |||||||||||||||
| Working capital | $ | 894 | $ | 1,417 | $ | (523) | (37) | % | |||||||||||||||
| Ratio of current assets to current liabilities | 1.2 : 1 | 1.4 : 1 |
We have historically generated significant cash from operations and we expect to continue to do so in the future. Our cash, cash equivalents, and investments totaled $2.1 billion at January 31, 2023. None of those funds were restricted and approximately 79% of those funds were located in the U.S.
On November 1, 2021, we terminated our amended and restated credit agreement dated May 2, 2019 and entered into a credit agreement with certain institutional lenders with an aggregate principal amount of $5.7 billion, which includes a $1 billion unsecured revolving credit facility that matures on November 1, 2026 and a $4.7 billion unsecured term loan that matures on November 1, 2024. On November 1, 2021, we borrowed the full $4.7 billion under the unsecured term loan to fund a portion of the cash consideration for the acquisition of Mailchimp. See Note 6 to the financial statements in Part I, Item 1 of this Quarterly Report for more information.
Our secured revolving credit facilities are available to fund a portion of our loans to qualified small businesses. At January 31, 2023, $389 million was outstanding under both secured revolving credit facilities.
Under the 2017 Tax Cuts & Jobs Act, research and experimental costs are no longer fully deductible and are required to be capitalized and amortized for U.S. tax purposes effective August 1, 2022. Due to the delay in deductibility of research and development costs resulting from the mandatory capitalization provision, we expect our cash tax payments to significantly increase for fiscal 2023 unless this provision of the act is repealed or its effectiveness is deferred.
Based on past performance and current expectations, we believe that our cash and cash equivalents, investments, and cash generated from operations will be sufficient to meet anticipated seasonal working capital needs, capital expenditure requirements, contractual obligations, commitments, debt service requirements, and other liquidity requirements associated with our operations for at least the next 12 months.
We expect to return excess cash generated by operations to our stockholders through repurchases of our common stock and payment of cash dividends, after taking into account our operating and strategic cash needs.
We evaluate, on an ongoing basis, the merits of acquiring technology or businesses, or establishing strategic relationships with and investing in other companies. Our strong liquidity profile enables us to quickly respond to these types of opportunities.
| Intuit Q2 Fiscal 2023 Form 10-Q | 41 |
| Statements of Cash Flows |
The following table summarizes selected items from our condensed consolidated statements of cash flows for the first six months of fiscal 2023 and fiscal 2022. See the financial statements in Part I, Item 1 of this Quarterly Report for complete condensed consolidated statements of cash flows for those periods.
| Six Months Ended | |||||||||||||||||
| (Dollars in millions) | January 31, 2023 | January 31, 2022 | $ Change | ||||||||||||||
| Net cash provided by (used in): | |||||||||||||||||
| Operating activities | $ | 612 | $ | 230 | $ | 382 | |||||||||||
| Investing activities | (704) | (4,682) | 3,978 | ||||||||||||||
| Financing activities | (1,355) | 3,072 | (4,427) | ||||||||||||||
| Effect of exchange rates on cash, cash equivalents, restricted cash, and restricted cash equivalents | (1) | (6) | 5 | ||||||||||||||
| Net decrease in cash, cash equivalents, restricted cash, and restricted cash equivalents | $ | (1,448) | $ | (1,386) | $ | (62) |
| Our primary sources and uses of cash were as follows: | ||||||||
| Six Months Ended | ||||||||
| January 31, 2023 | January 31, 2022 | |||||||
| Sources of cash: • Operations • Cash received from a bank partner • Issuance of common stock under employee stock plans Uses of cash: • Repurchases of shares of our common stock • Net originations of term loans to small businesses and purchases of participating interests in loans to consumers • Payment of cash dividends and dividend rights • Payment of accrued bonuses for fiscal 2022 • Capital expenditures • Net purchases of corporate and customer fund investments | Sources of cash: • Proceeds from unsecured term loan • Net sales and maturities of corporate and customer fund investments • Operations • Issuance of common stock under employee stock plans Uses of cash: • Acquisitions of businesses • Repurchases of shares of our common stock • Payment of cash dividends and dividend rights • Payment of accrued bonuses for fiscal 2021 • Capital expenditures • Net originations of term loans to small businesses |
| Stock Repurchase Programs, Treasury Shares, and Dividends on Common Stock |
As described in Note 10 to the financial statements in Part I, Item 1 of this Quarterly Report, during the first six months of fiscal 2023, we repurchased 2.5 million shares of our common stock under repurchase programs that our Board of Directors has authorized. On August 19, 2022, our Board approved an increased authorization to purchase up to an additional $2 billion of our common stock under the existing stock repurchase program. At January 31, 2023, we had authorization from our Board of Directors to expend up to $2.5 billion for stock repurchases. We currently expect to continue repurchasing our common stock on a quarterly basis; however, future stock repurchases under the current program are at the discretion of management, and authorization of future stock repurchase programs is subject to the final determination of our Board of Directors.
We have continued to pay quarterly cash dividends on shares of our outstanding common stock. During the six months ended January 31, 2023, we declared quarterly cash dividends that totaled $1.56 per share of outstanding common stock for a total of $452 million. In February 2023, our Board of Directors declared a quarterly cash dividend of $0.78 per share of outstanding common stock payable on April 18, 2023 to stockholders of record at the close of business on April 10, 2023. We currently expect to continue paying comparable cash dividends on a quarterly basis. However, future declarations of dividends and the establishment of future record dates and payment dates are subject to the final determination of our Board of Directors.
| Intuit Q2 Fiscal 2023 Form 10-Q | 42 |
| Commitments for Senior Unsecured Notes |
In June 2020, we issued $2 billion of senior unsecured notes comprised of the following:
-
$500 million of 0.650% notes due July 2023;
-
$500 million of 0.950% notes due July 2025;
-
$500 million of 1.350% notes due July 2027; and
-
$500 million of 1.650% notes due July 2030 (together, the Notes).
Interest is payable semiannually on January 15 and July 15 of each year. At January 31, 2023, our maximum commitment for interest payments under the Notes was $106 million through the maturity dates.
The Notes are senior unsecured obligations of Intuit and rank equally with all existing and future unsecured and unsubordinated indebtedness of Intuit and are redeemable by us at any time, subject to a make-whole premium. Upon the occurrence of change of control transactions that are accompanied by certain downgrades in the credit ratings of the Notes, we will be required to repurchase the Notes at a repurchase price equal to 101% of the aggregate outstanding principal plus any accrued and unpaid interest to but not including the date of repurchase. The indenture governing the Notes requires us to comply with certain covenants. For example, the Notes limit our ability to create certain liens and enter into sale and leaseback transactions. As of January 31, 2023, we were compliant with all covenants governing the Notes. See Note 6 to the condensed consolidated financial statements in Part I, Item 1 of this Quarterly Report for more information.
| Intuit Q2 Fiscal 2023 Form 10-Q | 43 |
| Credit Facilities |
Unsecured Revolving Credit Facility and Term Loan
On November 1, 2021, we terminated our amended and restated credit agreement dated May 2, 2019 (2019 Credit Facility) and entered into a credit agreement with certain institutional lenders with an aggregate principal amount of $5.7 billion, which includes a $4.7 billion unsecured term loan that matures on November 1, 2024, and a $1 billion unsecured revolving credit facility that matures on November 1, 2026 (2021 Credit Facility).
Under the 2021 Credit Facility we may, subject to certain customary conditions including lender approval, on one or more occasions increase commitments under the unsecured revolving credit facility in an amount not to exceed $250 million in the aggregate and may extend the maturity date up to two times. Advances under the unsecured revolving credit facility accrue interest at rates that are equal to, at our election, either (i) the alternate base rate plus a margin that ranges from 0.0% to 0.1%, or (ii) the Secured Overnight Finance Rate (SOFR) plus a margin that ranges from 0.69% to 1.1%. Actual margins under either election will be based on our senior debt credit ratings. At January 31, 2023, no amounts were outstanding under the unsecured revolving credit facility. We monitor counterparty risk associated with the institutional lenders that are providing the credit facility.
On November 1, 2021, we borrowed the full $4.7 billion under the unsecured term loan to fund a portion of the cash consideration for the acquisition of Mailchimp. Under this agreement we may, subject to certain customary conditions, on one or more occasions increase commitments under the term loan in an amount not to exceed $400 million in the aggregate. The term loan accrues interest at rates that are equal to, at our election, either (i) the alternate base rate plus a margin that ranges from 0.0%to 0.125%, or (ii) SOFR plus a margin that range from 0.625% to 1.125%. Actual margins under either election are based on our senior debt credit ratings. At January 31, 2023, $4.7 billion was outstanding under the term loan.
The 2021 Credit Facility includes customary affirmative and negative covenants, including financial covenants that require us to maintain a ratio of total gross debt to annual earnings before interest, taxes, depreciation and amortization (EBITDA) of not greater than 3.25 to 1.00 and a ratio of annual EBITDA to annual interest expense of not less than 3.00 to 1.00 as of the last day of each fiscal quarter. As of January 31, 2023, we were compliant with all required covenants.
Secured Revolving Credit Facilities
On February 19, 2019, a subsidiary of Intuit entered into a secured revolving credit facility with a lender to fund a portion of our loans to qualified small businesses (the 2019 Secured Facility). The 2019 Secured Facility is secured by cash and receivables of the subsidiary and is non-recourse to Intuit Inc. We have entered into several amendments to this facility, most recently on July 18, 2022, primarily to increase the facility limit, extend the commitment term and maturity date and update the benchmark interest rate. Under the amended 2019 Secured Facility, the facility limit is $500 million, of which $300 million is committed and $200 million is uncommitted. Advances accrue interest at adjusted daily simple SOFR plus 1.5%. Unused portions of the committed credit facility accrue interest at a rate ranging from 0.25% to 0.75%, depending on the total unused committed balance. The commitment term is through July 18, 2025, and the final maturity date is July 20, 2026. The agreement includes certain affirmative and negative covenants, including financial covenants that require the subsidiary to maintain specified financial ratios. As of January 31, 2023, we were compliant with all required covenants. At January 31, 2023, $301 million was outstanding under the 2019 Secured Facility and the weighted-average interest rate was 5.91%. The outstanding balance is secured by cash and receivables of the subsidiary totaling $823 million.
On October 12, 2022, another subsidiary of Intuit entered into a secured revolving credit facility with a lender to fund a portion of our loans to qualified small businesses (the 2022 Secured Facility). The 2022 Secured Facility is secured by cash and receivables of the subsidiary and is non-recourse to Intuit Inc. Under the agreement, the facility limit is $500 million, of which $150 million is committed and $350 million is uncommitted. Advances accrue interest at SOFR plus 1.3%. Unused portions of the committed credit facility accrue interest at a rate ranging from 0.2% to 0.4%, depending on the total unused committed balance. The commitment term is through October 12, 2024, and the final maturity date is October 13, 2025. The agreement includes certain affirmative and negative covenants, including financial covenants that require the subsidiary to maintain specified financial ratios. As of January 31, 2023, we were compliant with all required covenants. At January 31, 2023, $88 million was outstanding under the 2022 Secured Facility and the weighted-average interest rate was 5.75%, which includes the interest on the unused committed portion. The outstanding balance is secured by cash and receivables of the subsidiary totaling $242 million.
| Cash Held by Foreign Subsidiaries |
Our cash, cash equivalents, and investments totaled $2.1 billion at January 31, 2023. Approximately 21% of those funds were held by our foreign subsidiaries and subject to repatriation tax considerations. These foreign funds were located primarily in the United Kingdom, India, and Canada. We do not expect to pay incremental U.S. taxes on repatriation. We have recorded income tax expense for Canada, India, and Israel withholding taxes on earnings that are not permanently reinvested. In the event that funds from foreign operations are repatriated to the United States, we would pay withholding taxes at that time.
| Intuit Q2 Fiscal 2023 Form 10-Q | 44 |
Contractual Obligations
We presented our contractual obligations at July 31, 2022 in our Annual Report on Form 10-K for the fiscal year then ended. There were no material changes outside the ordinary course of business to our contractual obligations during the six months ended January 31, 2023.
Recent Accounting Pronouncements
For a description of recent accounting pronouncements, if any, and the potential impact of these pronouncements on our condensed consolidated financial statements, see Note 1 to the financial statements in Part I, Item 1 of this Quarterly Report.
Previous: Item 1. FINANCIAL STATEMENTS · Next: Item 3. QUANTITATIVE AND QUALITATIVE DISCLOSURES ABOUT MARKET RISK