 filings.tools
Item 5. MARKET FOR REGISTRANT’S COMMON EQUITY, RELATED STOCKHOLDER MATTERS AND ISSUER PURCHASES OF EQUITY SECURITIES
392K characters. Original on sec.gov · Markdown
Item 5. MARKET FOR REGISTRANT’S COMMON EQUITY, RELATED STOCKHOLDER MATTERS AND ISSUER PURCHASES OF EQUITY SECURITIES
As of the filing of this Annual Report on Form 10-K, the Company’s common shares are traded on the New York Stock Exchange (NYSE: IP). As of February 10, 2023, there were approximately 8,608 record holders of common stock of the Company.
We pay regular quarterly cash dividends and expect to continue to pay regular quarterly cash dividends in the foreseeable future, though each quarterly dividend payment is subject to review and approval by our Board of Directors.
The table below presents information regarding the Company’s purchases of its equity securities for the time periods presented.
PURCHASES OF EQUITY SECURITIES BY THE ISSUER AND AFFILIATED PURCHASERS.
| Period | Total Number of Shares Purchased (a) | Average Price Paid per Share | Total Number of Shares (or Units) Purchased as Part of Publicly Announced Programs | Maximum Number (or Approximate Dollar Value) of Shares that May Yet Be Purchased Under the Plans or Programs (in billions) | ||||||||||
| October 1, 2022 - October 31, 2022 | 12,056 | $ | 31.70 | — | $ | 3.35 | ||||||||
| November 1, 2022 - November 30, 2022 | 3,075,160 | 34.83 | 3,074,156 | 3.25 | ||||||||||
| December 1, 2022 - December 31, 2022 | 2,314,920 | 36.30 | 2,314,920 | 3.16 | ||||||||||
| Total | 5,402,136 |
*(a)*13,061 shares were acquired from employees or board members as a result of share withholdings to pay income taxes under the Company's restricted stock program. The remainder were purchased under a share repurchase program. As of December 31, 2022 approximately $3.16 billion aggregate shares of our common stock remained authorized for repurchase under a previous Board authorization. This authorization was increased by our Board on October 11, 2022, up to a total of $3.35 billion shares. This repurchase program does not have an expiration date.
PERFORMANCE GRAPH
The performance graph shall not be deemed "soliciting material" or to be "filed" with the Commission or subject to Regulation 14A or 14C under, or to the liabilities of Section 18 of, the Exchange Act of 1934, as amended and will not be deemed to be incorporated by reference into any filing of the Company under the Securities Act of 1933, as amended, or the Exchange Act, except to the extent the Company specifically incorporates it by reference into such a filing.
The following line graph compares a $100 investment in Company stock on December 31, 2017 with a $100 investment in our Peer Group and the S&P Composite-500 Stock Index (S&P 500 Index) also made at market close on December 31, 2017. The graph portrays total return, 2017-2022, assuming reinvestment of all dividends.
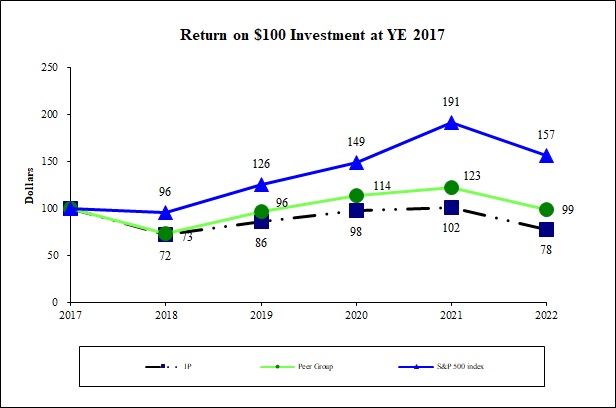
- The companies included in the Peer Group are DS Smith PLC, Klabin S.A., Mondi Group, Packaging Corporation of America, Smurfit Kappa Group, Stora Enso Group, and WestRock Company.
2)Returns are calculated in $USD
ITEM 7. MANAGEMENT’S DISCUSSION AND ANALYSIS OF FINANCIAL CONDITION AND RESULTS OF OPERATIONS
The following discussion and analysis of our financial condition and results of operations should be read in conjunction with our consolidated financial statements and related notes included in “Financial Statements and Supplementary Data” of this Annual Report on Form 10-K. In addition to historical consolidated financial information, the following discussion
contains forward-looking statements that reflect our plans, estimates, and beliefs that involve significant risks and uncertainties. Our actual results could differ materially from those discussed in the forward-looking statements. Factors that could cause or contribute to those differences include those discussed below and elsewhere in this Annual Report on Form 10-K, particularly in “Risk Factors” and “Forward-Looking Statements.”
The following generally discusses 2022 and 2021 items and year-to-year comparisons between 2022 and 2021. Discussion of historical items in 2020, and
year-to-year comparisons between 2021 and 2020, can be found in our Annual Report on Form 10-K for the fiscal year ended December 31, 2021, filed with the SEC on February 18, 2022, under Part II, Item 7, Management’s Discussion and Analysis of Financial Condition and Results of Operations.
Full-year 2022 net earnings attributable to shareholders were $1.5 billion ($4.10 per diluted share) compared with $1.8 billion ($4.47 per diluted share) for full-year 2021.
During 2022, International Paper grew revenue and earnings, driven by solid commercial and operational performance, while facing significant inflation and lower demand. Our businesses generated improved earnings as profit improvement initiatives and price realization offset significant inflationary cost headwinds. We continued to make solid progress in our Building a Better IP initiatives, delivering $250 million of earnings benefits through initiatives focused on lowering our cost structure and accelerating profitable growth. As a result, we exceeded our full-year target and have strong momentum going forward. We made strategic investments, primarily in our Industrial Packaging business, in support of profitable growth and will continue to make such investments to grow earnings and cash generation by building additional capabilities and capacity in our U.S. box system. We made significant progress toward achieving value-creating returns in our Global Cellulose Fibers business by delivering $100 million of earnings growth in 2022. The business expects to continue the earnings improvement in 2023. We generated full-year cash from operations of $2.2 billion and free cash flow of $1.2 billion. Our continued solid cash generation enabled us to return $1.93 billion to shareholders, including $1.26 billion in share repurchases and $673 million in dividend payments. Finally, we reached agreement to sell our 50% interest in Ilim SA to our joint venture partners for $484 million. Additionally, our partners have expressed interest in purchasing our shares in JSC Ilim Group for $24 million. Upon sale of our interests in the Ilim joint venture, which are subject to regulatory approval, we will no longer have investments in Russia.
Comparing our 2022 results to 2021, price and mix improved significantly for both the North American Industrial Packaging and Global Cellulose Fibers businesses, with strong price realization across all of our channels, along with the benefits of commercial initiatives. Volume was lower in our North American Industrial Packaging business following stronger packaging demand in 2021 as consumers had pulled forward purchases of goods during the pandemic. In
2022, demand was also negatively impacted as consumers shifted priorities toward both non-discretionary goods as well as services while dealing with inflation. Operating costs were negatively impacted by lower volumes in our North American Industrial Packaging business. High inflation on materials and services also negatively impacted operating costs in our North American Industrial Packaging and Global Cellulose Fibers businesses. Rising supply chain costs negatively impacted both businesses during 2022. Higher operating costs were partially offset by improved mill performance and reliability. Maintenance outage expense increased, as planned, impacted by high inflation on equipment, parts and contracted services. Input costs rose sharply across nearly all categories, with higher energy and fuel costs being the leading drivers. Corporate expenses were favorable driven by overhead streamlining initiatives.
Looking ahead to the first quarter 2023, as compared to the fourth quarter 2022, in our Industrial Packaging business, we expect price and mix to be lower based on prior price index movements and lower average export prices. Volume is expected to be higher in the first quarter 2023 due to four more shipping days in North America, partially offset by normal seasonal declines in North America. Operations and costs are expected to decrease earnings due to the non-repeat of favorable one-time items in the fourth quarter 2022, seasonally higher energy consumption and additional inflation on materials and services. Maintenance outage expense is expected to be significantly higher as the first quarter will be our highest outage quarter this year, representing about 40% of total planned outage costs in 2023. Input costs are expected to improve on lower average costs for energy, fuel and fiber. In our Global Cellulose Fibers business, we expect price and mix to improve. We expect volume to decrease due to seasonally lower demand and customer inventory destocking in response to increased supply chain velocity. Operations and costs are expected to increase on the non-repeat of a favorable one-time items in the fourth quarter 2022. Operations and costs will also be impacted by higher unabsorbed fixed costs due to lower volumes, seasonally higher energy consumption and additional inflation on materials and services. Maintenance outage expense is expected to increase as the first quarter 2023 will also be Global Cellulose Fibers highest maintenance outage quarter in 2023. Input costs are expected to decrease driven by lower energy and fiber.
Looking to full-year 2023, we believe we have significant opportunities to reduce high marginal costs across our system and capture further benefits from our Building a Better IP initiatives. The Building a Better IP initiatives are focused on continuing to
invest in projects to drive structural cost reduction through efficiency improvements and accelerating profitable growth. We expect continued momentum from these initiatives as we move into 2023 including meaningful earnings growth in our Global Cellulose Fibers business as a result of our commercial strategy execution. We expect cash from operations ranging from $1.9 billion to $2.3 billion with free cash flow of $0.9 billion to $1.1 billion. Included in both ranges is approximately $190 million for the tax settlement payment related to our timber monetization transaction. With respect to our capital allocation framework, we are targeting capital expenditures of $1.0 billion to $1.2 billion with increased investments in our US box system to build additional capabilities and support profitable growth with our customers. As previously mentioned, we returned approximately $1.9 billion of cash to shareowners in 2022. In October 2022, our board of directors authorized an additional $1.5 billion of share repurchases with a total current authorization of approximately $3.2 billion. Going forward, we are committed to returning cash through maintaining our dividend and through opportunistic share repurchases.
Adjusted Operating Earnings and Adjusted Operating Earnings Per Share are non-GAAP measures and are defined as net earnings (loss) attributable to International Paper (a GAAP measure) excluding discontinued operations, net special items and non-operating pension expense (income). Net earnings (loss) and Diluted earnings (loss) per share attributable to common shareholders are the most directly comparable GAAP measures. The Company calculates Adjusted Operating Earnings by excluding the after-tax effect of discontinued operations, non-operating pension expense (income) and items considered by management to be unusual (net special items) from net earnings (loss) attributable to shareholders reported under GAAP. Adjusted Operating Earnings Per Share is calculated by dividing Adjusted Operating Earnings by diluted average shares of common stock outstanding. Management uses this measure to focus on on-going operations, and believes that it is useful to investors because it enables them to perform meaningful comparisons of past and present consolidated operating results from continuing operations. The Company believes that using this information, along with the most direct comparable GAAP measure, provides for a more complete analysis of the results of operations.
The following are reconciliations of Earnings (loss) attributable to common shareholders to Adjusted operating earnings (loss) attributable to common shareholders on a total and per share basis. Additional detail is provided later in this Form 10-K regarding the net special items referenced in the charts below:
| In millions | 2022 | 2021 | ||||||
| Net Earnings (Loss) Attributable to Shareholders | $ | 1,504 | $ | 1,752 | ||||
| Less - Discontinued operations, net of taxes (gain) loss | 237 | (941) | ||||||
| Earnings (Loss) from Continuing Operations | 1,741 | 811 | ||||||
| Add back - Non-operating pension expense (income) | (192) | (200) | ||||||
| Add back - Net special items expense (income) | 233 | 371 | ||||||
| Income tax effect - Non-operating pension and special items expense | (614) | (38) | ||||||
| Adjusted Operating Earnings (Loss) Attributable to Shareholders | $ | 1,168 | $ | 944 |
| 2022 | 2021 | |||||||
| Diluted Earnings (Loss) Per Share Attributable to Shareholders | $ | 4.10 | $ | 4.47 | ||||
| Less - Discontinued operations, net of taxes (gain) loss per share | 0.64 | (2.40) | ||||||
| Diluted Earnings (Loss) Per Share from Continuing Operations | 4.74 | 2.07 | ||||||
| Add back - Non-operating pension expense (income) per share | (0.52) | (0.51) | ||||||
| Add back - Net special items expense (income) per share | 0.63 | 0.94 | ||||||
| Income tax effect per share - Non-operating pension and special items expense | (1.67) | (0.09) | ||||||
| Adjusted Operating Earnings (Loss) Per Share Attributable to Shareholders | $ | 3.18 | $ | 2.41 |
| In millions | Three Months Ended December 31, 2022 | Three Months Ended September 30, 2022 | Three Months Ended December 31, 2021 | |||||||||||||||||
| Net Earnings (Loss) Attributable to Shareholders | $ | (318) | $ | 951 | $ | 107 | ||||||||||||||
| Less - Discontinued operations, net of taxes (gain) loss | 489 | (64) | (58) | |||||||||||||||||
| Earnings (Loss) from Continuing Operations | 171 | 887 | 49 | |||||||||||||||||
| Add back - Non-operating pension expense (income) | (48) | (48) | (47) | |||||||||||||||||
| Add back - Net special items expense (income) | 144 | 117 | 295 | |||||||||||||||||
| Income tax effect - Non-operating pension and special items expense | 42 | (656) | (62) | |||||||||||||||||
| Adjusted Operating Earnings (Loss) Attributable to Shareholders | $ | 309 | $ | 300 | $ | 235 |
| Three Months Ended December 31, 2022 | Three Months Ended September 30, 2022 | Three Months Ended December 31, 2021 | ||||||||||||||||||
| Diluted Earnings (Loss) Per Share Attributable to Shareholders | $ | (0.90) | $ | 2.64 | $ | 0.28 | ||||||||||||||
| Less - Discontinued operations, net of taxes (gain) loss per share | 1.38 | (0.18) | (0.15) | |||||||||||||||||
| Diluted Earnings (Loss) Per Share from Continuing Operations | 0.48 | 2.46 | 0.13 | |||||||||||||||||
| Add back - Non-operating pension expense (income) per share | (0.13) | (0.13) | (0.12) | |||||||||||||||||
| Add back - Net special items expense (income) per share | 0.41 | 0.32 | 0.77 | |||||||||||||||||
| Income tax effect per share - Non-operating pension and special items expense | 0.11 | (1.82) | (0.17) | |||||||||||||||||
| Adjusted Operating Earnings (Loss) Per Share Attributable to Shareholders | $ | 0.87 | $ | 0.83 | $ | 0.61 |
Cash provided by operations, including discontinued operations, totaled $2.2 billion and $2.0 billion for 2022 and 2021, respectively. The Company generated free cash flow of approximately $1.2 billion in 2022 and $1.5 billion in 2021. Free Cash Flow is a non-GAAP measure and the most directly comparable GAAP measure is cash provided by operations. Management utilizes this measure in connection with managing our business and believes that free cash flow is useful to investors as a liquidity measure because it measures the amount of cash generated that is available, after reinvesting in the business, to maintain a strong balance sheet, pay dividends, repurchase stock, service debt and make investments for future growth. It should not be inferred that the entire free cash flow amount is available for discretionary expenditures. By adjusting for certain items that are not indicative of the Company's ongoing underlying operational performance, we believe that free cash flow also enables investors to perform meaningful comparisons between past and present periods.
The following are reconciliations of free cash flow to cash provided by operations:
| In millions | 2022 | 2021 | ||||||
| Cash provided by operations | $ | 2,174 | $ | 2,030 | ||||
| Adjustments: | ||||||||
| Cash invested in capital projects, net of insurance recoveries | (931) | (549) | ||||||
| Free Cash Flow | $ | 1,243 | $ | 1,481 |
| In millions | Three Months Ended December 31, 2022 | Three Months Ended September 30, 2022 | Three Months Ended December 31, 2021 | ||||||||
| Cash provided by operations | $ | 761 | $ | 435 | $ | 107 | |||||
| Adjustments: | |||||||||||
| Cash invested in capital projects, net of insurance recoveries | (322) | (238) | (201) | ||||||||
| Free Cash Flow | $ | 439 | $ | 197 | $ | (94) |
The non-GAAP financial measures presented in this Form 10-K as referenced above have limitations as analytical tools and should not be considered in isolation or as a substitute for an analysis of our results calculated in accordance with GAAP. In addition, because not all companies utilize identical calculations, the Company’s presentation of non-GAAP measures in this Form 10-K may not be comparable to similarly titled measures disclosed by other companies, including companies in the same industry as the Company.
RESULTS OF OPERATIONS
Business Segment Operating Profits are used by International Paper’s management to measure the earnings performance of its businesses. Management uses this measure to focus on on-going operations and believes that it is useful to investors because it enables them to perform meaningful comparisons of past and present operating results. International Paper believes that using this information, along with net earnings, provides a more complete analysis of the results of operations by year.
Business Segment Operating Profits are defined as earnings (loss) from continuing operations before income taxes and equity earnings, but including the impact of less than wholly owned subsidiaries, and excluding interest expense, net, corporate expenses, net, corporate net special items, business net special items and non-operating pension expense. Business Segment Operating Profits is a measure reported to our management for purposes of making decisions about allocating resources to our business segments and assessing the performance of our business segments and is presented in our financial statement footnotes in accordance with ASC 280.
International Paper operates in two segments: Industrial Packaging and Global Cellulose Fibers. The Company recently announced an agreement to sell its Ilim equity investment and, as a result, all current and historical results of the Ilim investment are presented as Discontinued Operations, net of taxes and our equity investment is no longer a separate reportable industry segment. During 2021, as a result of the spin-off of our Printing Papers business along with certain mixed-use coated paperboard and pulp businesses and the associated reclassification of these businesses to Discontinued Operations, we no longer have a Printing Paper segment and the remaining sales and operating profits previously reported in the Printing Papers business have been reclassified for segment reporting for all periods presented.
The following table presents a comparison of net earnings (loss) from continuing operations attributable to International Paper Company to its total Business Segment Operating Profit:
| In millions | 2022 | 2021 | ||||||
| Net Earnings (Loss) from Continuing Operations Attributable to International Paper Company | $ | 1,741 | $ | 811 | ||||
| Add back (deduct) | ||||||||
| Income tax provision (benefit) | (236) | 188 | ||||||
| Equity (earnings) loss, net of taxes | 6 | (2) | ||||||
| Noncontrolling interests, net of taxes | — | 2 | ||||||
| Earnings (Loss) From Continuing Operations Before Income Taxes and Equity Earnings | 1,511 | 999 | ||||||
| Interest expense, net | 325 | 337 | ||||||
| Adjustment for less than wholly owned subsidiaries | (5) | (5) | ||||||
| Corporate expenses, net | 34 | 134 | ||||||
| Corporate net special items | 99 | 352 | ||||||
| Business net special items | 76 | 18 | ||||||
| Non-operating pension expense (income) | (192) | (200) | ||||||
| $ | 1,848 | $ | 1,635 | |||||
| Business Segment Operating Profit (Loss): | ||||||||
| Industrial Packaging | $ | 1,742 | $ | 1,638 | ||||
| Global Cellulose Fibers | 106 | (3) | ||||||
| Total Business Segment Operating Profit | $ | 1,848 | $ | 1,635 |
Business Segment Operating Profit in 2022 was $213 million higher than in 2021 as the benefits from higher average sales price realizations net of an unfavorable mix ($2.2 billion) were partially offset by lower sales volumes ($160 million), higher operating costs ($657 million), higher input costs ($1.1 billion) and higher maintenance outage costs ($70 million).

The principal changes in operating profit by business segment were as follows:
-
Industrial Packaging’s operating profit of $1.7 billion was $104 million higher than in 2021 as the benefits of higher average sales price net of an unfavorable mix were partially offset by lower sales volumes, higher operating costs, higher input costs and higher maintenance outage costs.
-
Global Cellulose Fibers' operating profit (loss) improved $109 million to $106 million profit compared with 2021 as the benefits of higher average sales price, favorable mix and sales volumes were partially offset by higher operating costs, higher input costs and higher maintenance outage costs.
LIQUIDITY AND CAPITAL RESOURCES
Including discontinued operations, International Paper generated $2.2 billion of cash flow from operations for the year ended December 31, 2022, compared with $2.0 billion in 2021. Capital spending for 2022 totaled $931 million, or 90% of depreciation and amortization expense. Our liquidity position remains strong, supported by approximately $2.0 billion of credit facilities.
While the operating results for International Paper’s various business segments are driven by a number of business-specific factors, changes in International Paper’s operating results are closely tied to changes in general economic conditions in North America, Europe, Latin America, North Africa and the Middle East.
Factors that impact the demand for our products include industrial non-durable goods production, consumer preferences, consumer spending and movements in currency exchange rates.
Product prices are affected by a variety of factors including general economic trends, inventory levels, currency exchange rate movements and worldwide capacity utilization. In addition to these revenue-related factors, net earnings are impacted by various cost drivers, the more significant of which include changes in raw material costs, principally wood, recovered fiber and chemical costs; energy costs; freight costs; mill outage costs; salary and benefits costs, including pensions; and manufacturing conversion costs.
The following is a discussion of International Paper’s consolidated results of operations for the year ended
December 31, 2022, and the major factors affecting these results compared to 2021.
For the year ended December 31, 2022, International Paper reported net sales of $21.2 billion, compared with $19.4 billion in 2021. International net sales (based on the location of the seller and including U.S. exports) totaled $5.9 billion or 28% of total sales in 2022. This compares with international net sales of $5.2 billion in 2021.
Full year 2022 net earnings attributable to International Paper Company totaled $1.5 billion ($4.10 per diluted share), compared with net earnings of $1.8 billion ($4.47 per diluted share) in 2021. Amounts in 2022 and 2021 include the results of discontinued operations.
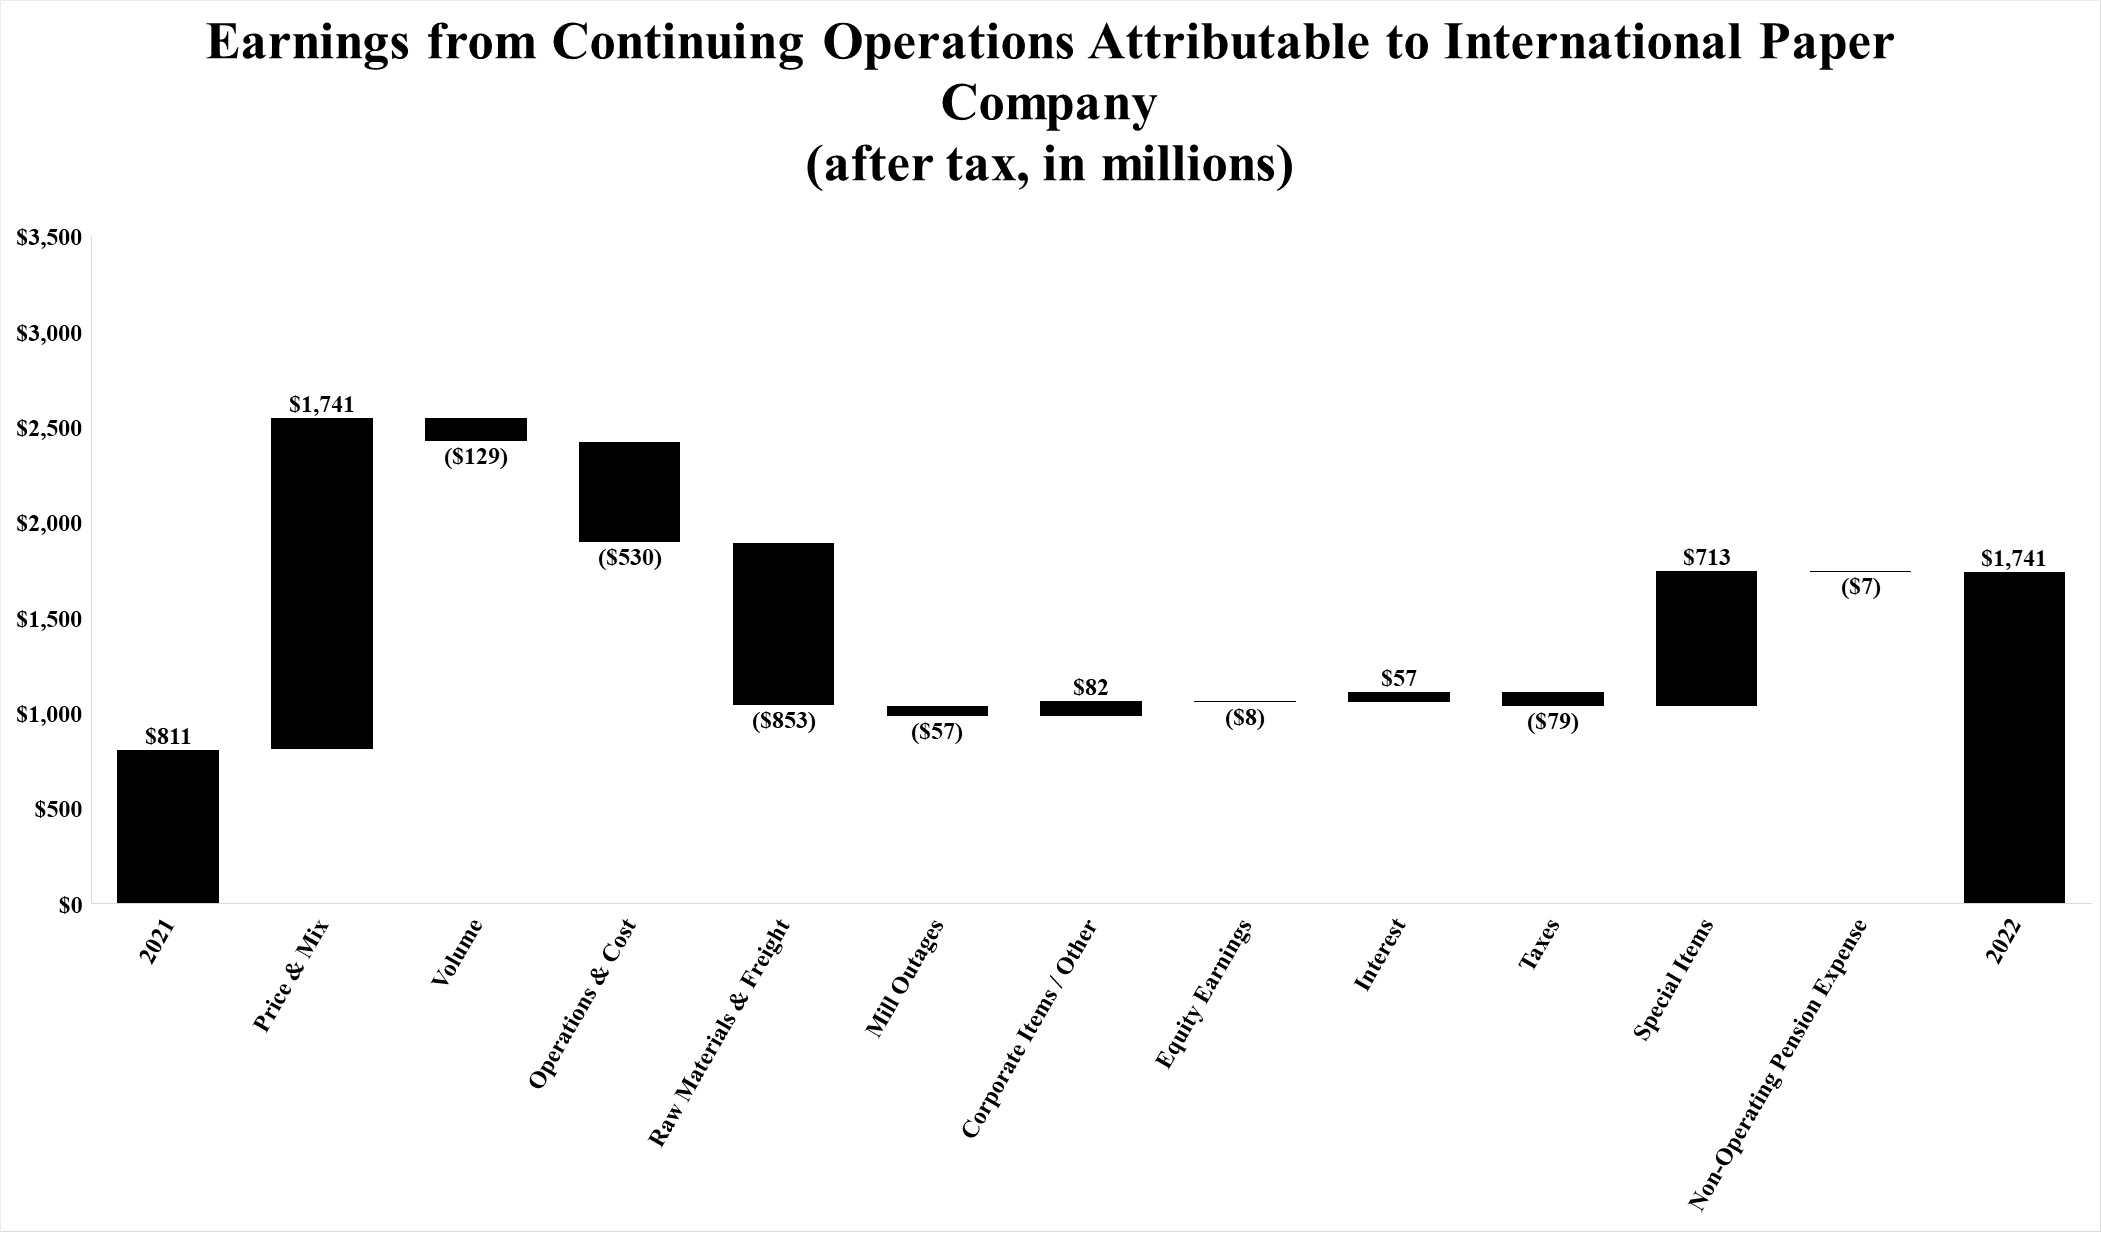
Earnings from continuing operations attributable to International Paper Company after taxes in 2022 and 2021 were as follows:
| In millions | 2022 | 2021 | ||||||||||||
| Earnings from continuing operations attributable to International Paper Company | $ | 1,741 | (a) | $ | 811 | (b) |
*(a)*Includes $429 million of net special items income and $144 million of non-operating pension income.
*(b)*Includes $284 million of net special items charges and $151 million of non-operating pension income.
Compared with 2021, the benefits from higher average sales price net of an unfavorable mix ($1.7 billion), lower corporate and other costs ($82 million) and lower net interest expense ($57 million) were partially offset by lower sales volumes ($129 million), higher operating costs ($530 million), higher input costs ($853 million), higher maintenance outage costs ($57 million) and higher tax expense ($79 million). In addition, 2022 results included lower equity earnings, net of taxes. Our Building a Better IP initiatives delivered $250 million of earnings in 2022 primarily though our lean effectiveness initiative which streamlined our corporate and staff functions and our strategy acceleration initiative to deliver profitable growth through commercial and investment excellence.
See Business Segment Results on pages 32 and 33 of Item 7. Management's Discussion and Analysis of Financial Condition and Results of Operations for a discussion of the impact of these factors by segment.
DISCONTINUED OPERATIONS
The Company recently announced it has reached an agreement to sell its equity investment in Ilim and has also received an indication of interest to purchase its
equity investment in Ilim Group. All current and historical results of the Ilim investment are presented as Discontinued Operations, net of taxes in the consolidated statement of operations. This transaction is discussed further in Note 11 - Equity Method Investments on pages 66 through 68 of Item 8. Financial Statements and Supplementary Data for further discussion.
On October 1, 2021, the Company completed the spin-off of its Printing Papers business along with certain mixed-use coated paperboard and pulp businesses in North America, France and Russia into a standalone, publicly-traded company, Sylvamo Corporation. On August 6, 2021, the Company completed the sale of its Kwidzyn, Poland mill which included the pulp and paper mill in Kwidzyn and supporting functions. As a result of the Sylvamo Corporation spin-off and sale of Kwidzyn, the Company no longer had a Printing Papers business segment and historical results reflect the Kwidzyn and the Printing Papers business and other businesses conveyed to Sylvamo Corporation as discontinued operations. See Note 8 - Divestitures on pages 62 through 64 of Item 8. Financial Statements and Supplementary Data for further discussion.
Discontinued operations include the equity and operating earnings of the businesses noted above. Discontinued operations also includes an after-tax net special items loss of $533 million in 2022 and gain of $330 million in 2021.
Details of these (gains) and losses were as follows:
| Special Items in Discontinued Operations | ||||||||||||||
| In millions | 2022 | 2021 | ||||||||||||
| Ilim equity method investment impairment | $ | 533 | $ | — | ||||||||||
| Printing Papers spin-off expenses | — | 92 | ||||||||||||
| Gain on sale of Kwidzyn, Poland mill | — | (344) | ||||||||||||
| Gain on sale of La Mirada, CA distribution center | — | (65) | ||||||||||||
| Foreign value-added tax credit (including interest) | — | (37) | ||||||||||||
| Foreign and state taxes related to Printing Papers spin-off | — | 24 | ||||||||||||
| Total | $ | 533 | $ | (330) |
INCOME TAXES
A net income tax benefit from continuing operations of $236 million was recorded for 2022, including a tax benefit of $604 million related to the settlement of the timber monetization restructuring tax matter, a tax
benefit of $66 million related to the tax-free exchange of our shares of Sylvamo Corporation and tax expense of $45 million related to a foreign deferred tax valuation allowance. Excluding these items, a $37 million net tax benefit for other special items and a $48 million tax expense related to non-operating pension income, the operational tax provision (non-GAAP) was $378 million, or 24% of pre-tax earnings before equity earnings.
A net income tax provision from continuing operations of $188 million was recorded for 2021. Excluding a $87 million net tax benefit for other special items and a $49 million tax expense related to non-operating pension income, the operational tax provision (non-GAAP) was $226 million, or 19% of pre-tax earnings before equity earnings.
The operational tax provision and rate are non-GAAP measures and are calculated by adjusting the income tax provision from continuing operations and rate to exclude net special items and non-operating pension expense (income). Management adjusts the income tax provision and rate to account for non-recurring, non-operational items as we believe it provides a more meaningful comparison of the income tax rate between past and present periods.
INTEREST EXPENSE, EQUITY EARNINGS, NET OF TAXES AND NONCONTROLLING INTEREST
Net corporate interest expense totaled $325 million in 2022 and $337 million in 2021. Net interest expense in 2022 includes $58 million of interest expense related to the timber monetization restructuring tax matter. The decrease in 2022 compared with 2021 was due to lower average outstanding debt.
Equity earnings, net of taxes were a loss of $6 million and income of $2 million in 2022 and 2021, respectively.
Net earnings attributable to noncontrolling interests were $2 million in 2021. There were no net earnings attributable to noncontrolling interests in 2022.
SPECIAL ITEMS
Pre-tax special items (excluding interest expense) included in continuing operations totaling $175 million and $371 million were recorded in 2022 and 2021, respectively. Details of these charges were as follows:
| Special Items | ||||||||||||||
| In millions | 2022 | 2021 | ||||||||||||
| Business Segments | ||||||||||||||
| Restructuring and other, net | $ | — | $ | 25 | ||||||||||
| Net (gains) losses on sales and impairments of businesses | 76 | (7) | ||||||||||||
| Other | — | 1 | (a) | |||||||||||
| 76 | 19 | |||||||||||||
| Corporate | ||||||||||||||
| Restructuring and other, net | $ | 89 | $ | 484 | ||||||||||
| Environmental remediation reserve adjustments | 63 | 10 | ||||||||||||
| Legal reserve adjustments | (4) | (5) | ||||||||||||
| Foreign currency cumulative translation loss related to sale of equity method investment | 10 | — | ||||||||||||
| Sylvamo investment fair value adjustment | (65) | 32 | ||||||||||||
| Real estate - office impairment | — | 21 | ||||||||||||
| Gain on sale of portion of equity investment in Graphic Packaging | — | (204) | ||||||||||||
| Other | 6 | 14 | ||||||||||||
| 99 | 352 | |||||||||||||
| Total | $ | 175 | $ | 371 |
(a) Allocation of income to noncontrolling interest associated with the sale of our EMEA Packaging business in Turkey.
Net (gains) losses on sales and impairments of businesses included in special items totaled a pre-tax loss of $76 million and gain of $7 million in 2022 and 2021, respectively. Details of these (gains) losses were as follows:
| Net (Gains) Losses on Sales and Impairments of Businesses | ||||||||||||||
| In millions | 2022 | 2021 | ||||||||||||
| EMEA Packaging goodwill impairment | $ | 76 | $ | — | ||||||||||
| EMEA Packaging - Turkey | — | (7) | ||||||||||||
| Total | $ | 76 | $ | (7) |
See Note 8 Divestitures on pages 62 through 64 of Item 8. Financial Statements and Supplementary Data for further discussion.
International Paper continually evaluates its operations for improvement opportunities targeted to (a) focus our portfolio on our core businesses, (b) realign capacity to operate fewer facilities with the same revenue capability, (c) close high cost, unprofitable facilities, and (d) reduce costs. Additionally, the Company is committed to its capital
allocation framework to maintain a strong balance sheet including reducing debt to maximize value creation and maintain our current investment grade credit rating.
During 2022 and 2021, pre-tax restructuring and other charges, net, totaling $89 million and $509 million were recorded. Details of these charges were as follows:
| Restructuring and Other, Net | ||||||||||||||
| In millions | 2022 | 2021 | ||||||||||||
| Business Segments | ||||||||||||||
| Building a Better IP initiative | $ | — | $ | 14 | (a) | |||||||||
| EMEA Packaging optimization | — | 12 | ||||||||||||
| Other | — | (1) | (b) | |||||||||||
| — | 25 | |||||||||||||
| Corporate | ||||||||||||||
| Early debt extinguishment costs (see Note 16) | $ | 93 | $ | 461 | ||||||||||
| Building a Better IP initiative | — | 15 | ||||||||||||
| Other | (4) | 8 | ||||||||||||
| 89 | 484 | |||||||||||||
| Total | $ | 89 | $ | 509 |
(a) Includes $11 million recorded in the Industrial Packaging business segment and $3 million recorded in the Global Cellulose Fibers business segment.
(b) Recorded in the Industrial Packaging business segment.
DESCRIPTION OF BUSINESS SEGMENTS
International Paper’s business segments discussed below are consistent with the internal structure used to manage these businesses. All segments are differentiated on a common product, common customer basis consistent with the business segmentation generally used in the forest products industry.
INDUSTRIAL PACKAGING
International Paper is the largest manufacturer of containerboard in the United States. Our U.S. production capacity is over 13 million tons annually. Our products include linerboard, medium, whitetop, recycled linerboard, recycled medium and saturating kraft. About 80% of our production is converted into corrugated packaging and other packaging by our 176 North American corrugated packaging plants. Additionally, we recycle approximately one million tons of OCC and mixed and white paper through our 16 U.S. recycling plants. Our corrugated packaging plants are supported by regional design centers, which offer total packaging solutions and supply chain initiatives. In EMEA, our operations include a recycled fiber containerboard mill in Morocco and one in Spain and 24 corrugated packaging plants in France, Italy, Spain, Morocco and Portugal.
GLOBAL CELLULOSE FIBERS
Our cellulose fibers product portfolio includes fluff, market and specialty pulps. International Paper is the largest producer of fluff pulp which is used to make absorbent hygiene products like baby diapers, feminine care, adult incontinence and other non-woven products. Our market pulp is used for tissue and paper products. We continue to invest in exploring new innovative uses for our products, such as our specialty pulps, which are used for non-absorbent end uses including textiles, filtration, construction material, paints and coatings, reinforced plastics and more. Our products are made in the United States and Canada and are sold around the world. International Paper facilities have annual dried pulp capacity of about 3 million metric tons.
The following tables present net sales and operating profit (loss) which is the Company's measure of segment profitability.
INDUSTRIAL PACKAGING
Demand for Industrial Packaging products is closely correlated with non-durable industrial goods production, as well as with demand for e-commerce, processed foods, poultry, meat and agricultural products. In addition to prices and volumes, major factors affecting the profitability of Industrial Packaging are raw material and energy costs, freight costs, mill outage costs, manufacturing efficiency and product mix.
| Industrial Packaging | ||||||||
| In millions | 2022 | 2021 | ||||||
| Net Sales | $ | 17,451 | $ | 16,326 | ||||
| Operating Profit (Loss) | $ | 1,742 | $ | 1,638 |
Industrial Packaging net sales for 2022 increased 7% to $17.5 billion compared with $16.3 billion in 2021. Operating profits in 2022 were 6% higher than in 2021. Comparing 2022 with 2021, benefits from higher average sales price net of an unfavorable mix ($1.6 billion) were offset by lower sales volumes ($168 million), higher operating costs ($400 million), higher input costs ($882 million) and higher maintenance outage costs ($59 million).
| North American Industrial Packaging | ||||||||
| In millions | 2022 | 2021 | ||||||
| Net Sales (a) | $ | 16,011 | $ | 14,944 | ||||
| Operating Profit (Loss) | $ | 1,753 | $ | 1,605 |
(a) Includes intra-segment sales of $132 million for 2022 and $126 million for 2021.
North American Industrial Packaging's average sales margins were higher reflecting higher prices for both containerboard and corrugated boxes. Sales volumes decreased in 2022 compared with 2021 for corrugated boxes across our segments driven by the macroeconomic environment reflecting lower consumer spending on goods and retailer inventory destocking. Containerboard sales volumes also decreased. Total maintenance and economic downtime was about 956,000 short tons higher in 2022 compared with 2021, primarily due to economic downtime. Operating and distribution costs increased, primarily due to inflation on materials and services and supply chain and labor constraints. Planned maintenance downtime costs were $58 million higher in 2022 than in 2021. Input costs were significantly higher, driven by higher energy, wood and chemical costs.
Looking ahead to the first quarter of 2023, compared with the fourth quarter of 2022, sales volumes for corrugated boxes and containerboard are expected to increase reflecting four additional shipping days partially offset by the normal season decline. Average sales margins are expected to be lower. Operating costs are expected to increase. Planned maintenance downtime costs are expected to be $95 million higher. Input costs are expected to be lower primarily for recovered fiber and energy.
| EMEA Industrial Packaging | ||||||||
| In millions | 2022 | 2021 | ||||||
| Net Sales | $ | 1,572 | $ | 1,508 | ||||
| Operating Profit (Loss) | $ | (11) | $ | 33 |
EMEA Industrial Packaging's average sales margins were higher in the Eurozone driven by higher average sales price. Average sales margins in Morocco were lower reflecting the impact of an unfavorable product mix. Sales volumes in 2022 were lower than in 2021 driven by the sale of our EMEA Packaging business in Turkey in May 2021. Operating costs were higher driven by inflation on materials and services. Planned maintenance outage costs were higher in 2022 compared with 2021. Input costs were significantly higher, driven by unprecedented energy costs.
Entering the first quarter of 2023, compared with the fourth quarter of 2022, sales volumes are expected to be higher driven by seasonality in Morocco. Average sales margins are expected to be higher, reflecting lower containerboard costs. Operating costs are expected to be higher. Planned maintenance outage costs are expected to be $4 million lower due to no planned outages in the first quarter. Other input costs are expected to be stable.
GLOBAL CELLULOSE FIBERS
Demand for Cellulose Fibers products is closely correlated with changes in demand for absorbent hygiene products, primarily driven by the demographics and income growth in various geographic regions. It is further affected by changes in currency rates that can benefit or hurt producers in different geographic regions. Principal cost drivers include manufacturing efficiency, raw material and energy costs, mill outage costs, and freight costs.
| Global Cellulose Fibers | ||||||||
| In millions | 2022 | 2021 | ||||||
| Net Sales | $ | 3,227 | $ | 2,732 | ||||
| Operating Profit (Loss) | $ | 106 | $ | (3) |
Global Cellulose Fibers net sales for 2022 increased 18% to $3.2 billion, compared with $2.7 billion in 2021. Operating profits in 2022 improved significantly compared to 2021. Comparing 2022 with 2021, benefits from higher average sales price, a favorable mix and sales volumes ($552 million) were partially offset by higher operating costs ($257 million), higher input costs ($175 million) and higher maintenance outage costs ($11 million).
Sales volumes in 2022 compared with 2021 were lower reflecting the challenging supply chain environment. Total maintenance and economic downtime was about 13,000 short tons higher in 2022 compared with 2021, primarily due to economic downtime. Average sales margins were higher, reflecting higher average fluff and market pulp prices. Operating costs increased, driven by inflation on materials and services and supply chain related mill slowbacks and downtime. Distribution costs were significantly higher driven by continuing global supply chain disruptions. Planned maintenance outage costs were $11 million higher in 2022. Input costs were significantly higher, driven by chemicals, wood and energy.
Entering the first quarter of 2023, compared with the fourth quarter of 2022, sales volumes are expected to be lower reflecting seasonally lower demand and customer inventory destocking in response to increased supply chain velocity. Average sales margins are expected to improve. Operating costs are expected to be higher. Planned maintenance outage costs are expected to be $13 million higher than in the fourth quarter of 2022. Input costs are expected to be lower, primarily for energy.
EQUITY EARNINGS, NET OF TAXES - ILIM
On January 24, 2023, the Company announced it had reached an agreement to sell its equity investment in Ilim and also received from the same purchasers an
indication of interest to purchase its equity investment in Ilim Group. This transaction is discussed further in Note 11 - Equity Method Investments on pages 66 through 68 of Item 8. Financial Statements and Supplementary Data.
All current and historical results of the Ilim investment are presented as Discontinued Operations, net of taxes in the consolidated statement of operations. The Company recorded equity earnings, net of taxes, related to Ilim of $296 million in 2022, compared with earnings of $311 million in 2021.
Higher sales volumes and better sales margins in 2022 were more than offset by higher input costs, shipping costs and repair expenses. Sales volumes for the joint venture increased by 5% in 2022, primarily for softwood pulp and containerboard shipments to China, partially offset by lower shipments of softwood pulp and containerboard to other export markets. Average sales margins were significantly higher for sales of softwood pulp and hardwood pulp reflecting higher average sales prices in all markets. Average sales margins for shipments of containerboard declined reflecting lower average sales prices in all markets. Input costs were higher, primarily for wood, fuel and chemicals. Distribution costs were negatively impacted by higher transportation tariffs and other inflationary pressures. Maintenance and repair expenses were higher due in part to repairs to recovery boiler No. 2 at the Ust-Ilimsk mill in the fourth quarter of 2022. The Company received cash dividends from the joint venture of $204 million in 2022 and $154 million in 2021.
LIQUIDITY AND CAPITAL RESOURCES
OVERVIEW
A major factor in International Paper’s liquidity and capital resource planning is its generation of operating cash flow, which is highly sensitive to changes in the pricing and demand for our major products. While changes in key operating cash costs, such as raw material, energy, mill outage and distribution, do have an effect on operating cash generation, we believe that our focus on commercial and operational excellence, as well as our ability to tightly manage costs and working capital has improved our cash flow generation over an operating cycle.
Use of cash during 2022 was primarily focused on working capital requirements, capital spending and returning cash to shareholders through dividends and share repurchases under the Company's share repurchase program.
CASH PROVIDED BY OPERATING ACTIVITIES
Cash provided by operations, including discontinued operations, totaled $2.2 billion in 2022, compared with $2.0 billion for 2021. Cash used by working capital components (accounts receivable, contract assets and inventory less accounts payable and accrued liabilities, interest payable and other) totaled $145 million in 2022, compared with cash used by working capital components of $426 million in 2021. Cash dividends received from equity investments were $204 million in 2022, compared with $159 million in 2021.
INVESTMENT ACTIVITIES
Including discontinued operations, investment activities in 2022 decreased from 2021, as 2021 included proceeds from the sale of the Kwidzyn, Poland mill and the sale of our ownership interest in Olmuksan International Paper for $827 million, net of cash divested, proceeds from the monetization of our investment in Graphic Packaging International Partners, LLC (GPIP) for $908 million and proceeds of $4.85 billion from the settlement of the 2015 Financing Entities Timber Notes (see Note 15 Variable Interest Entities on pages 75 and 76 of Item 8. Financial Statements and Supplementary Data). Capital spending was $931 million in 2022, or 90% of depreciation and amortization, compared with $549 million in 2021, or 45% of depreciation and amortization. Capital spending as a percentage of depreciation and amortization was 56% for Global Cellulose Fibers and 97% for Industrial Packaging in 2022.
The following table shows capital spending by business segment for the years ended December 31, 2022 and 2021, excluding amounts related to discontinued operations of $69 million in 2021:
| In millions | 2022 | 2021 | ||||||
| Industrial Packaging | $ | 762 | $ | 382 | ||||
| Global Cellulose Fibers | 143 | 83 | ||||||
| Subtotal | 905 | 465 | ||||||
| Corporate and other | 26 | 15 | ||||||
| Capital Spending | $ | 931 | $ | 480 |
Capital spending in 2023 is expected to be approximately $1.0 billion to $1.2 billion, or 91% to 109% of depreciation and amortization.
Acquisitions
See Note 7 Acquisitions on page 62 of Item 8. Financial Statements and Supplementary Data for a discussion of the Company's acquisitions.
FINANCING ACTIVITIES
Financing activities during 2022 included debt issuances of $1.0 billion and reductions of $1.0 billion. Including discontinued operations, financing activities during 2021 included debt issuances of $1.5 billion and reductions of $2.5 billion for a net decrease of $1.0 billion.
Amounts related to early debt extinguishment during the years ended December 31, 2022 and 2021 were as follows:
| In millions | 2022 | 2021 | ||||||
| Early debt reductions (a) | $ | 503 | $ | 2,472 | ||||
| Pre-tax early debt extinguishment costs (b) | 93 | 461 |
*(a)*Reductions related to notes with interest rates ranging from 3.00% to 8.70% with original maturities from 2023 to 2048 for the years ended December 31, 2022 and 2021.
*(b)*Amounts are included in Restructuring and other charges in the accompanying consolidated statements of operations.
The Company's early debt reductions in 2022 included debt tenders of $498 million with interest rates ranging from 6.40% to 8.70% and maturity dates ranging from 2023 to 2039. In addition, during 2022, the Company had $5 million in open market repurchases related to debt with interest rates ranging from 4.35% to 4.40% and maturity dates ranging from 2047 to 2048. In addition to the early debt reductions, the Company had debt reductions of $514 million in 2022 related primarily to capital leases, debt maturities, and international debt.
In January 2023, the Company entered into a variable term loan agreement providing for a $600 million term loan which was fully drawn on the date of such loan agreement and matures in 2028. The $600 million debt was issued following the repayment of $410 million of commercial paper earlier in 2023 and will also be used to repay debt maturing later in 2023 and general corporate purposes.
Other financing activities during 2022 included the net issuance of approximately 1.6 million shares of treasury stock. Repurchases of common stock and payments of restricted stock withholding taxes totaled $1.3 billion, including $1.3 billion related to shares repurchased under the Company's share repurchase program. The Company has repurchased 114.4 million shares at an average price of $46.66, for a total of approximately $5.3 billion, since the repurchase program began in September 2013 through December 31, 2022. The Company paid cash dividends totaling $673 million during 2022.
Other financing activities during 2021 included the net issuance of approximately 1.9 million shares of
treasury stock. Repurchases of common stock and payments of restricted stock withholding taxes totaled $838 million, including $810.9 million related to shares repurchased under the Company's share repurchase program. The Company paid cash dividends totaling $780 million during 2021.
Interest Rate Swaps
Our policy is to manage interest cost using a mixture of fixed-rate and variable-rate debt. To manage this risk, International Paper utilizes interest rate swaps to change the mix of fixed and variable rate debt. During 2020, International Paper terminated its interest rate swaps with a notional amount of $700 million and maturities ranging from 2024 to 2026 with an approximate fair value of $85 million. Subsequent to the termination of the interest rate swaps, the fair value basis adjustment is amortized to earnings as interest income over the same period as a debt premium on the previously hedged debt. The Company had no outstanding interest rate swaps for the years ended December 31, 2022 and 2021 (see Note 17 Derivatives and Hedging Activities on pages 78 through 81 of Item 8. Financial Statements and Supplementary Data).
Variable Interest Entities
Information concerning variable interest entities is set forth in Note 15 Variable Interest Entities on pages 75 and 76 of Item 8. Financial Statements and Supplementary Data. In connection with the 2006 International Paper installment sale of forestlands, we received $4.8 billion of installment notes. These installment notes were used by variable interest entities as collateral for borrowings from third-party lenders. These variable interest entities were restructured in 2015 when the installment notes and third-party loans were extended. The restructured variable interest entities held installment notes of $4.8 billion and third-party loans of $4.2 billion which both matured in August 2021. We settled the third-party loans at their maturity with the proceeds from the installment notes. This resulted in cash proceeds of approximately $630 million representing our equity in the variable interest entities. Maturity of the installment notes and termination of the monetization structure also resulted in a $72 million tax liability that was paid in the fourth quarter of 2021. On September 2, 2022, the Company and the Internal Revenue Service agreed to settle the previously disclosed timber monetization restructuring tax matter. Under this agreement, the Company will fully resolve the matter and pay $252 million in U.S. federal income taxes. As a result, interest will also be charged upon closing of the audit. The amount of interest expense recognized through December 31, 2022 is $58 million. As of December 31, 2022, $89 million in U.S.
federal income taxes and $28 million in interest expense have been paid as a result of the settlement agreement. The remaining $163 million U.S. federal income tax liability and $30 million accrued interest liability are recorded as current liabilities in the balance sheet. The reversal of the Company’s remaining deferred tax liability associated with the 2015 Financing Entities of $604 million was recognized as a one-time tax benefit in the third quarter of 2022.
LIQUIDITY AND CAPITAL RESOURCES OUTLOOK FOR 2023
We expect another year of solid cash generation in 2023. Furthermore, we intend to continue to make choices for the use of cash that are consistent with our capital allocation framework to drive long-term value creation. These include maintaining a strong balance sheet and investment grade credit rating, returning meaningful cash to shareholders through dividends and share repurchases and making organic investments to maintain our world-class system and strengthen our businesses.
On October 11, 2022, our Board of Directors approved an additional $1.5 billion under our share repurchase program. This program does not have an expiration date and has approximately $3.2 billion aggregate amount of shares of common stock remaining authorized for purchase as of December 31, 2022. We may continue to repurchase shares under such authorization in open market transactions (including block trades), privately negotiated transactions or otherwise, subject to prevailing market conditions, our liquidity requirements, applicable securities laws requirements and other factors. In addition, we pay regular quarterly cash dividends and expect to continue to pay regular quarterly cash dividends in the foreseeable future. Each quarterly dividend is subject to review and approval by our Board of Directors.
Capital Expenditures and Long-Term Debt
Capital spending for 2023 is planned at approximately $1.0 billion to $1.2 billion, or about 91% to 109% of depreciation and amortization.
At December 31, 2022, International Paper’s credit agreements totaled $2.0 billion, which is comprised of the $1.5 billion contractually committed bank credit agreement and up to $500 million under the receivables securitization program. Management believes these credit agreements are adequate to cover expected operating cash flow variability during the current economic cycle. The credit agreements generally provide for interest rates at a floating rate index plus a pre-determined margin dependent upon International Paper’s credit rating. At December 31,
2022, the Company had no borrowings outstanding under the $1.5 billion credit agreement or the $500 million receivables securitization program. The Company’s credit agreements are not subject to any restrictive covenants other than the financial covenants as disclosed on pages 76 through 78 in Note 16 - Debt and Lines of Credit of Item 8. Financial Statements and Supplementary Data, and the borrowings under the receivables securitization program being limited by eligible receivables. The Company was in compliance with all its debt covenants at December 31, 2022 and was well below the thresholds stipulated under the covenants as defined in the credit agreements. Further the financial covenants do not restrict any borrowings under the credit agreements.
Under the terms of the Company's commercial paper program, individual maturities on borrowings may vary, but not exceed one year from the date of issue. Interest bearing notes may be issued either as fixed or floating rate notes. As of December 31, 2022, the Company had $410 million outstanding under the program with remaining capacity of $590 million. As of December 31, 2022, the remaining credit agreement capacity was $1.1 billion.
International Paper expects to be able to meet projected capital expenditures, service existing debt, meet working capital and dividend requirements and make common stock and/or debt repurchases for the next 12 months and for the foreseeable future thereafter with current cash balances and cash from operations, supplemented as required by its existing credit facilities. The Company will continue to rely on debt and capital markets for the majority of any necessary long-term funding not provided by operating cash flows. Funding decisions will be guided by our capital structure planning objectives. The primary goals of the Company’s capital structure planning are to maximize financial flexibility and maintain appropriate levels of liquidity to meet our needs while managing balance sheet debt and interest expense, and we have repurchased, and may continue to repurchase, our common stock (under our existing share repurchase program) and debt (including through open market purchases, privately negotiated transactions or otherwise) to the extent consistent with this capital structure planning. The majority of International Paper’s debt is accessed through global public capital markets where we have a wide base of investors. During 2020, management took various actions to further strengthen the Company’s liquidity position in response to the COVID-19 pandemic. This included the Company deferring the payment of our payroll taxes as allowed under CARES Act. The CARES Act allows for the deferral of the payment of the employer portion of Social Security taxes accrued between March 27,
2020 and December 31, 2020. Under the CARES Act 50% of the deferred payroll taxes was paid in 2021 and the remainder was paid in 2022. We believe that our credit agreements and commercial paper program provide us with sufficient liquidity to operate in the current negative macroeconomic environment; however, an extended period of economic disruption could impact our access to additional sources of liquidity.
Maintaining an investment grade credit rating is an important element of International Paper’s financing strategy. At December 31, 2022, the Company held long-term credit ratings of BBB (stable outlook) and Baa2 (stable outlook) by S&P and Moody’s, respectively.
Contractual obligations for future payments under existing debt and lease commitments and purchase obligations at December 31, 2022, were as follows:
| In millions | 2023 | 2024 | 2025 | 2026 | 2027 | Thereafter | ||||||||||||||
| Debt maturities (a) | $ | 763 | $ | 148 | $ | 191 | $ | 72 | $ | 298 | $ | 4,107 | ||||||||
| Operating lease obligations | 157 | 113 | 75 | 48 | 30 | 36 | ||||||||||||||
| Purchase obligations (b) | 2,504 | 818 | 471 | 360 | 285 | 1,651 | ||||||||||||||
| Total (c) | $ | 3,424 | $ | 1,079 | $ | 737 | $ | 480 | $ | 613 | $ | 5,794 |
*(a)*Includes financing lease obligations.
*(b)*Includes $4.0 billion relating to fiber supply agreements.
*(c)*Not included in the above table due to the uncertainty of the amount and timing of the payment are unrecognized tax benefits of approximately $169 million. Also not included in the above table is $95 million of Deemed Repatriation Transition Tax associated with the 2017 Tax Cuts and Jobs Act which will be settled from 2023 - 2026. Additionally, the deferred tax liability of $485 million related to the Temple-Inland timber monetization is not included in the table above. It will be settled with the maturity of the notes in 2027.
We consider the undistributed earnings of our foreign subsidiaries as of December 31, 2022, to be permanently reinvested and, accordingly, no U.S. income taxes have been provided thereon (see Note 13 Income Taxes on pages 69 through 71 of Item 8. Financial Statements and Supplementary Data). We do not anticipate the need to repatriate funds to the United States to satisfy domestic liquidity needs arising in the ordinary course of business, including liquidity needs associated with our domestic debt service requirements.
Pension Obligations and Funding
At December 31, 2022, the projected benefit obligation for the Company’s U.S. defined benefit plans determined under U.S. GAAP was approximately $29 million lower than the fair value of plan assets, excluding non-U.S. plans. Approximately $297 million of this amount relates to plans that are subject to minimum funding requirements. Under current IRS funding rules, the calculation of minimum
funding requirements differs from the calculation of the present value of plan benefits (the "projected benefit obligation") for accounting purposes. In December 2008, the Worker, Retiree and Employer Recovery Act of 2008 ("WERA") was passed by the U.S. Congress which provided for pension funding relief and technical corrections. Funding contributions depend on the funding method selected by the Company, and the timing of its implementation, as well as on actual demographic data and the targeted funding level. The Company continually reassesses the amount and timing of any discretionary contributions and elected not to make any voluntary contributions in 2020, 2021 or 2022. At this time, we do not expect to have any required contributions to our plans in 2023, although the Company may elect to make future voluntary contributions. The timing and amount of future contributions, which could be material, will depend on a number of factors, including the actual earnings and changes in values of plan assets and changes in interest rates.
CRITICAL ACCOUNTING POLICIES AND SIGNIFICANT ACCOUNTING ESTIMATES
The preparation of financial statements in conformity with accounting principles generally accepted in the United States requires International Paper to establish accounting policies and to make estimates that affect both the amounts and timing of the recording of assets, liabilities, revenues and expenses. Some of these estimates require subjective judgments about matters that are inherently uncertain.
Accounting policies whose application has had or is reasonably likely to have a material impact on the reported results of operations and financial position of International Paper, and that can require a significant level of estimation or uncertainty by management that affect their application, include the accounting for contingencies, impairment or disposal of long-lived assets and goodwill, pensions and income taxes. The Company has discussed the selection of critical accounting policies and the effect of significant estimates with the Audit and Finance Committee of the Company’s Board of Directors and with its independent registered public accounting firm.
CONTINGENT LIABILITIES
Accruals for contingent liabilities, including personal injury, product liability, environmental, asbestos and other legal matters, are recorded when it is probable that a liability has been incurred or an asset impaired and the amount of the loss can be reasonably estimated. Liabilities accrued for legal matters require judgments regarding projected outcomes and range of loss based on historical litigation and settlement experience and recommendations of legal counsel
and, if applicable, other experts. Liabilities for environmental matters require evaluations of relevant environmental regulations and estimates of future remediation alternatives and costs. The Company estimated the probable liability associated with these environmental matters to be approximately $243 million ($251 million undiscounted) in the aggregate as of December 31, 2022 and $182 million ($191 million undiscounted) in the aggregate as of December 31, 2021. Liabilities for asbestos-related matters require reviews of recent and historical claims data. The Company's total recorded liability with respect to pending and future asbestos-related claims was $105 million and $103 million, net of estimated insurance recoveries, as of December 31, 2022 and 2021, respectively. The Company utilizes its in-house legal counsel and environmental experts to develop estimates of its legal, environmental and asbestos obligations, supplemented as needed by third-party specialists to analyze its most complex contingent liabilities.
We calculate our workers' compensation reserves based on estimated actuarially calculated development factors. The workers' compensation reserves are reviewed at least quarterly to determine the adequacy of the accruals and related financial statement disclosure. The Company's total recorded workers' compensation reserve was $136 million and $159 million as of December 31, 2022 and 2021, respectively. While we believe that our assumptions are appropriate, the ultimate settlement of workers' compensation reserves may differ significantly from amounts we have accrued in our consolidated financial statements.
IMPAIRMENT OF LONG-LIVED ASSETS AND GOODWILL
Long-lived assets are reviewed for impairment upon the occurrence of events or changes in circumstances that indicate that the carrying value of the assets may not be recoverable. A recoverability test is performed by comparing the undiscounted cash flows to carrying value of the assets. If the carrying amount is less than the undiscounted cash flows, the fair value of the assets is compared to the carrying value to determine if they are impaired. An impairment of a long-lived asset exists when the asset’s carrying amount exceeds its fair value.
We perform an annual goodwill impairment as of October 1. Additionally, interim assessments of possible impairments of goodwill are also made when events or changes in circumstances indicate that the carrying value of the asset may not be recoverable through future operations. A goodwill impairment exists when the carrying amount of goodwill exceeds its fair value.
The amount and timing of goodwill and long-lived asset impairment charges based on these assessments requires the estimation of future cash flows or the fair market value of the related assets based on management’s best estimates of certain key factors, including future selling prices and volumes, operating, raw material, energy and freight costs, various other projected operating economic factors and other intended uses of the assets.
ASU 2011-08, "Intangibles - Goodwill and Other," allows entities testing goodwill for impairment the option of performing a qualitative assessment before performing the quantitative goodwill impairment test. If a qualitative assessment is performed, an entity is not required to perform the quantitative goodwill impairment test unless the entity determines that, based on that qualitative assessment, it is more likely than not that its fair value is less than its carrying value. The Company performed its annual testing of its reporting units for possible goodwill impairments by applying the qualitative assessment to its North America Industrial Packaging reporting unit and the quantitative goodwill impairment test to its EMEA Industrial Packaging reporting unit as of October 1, 2022.
For the current year evaluation, the Company assessed various assumptions, events and circumstances that would have affected the estimated fair value of the North America Industrial Packaging reporting unit under the qualitative assessment and the results of the qualitative assessments indicated that it was not more likely than not that the fair value of the reporting unit was less than its carrying value. Our most recent quantitative goodwill impairment test for our NA IPG reporting unit was performed as part of our 2020 annual goodwill impairment test. That quantitative goodwill impairment test indicated that the fair value of the NA IPG reporting unit exceeded the carrying amount by approximately 100%.
The Company also performed the quantitative goodwill impairment test which included comparing the carrying amount of the EMEA Industrial Packaging reporting unit to its estimated fair value. The estimated fair value of the reporting unit was calculated using a weighted approach based on discounted future cash flows, market multiples and transaction multiples. The determination of fair value using the discounted cash flow approach requires management to make significant estimates and assumptions related to forecasts of future revenues, operating profit margins, and discount rates. The determination of fair value using market multiples and transaction multiples requires management to make significant assumptions related to revenue multiples and adjusted earnings before interest, taxes, depreciation, and amortization ("EBITDA") multiples.
The results of our quantitative goodwill impairment test indicated that the carrying amount exceeded the estimated fair value of the EMEA Industrial Packaging reporting unit and it was determined that all of the goodwill in the reporting unit, totaling $76 million, was impaired. The decline in the fair value of EMEA Industrial Packaging and resulting impairment charge was due to the impacts of certain macroeconomic conditions, including the impacts from inflation and the geopolitical environment to the reporting unit.
Due to the macroeconomic factors noted above, we also performed the long-lived asset impairment test for asset groups that represent the EMEA Industrial Packaging reporting unit prior to the goodwill impairment test and the respective assets groups were determined not to be impaired.
OTHER-THAN-TEMPORARY IMPAIRMENT
The Company evaluates our investment in the Ilim joint venture for other-than-temporary impairment (OTTI) when circumstances indicate the investment may be impaired. When a decline in fair value is deemed to be an OTTI, an impairment is recognized to the extent that the fair value is less than the carrying value of the investment. We consider various factors in determining whether a loss in value of an investment is other than temporary including: the length of time and the extent to which the fair value has been below cost, the financial condition of Ilim joint venture, and our intent and ability to retain the investment for a period of time sufficient to allow for recovery of value. Management makes certain judgments and estimates in its assessment including but not limited to: identifying if circumstances indicate a decline in value is other than temporary, expectations about operations, as well as industry, financial, regulatory and market factors. During the fourth quarter of 2022, the Company received a binding third-party offer to purchase our interest in the Ilim joint venture which was then submitted to our joint venture partners under the preemption provisions of the Ilim shareholders' agreement. The third-party offer resulted in an implied fair value that was less than our investment carrying value. This decrease in fair value below carrying value was not considered to be a temporary decline in value. As such, the Company recorded a $533 million impairment in the fourth quarter of 2022 based on the agreed selling price for our 50% interest. The impairment charge included recognition of $375 million of foreign currency cumulative translation adjustment loss. The timing by which the sale of our investment will be completed is dependent on obtaining required regulatory approvals. In the meantime, we could recognize additional OTTI charges as the carrying value of our investment
fluctuates relative to the approximate $500 million implied fair value, through additional equity earnings and foreign currency translation.
PENSION BENEFIT OBLIGATIONS
The charges recorded for pension benefit obligations are determined annually in conjunction with International Paper’s consulting actuary, and are dependent upon various assumptions including the expected long-term rate of return on plan assets, discount rates, projected future compensation increases and mortality rates.
The calculations of pension obligations and expenses require decisions about a number of key assumptions that can significantly affect liability and expense amounts, including the expected long-term rate of return on plan assets and the discount rate used to calculate plan liabilities.
Benefit obligations and fair values of plan assets as of December 31, 2022, for International Paper’s pension plan were as follows:
| In millions | Benefit Obligation | Fair Value of Plan Assets | ||||||
| U.S. qualified pension | $ | 8,548 | $ | 8,845 | ||||
| U.S. nonqualified pension | 268 | — | ||||||
| Non-U.S. pension | 54 | 18 |
The table below shows the discount rate used by International Paper to calculate U.S. pension obligations for the years shown:
| 2022 | 2021 | 2020 | |||||||||
| Discount rate | 5.40 | % | 2.90 | % | 2.60 | % |
International Paper determines these actuarial assumptions, after consultation with our actuaries, on December 31 of each year or more frequently if required, to calculate liability information as of that date and pension expense for the following year. The expected long-term rate of return on plan assets is based on projected rates of return for current asset classes in the plan’s investment portfolio. The discount rate assumption was determined based on a hypothetical settlement portfolio selected from a universe of high quality corporate bonds.
The weighted average expected long-term rate of return on U.S. pension plan assets used to determine net periodic cost for the year ended December 31, 2022 was 6.00%.
Increasing (decreasing) the expected long-term rate of return on U.S. plan assets by an additional 0.25% would decrease (increase) 2023 pension expense by approximately $20 million, while a (decrease)
increase of 0.25% in the discount rate would (increase) decrease pension expense by approximately $15 million.
Actual rates of return earned on U.S. pension plan assets for each of the last 10 years were:
| Year | Return | Year | Return | ||||||||
| 2022 | (22.0) | % | 2017 | 19.3 | % | ||||||
| 2021 | 7.7 | % | 2016 | 7.1 | % | ||||||
| 2020 | 24.7 | % | 2015 | 1.3 | % | ||||||
| 2019 | 23.9 | % | 2014 | 6.4 | % | ||||||
| 2018 | (3.0) | % | 2013 | 14.1 | % |
The 2013 and 2014 returns above represent weighted averages of International Paper and Temple-Inland asset returns. International Paper and Temple-Inland assets were combined in October 2014. The annualized time-weighted rate of return earned on U.S. pension plan assets was 4.7% and 7.1% for the past five and ten years, respectively.
ASC 715, “Compensation – Retirement Benefits,” provides for delayed recognition of actuarial gains and losses, including amounts arising from changes in the estimated projected plan benefit obligation due to changes in the assumed discount rate, differences between the actual and expected return on plan assets, and other assumption changes. These net gains and losses are recognized in pension expense prospectively over a period that approximates the average remaining service period of active employees expected to receive benefits under the plans to the extent that they are not offset by gains and losses in subsequent years.
Net periodic pension plan expenses, calculated for all of International Paper’s plans, were as follows:
| In millions | 2022 | 2021 | 2020 | 2019 | 2018 | ||||||||||||
| Pension (income) expense | |||||||||||||||||
| U.S. plans | $ | (116) | $ | (112) | $ | 32 | $ | 93 | $ | 632 | |||||||
| Non-U.S. plans | 5 | 4 | 5 | 6 | 4 | ||||||||||||
| Net (income) expense | $ | (111) | $ | (108) | $ | 37 | $ | 99 | $ | 636 |
The increase in 2022 pension income primarily reflects lower service cost, lower actuarial loss, and lower asset returns, slightly offset by higher interest cost.
Assuming that discount rates, expected long-term returns on plan assets and rates of future compensation increases remain the same as of December 31, 2022, projected future net periodic pension plan expense (income) would be as follows:
| In millions | 2024 | 2023 | ||||||
| Pension expense (income) | ||||||||
| U.S. plans | $ | 38 | $ | 102 | ||||
| Non-U.S. plans | 5 | 5 | ||||||
| Net (income) expense | $ | 43 | $ | 107 |
The Company estimates that it will record net pension expense of approximately $102 million for its U.S. defined benefit plans in 2023, compared to income of $116 million in 2022.
The market value of plan assets for International Paper’s U.S. qualified pension plan at December 31, 2022 totaled approximately $8.8 billion, consisting of approximately 16% equity securities, 67% debt securities, 9% real estate funds and 8% other assets. The Company’s funding policy for its qualified pension plans is to contribute amounts sufficient to meet legal funding requirements, plus any additional amounts that the Company may determine to be appropriate considering the funded status of the plan, tax deductibility, the cash flows generated by the Company, and other factors. The Company continually reassesses the amount and timing of any discretionary contributions and could elect to make voluntary contributions in the future. There were no required contributions to the U.S. qualified plan in 2022. The nonqualified defined benefit plans are funded to the extent of benefit payments, which totaled $29 million for the year ended December 31, 2022.
INCOME TAXES
International Paper records its global tax provision based on the respective tax rules and regulations for the jurisdictions in which it operates. Where the Company believes that a tax position is supportable for income tax purposes, the item is included in its income tax returns. Where treatment of a position is uncertain, liabilities are recorded based upon the Company’s evaluation of the “more likely than not” outcome considering technical merits of the position based on specific tax regulations and facts of each matter. Changes to recorded liabilities are only made when an identifiable event occurs that changes the likely outcome, such as settlement with the relevant tax authority, the expiration of statutes of limitation for the subject tax year, change in tax laws, or recent court cases that are relevant to the matter. Accrued interest related to these uncertain tax positions is recorded in our consolidated statement of operations in Interest expense, net.
Valuation allowances are recorded to reduce deferred tax assets when it is more likely than not that a tax benefit will not be realized. Significant judgment is required in assessing the need for and magnitude of appropriate valuation allowances against deferred tax
assets. This assessment is completed by tax jurisdiction and relies on both positive and negative evidence available, with significant weight placed on recent financial results. Cumulative reported pre-tax income is considered objectively verifiable positive evidence of our ability to generate positive pre-tax income in the future. In accordance with GAAP, when there is a recent history of pre-tax losses, there is little or no weight placed on forecasts for purposes of assessing the recoverability of our deferred tax assets. When necessary, we use systematic and logical methods to estimate when deferred tax liabilities will reverse and generate taxable income and when deferred tax assets will reverse and generate tax deductions. Assumptions, judgment, and the use of estimates are required when scheduling the reversal of deferred tax assets and liabilities, and the exercise is inherently complex and subjective. The realization of these assets is dependent on generating future taxable income, as well as successful implementation of various tax planning strategies. The Company's valuation allowance was $677 million and $708 million at December 31, 2022 and 2021, respectively.
While International Paper believes that these judgments and estimates are appropriate and reasonable under the circumstances, actual resolution of these matters may differ from recorded estimated amounts.
Information concerning the Company’s environmental and other legal proceedings is set forth in Note 14 Commitments and Contingent Liabilities on pages 71 through 75 of Item 8. Financial Statements and Supplementary Data. The Company is not subject to any administrative or judicial proceeding arising under any Federal, State or local provisions that have been enacted or adopted regulating the discharge of materials into the environment or primarily for the purpose of protecting the environment that is likely to result in monetary sanctions of $1 million or more.
RECENT ACCOUNTING DEVELOPMENTS
See Note 2 Recent Accounting Developments on page 57 of Item 8. Financial Statements and Supplementary Data for a discussion of new accounting pronouncements.
Inflationary increases in certain input costs, such as energy, wood, recycled fiber, freight and chemical costs, had an adverse impact on the Company’s operating results in 2021 and 2022, but had a minimal impact in 2020. We expect that inflationary pressures will continue to adversely impact our operating results
in 2023. The effects of inflation have been more significant in recent years due to general inflationary conditions, including labor market conditions, economic activity, consumer behavior, supply shortages and disruptions. Sales prices and volumes are primarily influenced by economic supply and demand factors in specific markets and by exchange rate fluctuations but are also currently being impacted by the current inflationary environment.
International Paper has operations in a number of countries. Its operations in those countries also export to, and compete with imports from other regions. As such, currency movements can have a number of direct and indirect impacts on the Company’s financial statements. Direct impacts include the translation of international operations’ local currency financial statements into U.S. dollars and the remeasurement impact associated with non-functional currency financial assets and liabilities. Indirect impacts include the change in competitiveness of imports into, and exports out of, the United States (and the impact on local currency pricing of products that are traded internationally). In general, a weaker U.S. dollar and stronger local currency is beneficial to International Paper. The currency that has the most impact is the Euro.
We use financial instruments, including fixed and variable rate debt, to finance operations, for capital spending programs and for general corporate purposes. Additionally, financial instruments, including various derivative contracts, are used to hedge exposures to interest rate, commodity and foreign currency risks. We do not use financial instruments for trading purposes. Information related to International Paper’s debt obligations is included in Note 16 Debt and Lines of Credit on pages 76 through 78 of Item 8. Financial Statements and Supplementary Data. A discussion of derivatives and hedging activities is included in Note 17 Derivatives and Hedging Activities on pages 78 through 81 of Item 8. Financial Statements and Supplementary Data.
The fair value of our debt and financial instruments varies due to changes in market interest and foreign currency rates and commodity prices since the inception of the related instruments. We assess this market risk utilizing a sensitivity analysis. The sensitivity analysis measures the potential loss in earnings, fair values and cash flows based on a hypothetical 10% change (increase and decrease) in interest and currency rates and commodity prices.
INTEREST RATE RISK
Our exposure to market risk for changes in interest rates relates primarily to short- and long-term debt obligations and investments in marketable securities. We invest in investment-grade securities of financial institutions and money market mutual funds with a minimum rating of AAA and limit exposure to any one issuer or fund. Our investments in marketable securities at December 31, 2022 and 2021 are stated at cost, which approximates market due to their short-term nature. Our interest rate risk exposure related to these investments was not material.
We issue fixed and floating rate debt in a proportion that management deems appropriate based on current and projected market conditions. Derivative instruments, such as interest rate swaps, may be used to execute this strategy. At December 31, 2022 and 2021, the fair value of the net liability of financial instruments with exposure to interest rate risk was approximately $4.3 billion and $6.7 billion, respectively. The potential increase in fair value resulting from a 10% adverse shift in quoted interest rates would have been approximately $328 million and $304 million at December 31, 2022 and 2021, respectively.
COMMODITY PRICE RISK
The objective of our commodity exposure management is to minimize volatility in earnings due to large fluctuations in the price of commodities. Commodity swap or forward purchase contracts may be used to manage risks associated with market fluctuations in energy prices. At December 31, 2022 and 2021, the net fair value of these contracts was $20 million asset and $10 million asset. The potential loss in fair value from a 10% adverse change in quoted commodity prices for these contracts would have been approximately $3 million and $2 million at December 31, 2022 and 2021, respectively.
FOREIGN CURRENCY RISK
International Paper transacts business in many currencies and is also subject to currency exchange rate risk through investments and businesses owned and operated in foreign countries. Our objective in managing the associated foreign currency risks is to minimize the effect of adverse exchange rate fluctuations on our after-tax cash flows. We address these risks on a limited basis by entering into cross-currency interest rate swaps, or foreign exchange contracts.
At December 31, 2022 and 2021, the net fair value of financial instruments with exposure to foreign currency risk was immaterial. The potential loss in fair value for such financial instruments from a 10% adverse change in quoted foreign currency exchange rates was also immaterial.
ITEM 7A. QUANTITATIVE AND QUALITATIVE DISCLOSURES ABOUT MARKET RISK
See the preceding discussion and Note 17 Derivatives and Hedging Activities on pages 78 through 81 of Item 8. Financial Statements and Supplementary Data.
ITEM 8. FINANCIAL STATEMENTS AND SUPPLEMENTARY DATA
REPORT OF MANAGEMENT ON:
Financial Statements
The management of International Paper Company is responsible for the preparation of the consolidated financial statements in this annual report. The consolidated financial statements have been prepared using accounting principles generally accepted in the United States of America considered appropriate in the circumstances to present fairly the Company’s consolidated financial position, results of operations and cash flows on a consistent basis. Management has also prepared the other information in this annual report and is responsible for its accuracy and consistency with the consolidated financial statements.
As can be expected in a complex and dynamic business environment, some financial statement amounts are based on estimates and judgments. Even though estimates and judgments are used, measures have been taken to provide reasonable assurance of the integrity and reliability of the financial information contained in this annual report. We have formed a Disclosure Committee to oversee this process.
The accompanying consolidated financial statements have been audited by the independent registered public accounting firm Deloitte & Touche LLP (PCAOB ID No. 34). During its audits, Deloitte & Touche LLP was given unrestricted access to all financial records and related data, including minutes of all meetings of stockholders and the board of directors and all committees of the board. Management believes that all representations made to the independent auditors during their audits were valid and appropriate.
Internal Control Over Financial Reporting
The management of International Paper Company is also responsible for establishing and maintaining adequate internal control over financial reporting (as defined in Rules (13a-15(e) and 15d-15(e) under the Exchange Act). Internal control over financial reporting is the process designed by, or under the supervision of, our principal executive officer and principal financial officer, and effected by our Board of Directors, management and other personnel to provide reasonable assurance regarding the reliability of financial reporting and the preparation of financial statements for external purposes. All internal control systems have inherent limitations, including the possibility of circumvention and overriding of controls,
and therefore can provide only reasonable assurance of achieving the designed control objectives. The Company’s internal control system is supported by written policies and procedures, contains self-monitoring mechanisms, and is audited by the internal audit function. Appropriate actions are taken by management to correct deficiencies as they are identified. Our procedures for financial reporting include the active involvement of senior management, our Audit and Finance Committee and our staff of highly qualified financial and legal professionals.
The Company has assessed the effectiveness of its internal control over financial reporting as of December 31, 2022. In making this assessment, it used the criteria described in “Internal Control – Integrated Framework (2013)” issued by the Committee of Sponsoring Organizations of the Treadway Commission ("COSO"). Based on this assessment, management believes that, as of December 31, 2022, the Company’s internal control over financial reporting was effective.
The Company’s independent registered public accounting firm, Deloitte & Touche LLP, has issued its report on the effectiveness of the Company’s internal control over financial reporting. The report appears on pages 45 through 47.
Internal Control Environment And Board Of Directors Oversight
Our internal control environment includes an enterprise-wide attitude of integrity and control consciousness that establishes a positive “tone at the top.” This is exemplified by our ethics program that includes long-standing principles and policies on ethical business conduct that require employees to maintain the highest ethical and legal standards in the conduct of International Paper business, which have been distributed to all employees; a toll-free telephone helpline whereby any employee may anonymously report suspected violations of law or International Paper’s policy; and an office of ethics and business practice. The internal control system further includes careful selection and training of supervisory and management personnel, appropriate delegation of authority and division of responsibility, dissemination of accounting and business policies throughout International Paper, and an extensive program of internal audits with management follow-up.
The Board of Directors, assisted by the Audit and Finance Committee ("Committee"), monitors the integrity of the Company’s financial statements and financial reporting procedures, the performance of the Company’s internal audit function and independent auditors, and other matters set forth in its charter. The
Committee, which consists of independent directors, meets regularly with representatives of management, and with the independent auditors and the Internal Auditor, with and without management representatives in attendance, to review their activities. The Committee’s Charter takes into account the New York Stock Exchange rules relating to Audit Committees and the SEC rules and regulations promulgated as a result of the Sarbanes-Oxley Act of 2002. The Committee has reviewed and discussed the consolidated financial statements for the year ended December 31, 2022, including critical accounting policies and significant management judgments, with management and the independent auditors. The Committee’s report recommending the inclusion of such financial statements in this Annual Report on Form 10-K will be set forth in our Proxy Statement.

MARK S. SUTTON
CHAIRMAN AND CHIEF EXECUTIVE OFFICER

TIMOTHY S. NICHOLLS
SENIOR VICE PRESIDENT AND CHIEF FINANCIAL OFFICER
REPORT OF INDEPENDENT REGISTERED PUBLIC ACCOUNTING FIRM
To the shareholders and the Board of Directors of International Paper Company:
Opinion on the Financial Statements
We have audited the accompanying consolidated balance sheets of International Paper Company and subsidiaries (the "Company") as of December 31, 2022 and 2021, the related consolidated statements of operations, comprehensive income (loss), changes in equity, and cash flows for each of the three years in the period ended December 31, 2022, and the related notes (collectively referred to as the "financial statements"). In our opinion, the financial statements present fairly, in all material respects, the financial position of the Company as of December 31, 2022 and 2021, and the results of its operations and its cash flows for each of the three years in the period ended December 31, 2022, in conformity with accounting principles generally accepted in the United States of America.
We did not audit the financial statements of Ilim S.A. as of and for the year ended December 31, 2022. The Company’s investment in Ilim S.A. is accounted for by use of the equity method and is presented as held-for-sale and within discontinued operations, as disclosed in Note 11. The accompanying financial statements of the Company include its equity investment in Ilim S.A. of $133 million as of December 31, 2022, and its equity earnings in Ilim S.A. of $296 million for the year ended December 31, 2022. The financial statements of Ilim S.A. were audited by other auditors whose report has been furnished to us, and our opinion, insofar as it relates to the amounts included for Ilim S.A. as of and for the year ended December 31, 2022, is based solely on the report of the other auditors.
We have also audited, in accordance with the standards of the Public Company Accounting Oversight Board (United States) (PCAOB), the Company's internal control over financial reporting as of December 31, 2022, based on criteria established in Internal Control — Integrated Framework (2013) issued by the Committee of Sponsoring Organizations of the Treadway Commission and our report dated February 17, 2023, expressed an unqualified opinion on the Company's internal control over financial reporting.
Basis for Opinion
These financial statements are the responsibility of the Company's management. Our responsibility is to express an opinion on the Company's financial
statements based on our audits. We are a public accounting firm registered with the PCAOB and are required to be independent with respect to the Company in accordance with the U.S. federal securities laws and the applicable rules and regulations of the Securities and Exchange Commission and the PCAOB.
We conducted our audits in accordance with the standards of the PCAOB. Those standards require that we plan and perform the audit to obtain reasonable assurance about whether the financial statements are free of material misstatement, whether due to error or fraud. Our audits included performing procedures to assess the risks of material misstatement of the financial statements, whether due to error or fraud, and performing procedures that respond to those risks. Such procedures included examining, on a test basis, evidence regarding the amounts and disclosures in the financial statements. Our audits also included evaluating the accounting principles used and significant estimates made by management, as well as evaluating the overall presentation of the financial statements. We believe that our audits provide a reasonable basis for our opinion.
Critical Audit Matters
The critical audit matter communicated below is a matter arising from the current-period audit of the financial statements that was communicated or required to be communicated to the Audit and Finance Committee and that (1) relates to an account or disclosure that is material to the financial statements and (2) involved our especially challenging, subjective, or complex judgments. The communication of critical audit matters does not alter in any way our opinion on the financial statements, taken as a whole, and we are not, by communicating the critical audit matter below, providing a separate opinion on the critical audit matter or on the accounts or disclosures to which it relates.
Retirement Plans — Plan Assets — Refer to Note 19 to the financial statements
Critical Audit Matter Description
As of December 31, 2022, the Company’s Pension Plans held approximately $2.8 billion in investments whose reported value is determined based on net asset value (“NAV”). The strategic asset allocation policy prescribed by the Company’s Pension Plan includes permissible investments in certain hedge funds, private equity funds, and real estate funds whose reported values are determined based on the estimated NAV of each investment.
These NAVs are generally determined by the Pension Plan’s third-party administrators or fund managers and are subject to review and oversight by management of the Company and its third-party investment advisors.
Given a lack of a readily determinable value of these investments and the subjective nature of the valuation methodologies and unobservable inputs used in these methodologies, auditing the NAV associated with these investments requires a high degree of auditor judgment and an increased extent of effort, including the need to involve professionals in our firm having expertise in alternative investments.
How the Critical Audit Matter Was Addressed in the Audit
Our audit procedures related to the determination of NAV associated with the Company’s Pension Plan’s investments in hedge funds, private equity funds, and real estate funds included the following, among others:
-
We tested the effectiveness of controls over the Company’s determination and evaluation of NAV, including those related to the reliability of NAVs reported by third-party administrators and fund managers.
-
We inquired of management and the investment advisors regarding changes to the investment portfolio and investment strategies.
-
We obtained a confirmation from the third-party custodian as of December 31, 2022 of all individual investments held in trust for the Pension Plan to confirm the existence of each individual asset held in trust.
-
For each selected investment fund with a fiscal year end of December 31, we performed a retrospective review in which we compared the estimated fair value recorded by the Company in the December 31, 2021 financial statements, to the actual fair value of the fund (using the per-share NAV disclosed in the fund’s subsequently issued audited financial statements), to evaluate the appropriateness of management’s estimation process.
-
With the assistance of professionals in our firm having expertise in alternative investments, we rolled forward the valuation from the selected funds’ most recently audited financial statements to December 31, 2022. This roll forward procedure included
consideration of the Company’s transactions in the fund during the period, as well as an estimate of the funds’ returns based on an appropriate, independently obtained benchmark or index. We then compared our independent fund valuation estimate to the December 31, 2022, balance recorded by the Company. For certain selected funds, our roll forward procedures included alternative procedures, such as inspecting trust statements for observable transactions near year-end to compare to the estimated fair value.
- For certain investments, we inquired of management to understand year-over-year changes in the fund manager’s estimate of NAV and compared the fund’s return on investment to other available qualitative and quantitative information.
/s/ Deloitte & Touche LLP
Memphis, Tennessee
February 17, 2023
We have served as the Company's auditor since 2002.
REPORT OF INDEPENDENT REGISTERED PUBLIC ACCOUNTING FIRM
To the shareholders and the Board of Directors of International Paper Company:
Opinion on Internal Control over Financial Reporting
We have audited the internal control over financial reporting of International Paper Company and subsidiaries (the “Company”) as of December 31, 2022, based on criteria established in Internal Control — Integrated Framework (2013) issued by the Committee of Sponsoring Organizations of the Treadway Commission (COSO). In our opinion, the Company maintained, in all material respects, effective internal control over financial reporting as of December 31, 2022, based on criteria established in Internal Control — Integrated Framework (2013) issued by COSO.
We have also audited, in accordance with the standards of the Public Company Accounting Oversight Board (United States) (PCAOB), the consolidated financial statements as of and for the year ended December 31, 2022, of the Company and our report dated February 17, 2023, expressed an unqualified opinion on those financial statements.
Basis for Opinion
The Company’s management is responsible for maintaining effective internal control over financial reporting and for its assessment of the effectiveness of internal control over financial reporting, included in the accompanying Report of Management on Internal Control over Financial Reporting. Our responsibility is to express an opinion on the Company’s internal control over financial reporting based on our audit. We are a public accounting firm registered with the PCAOB and are required to be independent with respect to the Company in accordance with the U.S. federal securities laws and the applicable rules and regulations of the Securities and Exchange Commission and the PCAOB.
We conducted our audit in accordance with the standards of the PCAOB. Those standards require that we plan and perform the audit to obtain reasonable assurance about whether effective internal control over financial reporting was maintained in all material respects. Our audit included obtaining an understanding of internal control over financial reporting, assessing the risk that a material weakness exists, testing and evaluating the design and operating effectiveness of internal control based on the assessed risk, and performing such other procedures as we considered necessary in the circumstances. We believe that our audit provides a reasonable basis for our opinion.
Definition and Limitations of Internal Control over Financial Reporting
A company’s internal control over financial reporting is a process designed to provide reasonable assurance regarding the reliability of financial reporting and the preparation of financial statements for external purposes in accordance with generally accepted accounting principles. A company’s internal control over financial reporting includes those policies and procedures that (1) pertain to the maintenance of records that, in reasonable detail, accurately and fairly reflect the transactions and dispositions of the assets of the company; (2) provide reasonable assurance that transactions are recorded as necessary to permit preparation of financial statements in accordance with generally accepted accounting principles, and that receipts and expenditures of the company are being made only in accordance with authorizations of management and directors of the company; and (3) provide reasonable assurance regarding prevention or timely detection of unauthorized acquisition, use, or disposition of the company’s assets that could have a material effect on the financial statements.
Because of its inherent limitations, internal control over financial reporting may not prevent or detect misstatements. Also, projections of any evaluation of effectiveness to future periods are subject to the risk that controls may become inadequate because of changes in conditions, or that the degree of compliance with the policies or procedures may deteriorate.
/s/ Deloitte & Touche LLP
Memphis, Tennessee
February 17, 2023
CONSOLIDATED STATEMENT OF OPERATIONS
| In millions, except per share amounts, for the years ended December 31 | 2022 | 2021 | 2020 | ||||||||
| NET SALES | $ | 21,161 | $ | 19,363 | $ | 17,565 | |||||
| COSTS AND EXPENSES | |||||||||||
| Cost of products sold | 15,143 | 13,832 | 12,339 | ||||||||
| Selling and administrative expenses | 1,293 | 1,385 | 1,353 | ||||||||
| Depreciation, amortization and cost of timber harvested | 1,040 | 1,097 | 1,091 | ||||||||
| Distribution expenses | 1,783 | 1,444 | 1,287 | ||||||||
| Taxes other than payroll and income taxes | 148 | 139 | 136 | ||||||||
| Restructuring and other charges, net | 89 | 509 | 195 | ||||||||
| Net (gains) losses on sales and impairments of businesses | 76 | (7) | 465 | ||||||||
| Net (gains) losses on sales of equity method investments | 10 | (204) | (35) | ||||||||
| Net (gains) losses on mark to market investments | (65) | 32 | — | ||||||||
| Interest expense, net | 325 | 337 | 446 | ||||||||
| Non-operating pension (income) expense | (192) | (200) | (41) | ||||||||
| EARNINGS (LOSS) FROM CONTINUING OPERATIONS BEFORE INCOME TAXES AND EQUITY EARNINGS (LOSSES) | 1,511 | 999 | 329 | ||||||||
| Income tax provision (benefit) | (236) | 188 | 176 | ||||||||
| Equity earnings (loss), net of taxes | (6) | 2 | 29 | ||||||||
| EARNINGS (LOSS) FROM CONTINUING OPERATIONS | 1,741 | 813 | 182 | ||||||||
| Discontinued operations, net of taxes | (237) | 941 | 300 | ||||||||
| NET EARNINGS (LOSS) | 1,504 | 1,754 | 482 | ||||||||
| Less: Net earnings (loss) attributable to noncontrolling interests | — | 2 | — | ||||||||
| NET EARNINGS (LOSS) ATTRIBUTABLE TO INTERNATIONAL PAPER COMPANY | $ | 1,504 | $ | 1,752 | $ | 482 | |||||
| BASIC EARNINGS (LOSS) PER SHARE ATTRIBUTABLE TO INTERNATIONAL PAPER COMPANY COMMON SHAREHOLDERS | |||||||||||
| Earnings (loss) from continuing operations | $ | 4.79 | $ | 2.08 | $ | 0.46 | |||||
| Discontinued operations, net of taxes | (0.65) | 2.42 | 0.77 | ||||||||
| Net earnings (loss) | $ | 4.14 | $ | 4.50 | $ | 1.23 | |||||
| DILUTED EARNINGS (LOSS) PER SHARE ATTRIBUTABLE TO INTERNATIONAL PAPER COMPANY COMMON SHAREHOLDERS | |||||||||||
| Earnings (loss) from continuing operations | $ | 4.74 | $ | 2.07 | $ | 0.46 | |||||
| Discontinued operations, net of taxes | (0.64) | 2.40 | 0.76 | ||||||||
| Net earnings (loss) | $ | 4.10 | $ | 4.47 | $ | 1.22 |
The accompanying notes are an integral part of these financial statements.
CONSOLIDATED STATEMENT OF COMPREHENSIVE INCOME (LOSS)
| In millions for the years ended December 31 | 2022 | 2021 | 2020 | ||||||||
| NET EARNINGS (LOSS) | $ | 1,504 | $ | 1,754 | $ | 482 | |||||
| OTHER COMPREHENSIVE INCOME (LOSS), NET OF TAX | |||||||||||
| Amortization of pension and postretirement prior service costs and net loss: | |||||||||||
| U.S. plans (less tax of $28, $41 and $56) | 85 | 124 | 170 | ||||||||
| Non-U.S. plans (less tax of $0, $0 and $0) | 1 | 1 | — | ||||||||
| Pension and postretirement liability adjustments: | |||||||||||
| U.S. plans (less tax of $(109), $235 and $76) | (327) | 706 | 229 | ||||||||
| Non-U.S. plans (less tax of $1, $1 and $(1)) | 8 | 7 | (2) | ||||||||
| Change in cumulative foreign currency translation adjustment (less tax of $0, $0 and $1) | (28) | 69 | 8 | ||||||||
| Net gains/losses on cash flow hedging derivatives: | |||||||||||
| Net gains (losses) arising during the period (less tax of $0, $1 and $(15)) | — | 3 | (34) | ||||||||
| Reclassification adjustment for (gains) losses included in net earnings (less tax of $1, $(2) and $13) | 2 | (9) | 26 | ||||||||
| TOTAL OTHER COMPREHENSIVE INCOME (LOSS), NET OF TAX | (259) | 901 | 397 | ||||||||
| Comprehensive Income (Loss) | 1,245 | 2,655 | 879 | ||||||||
| Net (Earnings) Loss Attributable to Noncontrolling Interests | — | (2) | — | ||||||||
| Other Comprehensive (Income) Loss Attributable to Noncontrolling Interests | — | 2 | — | ||||||||
| COMPREHENSIVE INCOME (LOSS) ATTRIBUTABLE TO INTERNATIONAL PAPER COMPANY | $ | 1,245 | $ | 2,655 | $ | 879 |
The accompanying notes are an integral part of these financial statements.
| In millions, except per share amounts, at December 31 | 2022 | 2021 | ||||||
| ASSETS | ||||||||
| Current Assets | ||||||||
| Cash and temporary investments | $ | 804 | $ | 1,295 | ||||
| Accounts and notes receivable (less allowances of $31 in 2022 and $34 in 2021) | 3,284 | 3,232 | ||||||
| Contract assets | 481 | 378 | ||||||
| Inventories | 1,942 | 1,814 | ||||||
| Current investments | — | 245 | ||||||
| Assets held for sale | 133 | — | ||||||
| Other current assets | 126 | 132 | ||||||
| Total Current Assets | 6,770 | 7,096 | ||||||
| Plants, Properties and Equipment, net | 10,431 | 10,441 | ||||||
| Long-Term Investments | 186 | 194 | ||||||
| Long-Term Financial Assets of Variable Interest Entities (Note 15) | 2,294 | 2,275 | ||||||
| Goodwill | 3,041 | 3,130 | ||||||
| Overfunded Pension Plan Assets | 297 | 595 | ||||||
| Right of Use Assets | 424 | 365 | ||||||
| Long-Term Assets Held for Sale | — | 557 | ||||||
| Deferred Charges and Other Assets | 497 | 590 | ||||||
| TOTAL ASSETS | $ | 23,940 | $ | 25,243 | ||||
| LIABILITIES AND EQUITY | ||||||||
| Current Liabilities | ||||||||
| Notes payable and current maturities of long-term debt | $ | 763 | $ | 196 | ||||
| Accounts payable | 2,708 | 2,606 | ||||||
| Accrued payroll and benefits | 355 | 440 | ||||||
| Other current liabilities | 1,174 | 902 | ||||||
| Total Current Liabilities | 5,000 | 4,144 | ||||||
| Long-Term Debt | 4,816 | 5,383 | ||||||
| Long-Term Nonrecourse Financial Liabilities of Variable Interest Entities (Note 15) | 2,106 | 2,099 | ||||||
| Deferred Income Taxes | 1,732 | 2,618 | ||||||
| Underfunded Pension Benefit Obligation | 281 | 377 | ||||||
| Postretirement and Postemployment Benefit Obligation | 150 | 205 | ||||||
| Long-Term Lease Obligations | 283 | 236 | ||||||
| Other Liabilities | 1,075 | 1,099 | ||||||
| Commitments and Contingent Liabilities (Note 14) | ||||||||
| Equity | ||||||||
| Common stock $1 par value, 2022 - 448.9 shares and 2021 - 448.9 shares | 449 | 449 | ||||||
| Paid-in capital | 4,725 | 4,668 | ||||||
| Retained earnings | 9,855 | 9,029 | ||||||
| Accumulated other comprehensive loss | (1,925) | (1,666) | ||||||
| 13,104 | 12,480 | |||||||
| Less: Common stock held in treasury, at cost, 2022 – 98.6 shares and 2021 – 70.4 shares | 4,607 | 3,398 | ||||||
| Total Equity | 8,497 | 9,082 | ||||||
| TOTAL LIABILITIES AND EQUITY | $ | 23,940 | $ | 25,243 |
The accompanying notes are an integral part of these financial statements.
CONSOLIDATED STATEMENT OF CASH FLOWS
| In millions for the years ended December 31 | 2022 | 2021 | 2020 | ||||||||
| OPERATING ACTIVITIES | |||||||||||
| Net earnings (loss) | $ | 1,504 | $ | 1,754 | $ | 482 | |||||
| Depreciation, amortization, and cost of timber harvested | 1,040 | 1,210 | 1,287 | ||||||||
| Deferred income tax provision (benefit), net | (773) | (291) | 9 | ||||||||
| Restructuring and other charges, net | 89 | 509 | 195 | ||||||||
| Periodic pension (income) expense, net | (116) | (112) | 32 | ||||||||
| Net (gains) losses on mark to market investments | (65) | 32 | — | ||||||||
| Net (gains) losses on sales and impairments of businesses | 76 | (358) | 465 | ||||||||
| Net (gains) losses on sales and impairments of equity method investments | 543 | (205) | (35) | ||||||||
| Net (gains) losses on sales of fixed assets | — | (86) | — | ||||||||
| Equity method dividends received | 204 | 159 | 162 | ||||||||
| Equity (earnings) losses, net | (291) | (313) | (77) | ||||||||
| Other, net | 108 | 157 | 219 | ||||||||
| Changes in current assets and liabilities | |||||||||||
| Accounts and notes receivable | (59) | (596) | 59 | ||||||||
| Contract assets | (103) | (49) | 35 | ||||||||
| Inventories | (162) | (263) | 35 | ||||||||
| Accounts payable and accrued liabilities | 110 | 519 | 141 | ||||||||
| Interest payable | 41 | (32) | (55) | ||||||||
| Other | 28 | (5) | 109 | ||||||||
| CASH PROVIDED BY (USED FOR) OPERATING ACTIVITIES | 2,174 | 2,030 | 3,063 | ||||||||
| INVESTMENT ACTIVITIES | |||||||||||
| Invested in capital projects, net of insurance recoveries | (931) | (549) | (751) | ||||||||
| Acquisitions, net of cash acquired | — | (80) | (65) | ||||||||
| Proceeds from sales of equity method investments | — | 908 | 500 | ||||||||
| Proceeds from sales of businesses, net of cash divested | — | 827 | 40 | ||||||||
| Proceeds from exchange of equity securities | 311 | — | — | ||||||||
| Proceeds from settlement of Variable Interest Entities | — | 4,850 | — | ||||||||
| Proceeds from sale of fixed assets | 13 | 101 | 8 | ||||||||
| Other | (1) | (3) | (1) | ||||||||
| CASH PROVIDED BY (USED FOR) INVESTMENT ACTIVITIES | (608) | 6,054 | (269) | ||||||||
| FINANCING ACTIVITIES | |||||||||||
| Repurchases of common stock and payments of restricted stock tax withholding | (1,284) | (839) | (42) | ||||||||
| Issuance of debt | 1,011 | 1,512 | 583 | ||||||||
| Reduction of debt | (1,017) | (2,509) | (2,278) | ||||||||
| Change in book overdrafts | 1 | 65 | 35 | ||||||||
| Dividends paid | (673) | (780) | (806) | ||||||||
| Reduction of Variable Interest Entity loans | — | (4,220) | — | ||||||||
| Distribution to Sylvamo Corporation | — | (130) | — | ||||||||
| Net debt tender premiums paid | (89) | (456) | (188) | ||||||||
| Other | (3) | (18) | (4) | ||||||||
| CASH PROVIDED BY (USED FOR) FINANCING ACTIVITIES | (2,054) | (7,375) | (2,700) | ||||||||
| Cash Included in Assets Held for Sale | — | — | (2) | ||||||||
| Effect of Exchange Rate Changes on Cash | (3) | (9) | (8) | ||||||||
| Change in Cash and Temporary Investments | (491) | 700 | 84 | ||||||||
| Cash and Temporary Investments | |||||||||||
| Beginning of the period | 1,295 | 595 | 511 | ||||||||
| End of the period | $ | 804 | $ | 1,295 | $ | 595 |
The accompanying notes are an integral part of these financial statements.
CONSOLIDATED STATEMENT OF CHANGES IN EQUITY
| In millions | Common Stock Issued | Paid-in Capital | Retained Earnings | Accumulated Other Comprehensive Income (Loss) | Common Stock Held In Treasury, At Cost | Total International Paper Shareholders’ Equity | Noncontrolling Interests | Total Equity | ||||||||||||||||||
| BALANCE, JANUARY 1, 2020 | $ | 449 | $ | 6,297 | $ | 8,408 | $ | (4,739) | $ | 2,702 | $ | 7,713 | $ | 5 | $ | 7,718 | ||||||||||
| Adoption of ASU 2016-13 measurement of credit losses on financial instruments | — | — | (2) | — | — | (2) | — | (2) | ||||||||||||||||||
| Issuance of stock for various plans, net | — | (8) | — | — | (96) | 88 | — | 88 | ||||||||||||||||||
| Repurchase of stock | — | — | — | — | 42 | (42) | — | (42) | ||||||||||||||||||
| Dividends ($2.050 per share) | — | — | (818) | — | — | (818) | — | (818) | ||||||||||||||||||
| Transactions of equity method investees | — | 36 | — | — | — | 36 | — | 36 | ||||||||||||||||||
| Transactions with noncontrolling interest holders | — | — | — | — | — | — | 9 | 9 | ||||||||||||||||||
| Comprehensive income (loss) | — | — | 482 | 397 | — | 879 | — | 879 | ||||||||||||||||||
| BALANCE, DECEMBER 31, 2020 | 449 | 6,325 | 8,070 | (4,342) | 2,648 | 7,854 | 14 | 7,868 | ||||||||||||||||||
| Sylvamo Corporation spin-off | — | (1,729) | — | 1,773 | — | 44 | (1) | 43 | ||||||||||||||||||
| Issuance of stock for various plans, net | — | 54 | — | — | (89) | 143 | — | 143 | ||||||||||||||||||
| Repurchase of stock | — | — | — | — | 839 | (839) | — | (839) | ||||||||||||||||||
| Dividends ($2.000 per share) | — | — | (793) | — | — | (793) | — | (793) | ||||||||||||||||||
| Transactions of equity method investees | — | 18 | — | — | — | 18 | — | 18 | ||||||||||||||||||
| Divestiture of noncontrolling interests | — | — | — | — | — | — | (13) | (13) | ||||||||||||||||||
| Comprehensive income (loss) | — | — | 1,752 | 903 | — | 2,655 | — | 2,655 | ||||||||||||||||||
| BALANCE, DECEMBER 31, 2021 | 449 | 4,668 | 9,029 | (1,666) | 3,398 | 9,082 | — | 9,082 | ||||||||||||||||||
| Issuance of stock for various plans, net | — | 57 | — | — | (75) | 132 | — | 132 | ||||||||||||||||||
| Repurchase of stock | — | — | — | — | 1,284 | (1,284) | — | (1,284) | ||||||||||||||||||
| Dividends ($1.850 per share) | — | — | (678) | — | — | (678) | — | (678) | ||||||||||||||||||
| Comprehensive income (loss) | — | — | 1,504 | (259) | — | 1,245 | — | 1,245 | ||||||||||||||||||
| BALANCE, DECEMBER 31, 2022 | $ | 449 | $ | 4,725 | $ | 9,855 | $ | (1,925) | $ | 4,607 | $ | 8,497 | $ | — | $ | 8,497 |
The accompanying notes are an integral part of these financial statements.
NOTES TO CONSOLIDATED FINANCIAL STATEMENTS
NOTE 1 SUMMARY OF BUSINESS AND SIGNIFICANT ACCOUNTING POLICIES
NATURE OF BUSINESS
International Paper (the "Company") is a global producer of renewable fiber-based packaging and pulp products with primary markets and manufacturing operations in North America and Europe and additional markets and manufacturing operations in Latin America, North Africa and Asia. Substantially all of our businesses have experienced, and are likely to continue to experience, cycles relating to available industry capacity and general economic conditions.
FINANCIAL STATEMENTS
These consolidated financial statements have been prepared in conformity with accounting principles generally accepted in the United States that require the use of management’s estimates. Actual results could differ from management’s estimates.
Printing Papers Spinoff
On October 1, 2021, the Company completed the previously announced spin-off of its Printing Papers segment along with certain mixed-use coated paperboard and pulp businesses in North America, France and Russia into a standalone, publicly-traded company, Sylvamo Corporation ("Sylvamo"). The transaction was implemented through the distribution of shares of the standalone company to International Paper's shareholders (the "Distribution"). As a result of the Distribution, Sylvamo is an independent public company that trades on the New York Stock Exchange under the symbol "SLVM".
In addition to the spin-off of Sylvamo, the Company completed the sale of its Kwidzyn, Poland mill on August 6, 2021. All historical operating results of the Sylvamo businesses and Kwidzyn mill have been presented as Discontinued Operations, net of tax, in the consolidated statement of operations. See Note 8 - Divestitures for further details regarding the Sylvamo spin-off and discontinued operations.
Russia-Ukraine Conflict
The military conflict between Russia and Ukraine, including ongoing sanctions, actions by the Russian government, and associated domestic and global economic and geopolitical conditions, has adversely affected and may continue to adversely affect our Ilim joint venture and our businesses, financial condition, results of operations and cash flows. We recently
announced that we have reached an agreement to sell our equity interest in Ilim and have also received from the same purchaser an indication of interest to purchase our equity investment in Ilim Group, however, we cannot be certain if and when the completion of these sales may occur. Our ability to complete such sales is subject to various risks, including (i) purchasers’ inability to obtain necessary regulatory approvals or to finance the purchase pursuant to the terms of the agreement, (ii) adverse actions by the Russian government, and (iii) new or expanded sanctions imposed by the U.S., the United Kingdom, or the European Union or its member countries. We are unable to predict the full impact that Russia’s ongoing invasion of Ukraine, current or potential future sanctions, ongoing or potential disruptions resulting from the conflict, the changing regulatory environment in Russia, negative macroeconomic conditions arising from such conflict, supply chain disruptions, and geopolitical instability and shifts, may have on us or our ability to complete the sale of our interest in the Ilim joint venture.
DISCONTINUED OPERATIONS
A discontinued operation may include a component or a group of components of the Company's operations. A disposal of a component or a group of components is reported in discontinued operations if the disposal represents a strategic shift that has or will have a major effect on the Company's operations and financial results when the following occurs: (1) a component (or group of components) meets the criteria to be classified as held for sale; (2) the component or group of components is disposed of by sale; or (3) the component or group of components is disposed of other than by sale (for example, by abandonment or in a distribution to owners in a spin-off). For any component classified as held for sale or disposed of by sale or other than by sale, qualifying for presentation as a discontinued operation, the Company reports the results of operations of the discontinued operations (including any gain or loss recognized on the disposal or loss recognized on classification as held for sale of a discontinued operation), less applicable income taxes (benefit), as a separate component in the consolidated statement of operations for current and all prior periods presented. The Company also reports assets and liabilities associated with discontinued operations as separate line items on the consolidated balance sheet.
CONSOLIDATION
The consolidated financial statements include the accounts of International Paper and subsidiaries for which we have a controlling financial interest, including variable interest entities for which we are
the primary beneficiary. All significant intercompany balances and transactions are eliminated.
EQUITY METHOD INVESTMENTS
The equity method of accounting is applied for investments when the Company has significant influence over the investee’s operations, or when the investee is structured with separate capital accounts. Our material equity method investments are described in Note 11.
OTHER-THAN-TEMPORARY IMPAIRMENT
The Company evaluates our equity method investments for other-than-temporary impairment (OTTI) when circumstances indicate the investment may be impaired. When a decline in fair value is deemed to be an OTTI, an impairment is recognized to the extent that the fair value is less than the carrying value of the investment. We consider various factors in determining whether a loss in value of an investment is other than temporary including: the length of time and the extent to which the fair value has been below cost, the financial condition of the investee, and our intent and ability to retain the investment for a period of time sufficient to allow for recovery of value. Management makes certain judgments and estimates in its assessment including but not limited to: identifying if circumstances indicate a decline in value is other than temporary, expectations about operations, as well as industry, financial, regulatory and market factors.
BUSINESS COMBINATIONS
The Company allocates the total consideration of the assets acquired and liabilities assumed based on their estimated fair value as of the business combination date. In developing estimates of fair values for long-lived assets, including identifiable intangible assets, the Company utilizes a variety of inputs including forecasted cash flows, anticipated growth rates, discount rates, estimated replacement costs and depreciation and obsolescence factors. Determining the fair value for specifically identified intangible assets such as customer lists and developed technology involves judgment. We may refine our estimates and make adjustments to the assets acquired and liabilities assumed over a measurement period, not to exceed one year. Upon the conclusion of the measurement period or the final determination of the values of assets acquired and liabilities assumed, whichever comes first, any subsequent adjustments are charged to the consolidated statement of operations. Subsequent actual results of the underlying business activity supporting the specifically identified intangible assets could change, requiring us to record impairment
charges or adjust their economic lives in future periods. See Note 7 for further details.
RESTRUCTURING LIABILITIES AND COSTS
For operations to be closed or restructured, a liability and related expense is recorded in the period when operations cease. For termination costs associated with employees covered by a written or substantive plan, a liability is recorded when it is probable that employees will be entitled to benefits and the amount can be reasonably estimated. For termination costs associated with employees not covered by a written and broadly communicated policy covering involuntary termination benefits (severance plan), a liability is recorded for costs to terminate employees (one-time termination benefits) when the termination plan has been approved and committed to by management, the employees to be terminated have been identified, the termination plan benefit terms are communicated, the employees identified in the plan have been notified and actions required to complete the plan indicate that it is unlikely that significant
changes to the plan will be made or that the plan will be withdrawn. The timing and amount of an accrual is dependent upon the type of benefits granted, the timing of communication and other provisions that may be provided in the benefit plan. The accounting for each termination is evaluated individually. See Note 6 for further details.
REVENUE RECOGNITION
Generally, the Company recognizes revenue on a point-in-time basis when the customer takes title to the goods and assumes the risks and rewards for the goods. For customized goods where the Company has a legally enforceable right to payment for the goods, the Company recognizes revenue over time, which generally is, as the goods are produced.
The Company’s revenue is primarily derived from fixed consideration; however, we do have contract terms that give rise to variable consideration, primarily volume rebates, early payment discounts and other customer refunds. The Company estimates its volume rebates at the individual customer level based on the most likely amount method outlined in ASC 606. The Company estimates early payment discounts and other customer refunds based on the historical experience across the Company's portfolio of customers to record reductions in revenue that is consistent with the expected value method outlined in ASC 606. Management has concluded that these methods result in the best estimate of the consideration the Company will be entitled to from its customers.
The Company has elected to present all sales taxes on a net basis, account for shipping and handling activities as fulfillment activities, recognize the incremental costs of obtaining a contract as expense when incurred if the amortization period of the asset the Company would recognize is one year or less, and not record interest income or interest expense when the difference in timing of control or transfer and customer payment is one year or less. See Note 3 for further details.
TEMPORARY INVESTMENTS
Temporary investments with an original maturity of three months or less and money market funds with greater than three month maturities but with the right to redeem without notice are treated as cash equivalents and are stated at cost, which approximates market value. See Note 9 for further details.
INVENTORIES
Inventories are valued at the lower of cost or market value and include all costs directly associated with manufacturing products: materials, labor and manufacturing overhead. In the United States, costs of raw materials and finished pulp and paper products, are generally determined using the last-in, first-out method. Other inventories are valued using the first-in, first-out or average cost methods. See Note 9 for further details.
LEASED ASSETS
Operating lease right of use (ROU) assets and liabilities are recognized at the commencement date of the lease based on the present value of lease payments over the lease term. The Company's leases may include options to extend or terminate the lease. These options to extend are included in the lease term when it is reasonably certain that we will exercise that option. Some leases have variable payments, however, because they are not based on an index or rate, they are not included in the ROU assets and liabilities. Variable payments for real estate leases primarily relate to common area maintenance, insurance, taxes and utilities. Variable payments for equipment, vehicles, and leases within supply agreements primarily relate to usage, repairs and maintenance. As the implicit rate is not readily determinable for most of the Company's leases, the Company applies a portfolio approach using an estimated incremental borrowing rate to determine the initial present value of lease payments over the lease terms on a collateralized basis over a similar term, which is based on market and company specific information. We use the unsecured borrowing rate and risk-adjust that rate to approximate a collateralized rate, and apply the rate based on the
currency of the lease, which is updated on a quarterly basis for measurement of new lease liabilities. Leases having a lease term of twelve months or less are not recorded on the balance sheet and the related lease expense is recognized on a straight-line basis over the term of the lease. In addition, the Company has applied the practical expedient to account for the lease and non-lease components as a single lease component for all of the Company's leases except for certain gas and chemical agreements. See Note 10 for further details.
PLANTS, PROPERTIES AND EQUIPMENT
Plants, properties and equipment are stated at cost, less accumulated depreciation. Expenditures for betterments are capitalized, whereas normal repairs and maintenance are expensed as incurred. The units-of-production method of depreciation is used for pulp and paper mills, and the straight-line method is used for other plants and equipment. See Note 9 for further details.
GOODWILL
Annual evaluation for possible goodwill impairment is performed as of the beginning of the fourth quarter of each year, with additional interim evaluation performed when management believes that it is more likely than not, that events or circumstances have occurred that would result in the impairment of a reporting unit’s goodwill.
The Company has the option to evaluate goodwill for impairment by first performing a qualitative assessment of events and circumstances to determine whether it is more likely than not that the fair value of a reporting unit is less than its carrying amount. If, after assessing the totality of events or circumstances, the Company determines that it is not more likely than not that the fair value of a reporting unit is less than its carrying amounts, then the quantitative goodwill impairment test is not required to be performed. If the Company determines that it is more likely than not that the fair value of a reporting unit is less than its carrying amount, or if the Company does not elect the option to perform an initial qualitative assessment, the Company is required to perform the quantitative goodwill impairment test. In performing this evaluation, the Company estimates the fair value of its reporting unit using a weighted approach based on discounted future cash flows, market multiples and transaction multiples. The determination of fair value using the discounted cash flow approach requires management to make significant estimates and assumptions related to forecasts of future revenues, operating profit margins, and discount rates. The determination of fair value using market multiples and transaction multiples requires management to make significant
assumptions related to revenue multiples and adjusted earnings before interest, taxes, depreciation, and amortization ("EBITDA") multiples. For reporting units whose carrying amount is in excess of their estimated fair value, the reporting unit will record an impairment charge by the amount that the carrying amount exceeds the reporting unit's fair value, not to exceed the total amount of goodwill allocated to the reporting unit.
IMPAIRMENT OF LONG-LIVED ASSETS
Long-lived assets are reviewed for impairment upon the occurrence of events or changes in circumstances that indicate that the carrying value of the assets may not be recoverable. A recoverability test is performed by comparing the undiscounted cash flows to carrying value of the assets. The inputs related to the undiscounted cash flows requires judgments as to whether assets are held and used or held for sale, the weighting of operational alternatives being considered by management and estimates of the amount and timing of expected future cash flows from the use of the long-lived assets generated by their use. If the carrying amount is less than the undiscounted cash flows, the fair value of the assets is compared to the carrying value to determine if they are impaired. We estimate fair value using discounted cash flows and other valuation techniques as needed. Impaired assets are recorded at their estimated fair value.
INCOME TAXES
International Paper uses the asset and liability method of accounting for income taxes whereby deferred income taxes are recorded for the future tax consequences attributable to differences between the financial statement and tax bases of assets and liabilities. Deferred tax assets and liabilities are measured using enacted tax rates expected to apply to taxable income in the years in which those temporary differences are expected to be recovered or settled. Deferred tax assets and liabilities are remeasured to reflect new tax rates in the periods rate changes are enacted.
International Paper records its global tax provision based on the respective tax rules and regulations for the jurisdictions in which it operates. Where the Company believes that a tax position is supportable for income tax purposes, the item is included in its income tax returns. Where treatment of a position is uncertain, liabilities are recorded based upon the Company’s evaluation of the “more likely than not” outcome considering technical merits of the position based on specific tax regulations and facts of each matter. Changes to recorded liabilities are only made when an identifiable event occurs that changes the likely outcome, such as settlement with the relevant
tax authority, the expiration of statutes of limitation for the subject tax year, change in tax laws, or recent court cases that are relevant to the matter. Accrued interest related to these uncertain tax positions is recorded in our consolidated statement of operations in Interest expense, net.
The judgments and estimates made by the Company are based on management’s evaluation of the technical merits of a matter, assisted as necessary by consultation with outside consultants, historical experience and other assumptions that management believes are appropriate and reasonable under current circumstances. Actual resolution of these matters may differ from recorded estimated amounts, resulting in adjustments that could materially affect future financial statements. See Note 13 for further details.
Valuation allowances are recorded to reduce deferred tax assets when it is more likely than not that a tax benefit will not be realized. Significant judgment is required in assessing the need for and magnitude of appropriate valuation allowances against deferred tax assets. This assessment is completed by tax jurisdiction and relies on both positive and negative evidence available, with significant weight placed on recent financial results. Cumulative reported pre-tax income is considered objectively verifiable positive evidence of our ability to generate positive pre-tax income in the future. In accordance with GAAP, when there is a recent history of pre-tax losses, there is little or no weight placed on forecasts for purposes of assessing the recoverability of our deferred tax assets. When necessary, we use systematic and logical methods to estimate when deferred tax liabilities will reverse and generate taxable income and when deferred tax assets will reverse and generate tax deductions. Assumptions, judgment, and the use of estimates are required when scheduling the reversal of deferred tax assets and liabilities, and the exercise is inherently complex and subjective. The realization of these assets is dependent on generating future taxable income, as well as successful implementation of various tax planning strategies.
International Paper uses the flow-through method to account for investment tax credits earned on eligible open-loop biomass facilities and combined heat and power system expenditures. Under this method, the investment tax credits are recognized as a reduction to income tax expense in the year they are earned rather than a reduction in the asset basis.
ENVIRONMENTAL REMEDIATION COSTS
Costs associated with environmental remediation obligations are accrued when such costs are
probable and reasonably estimable. Such accruals are adjusted as further information develops or circumstances change. Costs of future expenditures for environmental remediation obligations are discounted to their present value when the amount and timing of expected cash payments are reliably determinable. See Note 14 for further details.
TRANSLATION OF FINANCIAL STATEMENTS
Balance sheets of international operations are translated into U.S. dollars at year-end exchange rates, while statements of operations are translated at average rates. Adjustments resulting from financial statement translations are included as cumulative translation adjustments in Accumulated other comprehensive income (loss).
FAIR VALUE MEASUREMENTS
The guidance for fair value measurements and disclosures sets out a fair value hierarchy that groups fair value measurement inputs into the following three classifications:
Level 1: Quoted market prices in active markets for identical assets or liabilities.
Level 2: Observable market-based inputs other than quoted prices included within Level 1 that are observable for the asset or liability, either directly or indirectly.
Level 3: Unobservable inputs for the asset or liability reflecting the reporting entity’s own assumptions or external inputs from inactive markets.
Transfers between levels are recognized at the end of the reporting period.
NOTE 2 RECENT ACCOUNTING DEVELOPMENTS
Other than as described below, no new accounting pronouncement issued or effective during the fiscal year has had or is expected to have a material impact on the consolidated financial statements.
RECENTLY ADOPTED ACCOUNTING PRONOUNCEMENTS
Government Assistance
In November 2021, the FASB issued ASU 2021-10, "Government Assistance (Topic 832): Disclosures by Business Entities about Government Assistance." This guidance requires a business entity to provide certain disclosures around assistance received from governments. This guidance is effective for annual reporting periods beginning after December 15, 2021.
The Company adopted the provisions of this guidance in 2022. We analyzed the government assistance received by the Company and determined that the amounts received were not material to the Company's consolidated financial statements and related disclosures.
RECENTLY ISSUED ACCOUNTING PRONOUNCEMENTS NOT YET ADOPTED
Reference Rate Reform
In March 2020, the FASB issued ASU 2020-04, "Reference Rate Reform (Topic 848): Facilitation of the Effects of Reference Rate Reform on Financial Reporting." This guidance provides companies with optional guidance to ease the potential accounting burden associated with transitioning away from reference rates that are expected to be discontinued. This guidance is effective upon issuance and generally can be applied through December 31, 2024.
The Company will apply the amendments in this update to account for contract modifications due to changes in reference rates once those occur. We do
not expect these amendments to have a material impact on our consolidated financial statements and related disclosures.
Liabilities - Supplier Finance Programs
In September 2022, the FASB issued ASU 2022-04, "Liabilities - Supplier Finance Programs (Subtopic 405-50): Disclosure of Supplier Finance Program Obligations." This guidance requires a business entity operating as a buyer in a supplier finance agreement to disclose qualitative and quantitative information about its supplier finance programs. This guidance is effective for annual reporting periods beginning after December 15, 2022, and interim periods within those years. We do not expect this guidance to have a material impact on our consolidated financial statements. We continue to evaluate the disclosure requirements regarding supplier finance programs upon adoption.
NOTE 3 - REVENUE RECOGNITION
DISAGGREGATED REVENUE
| 2022 | ||||||||||||||||||||||||||
| Reportable Segments | Industrial Packaging | Global Cellulose Fibers | Corporate & Intersegment | Total | ||||||||||||||||||||||
| Primary Geographical Markets (a) | ||||||||||||||||||||||||||
| United States | $ | 14,970 | $ | 3,032 | $ | 480 | $ | 18,482 | ||||||||||||||||||
| EMEA | 1,572 | 121 | — | 1,693 | ||||||||||||||||||||||
| Pacific Rim and Asia | 46 | 74 | 3 | 123 | ||||||||||||||||||||||
| Americas, other than U.S. | 863 | — | — | 863 | ||||||||||||||||||||||
| Total | $ | 17,451 | $ | 3,227 | $ | 483 | $ | 21,161 | ||||||||||||||||||
| Operating Segments | ||||||||||||||||||||||||||
| North American Industrial Packaging | $ | 16,011 | $ | — | $ | — | $ | 16,011 | ||||||||||||||||||
| EMEA Industrial Packaging | 1,572 | — | — | 1,572 | ||||||||||||||||||||||
| Global Cellulose Fibers | — | 3,227 | — | 3,227 | ||||||||||||||||||||||
| Intrasegment Eliminations | (132) | — | — | (132) | ||||||||||||||||||||||
| Corporate & Intersegment Sales | — | — | 483 | 483 | ||||||||||||||||||||||
| Total | $ | 17,451 | $ | 3,227 | $ | 483 | $ | 21,161 |
(a) Net sales are attributed to countries based on the location of the reportable segment making the sale.
| 2021 | ||||||||||||||||||||||||||
| Reportable Segments | Industrial Packaging | Global Cellulose Fibers | Corporate & Intersegment | Total | ||||||||||||||||||||||
| Primary Geographical Markets (a) | ||||||||||||||||||||||||||
| United States | $ | 14,006 | $ | 2,510 | $ | 253 | $ | 16,769 | ||||||||||||||||||
| EMEA | 1,506 | 109 | (4) | 1,611 | ||||||||||||||||||||||
| Pacific Rim and Asia | 59 | 113 | 35 | 207 | ||||||||||||||||||||||
| Americas, other than U.S. | 755 | — | 21 | 776 | ||||||||||||||||||||||
| Total | $ | 16,326 | $ | 2,732 | $ | 305 | $ | 19,363 | ||||||||||||||||||
| Operating Segments | ||||||||||||||||||||||||||
| North American Industrial Packaging | $ | 14,944 | $ | — | $ | — | $ | 14,944 | ||||||||||||||||||
| EMEA Industrial Packaging | 1,508 | — | — | 1,508 | ||||||||||||||||||||||
| Global Cellulose Fibers | — | 2,732 | — | 2,732 | ||||||||||||||||||||||
| Intrasegment Eliminations | (126) | — | — | (126) | ||||||||||||||||||||||
| Corporate & Intersegment Sales | — | — | 305 | 305 | ||||||||||||||||||||||
| Total | $ | 16,326 | $ | 2,732 | $ | 305 | $ | 19,363 |
(a) Net sales are attributed to countries based on the location of the reportable segment making the sale.
| 2020 | ||||||||||||||||||||||||||
| Reportable Segments | Industrial Packaging | Global Cellulose Fibers | Corporate & Intersegment | Total | ||||||||||||||||||||||
| Primary Geographical Markets (a) | ||||||||||||||||||||||||||
| United States | 12,770 | 2,212 | 196 | 15,178 | ||||||||||||||||||||||
| EMEA | 1,309 | 90 | (4) | 1,395 | ||||||||||||||||||||||
| Pacific Rim and Asia | 57 | 91 | 55 | 203 | ||||||||||||||||||||||
| Americas, other than U.S. | 764 | — | 25 | 789 | ||||||||||||||||||||||
| Total | $ | 14,900 | $ | 2,393 | $ | 272 | $ | 17,565 | ||||||||||||||||||
| Operating Segments | ||||||||||||||||||||||||||
| North American Industrial Packaging | $ | 13,552 | $ | — | $ | — | $ | 13,552 | ||||||||||||||||||
| EMEA Industrial Packaging | 1,317 | — | — | 1,317 | ||||||||||||||||||||||
| Brazilian Industrial Packaging | 148 | — | — | 148 | ||||||||||||||||||||||
| Global Cellulose Fibers | — | 2,393 | — | 2,393 | ||||||||||||||||||||||
| Intrasegment Eliminations | (117) | — | — | (117) | ||||||||||||||||||||||
| Corporate & Intersegment Sales | — | — | 272 | 272 | ||||||||||||||||||||||
| Total | $ | 14,900 | $ | 2,393 | $ | 272 | $ | 17,565 |
(a) Net sales are attributed to countries based on the location of the reportable segment making the sale.
REVENUE CONTRACT BALANCES
A contract asset is created when the Company recognizes revenue on its customized products prior to having an unconditional right to payment from the customer, which generally does not occur until title and risk of loss passes to the customer.
A contract liability is created when customers prepay for goods prior to the Company transferring those goods to the customer. The contract liability is reduced once control of the goods is transferred to the customer. The majority of our customer prepayments are received during the fourth quarter each year for goods that will be transferred to customers over the following twelve months. Current liabilities of $38 million and $27 million are included in Other current liabilities in the accompanying consolidated balance sheet as of December 31, 2022 and 2021, respectively. During the second quarter of 2021, the Company also recorded a contract liability of $115 million related to the April 2021 acquisition disclosed in Note 7 - Acquisitions. The balance of this contract liability was $99 million and $107 million at December 31, 2022 and 2021, respectively, and is recorded in Other current liabilities and Other Liabilities in the accompanying consolidated balance sheet.
The difference between the opening and closing balances of the Company's contract assets and contract liabilities primarily results from the difference between the price and quantity at comparable points in time for goods which we have an unconditional
right to payment or receive prepayment from the customer, respectively.
PERFORMANCE OBLIGATIONS AND SIGNIFICANT JUDGMENTS
International Paper's principal business is to manufacture and sell fiber-based packaging and pulp goods. As a general rule, none of our businesses provide equipment installation or other ancillary services outside of producing and shipping packaging and pulp products to customers.
The nature of the Company's contracts can vary based on the business, customer type and region; however, in all instances it is International Paper's customary business practice to receive a valid order from the customer, in which each parties' rights and related payment terms are clearly identifiable.
Contracts or purchase orders with customers could include a single type of product or it could include multiple types/grades of products. Regardless, the contracted price with the customer is agreed to at the individual product level outlined in the customer contracts or purchase orders. The Company does not
bundle prices; however, we do negotiate with customers on pricing and rebates for the same products based on a variety of factors (e.g. level of contractual volume, geographical location, etc.). Management has concluded that the prices negotiated with each individual customer are representative of the stand-alone selling price of the product.
NOTE 4 EARNINGS PER SHARE ATTRIBUTABLE TO INTERNATIONAL PAPER COMPANY COMMON SHAREHOLDERS
Basic earnings per share is computed by dividing earnings by the weighted average number of common shares outstanding. Diluted earnings per share is computed assuming that all potentially dilutive securities were converted into common shares.
There are no adjustments required to be made to net income for purposes of computing basic and diluted earnings per share.
A reconciliation of the amounts included in the computation of basic earnings (loss) per share from continuing operations, and diluted earnings (loss) per share from continuing operations is as follows:
| In millions, except per share amounts | 2022 | 2021 | 2020 | ||||||||||||||
| Earnings (loss) from continuing operations attributable to International Paper common shareholders | $ | 1,741 | $ | 811 | $ | 182 | |||||||||||
| Weighted average common shares outstanding | 363.5 | 389.4 | 393.0 | ||||||||||||||
| Effect of dilutive securities: | |||||||||||||||||
| Restricted performance share plan | 3.5 | 3.0 | 2.7 | ||||||||||||||
| Weighted average common shares outstanding – assuming dilution | 367.0 | 392.4 | 395.7 | ||||||||||||||
| Basic earnings (loss) per share from continuing operations | $ | 4.79 | $ | 2.08 | $ | 0.46 | |||||||||||
| Diluted earnings (loss) per share from continuing operations | $ | 4.74 | $ | 2.07 | $ | 0.46 |
NOTE 5 OTHER COMPREHENSIVE INCOME
The following table presents changes in Accumulated Other Comprehensive Income (Loss) (AOCI), net of tax, reported in the consolidated financial statements for the years ended December 31:
| In millions | 2022 | 2021 | 2020 | ||||||||
| Defined Benefit Pension and Postretirement Adjustments | |||||||||||
| Balance at beginning of period | $ | (962) | $ | (1,880) | $ | (2,277) | |||||
| Other comprehensive income (loss) before reclassifications | (319) | 713 | 227 | ||||||||
| Reclassification related to Sylvamo Corporation spin-off | — | 80 | — | ||||||||
| Amounts reclassified from accumulated other comprehensive income (loss) | 86 | 125 | 170 | ||||||||
| Balance at end of period | (1,195) | (962) | (1,880) | ||||||||
| Change in Cumulative Foreign Currency Translation Adjustments | |||||||||||
| Balance at beginning of period | (694) | (2,457) | (2,465) | ||||||||
| Other comprehensive income (loss) before reclassifications | (38) | (115) | (319) | ||||||||
| Reclassification related to Sylvamo Corporation spin-off | — | 1,692 | — | ||||||||
| Amounts reclassified from accumulated other comprehensive income (loss) | 10 | 184 | 327 | ||||||||
| Other Comprehensive Income (Loss) Attributable to Noncontrolling Interest | — | 2 | — | ||||||||
| Balance at end of period | (722) | (694) | (2,457) | ||||||||
| Net Gains and Losses on Cash Flow Hedging Derivatives | |||||||||||
| Balance at beginning of period | (10) | (5) | 3 | ||||||||
| Other comprehensive income (loss) before reclassifications | — | 3 | (34) | ||||||||
| Reclassification related to Sylvamo Corporation spin-off | — | 1 | — | ||||||||
| Amounts reclassified from accumulated other comprehensive income (loss) | 2 | (9) | 26 | ||||||||
| Balance at end of period | (8) | (10) | (5) | ||||||||
| Total Accumulated Other Comprehensive Income (Loss) at End of Period | $ | (1,925) | $ | (1,666) | $ | (4,342) |
Reclassifications out of AOCI for the three years ended December 31 were as follows:
| Amount Reclassified from Accumulated Other Comprehensive Income (Loss) | Location of Amount Reclassified from AOCI | ||||||||||||||||
| 2022 | 2021 | 2020 | |||||||||||||||
| In millions | |||||||||||||||||
| Defined benefit pension and postretirement items: | |||||||||||||||||
| Prior-service costs | $ | (23) | $ | (20) | $ | (19) | (a) | Non-operating pension expense | |||||||||
| Actuarial gains/(losses) | (91) | (146) | (207) | (a) | Non-operating pension expense | ||||||||||||
| Total pre-tax amount | (114) | (166) | (226) | ||||||||||||||
| Tax (expense)/benefit | 28 | 41 | 56 | ||||||||||||||
| Net of tax | (86) | (125) | (170) | ||||||||||||||
| Reclassification related to Sylvamo Corporation spin-off | — | (80) | — | Paid-in Capital | |||||||||||||
| Total, net of tax | (86) | (205) | (170) | ||||||||||||||
| Change in cumulative foreign currency translation adjustments: | |||||||||||||||||
| Business divestiture | (10) | (184) | (327) | Net (gains) losses on sales of equity method investments, Discontinued Operations, net of taxes and Net (gains) losses on sales and impairment of businesses | |||||||||||||
| Tax (expense)/benefit | — | — | — | ||||||||||||||
| Net of tax | (10) | (184) | (327) | ||||||||||||||
| Reclassification related to Sylvamo Corporation spin-off | — | (1,692) | — | Paid-in Capital | |||||||||||||
| Total, net of tax | (10) | (1,876) | (327) | ||||||||||||||
| Net gains and losses on cash flow hedging derivatives: | |||||||||||||||||
| Cash flow hedges | (3) | 11 | (39) | (b) | Cost of products sold, Discontinued operations, net of taxes, and Interest expense, net | ||||||||||||
| Total pre-tax amount | (3) | 11 | (39) | ||||||||||||||
| Tax (expense)/benefit | 1 | (2) | 13 | ||||||||||||||
| Net of tax | (2) | 9 | (26) | ||||||||||||||
| Reclassification related to Sylvamo Corporation spin-off | — | (1) | — | Paid-in Capital | |||||||||||||
| Total, net of tax | (2) | 8 | (26) | ||||||||||||||
| Total reclassifications for the period, net of tax | $ | (98) | $ | (2,073) | $ | (523) |
(a) These accumulated other comprehensive income (loss) components are included in the computation of net periodic pension cost (see Note 19 for additional details).
(b) This accumulated other comprehensive income (loss) component is included in our derivatives and hedging activities (see Note 17 for additional details).
NOTE 6 RESTRUCTURING AND OTHER CHARGES, NET
2022: During 2022, restructuring and other charges, net, totaling $89 million before taxes were recorded. The charges included:
| In millions | 2022 | |||||||
| Early debt extinguishment costs (see Note 16) | $ | 93 | ||||||
| Other restructuring items | (4) | |||||||
| Total | $ | 89 |
2021: During 2021, restructuring and other charges, net, totaling $509 million before taxes were recorded. The charges included:
| In millions | 2021 | |||||||
| Early debt extinguishment costs (see Note 16) | $ | 461 | ||||||
| Building a Better IP (a) | 29 | |||||||
| EMEA packaging restructuring (b) | 12 | |||||||
| Other restructuring items | 7 | |||||||
| Total | $ | 509 |
(a) Severance related to our Building a Better IP initiative which is focused on value creation through streamlined operations and process optimization. The majority of the severance charges were paid in 2022.
b) Severance related to the optimization of our EMEA Packaging business. The majority of the severance charges were paid in 2022.
2020: During 2020, restructuring and other charges, net, totaling $195 million before taxes were recorded. These charges included:
| In millions | 2020 | |||||||
| Early debt extinguishment costs (see Note 16) | $ | 196 | ||||||
| Other restructuring items | (1) | |||||||
| Total | $ | 195 |
2021: On April 1, 2021, the Company closed on the previously announced acquisition of two box plants located in Spain. The total purchase consideration, inclusive of working capital adjustments, was approximately €71 million (approximately $83 million based on the April 1, 2021 exchange rate).
The following table summarizes the final fair value assigned to assets and liabilities acquired as of April 1, 2021:
| In millions | |||||
| Cash and temporary investments | $ | 5 | |||
| Accounts and notes receivable | 10 | ||||
| Inventories | 3 | ||||
| Plants, properties and equipment | 50 | ||||
| Goodwill | 23 | ||||
| Intangible assets | 13 | ||||
| Total assets acquired | 104 | ||||
| Short-term debt | 2 | ||||
| Accounts payable and accrued liabilities | 4 | ||||
| Other current liabilities | 2 | ||||
| Long-term debt | 1 | ||||
| Deferred income taxes | 12 | ||||
| Total liabilities assumed | 21 | ||||
| Net assets acquired | $ | 83 |
Pro forma information has not been included as it is impracticable to obtain the information due to the lack of availability of historical U.S. GAAP financial data. The results of the operations of these businesses do not have a material effect on the Company's consolidated results of operations.
The Company has accounted for the above acquisition under ASC 805, "Business Combinations" and the results of operations have been included in International Paper's financial statements beginning with the date of acquisition.
2021: In April 2021, the Company received a noncontrolling interest in a U.S-based corrugated packaging producer. In the second quarter, the Company recorded its investment of $115 million based on the fair value of the noncontrolling interest, and a corresponding contract liability that is amortized over 15 years. The Company is party to various agreements with the entity which includes a containerboard supply agreement. The Company is accounting for its interest as an equity method investment.
PRINTING PAPERS SPIN-OFF
2021: On October 1, 2021, the Company completed the previously announced spin-off of its Printing Papers segment along with certain mixed-use coated paperboard and pulp businesses in North America, France and Russia into a standalone, publicly-traded company, Sylvamo Corporation. The transaction was implemented through the distribution of shares of the standalone company to International Paper's shareholders (the "Distribution"). As a result of the Distribution, Sylvamo Corporation is an independent public company that trades on the New York Stock Exchange under the symbol "SLVM".
The Distribution was made to the Company's stockholders of record as of the close of business on September 15, 2021 (the "Record Date"), and such stockholders received one share of Sylvamo common stock for every 11 shares of International Paper common stock held as of the close of business on the Record Date. The Company retained 19.9% of the shares of Sylvamo at the time of the separation and this retained investment is discussed further in Note 9 - Supplementary Financial Statement Information. The spin-off was tax-free for the Company and its shareholders for U.S. federal income tax purposes.
In connection with the Distribution, on September 29, 2021, the Company and Sylvamo entered into a separation and distribution agreement as well as various other agreements that govern the relationships between the parties following the Distribution, including a transition services agreement, a tax matters agreement and an employee matters agreement. These agreements provided for the allocation between the Company and Sylvamo of assets, liabilities and obligations attributable to periods prior to, at and after the Distribution and govern certain relationships between the Company and Sylvamo after the Distribution. The Company was also party to various ongoing operational agreements with Sylvamo under which it sold fiber, paper and other products. Related party sales under these agreements were $630 million and $185 million for the year ended December 31, 2022 and 2021, respectively. As of the end of the third quarter 2022, the Company no longer had an ownership interest in Sylvamo and as such will no longer be a related party. See Note 9 - Supplementary Financial Statement Information for further discussion.
All historical operating results of the Sylvamo businesses, as well as the results of our Kwidzyn, Poland mill that was sold on August 6, 2021, are presented as Discontinued Operations, net of tax, in the consolidated statement of operations. Kwidzyn was previously part of the Printing Papers business prior to its sale in August 2021. See the Kwidzyn Mill section below for further details regarding this sale.
The following summarizes the major classes of line items comprising Earnings (Loss) Before Income Taxes and Equity Earnings reconciled to Discontinued Operations, net of tax, related to the Sylvamo Corporation businesses and Kwidzyn for all prior periods presented in the consolidated statement of operations:
| In millions | 2021 | 2020 | ||||||
| Net Sales | $ | 2,417 | $ | 3,015 | ||||
| Costs and Expenses | ||||||||
| Cost of products sold | 1,508 | 2,036 | ||||||
| Selling and administrative expenses | 224 | 165 | ||||||
| Depreciation, amortization and cost of timber harvested | 113 | 196 | ||||||
| Distribution expenses | 229 | 264 | ||||||
| Taxes other than payroll and income taxes | 24 | 35 | ||||||
| Net (gains) losses on sales of fixed assets | (86) | — | ||||||
| Net (gains) losses on sales and impairments of businesses | (351) | — | ||||||
| Interest expense, net | (19) | (2) | ||||||
| Earnings (Loss) Before Income Taxes and Equity Earnings | 775 | 321 | ||||||
| Income tax provision (benefit) | 145 | 69 | ||||||
| Discontinued Operations, Net of Taxes | $ | 630 | $ | 252 |
The following summarizes the total cash provided by operations and total cash used for investing activities related to the Sylvamo Corporation businesses and Kwidzyn and included in the consolidated statement of cash flows:
| In millions | 2021 | 2020 | ||||||
| Cash Provided by (Used For) Operating Activities | $ | 290 | $ | 463 | ||||
| Cash Provided by (Used For) Investment Activities | $ | 757 | $ | (111) |
In anticipation of the spin-off, Sylvamo incurred $1.5 billion in debt during the third quarter of 2021 with the proceeds used for a distribution to the Company and other expenses associated with the transaction. The Company was an obligor of the debt prior to the spin-off as Sylvamo was a wholly-owned subsidiary. Subsequent to the distribution of the net assets, the Company was no longer an obligor of the Sylvamo debt. The $1.5 billion of borrowings was comprised of $450 million of 7.00% senior unsecured notes due 2029 issued in September 2021. It was also comprised of the senior secured credit facility that Sylvamo entered into in September 2021 which consisted of $450 million of borrowings related to its term loan “B” facility, $520 million of borrowings related to its term loan “F” facility, and the $100 million draw on its revolving credit facility which had a capacity of $450 million. Additionally, at the time of the spin-off in the fourth quarter of 2021, the Company distributed $130 million to Sylvamo. The debt issuance and distribution to Sylvamo Corporation are classified as financing activities in the accompanying consolidated statement of cash flows.
KWIDZYN MILL
2021: On August 6, 2021, the Company completed the sale of its Kwidzyn, Poland mill for €669 million (approximately $794 million using the July 31, 2021 exchange rate) in cash. The business included the pulp and paper mill in Kwidzyn and supporting functions. During the third quarter of 2021, the Company recorded a net gain of $360 million ($350 million after taxes) including a gain of $404 million ($394 million after taxes) related to the sale of net assets and a loss of $44 million (before and after taxes) related to the cumulative foreign currency translation loss. During the fourth quarter of 2021, the Company incurred $9 million ($6 million after taxes) of costs related to the sale of Kwidzyn. All historical operating results for Kwidzyn have been presented as Discontinued Operations, net of tax, in the consolidated statement of operations.
OLMUKSAN INTERNATIONAL PAPER
2021: On May 31, 2021, the Company completed the sale of its 90.38% ownership interest in Olmuksan International Paper, a corrugated packaging business in Turkey, to Mondi Group for €66 million (approximately $81 million using the May 31, 2021 exchange rate). During the twelve months ended December 31, 2021, the Company recorded a net gain of $4 million ($2 million after taxes) related to the business working capital adjustment and cumulative foreign currency translation loss.
In conjunction with the announced agreement in the fourth quarter of 2020, a determination was made that the current book value of the Olmuksan International Paper disposal group exceeded its estimated fair value of $79 million which was based on the agreed upon transaction price. As a result, a preliminary charge of $123 million (before and after taxes) was recorded during the fourth quarter of 2020.
BRAZIL PACKAGING
2020: On October 14, 2020, the Company closed the previously announced sale of its Brazilian Industrial Packaging business for R$330 million ($58.5 million U.S. dollars), with R$280 million ($49.6 million U.S. dollars) paid at closing and R$50 million ($8.9 million U.S. dollars) to be paid one year from closing. This business included three containerboard mills and four box plants and the agreement followed International Paper's previously announced strategic review of the Brazilian Industrial Packaging business.
In conjunction with the announced agreement, net pre-tax charges of $347 million ($340 million after taxes) were recorded in 2020. These charges included $327 million related to the cumulative foreign currency translation loss and a $20 million loss
related the write down of the long-lived assets of the Brazilian Industrial Packaging business to their estimated fair value. These charges are included in Net (gains) losses on sales and impairments of businesses in the accompanying consolidated statement of operations and is included in the results for the Industrial Packaging segment.
NOTE 9 SUPPLEMENTARY FINANCIAL STATEMENT INFORMATION
TEMPORARY INVESTMENTS
Temporary investments with an original maturity of three months or less and money market funds with greater than three month maturities but with the right to redeem without notices are treated as cash equivalents and are stated at cost. Temporary investments totaled $690 million and $1.1 billion at December 31, 2022 and 2021, respectively.
ACCOUNTS AND NOTES RECEIVABLE
Accounts and notes receivable, net, by classification were:
| In millions at December 31 | 2022 | 2021 | ||||||
| Accounts and notes receivable: | ||||||||
| Trade (less allowances of $31 in 2022 and $34 in 2021) | $ | 3,064 | $ | 3,027 | ||||
| Other | 220 | 205 | ||||||
| Total | $ | 3,284 | $ | 3,232 |
INVENTORIES
| In millions at December 31 | 2022 | 2021 | ||||||
| Raw materials | $ | 267 | $ | 245 | ||||
| Finished pulp and packaging products | 1,071 | 1,014 | ||||||
| Operating supplies | 516 | 486 | ||||||
| Other | 88 | 69 | ||||||
| Inventories | $ | 1,942 | $ | 1,814 |
The last-in, first-out inventory method is used to value most of International Paper’s U.S. inventories. Approximately 76% of total raw materials and finished products inventories were valued using this method. The last-in, first-out inventory reserve was $282 million and $195 million at December 31, 2022 and 2021, respectively.
CURRENT INVESTMENTS
As a result of the 2021 spin-off of Sylvamo, the Company retained 19.9% of the shares of Sylvamo with the intent to monetize its investment and provide additional proceeds to the Company. In the second quarter 2022, the Company exchanged 4,132,000 shares of Sylvamo common stock owned by the Company in exchange and as repayment for an
approximately $144 million term loan obligation which resulted in the reversal of a $31 million deferred tax liability due to the tax-free exchange of the Sylvamo Corporation common stock. In the third quarter 2022, the Company exchanged the remaining 4,614,358 shares of Sylvamo common stock owned by the Company in exchange for $167 million and as partial repayment of a $210 million term loan obligation. This also resulted in the reversal of a $35 million deferred tax liability due to the tax-free exchange of the Sylvamo Corporation common stock. See Note 16 - Debt and Lines of Credit for further discussion.
As of the end of the third quarter 2022, the Company no longer had an ownership interest in Sylvamo. The Company's investment in Sylvamo was valued at $245 million at December 31, 2021, and was recorded in Current investments in the accompanying consolidated balance sheet. The Company accounted for its ownership interest in Sylvamo at fair value as an investment in equity securities.
PLANTS, PROPERTIES AND EQUIPMENT
| In millions at December 31 | 2022 | 2021 | ||||||
| Pulp and packaging facilities | $ | 27,773 | $ | 27,025 | ||||
| Other properties and equipment | 1,029 | 972 | ||||||
| Gross cost | 28,802 | 27,997 | ||||||
| Less: Accumulated depreciation | 18,371 | 17,556 | ||||||
| Plants, properties and equipment, net | $ | 10,431 | $ | 10,441 |
Non-cash additions to plants, property and equipment included within accounts payable were $185 million, $106 million and $41 million at December 31, 2022, 2021 and 2020, respectively.
Amounts invested in capital projects in the accompanying consolidated statement of cash flows are presented net of insurance recoveries of $26 million, $17 million and $42 million received during the years ended December 31, 2022, 2021 and 2020, respectively.
Annual straight-line depreciable lives generally are, for buildings - 20 to 40 years, and for machinery and equipment - 3 to 20 years. Depreciation expense was $996 million for the year ended December 31, 2022 and $1.1 billion for each of the years ended December 31, 2021 and 2020. Cost of products sold excludes depreciation and amortization expense.
INTEREST
Interest payments of $380 million, $473 million and $682 million were made during the years ended December 31, 2022, 2021 and 2020, respectively.
Amounts related to interest were as follows:
| In millions | 2022 | 2021 | 2020 | ||||||||
| Interest expense | $ | 403 | $ | 430 | $ | 597 | |||||
| Interest income | 78 | 93 | 151 | ||||||||
| Capitalized interest costs | 18 | 12 | 31 |
ASSET RETIREMENT OBLIGATIONS
At December 31, 2022 and 2021, we had recorded liabilities of $105 million and $107 million, respectively, related to asset retirement obligations.
In connection with potential future closures or redesigns of certain production facilities, it is possible that the Company may be required to take steps to remove certain materials from these facilities. Applicable regulations and standards provide that the removal of certain materials would only be required if the facility were to be demolished or underwent major renovations. At this time, any such obligations have an indeterminate settlement date, and the Company believes that adequate information does not exist to apply an expected-present-value technique to estimate any such potential obligations. Accordingly, the Company does not record a liability for such remediation until a decision is made that allows reasonable estimation of the timing of such remediation.
International Paper leases various real estate, including certain operating facilities, warehouses, office space and land. The Company also leases material handling equipment, vehicles, and certain other equipment. The Company's leases have remaining lease terms of up to 31 years.
COMPONENTS OF LEASE EXPENSE
| In millions | 2022 | 2021 | 2020 | ||||||||
| Operating lease costs, net | $ | 153 | $ | 138 | $ | 132 | |||||
| Variable lease costs | 39 | 40 | 43 | ||||||||
| Short-term lease costs, net | 57 | 53 | 46 | ||||||||
| Finance lease cost | |||||||||||
| Amortization of lease assets | 11 | 11 | 10 | ||||||||
| Interest on lease liabilities | 3 | 3 | 3 | ||||||||
| Total lease cost, net | $ | 263 | $ | 245 | $ | 234 |
SUPPLEMENTAL BALANCE SHEET INFORMATION RELATED TO LEASES
| In millions | Classification | 2022 | 2021 | ||||||||
| Assets | |||||||||||
| Operating lease assets | Right of use assets | $ | 424 | $ | 365 | ||||||
| Finance lease assets | Plants, properties and equipment, net (a) | 49 | 57 | ||||||||
| Total leased assets | $ | 473 | $ | 422 | |||||||
| Liabilities | |||||||||||
| Current | |||||||||||
| Operating | Other current liabilities | $ | 147 | $ | 132 | ||||||
| Finance | Notes payable and current maturities of long-term debt | 10 | 10 | ||||||||
| Noncurrent | |||||||||||
| Operating | Long-term lease obligations | 283 | 236 | ||||||||
| Finance | Long-term debt | 49 | 56 | ||||||||
| Total lease liabilities | $ | 489 | $ | 434 |
(a) Finance leases are recorded net of accumulated amortization of $59 million and $51 million at December 31, 2022 and 2021, respectively.
LEASE TERM AND DISCOUNT RATE
| In millions | 2022 | 2021 | ||||||
| Weighted average remaining lease term (years) | ||||||||
| Operating leases | 4.1 years | 4.0 years | ||||||
| Finance leases | 8.4 years | 9.1 years | ||||||
| Weighted average discount rate | ||||||||
| Operating leases | 2.96 | % | 2.12 | % | ||||
| Finance leases | 4.57 | % | 4.50 | % |
SUPPLEMENTAL CASH FLOW INFORMATION RELATED TO LEASES
| In millions | 2022 | 2021 | 2020 | ||||||||
| Cash paid for amounts included in the measurement of lease liabilities | |||||||||||
| Operating cash flows related to operating leases | $ | 160 | $ | 166 | $ | 162 | |||||
| Operating cash flows related to financing leases | 3 | 4 | 5 | ||||||||
| Financing cash flows related to finance leases | 10 | 14 | 10 | ||||||||
| Right of use assets obtained in exchange for lease liabilities | |||||||||||
| Operating leases | 221 | 156 | 179 | ||||||||
| Finance leases | 6 | 9 | 11 |
MATURITY OF LEASE LIABILITIES
| In millions | Operating Leases | Financing Leases | Total | ||||||||
| 2023 | $ | 157 | $ | 13 | $ | 170 | |||||
| 2024 | 113 | 11 | 124 | ||||||||
| 2025 | 75 | 10 | 85 | ||||||||
| 2026 | 48 | 9 | 57 | ||||||||
| 2027 | 30 | 8 | 38 | ||||||||
| Thereafter | 36 | 26 | 62 | ||||||||
| Total lease payments | 459 | 77 | 536 | ||||||||
| Less imputed interest | 29 | 18 | 47 | ||||||||
| Present value of lease liabilities | $ | 430 | $ | 59 | $ | 489 |
NOTE 11 EQUITY METHOD INVESTMENTS
The Company accounts for the following investments under the equity method of accounting.
ILIM S.A. ("Ilim")
The Company holds a 50% equity interest in Ilim, the holding company for its Ilim joint venture (JV), which has subsidiaries, including JSC Ilim Group, whose primary operations are in Russia. The Company recently announced that it had entered into an agreement to sell its interest in Ilim to its JV partners for $484 million. The completion of the sale is subject to various closing conditions, including the receipt of regulatory approvals in Russia.
The Company also received an indication of interest from its JV partners to purchase all of the Company’s shares (constituting a 2.39% stake) in JSC Ilim Group for $24 million, on terms and conditions to be agreed. The Company intends to pursue an agreement to sell the JSC Ilim Group shares, and to divest other non-material residual interests associated with Ilim, to its JV partners.
In conjunction with the entry into the announced agreement, a determination was made that the book value of the Ilim and JSC Ilim Group investments plus associated cumulative translation losses, exceeded fair value, based upon the agreed upon transaction price for Ilim and the offer price for JSC Ilim Group. As a result, an other than temporary impairment of $533 million was recorded in the fourth quarter of 2022 to write down these investments to fair value. The impairment charge included $375 million of foreign currency cumulative translation adjustment loss. As of December 31, 2022, the $375 million of cumulative translation adjustment loss remained within AOCI with the recognition of this loss recorded as an offset to the investment balance.
The Company also evaluated facts and circumstances as of December 31, 2022 and concluded that the held for sale balance sheet classification criteria had been met as of that date and therefore have classified the Ilim investment balance, net of impairment, as Assets held for sale. Additionally, the December 31, 2021 investment balance has been reclassified to Long-Term Assets Held for Sale.
All current and historical results of the Ilim investment are presented as Discontinued Operations, net of taxes in the consolidated statement of operations. The Company recorded equity earnings, net of taxes, of $296 million, $311 million, and $48 million in 2022, 2021, and 2020, respectively, for Ilim. Equity earnings includes an after-tax foreign exchange (loss) gain of $(50) million in 2020, primarily on the remeasurement of U.S. dollar-denominated net debt. Foreign exchange gains (losses) included in equity earnings in 2022 and 2021, were not material. JSC Ilim Group had no U.S. dollar-denominated debt outstanding as of December 31, 2022. The Company received cash dividends from the joint venture of $204 million, $154 million and $141 million in 2022, 2021 and 2020, respectively. At December 31, 2022 and 2021, the Company's investment in Ilim, which is recorded in Assets held for sale in the consolidated balance sheet, was $133 million and $557 million, respectively, which was $403 million lower and $121 million higher, respectively, than the Company's proportionate share of the joint venture's underlying net assets.
Prior to the spin-off of the Printing Papers segment on October 1, 2021, the Company was party to a joint marketing agreement with JSC Ilim Group, a subsidiary of Ilim, under which the Company purchased, marketed and sold paper produced by JSC Ilim Group. Purchases under this agreement were $125 million and $174 million for the years ended December 31, 2021 and 2020, respectively. The joint marketing agreement was conveyed to Sylvamo as part of the spin-off transaction on October 1, 2021.
Summarized financial information for Ilim is presented in the following tables:
Balance Sheet
| In millions | 2022 | 2021 | |||||||||
| Current assets | $ | 766 | $ | 1,010 | |||||||
| Noncurrent assets | 3,663 | 3,145 | |||||||||
| Current liabilities | 1,275 | 1,212 | |||||||||
| Noncurrent liabilities | 2,040 | 2,047 | |||||||||
| Noncontrolling interests | 40 | 24 |
Income Statement
| In millions | 2022 | 2021 | 2020 | ||||||||||||||
| Net sales | $ | 3,147 | $ | 2,693 | $ | 2,015 | |||||||||||
| Gross profit | 1,561 | 1,432 | 838 | ||||||||||||||
| Income from continuing operations | 591 | 635 | 115 | ||||||||||||||
| Net income | 575 | 613 | 113 |
GRAPHIC PACKAGING INTERNATIONAL PARTNERS, LLC
The Company completed the transfer of its North American Consumer Packaging business in exchange for an initial 20.5% ownership interest (79,911,591 units) in Graphic Packaging International Partners, LLC (GPIP) in 2018. The Company has since fully monetized its investment in GPIP with transactions beginning in the first quarter 2020 through the second quarter 2021.
| Date | Transaction Type | Units | Proceeds | Pre-Tax Gain | After-Tax Gain | ||||||||||||
| In millions except units | |||||||||||||||||
| 2020 First Quarter | Units exchange | 15,150,784 | $ | 250 | $ | 33 | $ | 25 | |||||||||
| 2020 Third Quarter | Units exchange | 17,399,414 | 250 | — | — | ||||||||||||
| 2021 First Quarter | Units exchange and open market sale | 24,588,316 | 397 | 33 | 25 | ||||||||||||
| 2021 First Quarter | TRA (a) | 42 | 31 | ||||||||||||||
| 2021 Second Quarter | Units exchange and open market sale | 22,773,077 | 403 | 64 | 48 | ||||||||||||
| 2021 Second Quarter | TRA (a) | 66 | 50 |
(a) The TRA entitles the Company to 50% of the amount of any tax benefits projected to be realized by GPIP upon the Company's exchange of its units. The Company made income tax payments of $310 million in 2021 as a result of the monetization of its investment in GPIP.
As of June 30, 2021, the Company no longer had an ownership interest in GPIP. The Company recorded equity earnings of $4 million and $40 million for the twelve months ended December 31, 2021 and 2020, respectively. The Company received cash dividends from GPIP of $5 million and $20 million during 2021 and 2020, respectively.
The Company's remaining equity method investments are not material.
NOTE 12 GOODWILL AND OTHER INTANGIBLES
GOODWILL
The following table presents changes in the goodwill balances as allocated to each business segment for the years ended December 31, 2022 and 2021:
| In millions | Industrial Packaging | Global Cellulose Fibers | Total | ||||||||||||||
| Balance as of December 31, 2020 | |||||||||||||||||
| Goodwill | $ | 3,411 | $ | 52 | $ | 3,463 | |||||||||||
| Accumulated impairment losses | (296) | (52) | (348) | ||||||||||||||
| 3,115 | — | 3,115 | |||||||||||||||
| Currency translation and other (a) | (8) | — | (8) | ||||||||||||||
| Goodwill additions/reductions | 23 | (b) | — | 23 | |||||||||||||
| Balance as of December 31, 2021 | |||||||||||||||||
| Goodwill | 3,426 | 52 | 3,478 | ||||||||||||||
| Accumulated impairment losses | (296) | (52) | (348) | ||||||||||||||
| 3,130 | — | 3,130 | |||||||||||||||
| Currency translation and other (a) | (13) | — | (13) | ||||||||||||||
| Impairment loss | (76) | (c) | — | (76) | |||||||||||||
| Balance as of December 31, 2022 | |||||||||||||||||
| Goodwill | 3,413 | 52 | 3,465 | ||||||||||||||
| Accumulated impairment losses | (372) | (52) | (424) | ||||||||||||||
| Total | $ | 3,041 | $ | — | $ | 3,041 |
*(a)*Represents the effects of foreign currency translations and reclassifications.
*(b)*Reflects the goodwill for the acquisitions of EMEA Industrial Packaging box plants.
(c) Reflects the impairment of the EMEA Industrial Packaging reporting unit.
The Company performed its annual testing of its reporting units for possible goodwill impairments by applying the qualitative assessment to its North America Industrial Packaging reporting unit and the quantitative goodwill impairment test to its EMEA Industrial Packaging reporting unit as of October 1, 2022.
For the current year evaluation, the Company assessed various assumptions, events and circumstances that would have affected the estimated fair value of the North America Industrial Packaging reporting unit under the qualitative assessment and the results of the qualitative assessments indicated that it was not more likely than not that the fair value of the reporting unit was less than its carrying value.
The Company also performed the quantitative goodwill impairment test which included comparing the carrying amount of the EMEA Industrial Packaging reporting unit to its estimated fair value. The estimated fair value of the reporting unit was calculated using a weighted approach based on
discounted future cash flows, market multiples and transaction multiples which are classified as Level 2 and Level 3 within the fair value hierarchy. The determination of fair value using the discounted cash flow approach requires management to make significant estimates and assumptions related to forecasts of future revenues, operating profit margins, and discount rates. The determination of fair value using market multiples and transaction multiples requires management to make significant assumptions related to revenue multiples and adjusted earnings before interest, taxes, depreciation, and amortization ("EBITDA") multiples. The results of our quantitative goodwill impairment test indicated that the carrying amount exceeded the estimated fair value of the EMEA Industrial Packaging reporting unit
and it was determined that all of the goodwill in the reporting unit, totaling $76 million, was impaired. The decline in the fair value of EMEA Industrial Packaging
and resulting impairment charge was due to the impacts of certain negative macroeconomic conditions, including the impacts from inflation and the geopolitical environment to the reporting unit.
OTHER INTANGIBLES
Identifiable intangible assets are recorded in Deferred Charges and Other Assets in the accompanying consolidated balance sheet and comprised the following:
| 2022 | 2021 | |||||||||||||||||||
| In millions at December 31 | Gross Carrying Amount | Accumulated Amortization | Net Intangible Assets | Gross Carrying Amount | Accumulated Amortization | Net Intangible Assets | ||||||||||||||
| Customer relationships and lists | $ | 490 | $ | 303 | $ | 187 | $ | 493 | $ | 273 | $ | 220 | ||||||||
| Tradenames, patents and trademarks, and developed technology | 170 | 146 | 24 | 170 | 131 | 39 | ||||||||||||||
| Land and water rights | 8 | 2 | 6 | 8 | 2 | 6 | ||||||||||||||
| Other | 23 | 20 | 3 | 24 | 21 | 3 | ||||||||||||||
| Total | $ | 691 | $ | 471 | $ | 220 | $ | 695 | $ | 427 | $ | 268 |
The Company recognized the following amounts as amortization expense related to intangible assets:
| In millions | 2022 | 2021 | 2020 | ||||||||
| Amortization expense related to intangible assets | $ | 44 | $ | 44 | $ | 45 |
Based on current intangibles subject to amortization, estimated amortization expense for each of the succeeding years is as follows: 2023 – $40 million, 2024 – $40 million, 2025 – $34 million, 2026 – $29 million, 2027 – $11 million, and cumulatively thereafter – $60 million.
The components of International Paper’s earnings from continuing operations before income taxes and equity earnings by taxing jurisdiction were as follows:
| In millions | 2022 | 2021 | 2020 | ||||||||
| Earnings (loss) | |||||||||||
| U.S. | $ | 1,469 | $ | 906 | $ | 660 | |||||
| Non-U.S. | 42 | 93 | (331) | ||||||||
| Earnings (loss) from continuing operations before income taxes and equity earnings (losses) | $ | 1,511 | $ | 999 | $ | 329 |
The provision (benefit) for income taxes from continuing operations (excluding noncontrolling interests) by taxing jurisdiction was as follows:
| In millions | 2022 | 2021 | 2020 | ||||||||
| Current tax provision (benefit) | |||||||||||
| U.S. federal | $ | 454 | $ | 413 | $ | 98 | |||||
| U.S. state and local | 56 | 47 | 31 | ||||||||
| Non-U.S. | 27 | 37 | (3) | ||||||||
| $ | 537 | $ | 497 | $ | 126 | ||||||
| Deferred tax provision (benefit) | |||||||||||
| U.S. federal | $ | (775) | $ | (274) | $ | (2) | |||||
| U.S. state and local | (39) | (27) | 2 | ||||||||
| Non-U.S. | 41 | (8) | 50 | ||||||||
| $ | (773) | $ | (309) | $ | 50 | ||||||
| Income tax provision (benefit) | $ | (236) | $ | 188 | $ | 176 |
The Company’s deferred income tax provision (benefit) includes a $3 million benefit, an $8 million benefit and a $2 million benefit for 2022, 2021 and 2020, respectively, for the effect of various changes in non-U.S. and U.S. federal and state tax rates.
International Paper made income tax payments, net of refunds, of $345 million, $601 million and $162 million in 2022, 2021 and 2020, respectively.
A reconciliation of income tax expense using the statutory U.S. income tax rate compared with the actual income tax provision follows:
| In millions | 2022 | 2021 | 2020 | ||||||||
| Earnings (loss) from continuing operations before income taxes and equity earnings | $ | 1,511 | $ | 999 | $ | 329 | |||||
| Statutory U.S. income tax rate | 21 | % | 21 | % | 21 | % | |||||
| Tax expense (benefit) using statutory U.S. income tax rate | 317 | 210 | 69 | ||||||||
| State and local income taxes | 44 | 15 | 26 | ||||||||
| Impact of rate differential on non-U.S. permanent differences and earnings | 1 | 5 | 29 | ||||||||
| Foreign valuation allowance | 45 | — | — | ||||||||
| Tax expense (benefit) on exchange of Sylvamo shares | (56) | — | — | ||||||||
| Adjustment to tax basis of assets | — | (14) | — | ||||||||
| Non-deductible business expenses | 2 | 1 | 4 | ||||||||
| Non-deductible impairments | 16 | — | 92 | ||||||||
| Non-deductible compensation | 13 | 11 | 11 | ||||||||
| Tax audits | 6 | 9 | (28) | ||||||||
| Timber Monetization Audit Settlement | (604) | — | — | ||||||||
| U.S. federal tax rate change | — | — | 7 | ||||||||
| Foreign derived intangible income deduction | (8) | (7) | — | ||||||||
| US tax on non-U.S. earnings (GILTI and Subpart F) | 27 | 5 | 6 | ||||||||
| Foreign tax credits | 8 | (6) | (3) | ||||||||
| General business and other tax credits | (43) | (39) | (42) | ||||||||
| Tax expense (benefit) on equity earnings | (1) | — | 8 | ||||||||
| Other, net | (3) | (2) | (3) | ||||||||
| Income tax provision (benefit) | $ | (236) | $ | 188 | $ | 176 | |||||
| Effective income tax rate | (16) | % | 19 | % | 53 | % |
The tax effects of significant temporary differences, representing deferred income tax assets and liabilities at December 31, 2022 and 2021, were as follows:
| In millions | 2022 | 2021 | ||||||
| Deferred income tax assets: | ||||||||
| Postretirement benefit accruals | $ | 68 | $ | 84 | ||||
| Pension obligations | 18 | — | ||||||
| Tax credits | 175 | 199 | ||||||
| Net operating and capital loss carryforwards | 568 | 661 | ||||||
| Compensation reserves | 151 | 184 | ||||||
| Lease obligations | 108 | 92 | ||||||
| Environmental reserves | 119 | 104 | ||||||
| Other | 271 | 189 | ||||||
| Gross deferred income tax assets | $ | 1,478 | $ | 1,513 | ||||
| Less: valuation allowance (a) | (677) | (708) | ||||||
| Net deferred income tax asset | $ | 801 | $ | 805 | ||||
| Deferred income tax liabilities: | ||||||||
| Intangibles | $ | (147) | $ | (140) | ||||
| Investments | (2) | (56) | ||||||
| Right of use assets | (108) | (92) | ||||||
| Pension obligations | — | (34) | ||||||
| Plants, properties and equipment | (1,778) | (1,776) | ||||||
| Forestlands, related installment sales, and investment in subsidiary | (485) | (1,279) | ||||||
| Gross deferred income tax liabilities | $ | (2,520) | $ | (3,377) | ||||
| Net deferred income tax liability | $ | (1,719) | $ | (2,572) |
(a) The net change in the total valuation allowance for the years ended December 31, 2022 and 2021 was a decrease of $(31) million and an increase of $27 million, respectively. The net change in the current year includes an increase impacting the future utilization of foreign deferred tax assets of $45 million.
Deferred income tax assets and liabilities are recorded in the accompanying consolidated balance sheet under the captions Deferred charges and other assets and Deferred income taxes, respectively. The $485 million of deferred tax liabilities for forestlands, related installment sales, and investment in subsidiary is attributable to a 2007 Temple-Inland installment sale of forestlands (see Note 15).
A reconciliation of the beginning and ending amount of unrecognized tax benefits for the years ended December 31, 2022, 2021 and 2020 is as follows:
| In millions | 2022 | 2021 | 2020 | ||||||||
| Balance at January 1 | $ | (166) | $ | (143) | $ | (166) | |||||
| (Additions) reductions for tax positions related to current year | (7) | (13) | (10) | ||||||||
| (Additions) for tax positions related to prior years | (10) | (23) | (10) | ||||||||
| Reductions for tax positions related to prior years | 3 | 1 | 30 | ||||||||
| Settlements | 1 | 10 | 13 | ||||||||
| Expiration of statutes of limitations | 1 | 1 | 1 | ||||||||
| Currency translation adjustment | 1 | 1 | (1) | ||||||||
| Balance at December 31 | $ | (177) | $ | (166) | $ | (143) |
If the Company were to prevail on the unrecognized tax benefits recorded, substantially all of the balances at December 31, 2022, 2021 and 2020 would benefit the effective tax rate.
The Company accrues interest on unrecognized tax benefits as a component of interest expense. Penalties, if incurred, are recognized as a component of income tax expense. The Company had approximately $29 million and $21 million accrued for the payment of estimated interest and penalties associated with unrecognized tax benefits at December 31, 2022 and 2021, respectively.
The Company is currently subject to audits in the United States and other taxing jurisdictions around the world. Generally, tax years 2009 through 2021 remain open and subject to examination by the relevant tax authorities. The Company frequently faces challenges regarding the amount of taxes due. These challenges include positions taken by the Company related to the timing, nature, and amount of deductions and the allocation of income among various tax jurisdictions. Pending audit settlements and the expiration of statute of limitations could reduce the uncertain tax positions by $28 million during the next twelve months.
The Company provides for foreign withholding taxes and any applicable U.S. state income taxes on earnings intended to be repatriated from non-U.S. subsidiaries, which we believe will be limited in the future to each year's current earnings. No provision for these taxes on approximately $1.9 billion of undistributed earnings of non-U.S. subsidiaries as of December 31, 2022 has been made, as these earnings are considered indefinitely invested. Determination of the amount of taxes that might be paid on these undistributed earnings if eventually remitted in a taxable manner is not practicable.
If management decided to monetize the Company’s foreign investments, we would recognize the tax cost related to the excess of the book value over the tax basis of those investments. This would include foreign withholding taxes and any applicable U.S. Federal and state income taxes. Determination of the
tax cost that would be incurred upon monetization of the Company’s foreign investments is not practicable; however, we do not believe it would be material.
The following details the scheduled expiration dates of the Company’s net operating loss and income tax credit carryforwards:
| In millions | 2023 Through 2032 | 2033 Through 2042 | Indefinite | Total | ||||||||||
| U.S. federal and non-U.S. NOLs | $ | 1 | $ | 95 | $ | 422 | $ | 518 | ||||||
| State taxing jurisdiction NOLs (a) | 43 | 7 | — | 50 | ||||||||||
| U.S. federal, non- U.S. and state tax credit carryforwards (a) | 70 | 8 | 97 | 175 | ||||||||||
| Total | $ | 114 | $ | 110 | $ | 519 | $ | 743 | ||||||
| Less: valuation allowance (a) | (50) | (89) | (463) | (602) | ||||||||||
| Total, net | $ | 64 | $ | 21 | $ | 56 | $ | 141 |
(a) State amounts are presented net of federal benefit.
NOTE 14 COMMITMENTS AND CONTINGENT LIABILITIES
GUARANTEES
In connection with sales of businesses, property, equipment, forestlands and other assets, International Paper commonly makes representations and warranties relating to such businesses or assets, and may agree to indemnify buyers with respect to tax and environmental liabilities, breaches of representations and warranties, and other matters. Where liabilities for such matters are determined to be probable and reasonably estimable, accrued liabilities are recorded at the time of sale as a cost of the transaction.
Brazil Goodwill Tax Matter**:** The Brazilian Federal Revenue Service has challenged the deductibility of goodwill amortization generated in a 2007 acquisition by Sylvamo do Brasil Ltda. ("Sylvamo Brazil"), a wholly-owned subsidiary of the Company, until the October 1, 2021 spin-off of the Printing Papers business after which it became a subsidiary of Sylvamo. Sylvamo Brazil received assessments for the tax years 2007-2015 totaling approximately $111 million in tax, and $361 million in interest, penalties, and fees as of December 31, 2022 (adjusted for variation in currency exchange rates). After an initial favorable ruling challenging the basis for these
assessments, Sylvamo Brazil received subsequent unfavorable decisions from the Brazilian Administrative Council of Tax Appeals. Sylvamo Brazil has appealed these decisions and intends to appeal any future unfavorable administrative judgments to the Brazilian federal courts; however, this tax litigation matter may take many years to resolve. Sylvamo Brazil and International Paper believe the transaction underlying these assessments was appropriately evaluated, and that Sylvamo Brazil's tax position would be sustained, based on Brazilian tax law.
This matter pertains to a business that was conveyed to Sylvamo as of October 1, 2021, as part of our spin-off transaction. Pursuant to the terms of the tax matters agreement entered into between the Company and Sylvamo, the Company will pay 60% and Sylvamo will pay 40%, on up to $300 million of any assessment related to this matter, and the Company will pay all amounts of the assessment over $300 million. Under the terms of the agreement, decisions concerning the conduct of the litigation related to this matter, including strategy, settlement, pursuit and abandonment, will be made by the Company. Sylvamo thus has no control over any decision related to this ongoing litigation. The Company intends to vigorously defend this historic tax position against the current assessments and any similar assessments that may be issued for tax years subsequent to 2015. The Brazilian government may enact a tax amnesty program that would allow Sylvamo Brazil to resolve this dispute for less than the assessed amount. As of October 1, 2021, in connection with the recording of the distribution of assets and liabilities resulting from the spin-off transaction, the Company established a liability representing the initial fair value of the contingent liability under the tax matters agreement. The contingent liability was determined in accordance with ASC 460 "Guarantees" based on the probability weighting of various possible outcomes. The initial fair value estimate and recorded liability as of December 31, 2021 was $48 million and remains this amount at December 31, 2022. This liability will not be increased in subsequent periods unless facts and circumstances change such that an amount greater than the initial recognized liability becomes probable and estimable.
ENVIRONMENTAL AND LEGAL PROCEEDINGS
Environmental
The Company has been named as a potentially responsible party (PRP) in environmental remediation actions under various federal and state laws, including the Comprehensive Environmental Response, Compensation and Liability Act (CERCLA). Many of these proceedings involve the
cleanup of hazardous substances at large commercial landfills that received waste from many different sources. While joint and several liability is authorized under CERCLA and equivalent state laws, as a practical matter, liability for CERCLA cleanups is typically allocated among the many PRPs. There are other remediation costs typically associated with the cleanup of hazardous substances at the Company’s current, closed and formerly-owned facilities, and recorded as liabilities in the balance sheet.
Remediation costs are recorded in the consolidated financial statements when they become probable and reasonably estimable. International Paper has estimated the probable liability associated with these environmental remediation matters, including those described herein, to be approximately $243 million ($251 million undiscounted) in the aggregate as of December 31, 2022. Other than as described below, completion of required environmental remedial actions is not expected to have a material effect on our consolidated financial statements.
Cass Lake: One of the matters included above arises out of a closed wood-treatment facility located in Cass Lake, Minnesota. In June 2011, the United States Environmental Protection Agency (EPA) selected and published a proposed soil remedy at the site with an estimated cost of $46 million. In April 2020, the EPA issued a final plan concerning clean-up standards at a portion of the site, the estimated cost of which is included within the soil remedy referenced above.
Kalamazoo River: The Company is a PRP with respect to the Allied Paper, Inc./Portage Creek/Kalamazoo River Superfund Site in Michigan. The EPA asserts that the site is contaminated by polychlorinated biphenyls (PCBs) primarily as a result of discharges from various paper mills located along the Kalamazoo River, including a paper mill formerly owned by St. Regis Paper Company (St. Regis). The Company is a successor in interest to St. Regis.
- Operable Unit 5, Area 1: In March 2016, the Company and other PRPs received a special notice letter from the EPA (i) inviting participation in implementing a remedy for a portion of the site known as Operable Unit 5, Area 1, and (ii) demanding reimbursement of EPA past costs totaling $37 million, including $19 million in past costs previously demanded by the EPA. The Company responded to the special notice letter. In December 2016, the EPA issued a unilateral administrative order to the Company and other PRPs to perform the remedy. The Company responded to the unilateral administrative order,
agreeing to comply with the order subject to its sufficient cause defenses.
- Operable Unit 1: In October 2016, the Company and another PRP received a special notice letter from the EPA inviting participation in the remedial design (RD) component of the landfill remedy for the Allied Paper Mill, which is also known as Operable Unit 1. The Record of Decision (ROD) establishing the final landfill remedy for the Allied Paper Mill was issued by the EPA in September 2016. The Company responded to the Allied Paper Mill special notice letter in December 2016. In February 2017, the EPA informed the Company that it would make other arrangements for the performance of the RD. In the summer 2021, remedial action (RA) activities were initiated by the EPA. In October 2022, the Company received a unilateral administrative order to perform the RA. As a result, the Company increased its reserve by $27 million in the fourth quarter of 2022. The total reserve for the Kalamazoo River superfund site was $37 million and $13 million as of December 31, 2022 and 2021, respectively.
In addition, in December 2019, the United States published notice in the Federal Register of a proposed consent decree with NCR Corporation (one of the parties to the allocation/apportionment litigation described below), the State of Michigan and natural resource trustees under which NCR would make payments of more than $100 million and perform work in Operable Unit 5, Areas 2, 3, and 4 at an estimated cost of $136 million. In December 2020, the Federal District Court approved the proposed consent decree.
The Company’s CERCLA liability has not been finally determined with respect to these or any other portions of the site, and except as noted above, the Company has declined to perform any work or reimburse the EPA at this time. As noted below, the Company is involved in allocation/apportionment litigation with regard to the site. Accordingly, it is premature to predict the outcome or estimate our maximum reasonably possible loss or range of loss with respect to this site. We have recorded a liability for future remediation costs at the site that are probable and reasonably estimable, and it remains reasonably possible that additional losses in excess of this recorded liability could be material.
The Company was named as a defendant by Georgia-Pacific Consumer Products LP, Fort James Corporation and Georgia Pacific LLC (collectively GP) in a contribution and cost recovery action for alleged pollution at the site. NCR Corporation and Weyerhaeuser Company are also named as defendants in the suit. The suit seeks contribution
under CERCLA for costs purportedly expended by plaintiffs ($79 million as of the filing of the complaint) and for future remediation costs. In June 2018, the Court issued its Final Judgment and Order, which fixed the past cost amount at approximately $50 million (plus interest to be determined) and allocated to the Company a 15% share of responsibility for those past costs. The Court did not address responsibility for future costs in its decision. In July 2018, the Company and each of the other parties filed notices appealing the Final Judgment and prior orders incorporated into that Judgment. On April 25, 2022, the appellate court reversed the Judgment of the Court, finding that the suit against the Company was time-barred by the applicable statute of limitations. On May 9, 2022, GP filed a petition for remaining with the Sixth Circuit Court of Appeals. The Sixth Circuit issued an order denying GP's petition on July 14, 2022. On November 14, 2022, GP filed a petition for writ of certiorari with the U.S. Supreme Court. The Company has filed a brief in opposition to this writ.
Harris County: International Paper and McGinnis Industrial Maintenance Corporation (MIMC), a subsidiary of Waste Management, Inc. (WMI), are PRPs at the San Jacinto River Waste Pits Superfund Site in Harris County, Texas. The PRPs have been actively participating in the activities at the site and share the costs of these activities.
In October 2017, the EPA issued a ROD selecting the final remedy for the site: removal and relocation of the waste material from both the northern and southern impoundments. The EPA did not specify the methods or practices needed to perform this work. The EPA’s selected remedy was accompanied by a cost estimate of approximately $115 million ($105 million for the northern impoundment, and $10 million for the southern impoundment). Subsequent to the issuance of the ROD, there have been numerous meetings between the EPA and the PRPs, and the Company continues to work with the EPA and MIMC/WMI to develop the remedial design.
To this end, in April 2018, the PRPs entered into an Administrative Order on Consent (AOC) with the EPA, agreeing to work together to develop the remedial design for the northern impoundment. That remedial design work is ongoing. The AOC does not include any agreement to perform waste removal or other construction activity at the site. Rather, it involves adaptive management techniques and a pre-design investigation, the objectives of which include filling data gaps (including but not limited to post-Hurricane Harvey technical data generated prior to the ROD and not incorporated into the selected remedy), refining areas and volumes of materials to be
addressed, determining if an excavation remedy is able to be implemented in a manner protective of human health and the environment, and investigating potential impacts of remediation activities to infrastructure in the vicinity.
During the first quarter of 2020, through a series of meetings among the Company, MIMC/WMI, our consultants, the EPA and the Texas Commission on Environmental Quality (TCEQ), progress was made to resolve key technical issues previously preventing the Company from determining the manner in which the selected remedy for the northern impoundment would be feasibly implemented. As a result of these developments the Company reserved the following amounts in relation to remediation at this site: (a) $10 million for the southern impoundment; and (b) $55 million for the northern impoundment, which represents the Company's 50% share of our estimate of the low end of the range of probable remediation costs.
We submitted the Final Design Package for the southern impoundment to the EPA, and the EPA approved this plan May 7, 2021. The EPA issued a Unilateral Administrative Order for Remedial Action of the southern impoundment on August 5, 2021. An addendum to the Final 100% Remedial Design (Amended April 2021) was submitted to the EPA for the southern impoundment on June 2, 2022. This addendum incorporated additional data collected to date which indicated that additional waste material removal will be required, lengthening the time to complete the remedial action. The Company's estimated cost for the Southern impoundment remedial action as of December 31, 2022 was $25 million.
With respect to the northern impoundment, the respondents submitted the final component of the 90% remedial design to the EPA on November 8, 2022. Upon submittal of the final component, an updated engineering estimate was developed and the Company increased the reserved amount by approximately $21 million, which represents the Company's 50% share of our estimate of the low end of the range of probable remediation costs. While several key technical issues have been resolved, respondents still face significant challenges remediating this area in a cost-efficient manner and without a release to the environment, and therefore our discussions with the EPA on the best approach to remediation will continue. Because of ongoing questions regarding cost effectiveness, timing and gathering other technical data, additional losses in excess of our recorded liability are possible. The total reserve for the southern and northern impoundment was $95 million and $60 million as of December 31, 2022 and 2021, respectively.
Asbestos-Related Matters
We have been named as a defendant in various asbestos-related personal injury litigation, in both state and federal court, primarily in relation to the prior operations of certain companies previously acquired by the Company. As of December 31, 2022, the Company's total recorded liability with respect to pending and future asbestos-related claims was $105 million, net of estimated insurance recoveries. While it is reasonably possible that the Company may incur losses in excess of its recorded liability with respect to asbestos-related matters, we are unable to estimate any loss or range of loss in excess of such liability, and do not believe additional material losses are probable.
Antitrust
In March 2017, the Italian Competition Authority (ICA) commenced an investigation into the Italian packaging industry to determine whether producers of corrugated sheets and boxes violated the applicable European competition law. In April 2019, the ICA concluded its investigation and issued initial findings alleging that over 30 producers, including our Italian packaging subsidiary (IP Italy), improperly coordinated the production and sale of corrugated sheets and boxes. On August 6, 2019, the ICA issued its decision and assessed IP Italy a fine of €29 million (approximately $31 million at current exchange rates) which was recorded in the third quarter of 2019. We appealed the ICA decision and our appeal was denied on May 25, 2021. However, we continue to believe we have numerous and strong bases to challenge the ICA decision, and we have further appealed the decision to the Italian Council of State.
General
The Company is involved in various other inquiries, administrative proceedings and litigation relating to environmental and safety matters, personal injury, product liability, labor and employment, contracts, sales of property, intellectual property, tax, and other matters, some of which allege substantial monetary damages. See Note 13 for details regarding a tax matter. Assessments of lawsuits and claims can involve a series of complex judgments about future events, can rely heavily on estimates and assumptions, and are otherwise subject to significant uncertainties. As a result, there can be no certainty that the Company will not ultimately incur charges in excess of presently recorded liabilities. The Company believes that loss contingencies arising from pending matters including the matters described herein, will not have a material effect on the consolidated financial position or liquidity of the Company. However, in light of the inherent uncertainties involved in pending or threatened legal matters, some
of which are beyond the Company's control, and the large or indeterminate damages sought in some of these matters, a future adverse ruling, settlement, unfavorable development, or increase in accruals with respect to these matters could result in future charges that could be material to the Company's results of operations or cash flows in any particular reporting period.
Taxes Other Than Payroll and Income Taxes
In 2017, the Brazilian Federal Supreme Court decided that the state value-added tax (VAT) should not be included in the basis of federal VAT calculations. In 2018 and 2019, the Brazilian tax authorities published both an internal consultation and a normative ruling with a narrow interpretation of the effects of the case. Based upon the best information available to us at that time, we determined an estimated refund was probable of being realized. As of March 31, 2021, we had recognized a receivable of $11 million based upon the authority's narrow interpretation. On May 13, 2021, the Brazilian Federal Supreme Court ruled again on the case. This ruling provides a much broader definition of the state VAT, which increased the exclusion amount from the Federal VAT calculations. Therefore, we recognized an additional receivable of $70 million during the three months ended June 30, 2021, which brought the total receivable to $81 million as of June 30, 2021. The $70 million of income recognized during the second quarter of 2021 included income of $42 million and income of $28 million of net interest expense and is recorded in Discontinued Operations, net of taxes, in the accompanying consolidated statement of operations. A portion of this receivable has been consumed by offsetting various taxes payable leaving a remaining receivable of $48 million. This remaining receivable was conveyed to Sylvamo Corporation on of October 1, 2021, as part of our spin-off transaction.
NOTE 15 VARIABLE INTEREST ENTITIES
In connection with the acquisition of Temple-Inland in February 2012, two special purpose entities became wholly-owned subsidiaries of International Paper. The use of the two wholly-owned special purpose entities discussed below preserved the tax deferral that resulted from the 2007 Temple-Inland timberlands sales. As of December 31, 2022, this deferred tax liability was $485 million, which will be settled with the maturity of the notes in 2027.
In October 2007, Temple-Inland sold 1.55 million acres of timberland for $2.4 billion. The total consideration consisted almost entirely of notes due in 2027 issued by the buyer of the timberland, which Temple-Inland contributed to two wholly-owned,
bankruptcy-remote special purpose entities. The notes are shown in Long-term financial assets of variable interest entities in the accompanying consolidated balance sheet and are supported by $2.4 billion of irrevocable letters of credit issued by three banks, which are required to maintain minimum credit ratings on their long-term debt.
In December 2007, Temple-Inland's two wholly-owned special purpose entities borrowed $2.1 billion which is shown in Long-term nonrecourse financial liabilities of variable interest entities. The loans are repayable in 2027 and are secured by the $2.4 billion of notes and the irrevocable letters of credit securing the notes, and are nonrecourse to us. The loan agreements provide that if a credit rating of any of the banks issuing the letters of credit is downgraded below the specified threshold, the letters of credit issued by that bank must be replaced within 30 days with letters of credit from another qualifying financial institution.
As of both December 31, 2022 and 2021, the fair value of the notes receivable was $2.3 billion. As of both December 31, 2022 and 2021, the fair value of this debt was $2.1 billion. The notes receivable and debt are classified as Level 2 within the fair value hierarchy, which is further defined in Note 17.
Activity between the Company and the 2007 financing entities was as follows:
| In millions | 2022 | 2021 | 2020 | ||||||||
| Revenue (a) | $ | 65 | $ | 24 | $ | 41 | |||||
| Expense (b) | 58 | 24 | 43 | ||||||||
| Cash receipts (c) | 28 | 5 | 29 | ||||||||
| Cash payments (d) | 40 | 16 | 40 |
*(a)*The revenue is included in Interest expense, net, in the accompanying consolidated statement of operations and includes approximately $19 million for the years ended December 31, 2022, 2021 and 2020, respectively, of accretion income for the amortization of the purchase accounting adjustment on the Financial assets of variable interest entities.
(b) The expense is included in Interest expense, net, in the accompanying consolidated statement of operations and includes approximately $7 million for the years ended December 31, 2022, 2021 and 2020 respectively, of accretion expense for the amortization of the purchase accounting adjustment on the Long-term nonrecourse financial liabilities of variable interest entities.
(c) The cash receipts are interest received on the Financial assets of special purpose entities.
(d) The cash payments are interest paid on Nonrecourse financial liabilities of special purpose entities.
In connection with the 2006 sale of approximately 5.6 million acres of forestlands, International Paper received installment notes (the "Timber Notes") totaling approximately $4.8 billion. The Timber Notes were used as collateral for borrowings from third party
lenders, which effectively monetized the Timber Notes through the creation of newly formed special purposes entities (the "Entities"). The monetization structure preserved the tax deferral that resulted from the 2006 forestlands sales. During 2015, International Paper initiated a series of actions in order to extend the 2006 monetization structure and maintain the long-term nature of the deferred tax liability. The Entities, with assets and liabilities primarily consisting of the Timber Notes and third-party bank loans (the "Extension Loans"), were restructured which resulted in the formation of wholly-owned, bankruptcy-remote special purpose entities (the "2015 Financing Entities").
In August 2021, the Timber Notes of $4.8 billion and the Extension Loans of $4.2 billion related to the 2015 Financing Entities both matured. We settled the Extension Loans at their maturity with the proceeds from the Timber Notes. This resulted in cash proceeds of approximately $630 million representing our equity in the variable interest entities. Maturity of the installment notes and termination of the monetization structure also resulted in a $72 million tax liability that was paid in the fourth quarter of 2021.
On September 2, 2022, the Company and the Internal Revenue Service agreed to settle the previously disclosed timber monetization restructuring tax matter. Under this agreement, the Company will fully resolve the matter and pay $252 million in U.S. federal income taxes. As a result, interest will also be charged upon closing of the audit. The amount of interest expense recognized through December 31, 2022 is $58 million. As of December 31, 2022, $89 million in U.S. federal income taxes and $28 million in interest expense have been paid as a result of the settlement agreement. The remaining $163 million U.S. federal income tax liability and $30 million accrued interest liability are recorded as current liabilities in the balance sheet. As part of the settlement with the Internal Revenue Service, the $72 million tax payment discussed in the preceding paragraph was applied to the 2022 U.S. federal estimated tax payments. The reversal of the Company’s remaining deferred tax liability associated with the 2015 Financing Entities of $604 million was recognized as a one-time tax benefit in the third quarter of 2022.
Activity between the Company and the 2015 Financing Entities for the years ended December 31, 2021 and 2020 was as follows:
| In millions | 2021 | 2020 | ||||||
| Revenue (a) | $ | 61 | $ | 95 | ||||
| Expense (a) | 34 | 122 | ||||||
| Cash receipts (b) | 95 | 95 | ||||||
| Cash payments (c) | 38 | 157 |
*(a)*The revenue and expense are included in Interest expense, net in the accompanying consolidated statement of operations.
*(b)*The cash receipts are interest received on the Financial assets of variable interest entities.
*(c)*The cash payments represent interest paid on Current nonrecourse financial liabilities of variable interest entities.
NOTE 16 DEBT AND LINES OF CREDIT
Amounts related to early debt extinguishment during the years ended December 31, 2022, 2021 and 2020 were as follows:
| In millions | 2022 | 2021 | 2020 | ||||||||
| Early debt reductions (a) | $ | 503 | $ | 2,472 | $ | 1,640 | |||||
| Pre-tax early debt extinguishment costs (b) | 93 | 461 | 196 |
*(a)*Reductions related to notes with interest rates ranging from 3.00% to 8.70% with original maturities from 2021 to 2048 for the years ended December 31, 2022, 2021 and 2020.
*(b)*Amounts are included in Restructuring and other charges in the accompanying consolidated statements of operations.
The Company's early debt reductions in 2022 included a debt tender of $498 million with interest rates ranging from 6.40% to 8.70% and maturity dates ranging from 2023 to 2039. In addition, in 2022, the Company had $5 million in open market repurchases related to debt with interest rates ranging from 4.35% to 4.40% and maturity dates ranging from 2047 to 2048. In addition to the early debt reductions, the Company had debt reductions of $514 million in 2022 related primarily to capital leases, debt maturities, and international debt.
During the second quarter of 2022, the Company borrowed approximately $144 million under a term loan credit agreement with a third party lender. Subsequently, the Company exchanged 4,132,000 shares of Sylvamo common stock owned by the Company in exchange and as repayment of the approximately $144 million term loan obligation.
During the third quarter of 2022, the Company borrowed approximately $210 million under a term loan credit agreement with a third party lender. Subsequently, the Company repaid $167 million of the term loan with an exchange of 4,614,358 shares of Sylvamo common stock owned by the Company. The remainder of the term loan was repaid with cash.
During the first quarter of 2022, the Company issued approximately $88 million of debt with an interest rate of 2.65% and a maturity date of 2027. The proceeds from this issuance were used to repay approximately $88 million of outstanding debt that matured on April 1, 2022. During the third quarter of 2022, the Company issued approximately $50 million of debt with a variable rate of interest and a maturity date of 2027. During the fourth quarter of 2022, the Company issued $110 million of debt with a variable rate of interest and a maturity date of 2027.
In January 2023, the Company entered into a variable term loan agreement providing for a $600 million term loan which was fully drawn on the date of such loan agreement and matures in 2028. The $600 million debt was issued following the repayment of $410 million of commercial paper earlier in 2023 and will be used to repay debt maturing later in 2023 and general corporate purposes.
The Company had debt issuances in 2021 of $1.5 billion related primarily to Sylvamo debt issuances as discussed further in Note 8 - Divestitures.
The borrowing capacity of the Company's commercial paper program is $1.0 billion supported by its $1.5 billion credit agreement. In June 2021, the Company extended the maturity date of the $1.5 billion credit facility from December 2022 to June 2026. Under the terms of this program, individual maturities on borrowings may vary, but not exceed one year from the date of issue. Interest bearing notes may be issued either as fixed or floating rate notes. The Company had $410 million borrowings outstanding as of December 31, 2022 and no borrowings outstanding as of December 31, 2021 under this program.
The liquidity facilities also previously included up to $550 million of uncommitted financings based on eligible receivables balances under a receivables securitization program that had an expiration date in April 2022. The receivables securitization program was renewed on April 27, 2022 with up to $500 million of uncommitted financings based on eligible receivables balances with the expiration date in April 2024. As of December 31, 2022 and December 31, 2021, the Company had no borrowings outstanding under the program.
A summary of long-term debt follows:
| In millions at December 31 | 2022 | 2021 | ||||||
| 6.875% notes – due 2023 | 87 | 94 | ||||||
| 7.350% notes – due 2025 | 39 | 44 | ||||||
| 7.750% notes – due 2025 | 22 | 31 | ||||||
| 7.200% notes – due 2026 | 58 | 58 | ||||||
| 6.400% notes – due 2026 | 5 | 5 | ||||||
| 7.150% notes – due 2027 | 7 | 7 | ||||||
| 6.875% notes – due 2029 | 10 | 37 | ||||||
| 5.000% notes – due 2035 | 407 | 407 | ||||||
| 6.650% notes – due 2037 | 3 | 4 | ||||||
| 8.700% notes – due 2038 | 86 | 265 | ||||||
| 7.300% notes – due 2039 | 453 | 722 | ||||||
| 6.000% notes – due 2041 | 585 | 585 | ||||||
| 4.800% notes – due 2044 | 686 | 686 | ||||||
| 5.150% notes – due 2046 | 449 | 449 | ||||||
| 4.400% notes – due 2047 | 647 | 648 | ||||||
| 4.350% notes – due 2048 | 740 | 744 | ||||||
| Floating rate notes – due 2023 – 2027 (a) | 732 | 222 | ||||||
| Environmental and industrial development bonds – due 2023 – 2028 (b) | 489 | 489 | ||||||
| Total principal | 5,505 | 5,497 | ||||||
| Capitalized leases | 59 | 66 | ||||||
| Premiums, discounts, and debt issuance costs | (42) | (48) | ||||||
| Terminated interest rate swaps | 55 | 58 | ||||||
| Other (c) | 2 | 6 | ||||||
| Total (d) | 5,579 | 5,579 | ||||||
| Less: current maturities | 763 | 196 | ||||||
| Long-term debt | $ | 4,816 | $ | 5,383 |
*(a)*The weighted average interest rate on these notes was 4.6% in 2022 and 1.4% in 2021.
*(b)*The weighted average interest rate on these bonds was 2.4% in 2022 and 3.2% in 2021.
*(c)*Includes $0 million and $1 million of fair market value adjustments as of December 31, 2022 and 2021, respectively.
*(d)*The fair market value was approximately $5.2 billion at December 31, 2022 and $7.1 billion at December 31, 2021. Debt fair value measurements use Level 2 inputs.
At December 31, 2022, contractual obligations for future payments of debt maturities (including finance lease liabilities disclosed in Note 10 - Leases and excluding the timber monetization structures disclosed in Note 15 - Variable Interest Entities) by calendar year were as follows over the next five years: 2023 – $763 million; 2024 – $148 million; 2025 – $191 million; 2026 – $72 million; and 2027 – $298 million.
The Company’s financial covenants require the maintenance of a minimum net worth, as defined in our debt agreements, of $9 billion and a total debt-to-capital ratio of less than 60%. Net worth is defined as the sum of common stock, paid-in capital and retained earnings, less treasury stock plus any cumulative goodwill impairment charges. The calculation also excludes accumulated other comprehensive income/loss and both the current and long-term Nonrecourse Financial Liabilities of Variable Interest Entities. The total debt-to-capital ratio is defined as total debt divided by the sum of total debt plus net worth. As of December 31, 2022, we were in compliance with our debt covenants.
NOTE 17 DERIVATIVES AND HEDGING ACTIVITIES
International Paper periodically uses derivatives and other financial instruments to hedge exposures to interest rate, commodity and currency risks. International Paper does not hold or issue financial instruments for trading purposes. For hedges that meet the hedge accounting criteria at inception, International Paper formally designates and documents the instrument as a fair value hedge, a cash flow hedge or a net investment hedge of a specific underlying exposure.
INTEREST RATE RISK MANAGEMENT
Our policy is to manage interest cost using a mixture of fixed-rate and variable-rate debt. To manage this risk in a cost-efficient manner, we enter into interest rate swaps whereby we agree to exchange with the counterparty, at specified intervals, the difference between fixed and variable interest amounts calculated by reference to a notional amount.
Interest rate swaps that meet specific accounting criteria are accounted for as fair value or cash flow hedges. For fair value hedges, the changes in the fair value of both the hedging instruments and the underlying debt obligations are immediately recognized in interest expense. For cash flow hedges, the effective portion of the changes in the fair value of the hedging instrument is reported in AOCI and reclassified into interest expense over the life of the underlying debt. The ineffective portion for both cash flow and fair value hedges, which is not material for any year presented, is immediately recognized in earnings.
FOREIGN CURRENCY RISK MANAGEMENT
We manufacture and sell our products and finance operations in a number of countries throughout the
world and, as a result, are exposed to movements in foreign currency exchange rates. The purpose of our foreign currency hedging program is to manage the
volatility associated with the changes in exchange rates.
To manage this exchange rate risk, we have historically utilized a combination of forward contracts, options and currency swaps. Contracts that qualify are designated as cash flow hedges of certain forecasted transactions denominated in foreign currencies or net investment hedges of foreign denominated subsidiaries. For cash flow hedges, the effective portion of the changes in fair value of these instruments is reported in AOCI and reclassified into earnings in the same financial statement line item and in the same period or periods during which the related hedged transactions affect earnings. The ineffective portion, which is not material for any year presented, is immediately recognized in earnings. For net investment hedges, all changes in the fair value of these instruments are recorded in AOCI, offsetting the currency translation adjustment of the related investment that is also recorded in AOCI.
The change in value of certain non-qualifying instruments used to manage foreign exchange exposure of intercompany financing transactions and certain balance sheet items subject to revaluation is immediately recognized in earnings, substantially offsetting the foreign currency mark-to-market impact of the related exposure.
COMMODITY RISK MANAGEMENT
Certain raw materials used in our production processes are subject to price volatility caused by weather, supply conditions, political and economic variables and other unpredictable factors. To manage the volatility in earnings due to price fluctuations, we may utilize swap contracts or forward purchase contracts.
Derivative instruments are reported in the consolidated balance sheets at their fair values, unless the derivative instruments qualify for the normal purchase normal sale ("NPNS") exception under GAAP and such exception has been elected. If the NPNS exception is elected, the fair values of such contracts are not recognized on the balance sheet.
Contracts that qualify are designated as cash flow hedges of forecasted commodity purchases. The effective portion of the changes in fair value for these instruments is reported in AOCI and reclassified into earnings in the same financial statement line item and in the same period or periods during which the hedged transactions affect earnings. The ineffective and non-qualifying portions, which are not material for any year presented, are immediately recognized in earnings. The change in the fair value of certain non-
qualifying instruments used to reduce commodity price volatility is immediately recognized in earnings.
The notional amounts of qualifying and non-qualifying instruments used in hedging transactions were as follows:
| In millions | December 31, 2022 | December 31, 2021 | ||||||
| Derivatives Not Designated as Hedging Instruments: | ||||||||
| Electricity contract (MWh) | 0.2 | 0.5 |
The following table shows gains or losses recognized in AOCI, net of tax, related to derivative instruments:
| Gain (Loss) Recognized in AOCI on Derivatives (Effective Portion) | |||||||||||
| In millions | 2022 | 2021 | 2020 | ||||||||
| Derivatives in Cash Flow Hedging Relationships: | |||||||||||
| Foreign exchange contracts | $ | — | $ | 3 | $ | (34) | |||||
| Derivatives in Net Investment Hedging Relationships: | |||||||||||
| Foreign exchange contracts | — | 18 | — | ||||||||
| Interest rate contracts | — | — | 25 | ||||||||
| Total | $ | — | $ | 18 | $ | 25 |
During the next 12 months, none of the December 31, 2022 AOCI balance, after tax, is expected to be reclassified to earnings.
The amounts of gains and losses recognized in the consolidated statement of operations on qualifying and non-qualifying financial instruments used in hedging transactions were as follows:
| Gain (Loss) Reclassified from AOCI into Income (Effective Portion) | Location of Gain (Loss) Reclassified from AOCI into Income (Effective Portion) | ||||||||||||||||||||||
| In millions | 2022 | 2021 | 2020 | ||||||||||||||||||||
| Derivatives in Cash Flow Hedging Relationships: | |||||||||||||||||||||||
| Foreign exchange contracts | $ | — | $ | 10 | $ | (25) | Cost of products sold and Discontinued operations, net of taxes | ||||||||||||||||
| Interest rate contracts | (2) | (1) | (1) | Interest expense, net | |||||||||||||||||||
| Total | $ | (2) | $ | 9 | $ | (26) |
| Gain (Loss) Recognized in Income | Location of Gain (Loss) in Consolidated Statement of Operations | |||||||||||||||||||||||||||||||
| In millions | 2022 | 2021 | 2020 | |||||||||||||||||||||||||||||
| Derivatives in Fair Value Hedging Relationships: | ||||||||||||||||||||||||||||||||
| Interest rate contracts | $ | — | $ | — | $ | 38 | Interest expense, net | |||||||||||||||||||||||||
| Debt | — | — | (38) | Interest expense, net | ||||||||||||||||||||||||||||
| Total | $ | — | $ | — | $ | — | ||||||||||||||||||||||||||
| Derivatives in Net Investment Hedging Relationships: | ||||||||||||||||||||||||||||||||
| Foreign exchange contracts | $ | — | $ | — | $ | 2 | Net (gains) losses on sales and impairments of businesses | |||||||||||||||||||||||||
| Total | $ | — | $ | — | $ | 2 | ||||||||||||||||||||||||||
| Derivatives Not Designated as Hedging Instruments: | ||||||||||||||||||||||||||||||||
| Electricity Contracts | $ | 26 | $ | 15 | $ | (2) | Cost of products sold | |||||||||||||||||||||||||
| Foreign exchange contracts | — | (2) | — | Cost of products sold | ||||||||||||||||||||||||||||
| Total | $ | 26 | $ | 13 | $ | (2) |
Fair Value Measurements
International Paper’s financial assets and liabilities that are recorded at fair value consist of derivative contracts, including interest rate swaps, foreign currency forward contracts, options and other financial instruments that are used to hedge exposures to interest rate, commodity and currency risks. For these financial instruments, fair value is determined at each balance sheet date using an income approach. All of International Paper’s derivative fair value measurements use Level 2 inputs.
Below is a description of the valuation calculation and the inputs used for each class of contract:
Interest Rate Contracts
Interest rate contracts are valued using swap curves obtained from an independent market data provider.
The market value of each contract is the sum of the fair value of all future interest payments between the contract counterparties, discounted to present value.
The fair value of the future interest payments is determined by comparing the contract rate to the derived forward interest rate and present valued using the appropriate derived interest rate curve.
Foreign Exchange Contracts
Foreign currency forward and option contracts are valued using standard valuation models. Significant inputs used in these standard valuation models are foreign currency forward and interest rate curves and a volatility measurement. The fair value of each contract is present valued using the applicable interest rate. All significant inputs are readily available in public markets, or can be derived from observable market transactions.
Electricity Contract
The Company is party to an electricity contract used to manage market fluctuations in energy pricing. The Company's electricity contract is valued using the Mid-C index forward curve obtained from the Intercontinental Exchange. The market value of the contract is the sum of the fair value of all future purchase payments between the contract counterparties, discounted to present value. The fair value of the future purchase payments is determined by comparing the contract price to the forward price and present valued using International Paper's cost of capital.
Since the volume and level of activity of the markets that each of the above contracts are traded in has been normal, the fair value calculations have not been adjusted for inactive markets or disorderly transactions.
The following table provides a summary of the impact of our derivative instruments in the consolidated balance sheet:
Fair Value Measurements
Level 2 – Significant Other Observable Inputs
| Assets | ||||||||||||||||||||||||||
| In millions | December 31, 2022 | December 31, 2021 | ||||||||||||||||||||||||
| Derivatives not designated as hedging instruments | ||||||||||||||||||||||||||
| Electricity contract | $ | 20 | (a) | $ | 10 | (b) |
*(a)*Includes $20 million recorded in Other current assets in the accompanying consolidated balance sheet.
*(b)*Included $6 million recorded in Other current assets and $4 million in Deferred charges and other assets recorded in the accompanying consolidated balance sheet.
The above contracts are subject to enforceable master netting arrangements that provide rights of offset with each counterparty when amounts are payable on the same date in the same currency or in the case of certain specified defaults. Management has made an accounting policy election to not offset the fair value of recognized derivative assets and derivative liabilities in the consolidated balance sheet. The amounts owed to the counterparties and owed to the Company are considered immaterial with respect to each counterparty and in the aggregate with all counterparties.
Credit-Risk-Related Contingent Features
International Paper evaluates credit risk by monitoring its exposure with each counterparty to ensure that exposure stays within acceptable policy limits. Credit risk is also mitigated by contractual provisions with the majority of our banks. Certain of the contracts include a credit support annex that requires the posting of collateral by the counterparty or International Paper based on each party’s rating and level of exposure. Based on the Company’s current credit rating, the collateral threshold is generally $15 million.
If the lower of the Company’s credit rating by Moody’s or S&P were to drop below investment grade, the Company would be required to post collateral for all of its derivatives in a net liability position, although no derivatives would terminate. There were no derivative instruments containing credit-risk-related contingent
features in a net liability position as of December 31, 2022 and December 31, 2021. The Company was not required to post any collateral as of December 31, 2022 or 2021.
The authorized capital stock at both December 31, 2022 and 2021, consisted of 990,850,000 shares of common stock, $1 par value; 400,000 shares of cumulative $4 preferred stock, without par value (stated value $100 per share); and 8,750,000 shares of serial preferred stock, $1 par value. The serial preferred stock is issuable in one or more series by the Board of Directors without further shareholder action.
The following is a rollforward of shares of common stock for the three years ended December 31, 2022, 2021 and 2020:
| Common Stock | ||||||||
| In thousands | Issued | Treasury | ||||||
| Balance at January 1, 2020 | 448,916 | 56,800 | ||||||
| Issuance of stock for various plans, net | — | (2,010) | ||||||
| Repurchase of stock | — | 1,027 | ||||||
| Balance at December 31, 2020 | 448,916 | 55,817 | ||||||
| Issuance of stock for various plans, net | — | (1,855) | ||||||
| Repurchase of stock | — | 16,400 | ||||||
| Balance at December 31, 2021 | 448,916 | 70,362 | ||||||
| Issuance of stock for various plans, net | — | (1,569) | ||||||
| Repurchase of stock | — | 29,839 | ||||||
| Balance at December 31, 2022 | 448,916 | 98,632 |
International Paper sponsors and maintains the Retirement Plan of International Paper Company (the "Pension Plan"), a tax-qualified defined benefit pension plan that provides retirement benefits to certain employees.
The Pension Plan provides defined pension benefits based on years of credited service and either final average earnings (salaried employees and hourly employees receiving salaried benefits), hourly job rates or specified benefit rates (hourly and union employees).
The Company also has two unfunded nonqualified defined benefit pension plans: a Pension Restoration Plan that provides retirement benefits based on eligible compensation in excess of limits set by the Internal Revenue Service, and a supplemental retirement plan for senior managers ("SERP"), which
is an alternative retirement plan for salaried employees who are senior vice presidents and above or who are designated by the chief executive officer as participants. These nonqualified plans are only funded to the extent of benefits paid, which totaled $29 million, $21 million and $31 million in 2022, 2021 and 2020, respectively, and which are expected to be $22 million in 2023.
Effective January 1, 2019, the Company froze participation, including credited service and compensation, for salaried employees under the Pension Plan, the Pension Restoration Plan and the SERP plan. This change does not affect benefits accrued through December 31, 2018. For service after December 31, 2018, employees affected by the freeze receive a company contribution to their individual Retirement Savings Account as described later in this Note 19.
Many non-U.S. employees are covered by various retirement benefit arrangements, some of which are considered to be defined benefit pension plans for accounting purposes.
In advance of the spin-off of the Printing Papers segment into a standalone, publicly-traded company, Sylvamo, a legally separate Sylvamo Pension Plan was established to transfer both pension liabilities and qualified pension assets for the approximately 900 active pension participants who transitioned to Sylvamo. Effective September 1, 2021, the Retirement Plan of International Paper (“IP Pension Plan”) and the Sylvamo Pension Plan were legally separated and remeasured as of that date. The remeasurement resulted in a net asset balance of $520 million for the IP Pension Plan, which has been classified as part of the Pension Assets balance on the Consolidated Balance Sheet. Based on the September 1, 2021 remeasurement, the IP Pension Plan completed the transfer of approximately $287 million in projected benefit obligation and approximately $255 million in pension assets, net of post-spin true-up adjustments, to the Sylvamo Pension Plan.
OBLIGATIONS AND FUNDED STATUS
The following table shows the changes in the benefit obligation and plan assets for 2022 and 2021 and the plans’ funded status.
| 2022 | 2021 | |||||||||||||
| In millions | U.S. Plans | Non- U.S. Plans | U.S. Plans | Non- U.S. Plans | ||||||||||
| Change in projected benefit obligation: | ||||||||||||||
| Benefit obligation, January 1 | $ | 11,833 | $ | 65 | $ | 13,020 | $ | 264 | ||||||
| Service cost | 85 | 3 | 100 | 5 | ||||||||||
| Interest cost | 338 | 2 | 333 | 4 | ||||||||||
| Actuarial loss (gain) | (2,863) | (11) | (760) | (11) | ||||||||||
| Divestitures | — | — | (287) | (187) | ||||||||||
| Plan amendments | 16 | — | — | — | ||||||||||
| Benefits paid | (593) | (2) | (573) | (5) | ||||||||||
| Effect of foreign currency exchange rate movements | — | (3) | — | (5) | ||||||||||
| Benefit obligation, December 31 | $ | 8,816 | $ | 54 | $ | 11,833 | $ | 65 | ||||||
| Change in plan assets: | ||||||||||||||
| Fair value of plan assets, January 1 | $ | 12,075 | $ | 19 | $ | 12,018 | $ | 190 | ||||||
| Actual return on plan assets | (2,666) | — | 864 | 4 | ||||||||||
| Company contributions | 29 | 2 | 21 | 6 | ||||||||||
| Benefits paid | (593) | (2) | (573) | (5) | ||||||||||
| Divestiture | — | — | (255) | (175) | ||||||||||
| Effect of foreign currency exchange rate movements | — | (1) | — | (1) | ||||||||||
| Fair value of plan assets, December 31 | $ | 8,845 | $ | 18 | $ | 12,075 | $ | 19 | ||||||
| Funded status, December 31 | $ | 29 | $ | (36) | $ | 242 | $ | (46) | ||||||
| Amounts recognized in the consolidated balance sheet: | ||||||||||||||
| Overfunded pension plan assets | $ | 297 | $ | — | $ | 595 | $ | — | ||||||
| Underfunded pension benefit obligation - current | (22) | (2) | (21) | (1) | ||||||||||
| Underfunded pension benefit obligation - non-current | (246) | (34) | (332) | (45) | ||||||||||
| $ | 29 | $ | (36) | $ | 242 | $ | (46) |
| Amounts recognized in accumulated other comprehensive income (loss) under ASC 715 (pre-tax): | ||||||||||||||
| Prior service cost (credit) | $ | 89 | $ | — | $ | 95 | $ | — | ||||||
| Net actuarial loss (gain) | 1,563 | (7) | 1,199 | 4 | ||||||||||
| $ | 1,652 | $ | (7) | $ | 1,294 | $ | 4 |
The non-current asset for the qualified plan is included in the accompanying consolidated balance sheet under Overfunded Pension Plan Assets. The non-current portion of the liability is included with the pension liability under Underfunded Pension Benefit Obligation.
The largest contributor to the actuarial gain affecting the benefit obligation was the increase in the discount rate from 2.90% at December 31, 2021 to 5.40% at December 31, 2022.
The components of the $357 million and $(12) million related to U.S. plans and non-U.S. plans, respectively, in the amounts recognized in OCI during 2022 consisted of:
| In millions | U.S. Plans | Non- U.S. Plans | ||||||
| Current year actuarial (gain) loss | $ | 451 | $ | (10) | ||||
| Amortization of actuarial loss | (87) | (1) | ||||||
| Current year prior service cost | 16 | — | ||||||
| Amortization of prior service cost | (23) | — | ||||||
| Effect of foreign currency exchange rate movements | — | (1) | ||||||
| $ | 357 | $ | (12) |
The portion of the change in the funded status that was recognized in net periodic benefit cost and OCI for the U.S. plans was $474 million, $(1.0) billion and $(500) million in 2022, 2021 and 2020, respectively. The portion of the change in funded status for the non-U.S. plans was $(6) million, $(73) million, and $13 million in 2022, 2021 and 2020, respectively.
The accumulated benefit obligation at December 31, 2022 and 2021 was $8.8 billion and $11.8 billion, respectively, for our U.S. defined benefit plans and $46 million and $56 million, respectively, at December 31, 2022 and 2021 for our non-U.S. defined benefit plans.
The following table summarizes information for pension plans with an accumulated benefit obligation in excess of plan assets at December 31, 2022 and 2021:
| 2022 | 2021 | |||||||||||||
| In millions | U.S. Plans | Non-U.S. Plans | U.S. Plans | Non-U.S. Plans | ||||||||||
| Projected benefit obligation | $ | 268 | $ | 54 | $ | 353 | $ | 65 | ||||||
| Accumulated benefit obligation | 268 | 45 | 353 | 56 | ||||||||||
| Fair value of plan assets | — | 18 | — | 19 |
ASC 715, “Compensation – Retirement Benefits” provides for delayed recognition of actuarial gains and losses, including amounts arising from changes in the estimated projected plan benefit obligation due to changes in the assumed discount rate, differences between the actual and expected return on plan assets and other assumption changes. These net gains and losses are recognized prospectively over a period that approximates the average remaining service period of active employees expected to receive benefits under the plans to the extent that they are not offset by gains in subsequent years.
NET PERIODIC PENSION EXPENSE
Service cost is the actuarial present value of benefits attributed by the plans’ benefit formula to services rendered by employees during the year. Interest cost represents the increase in the projected benefit obligation, which is a discounted amount, due to the passage of time. The expected return on plan assets reflects the computed amount of current-year earnings from the investment of plan assets using an estimated long-term rate of return.
Net periodic pension expense for qualified and nonqualified U.S. and non-U.S. defined benefit plans comprised the following:
| 2022 | 2021 | 2020 | ||||||||||||||||||
| In millions | U.S. Plans | Non- U.S. Plans | U.S. Plans | Non- U.S. Plans | U.S. Plans | Non- U.S. Plans | ||||||||||||||
| Service cost | $ | 85 | $ | 3 | $ | 100 | $ | 5 | $ | 85 | $ | 5 | ||||||||
| Interest cost | 338 | 2 | 333 | 4 | 393 | 6 | ||||||||||||||
| Expected return on plan assets | (649) | (1) | (705) | (7) | (668) | (8) | ||||||||||||||
| Actuarial loss (gain) | 87 | 1 | 138 | 2 | 202 | 2 | ||||||||||||||
| Amortization of prior service cost | 23 | — | 22 | — | 20 | — | ||||||||||||||
| Curtailment loss (gain) | — | — | — | — | — | (1) | ||||||||||||||
| Settlement loss | — | — | — | — | — | 1 | ||||||||||||||
| Net periodic pension (income) expense | $ | (116) | $ | 5 | $ | (112) | $ | 4 | $ | 32 | $ | 5 |
The components of net periodic pension expense other than the Service cost component are included in Non-operating pension (income) expense in the Consolidated Statement of Operations with the exception of $(3) million related to Sylvamo participants in 2021 recorded in Discontinued Operations.
The decrease in 2022 pension expense primarily reflects lower asset returns, higher interest cost due to a higher discount rate and lower actuarial loss due to a longer amortization period and lower service cost.
ASSUMPTIONS
International Paper evaluates its actuarial assumptions annually as of December 31 (the measurement date) and considers changes in these long-term factors based upon market conditions and the requirements for employers’ accounting for pensions. These assumptions are used to calculate benefit obligations as of December 31 of the current year and pension expense to be recorded in the following year (i.e., the discount rate used to determine the benefit obligation as of December 31, 2022 is also the discount rate used to determine net pension expense for the 2023 year).
Major actuarial assumptions used in determining the benefit obligations and net periodic pension cost for our defined benefit plans are presented in the following table:
| 2022 | 2021 | 2020 | ||||||||||||||||||
| U.S. Plans | Non- U.S. Plans | U.S. Plans | Non- U.S. Plans | U.S. Plans | Non- U.S. Plans | |||||||||||||||
| Actuarial assumptions used to determine benefit obligations as of December 31: | ||||||||||||||||||||
| Discount rate | 5.40 | % | 5.31 | % | 2.90 | % | 2.59 | % | 2.60 | % | 2.32 | % | ||||||||
| Rate of compensation increase | 3.00 | % | 3.36 | % | 3.00 | % | 2.92 | % | 2.25 | % | 3.66 | % | ||||||||
| Actuarial assumptions used to determine net periodic pension cost for years ended December 31: | ||||||||||||||||||||
| Discount rate (a) | 2.90 | % | 2.59 | % | 2.67 | % | 2.32 | % | 3.40 | % | 2.70 | % | ||||||||
| Expected long-term rate of return on plan assets (a) | 6.00 | % | 3.66 | % | 6.40 | % | 4.99 | % | 7.00 | % | 4.92 | % | ||||||||
| Rate of compensation increase | 3.00 | % | 2.92 | % | 2.25 | % | 3.66 | % | 2.25 | % | 3.62 | % |
(a) Represents the weighted average rate for the U.S. qualified plans in 2021 due to the spin-off remeasurement..
The expected long-term rate of return on plan assets is based on projected rates of return for current asset classes in the plan’s investment portfolio. Projected rates of return are developed through an asset/liability study in which projected returns for each of the plan’s asset classes are determined after analyzing historical experience and future expectations of returns and volatility of the various asset classes.
Based on the target asset allocation for each asset class, the overall expected rate of return for the portfolio is developed considering the effects of active portfolio management and expenses paid from plan assets. The discount rate assumption was determined from a universe of high quality corporate bonds. A settlement portfolio is selected and matched to the present value of the plan’s projected benefit payments. To calculate pension expense for 2023, the Company will use an expected long-term rate of return on plan assets of 6.50% for the Retirement Plan of International Paper, a discount rate of 5.40% and an assumed rate of compensation increase of 3.00%. The Company estimates that it will record net pension expense of approximately $102 million for its U.S. defined benefit plans in 2023, compared to income of $116 million in 2022.
For non-U.S. pension plans, assumptions reflect economic assumptions applicable to each country.
The following illustrates the effect on pension expense for 2023 of a 25 basis point decrease in the above assumptions:
| In millions | 2023 | ||||
| Expense (Income): | |||||
| Discount rate | $ | 15 | |||
| Expected long-term rate of return on plan assets | 20 |
PLAN ASSETS
International Paper’s Board of Directors has appointed a Fiduciary Review Committee that is responsible for fiduciary oversight of the U.S. Pension Plan, approving investment policy and reviewing the management and control of plan assets. Pension Plan assets are invested to maximize returns within prudent levels of risk.
The Pension Plan maintains a strategic asset allocation policy that designates target allocations by asset class. Investments are diversified across classes and within each class to minimize the risk of large losses. Derivatives, including swaps, forward and futures contracts, may be used as asset class substitutes or for hedging or other risk management purposes. Periodic reviews are made of investment
policy objectives and investment manager performance. For non-U.S. plans, assets consist principally of common stock and fixed income securities.
International Paper’s U.S. pension allocations by type of fund at December 31, 2022 and 2021 and target allocations were as follows:
| Asset Class | 2022 | 2021 | Target Allocations | ||||||||
| Equity accounts | 16 | % | 18 | % | 14% - 25% | ||||||
| Fixed income accounts | 67 | % | 68 | % | 62% - 78% | ||||||
| Real estate accounts | 9 | % | 8 | % | 4% - 11% | ||||||
| Other | 8 | % | 6 | % | 2% - 8% | ||||||
| Total | 100 | % | 100 | % |
The fair values of International Paper’s pension plan assets at December 31, 2022 and 2021 by asset class are shown below. Hedge funds disclosed in the following table are allocated to fixed income accounts for target allocation purposes.
| Fair Value Measurement at December 31, 2022 | ||||||||||||||
| Asset Class | Total | Quoted Prices in Active Markets For Identical Assets (Level 1) | Significant Observable Inputs (Level 2) | Significant Unobservable Inputs (Level 3) | ||||||||||
| In millions | ||||||||||||||
| Equities – domestic | $ | 442 | $ | 248 | $ | 194 | $ | — | ||||||
| Equities – international | 911 | 641 | 270 | — | ||||||||||
| Corporate bonds | 1,790 | — | 1,790 | — | ||||||||||
| Government securities | 3,796 | — | 3,796 | — | ||||||||||
| Mortgage backed securities | 103 | — | 103 | — | ||||||||||
| Other fixed income | (1,139) | — | (1,146) | 7 | ||||||||||
| Derivatives | 25 | — | — | 25 | ||||||||||
| Cash and cash equivalents | 82 | 82 | — | — | ||||||||||
| Other investments: | ||||||||||||||
| Hedge funds | 1,319 | |||||||||||||
| Private equity | 688 | |||||||||||||
| Real estate funds | 828 | |||||||||||||
| Total Investments | $ | 8,845 | $ | 971 | $ | 5,007 | $ | 32 |
| Fair Value Measurement at December 31, 2021 | ||||||||||||||
| Asset Class | Total | Quoted Prices in Active Markets For Identical Assets (Level 1) | Significant Observable Inputs (Level 2) | Significant Unobservable Inputs (Level 3) | ||||||||||
| In millions | ||||||||||||||
| Equities – domestic | $ | 805 | $ | 471 | $ | 334 | $ | — | ||||||
| Equities – international | 1,381 | 976 | 405 | — | ||||||||||
| Corporate bonds | 2,249 | — | 2,249 | — | ||||||||||
| Government securities | 5,733 | — | 5,733 | — | ||||||||||
| Mortgage backed securities | 126 | — | 126 | — | ||||||||||
| Other fixed income | (1,482) | — | (1,498) | 16 | ||||||||||
| Derivatives | (21) | — | — | (21) | ||||||||||
| Cash and cash equivalents | 266 | 266 | — | — | ||||||||||
| Other investments: | ||||||||||||||
| Hedge funds | 1,368 | |||||||||||||
| Private equity | 721 | |||||||||||||
| Real estate funds | 929 | |||||||||||||
| Total Investments | $ | 12,075 | $ | 1,713 | $ | 7,349 | $ | (5) |
In accordance with accounting standards, certain investments that are measured at NAV and are not classified in the fair value hierarchy.
| Other Investments at December 31, 2022 | ||||||||||||||
| Investment | Fair Value | Unfunded Commitments | Redemption Frequency | Remediation Notice Period | ||||||||||
| In millions | ||||||||||||||
| Hedge funds | $ | 1,319 | $ | 120 | Daily to annually | 1 - 100 days | ||||||||
| Private equity | 688 | 126 | (a) | None | ||||||||||
| Real estate funds | 828 | 129 | Quarterly | 45 - 60 days | ||||||||||
| Total | $ | 2,835 | $ | 375 |
(a) A private equity fund investment ("partnership interest") is contractually locked up for the life of the private equity fund by the partnership agreement. Limited partners do not have the option to redeem partnership interests.
| Other Investments at December 31, 2021 | ||||||||||||||
| Investment | Fair Value | Unfunded Commitments | Redemption Frequency | Remediation Notice Period | ||||||||||
| In millions | ||||||||||||||
| Hedge funds | $ | 1,368 | $ | 176 | Daily to annually | 1 - 100 days | ||||||||
| Private equity | 721 | 190 | (a) | None | ||||||||||
| Real estate funds | 929 | 176 | Quarterly | 45 - 60 days | ||||||||||
| Total | $ | 3,018 | $ | 542 |
(a) A private equity fund investment ("partnership interest") is contractually locked up for the life of the private equity fund by the partnership agreement. Limited partners do not have the option to redeem partnership interests.
Equity securities consist primarily of publicly traded U.S. companies and international companies. Publicly traded equities are valued at the closing prices reported in the active market in which the individual securities are traded.
Fixed income consists of government securities, mortgage-backed securities, corporate bonds, common collective funds and other fixed income investments. Government securities are valued by third-party pricing sources. Mortgage-backed security holdings consist primarily of agency-rated holdings. The fair value estimates for mortgage securities are calculated by third-party pricing sources chosen by the custodian’s price matrix. Corporate bonds are valued using either the yields currently available on comparable securities of issuers with similar credit ratings or using a discounted cash flows approach that utilizes observable inputs, such as current yields of similar instruments, but includes adjustments for certain risks that may not be observable, such as credit and liquidity risks. Common collective funds are valued at the net asset value per share multiplied by the number of shares held as of the measurement date. Other fixed income investments of $(1.1) billion and $(1.5) billion at December 31, 2022 and 2021, respectively, primarily include reverse repurchase agreement obligations in which we have sold a security and have an agreement to repurchase the same or substantially the same security at a later date for a price specified in the agreement.
Derivative investments such as futures, forward contracts, options and swaps are used to help manage risks. Derivatives are generally employed as asset class substitutes (such as when employed in a portable alpha strategy), for managing asset/liability mismatches, or bona fide hedging or other appropriate risk management purposes. Derivative instruments are generally valued by the investment managers or in certain instances by third-party pricing sources.
Hedge funds are investment structures for managing private, loosely-regulated investment pools that can pursue a diverse array of investment strategies with a
wide range of different securities and derivative instruments. These investments are made through funds-of-funds (commingled, multi-manager fund structures) and through direct investments in individual hedge funds. Hedge funds are primarily valued by each fund’s third-party administrator based upon the valuation of the underlying securities and instruments and primarily by applying a market or income valuation methodology as appropriate depending on the specific type of security or instrument held. Funds-of-funds are valued based upon the net asset values of the underlying investments in hedge funds.
Private equity consists of interests in partnerships
that invest in U.S. and non-U.S. debt and equity securities. Partnership interests are valued using the most recent general partner statement of fair value, updated for any subsequent partnership interest cash flows.
Real estate funds include commercial properties, land and timberland, and generally include, but are not limited to, retail, office, industrial, multifamily and hotel properties. Real estate fund values are primarily reported by the fund manager and are based on
valuation of the underlying investments which include inputs such as cost, discounted cash flows, independent appraisals and market based comparable data.
The following is a reconciliation of the assets that are classified using significant unobservable inputs (Level 3) at December 31, 2022:
Fair Value Measurements Using Significant Unobservable Inputs (Level 3)
| In millions | Other fixed income | Derivatives | Total | |||||||||||
| Beginning balance at December 31, 2020 | $ | 14 | $ | (6) | $ | 8 | ||||||||
| Actual return on plan assets: | ||||||||||||||
| Relating to assets still held at the reporting date | 2 | (20) | (18) | |||||||||||
| Relating to assets sold during the period | — | (101) | (101) | |||||||||||
| Purchases, sales and settlements | — | 106 | 106 | |||||||||||
| Transfers in and/or out of Level 3 | — | — | — | |||||||||||
| Ending balance at December 31, 2021 | $ | 16 | $ | (21) | $ | (5) | ||||||||
| Actual return on plan assets: | ||||||||||||||
| Relating to assets still held at the reporting date | (9) | 38 | 29 | |||||||||||
| Relating to assets sold during the period | 10 | (189) | (179) | |||||||||||
| Purchases, sales and settlements | (10) | 197 | 187 | |||||||||||
| Transfers in and/or out of Level 3 | — | — | — | |||||||||||
| Ending balance at December 31, 2022 | $ | 7 | $ | 25 | $ | 32 |
FUNDING AND CASH FLOWS
The Company’s funding policy for the Pension Plan is to contribute amounts sufficient to meet legal funding requirements, plus any additional amounts that the Company may determine to be appropriate considering the funded status of the plans, tax deductibility, cash flow generated by the Company, and other factors. The Company continually reassesses the amount and timing of any discretionary contributions. No voluntary contributions were made in 2020, 2021 or 2022. Generally, International Paper’s non-U.S. pension plans are funded using the projected benefit as a target, except in certain countries where funding of benefit plans is not required.
At December 31, 2022, projected future pension benefit payments, excluding any termination benefits, were as follows:
| In millions | |||||
| 2023 | $ | 610 | |||
| 2024 | 622 | ||||
| 2025 | 628 | ||||
| 2026 | 637 | ||||
| 2027 | 640 | ||||
| 2028-2032 | 3,199 |
OTHER U.S. PLANS
International Paper sponsors the International Paper Company Salaried Savings Plan and the International Paper Company Hourly Savings Plan, both of which are tax-qualified defined contribution 401(k) savings
plans. Substantially all U.S. salaried and certain hourly employees are eligible to participate and may make elective deferrals to such plans to save for retirement. International Paper makes matching contributions to participant accounts on a specified percentage of employee deferrals as determined by the provisions of each plan. The Company makes Retirement Savings Account contributions equal to a percentage of an eligible employee’s pay. Beginning in 2019, as a result of the freeze for salaried employees under the Pension Plan, all salaried employees are eligible for the contribution to the Retirement Savings Account.
The Company also sponsors the International Paper Company Deferred Compensation Savings Plan, which is an unfunded nonqualified defined contribution plan. This plan permits eligible employees to continue to make deferrals and receive company matching contributions (and Retirement
Savings Account contributions) when their contributions to the International Paper Salaried Savings Plan are stopped due to limitations under U.S. tax law. Participant deferrals and company contributions are not invested in a separate trust, but are paid directly from International Paper’s general assets at the time benefits become due and payable.
Company contributions to the plans totaled approximately $159 million, $172 million and $154 million for the plan years ending in 2022, 2021 and 2020, respectively.
NOTE 20 POSTRETIREMENT BENEFITS
U.S. POSTRETIREMENT BENEFITS
International Paper provides certain retiree health care and life insurance benefits covering certain U.S. salaried and hourly employees. These employees are generally eligible for benefits upon retirement and completion of a specified number of years of creditable service. International Paper does not fund these benefits prior to payment and has the right to modify or terminate certain of these plans in the future.
In addition to the U.S. plan, certain Moroccan employees are eligible for retiree health care and life insurance benefits.
The components of postretirement benefit expense in 2022, 2021 and 2020 were as follows:
| In millions | 2022 | 2021 | 2020 | |||||||||||||||||
| U.S. Plans | Non- U.S. Plans | U.S. Plans | Non- U.S. Plans | U.S. Plans | Non- U.S. Plans | |||||||||||||||
| Service cost | $ | — | $ | — | $ | — | $ | — | $ | — | $ | — | ||||||||
| Interest cost | 5 | — | 5 | 1 | 7 | 2 | ||||||||||||||
| Actuarial loss | 3 | — | 5 | 1 | 5 | 1 | ||||||||||||||
| Amortization of prior service credits | — | — | — | (2) | (1) | (2) | ||||||||||||||
| Net postretirement expense | $ | 8 | $ | — | $ | 10 | $ | — | $ | 11 | $ | 1 |
International Paper evaluates its actuarial assumptions annually as of December 31 (the measurement date) and considers changes in these long-term factors based upon market conditions and the requirements of employers’ accounting for postretirement benefits other than pensions. The discount rate assumption was determined based on a hypothetical settlement portfolio selected from a universe of high quality corporate bonds.
The discount rates used to determine net U.S. and non-U.S. postretirement benefit cost for the years ended December 31, 2022, 2021 and 2020 were as follows:
| 2022 | 2021 | 2020 | ||||||||||||||||||
| U.S. Plans | Non- U.S. Plans | U.S. Plans | Non- U.S. Plans | U.S. Plans | Non- U.S. Plans | |||||||||||||||
| Discount rate | 2.90 | % | 5.20 | % | 2.50 | % | 6.91 | % | 3.30 | % | 7.15 | % |
The weighted average assumptions used to determine the benefit obligation at December 31, 2022 and 2021 were as follows:
| 2022 | 2021 | |||||||||||||
| U.S. Plans | Non- U.S. Plans | U.S. Plans | Non- U.S. Plans | |||||||||||
| Discount rate | 5.50 | % | 5.70 | % | 2.90 | % | 5.20 | % | ||||||
| Health care cost trend rate assumed for next year | 7.25 | % | 4.00 | % | 7.00 | % | 4.00 | % | ||||||
| Rate that the cost trend rate gradually declines to | 5.00 | % | 4.00 | % | 5.00 | % | 4.00 | % | ||||||
| Year that the rate reaches the rate it is assumed to remain | 2032 | 2023 | 2030 | 2022 |
The plans are only funded in an amount equal to benefits paid. The following table presents the changes in benefit obligation and plan assets for 2022 and 2021:
| In millions | 2022 | 2021 | ||||||||||||
| U.S. Plans | Non- U.S. Plans | U.S. Plans | Non- U.S. Plans | |||||||||||
| Change in projected benefit obligation: | ||||||||||||||
| Benefit obligation, January 1 | $ | 172 | $ | 5 | $ | 201 | $ | 20 | ||||||
| Service cost | — | — | — | — | ||||||||||
| Interest cost | 5 | — | 5 | 1 | ||||||||||
| Participants’ contributions | 3 | — | 3 | — | ||||||||||
| Actuarial (gain) loss | (33) | — | (12) | — | ||||||||||
| Benefits paid | (23) | — | (26) | — | ||||||||||
| Less: Federal subsidy | 1 | — | 1 | — | ||||||||||
| Divestiture | — | — | — | (15) | ||||||||||
| Currency Impact | — | (1) | — | (1) | ||||||||||
| Benefit obligation, December 31 | $ | 125 | $ | 4 | $ | 172 | $ | 5 | ||||||
| Change in plan assets: | ||||||||||||||
| Fair value of plan assets, January 1 | $ | — | $ | — | $ | — | $ | — | ||||||
| Company contributions | 20 | — | 23 | — | ||||||||||
| Participants’ contributions | 3 | — | 3 | — | ||||||||||
| Benefits paid | (23) | — | (26) | — | ||||||||||
| Fair value of plan assets, December 31 | $ | — | $ | — | $ | — | $ | — | ||||||
| Funded status, December 31 | $ | (125) | $ | (4) | $ | (172) | $ | (5) | ||||||
| Amounts recognized in the consolidated balance sheet under ASC 715: | ||||||||||||||
| Current liability | $ | (15) | $ | — | $ | (17) | $ | — | ||||||
| Non-current liability | (110) | (4) | (155) | (5) | ||||||||||
| $ | (125) | $ | (4) | $ | (172) | $ | (5) | |||||||
| Amounts recognized in accumulated other comprehensive income (loss) under ASC 715 (pre-tax): | ||||||||||||||
| Net actuarial loss (gain) | $ | (6) | $ | (1) | $ | 29 | $ | — | ||||||
| Prior service credit | — | — | — | — | ||||||||||
| $ | (6) | $ | (1) | $ | 29 | $ | — |
The non-current portion of the liability is included with the postemployment liability in the accompanying consolidated balance sheet under Postretirement and postemployment benefit obligation.
The components of the ($35) million and ($1) million change in the amounts recognized in OCI during 2022 for U.S. and non-U.S. plans, respectively, consisted of:
| In millions | U.S. Plans | Non- U.S. Plans | ||||||
| Current year actuarial (gain) loss | $ | (32) | $ | (1) | ||||
| Amortization of actuarial (loss) gain | (3) | — | ||||||
| $ | (35) | $ | (1) |
The portion of the change in the funded status that was recognized in net periodic benefit cost and OCI for the U.S. plans was $44 million, $27 million and $12 million in 2022, 2021 and 2020, respectively. The portion of the change in funded status for the non-U.S. plans was $0 million, $1 million, and $0 million in 2022, 2021 and 2020, respectively.
At December 31, 2022, estimated total future postretirement benefit payments, net of participant contributions and estimated future Medicare Part D subsidy receipts, were as follows:
| In millions | Benefit Payments | Subsidy Receipts | Benefit Payments | ||||||||
| U.S. Plans | U.S. Plans | Non- U.S. Plans | |||||||||
| 2023 | $ | 15 | $ | 1 | $ | — | |||||
| 2024 | 14 | 1 | — | ||||||||
| 2025 | 13 | 1 | — | ||||||||
| 2026 | 12 | 1 | — | ||||||||
| 2027 | 12 | 1 | — | ||||||||
| 2028 – 2032 | 49 | 3 | 1 |
International Paper currently has an Incentive Compensation Plan (ICP). The ICP authorizes grants of restricted stock, restricted or deferred stock units, performance awards payable in cash or stock upon the attainment of specified performance goals, dividend equivalents, stock options, stock appreciation rights, other stock-based awards, and cash-based awards at the discretion of the Management Development and Compensation
Committee of the Board of Directors (the "Committee") that administers the ICP. Additionally, restricted stock, which may be deferred into restricted stock units (RSUs), may be awarded under a Restricted Stock and Deferred Compensation Plan for Non-Employee Directors.
PERFORMANCE SHARE PLAN
Under the Performance Share Plan ("PSP"), contingent awards of International Paper common stock are granted by the Committee. The PSP awards are earned over a three-year period. PSP awards are earned based on the achievement of defined performance of Return on Invested Capital ("ROIC") measured against our internal benchmark and ranking of Total Shareholder Return ("TSR") compared to the TSR peer group of companies. The 2020-2022, 2021-2023 and 2022-2024 Awards are weighted 50% ROIC and 50% TSR for all participants. The ROIC component of the PSP awards is valued at the closing stock price on the day prior to the grant date. As the ROIC component contains a performance condition, compensation expense, net of estimated forfeitures, is recorded over the requisite service period based on the most probable number of awards expected to vest. The TSR component of the PSP awards is valued using a Monte Carlo simulation as the TSR component contains a market condition. The Monte Carlo simulation estimates the fair value of the TSR component based on the expected term of the award, a risk-free rate, expected dividends, and the expected volatility for the Company and its competitors. The expected term is estimated based on the vesting period of the awards, the risk-free rate is based on the yield on U.S. Treasury securities matching the vesting period, and the volatility is based on the Company’s historical volatility over the expected term. PSP grants are made in performance-based restricted stock units.
The following table sets forth the assumptions used to determine compensation cost for the market condition component of the PSP plan:
| Twelve Months Ended December 31, 2022 | |||||
| Expected volatility | 24.36% - 36.92% | ||||
| Risk-free interest rate | 0.17% - 1.61% |
The following summarizes PSP activity for the three years ended December 31, 2022:
| Share/Units | Weighted Average Grant Date Fair Value | |||||||
| Outstanding at December 31, 2019 | 5,514,728 | $41.14 | ||||||
| Granted | 2,171,385 | 49.15 | ||||||
| Shares issued | (1,221,950) | 51.70 | ||||||
| Forfeited | (844,138) | 51.70 | ||||||
| Outstanding at December 31, 2020 | 5,620,025 | 40.36 | ||||||
| Granted | 2,316,295 | 45.24 | ||||||
| Shares issued | (994,052) | 63.54 | ||||||
| Forfeited | (1,016,126) | 57.55 | ||||||
| Outstanding at December 31, 2021 | 5,926,142 | 35.43 | ||||||
| Granted | 1,899,211 | 50.32 | ||||||
| Shares issued | (1,130,236) | 40.23 | ||||||
| Forfeited | (1,382,637) | 42.03 | ||||||
| Outstanding at December 31, 2022 | 5,312,480 | $38.01 |
Effective January 1, 2023, the ICP was amended to change the name of the PSP to Long-Term Incentive Plan (LTIP), which incorporates RSUs, along with tiering of performance-based stock units and RSUs.
RESTRICTED STOCK AWARD PROGRAMS
The service-based Restricted Stock Award program ("RSA"), designed for recruitment, retention and special recognition purposes, provides for awards of restricted stock to key employees.
The following summarizes the activity of the RSA program for the three years ended December 31, 2022:
| Shares | Weighted Average Grant Date Fair Value | |||||||
| Outstanding at December 31, 2019 | 160,700 | $47.27 | ||||||
| Granted | 82,228 | 40.12 | ||||||
| Shares issued | (83,053) | 44.25 | ||||||
| Forfeited | (33,800) | 46.43 | ||||||
| Outstanding at December 31, 2020 | 126,075 | 44.83 | ||||||
| Granted | 85,098 | 50.90 | ||||||
| Shares issued | (85,768) | 45.59 | ||||||
| Forfeited | (21,636) | 45.52 | ||||||
| Outstanding at December 31, 2021 | 103,769 | 49.03 | ||||||
| Granted | 132,200 | 43.38 | ||||||
| Shares issued | (104,177) | 44.53 | ||||||
| Forfeited | (5,400) | 47.78 | ||||||
| Outstanding at December 31, 2022 | 126,392 | $46.88 |
At December 31, 2022, 2021 and 2020 a total of 7.3 million, 7.7 million and 8.5 million shares, respectively, were available for grant under the ICP.
Stock-based compensation expense and related income tax benefits were as follows:
| In millions | 2022 | 2021 | 2020 | ||||||||
| Total stock-based compensation expense (included in selling and administrative expense) | $ | 124 | $ | 130 | $ | 72 | |||||
| Income tax benefits related to stock-based compensation | 13 | 13 | 17 |
At December 31, 2022, $79 million of compensation cost, net of estimated forfeitures, related to unvested restricted performance shares, executive continuity awards and restricted stock attributable to future performance had not yet been recognized. This amount will be recognized in expense over a weighted-average period of 1.8 years.
NOTE 22 FINANCIAL INFORMATION BY BUSINESS SEGMENT AND GEOGRAPHIC AREA
International Paper’s business segments, Industrial Packaging and Global Cellulose Fibers are consistent with the internal structure used to manage these businesses. See the Description of Business Segments on pages 31 and 32 in Part II. Item 7. Management's Discussion and Analysis of Financial Condition and Results of Operations for a description of the types of products and services from which each reportable segment derives its revenues. On October 1, 2021, the Company completed the previously announced spin-off of its Printing Papers business into a new, publicly-traded company, Sylvamo, listed on the New York Stock Exchange. Additionally, on August 6, 2021, the Company completed the sale of its Kwidzyn, Poland mill which included the pulp and paper mill in Kwidzyn and supporting functions. As a result of the Sylvamo spin-off and the sale of Kwidzyn, the Company no longer has a Printing Papers segment, and all prior year amounts have been adjusted to reflect the Sylvamo and Kwidzyn businesses as a discontinued operation. Both segments are differentiated on a common product, common customer basis consistent with the business segmentation generally used in the Forest Products industry.
Business segment operating profits are used by International Paper’s management to measure the earnings performance of its businesses. Management believes that this measure allows a better understanding of trends in costs, operating efficiencies, prices and volumes. Business segment operating profits are defined as earnings (loss) from continuing operations before income taxes and equity earnings, but including the impact of less than wholly owned subsidiaries, excluding interest expense, net, corporate items, net, corporate net special items, business net special items and non-operating pension expense.
External sales by major product is determined by aggregating sales from each segment based on similar products or services. External sales are defined as those that are made to parties outside International Paper’s consolidated group, whereas sales by segment in the Net Sales table are determined using a management approach and include intersegment sales.
INFORMATION BY BUSINESS SEGMENT
Net Sales
| In millions | 2022 | 2021 | 2020 | ||||||||||||||
| Industrial Packaging | $ | 17,451 | $ | 16,326 | $ | 14,900 | |||||||||||
| Global Cellulose Fibers | 3,227 | 2,732 | 2,393 | ||||||||||||||
| Corporate and Intersegment Sales (a) | 483 | 305 | 272 | ||||||||||||||
| Net Sales | $ | 21,161 | $ | 19,363 | $ | 17,565 |
Operating Profit (Loss)
| In millions | 2022 | 2021 | 2020 | ||||||||||||||
| Industrial Packaging | $ | 1,742 | $ | 1,638 | $ | 1,757 | |||||||||||
| Global Cellulose Fibers | 106 | (3) | (218) | ||||||||||||||
| Business Segment Operating Profit | 1,848 | 1,635 | 1,539 | ||||||||||||||
| Earnings (loss) from continuing operations before income taxes and equity earnings | 1,511 | 999 | 329 | ||||||||||||||
| Interest expense, net | 325 | 337 | 446 | ||||||||||||||
| Adjustment for less than wholly owned subsidiaries (b) | (5) | (5) | — | ||||||||||||||
| Corporate expenses, net (a) | 34 | 134 | 62 | ||||||||||||||
| Corporate net special items | 99 | 352 | 262 | ||||||||||||||
| Business net special items | 76 | 18 | 481 | ||||||||||||||
| Non-operating pension (income) expense | (192) | (200) | (41) | ||||||||||||||
| $ | 1,848 | $ | 1,635 | $ | 1,539 |
Assets
| In millions | 2022 | 2021 | |||||||||
| Industrial Packaging | $ | 16,425 | $ | 16,247 | |||||||
| Global Cellulose Fibers | 3,625 | 3,521 | |||||||||
| Corporate and other | 3,890 | 5,475 | |||||||||
| Assets | $ | 23,940 | $ | 25,243 |
Capital Spending
| In millions | 2022 | 2021 | 2020 | ||||||||||||||
| Industrial Packaging | $ | 762 | $ | 382 | $ | 554 | |||||||||||
| Global Cellulose Fibers | 143 | 83 | 96 | ||||||||||||||
| Subtotal | 905 | 465 | 650 | ||||||||||||||
| Corporate and other | 26 | 15 | 13 | ||||||||||||||
| Capital Spending | $ | 931 | $ | 480 | $ | 663 |
Depreciation, Amortization and Cost of Timber Harvested
| In millions | 2022 | 2021 | 2020 | ||||||||||||||
| Industrial Packaging | $ | 783 | $ | 829 | $ | 813 | |||||||||||
| Global Cellulose Fibers | 255 | 265 | 274 | ||||||||||||||
| Corporate | 2 | 3 | 4 | ||||||||||||||
| Depreciation and Amortization | $ | 1,040 | $ | 1,097 | $ | 1,091 |
External Sales By Major Product
| In millions | 2022 | 2021 | 2020 | ||||||||||||||
| Industrial Packaging | $ | 17,441 | $ | 16,276 | $ | 14,851 | |||||||||||
| Global Cellulose Fibers | 3,219 | 2,730 | 2,394 | ||||||||||||||
| Other (c) | 501 | 357 | 320 | ||||||||||||||
| Net Sales | $ | 21,161 | $ | 19,363 | $ | 17,565 |
INFORMATION BY GEOGRAPHIC AREA
Net Sales (d)
| In millions | 2022 | 2021 | 2020 | ||||||||||||||
| United States (e) | $ | 18,482 | $ | 16,769 | $ | 15,178 | |||||||||||
| EMEA | 1,693 | 1,611 | 1,395 | ||||||||||||||
| Pacific Rim and Asia | 123 | 207 | 203 | ||||||||||||||
| Americas, other than U.S. | 863 | 776 | 789 | ||||||||||||||
| Net Sales | $ | 21,161 | $ | 19,363 | $ | 17,565 |
Long-Lived Assets (f)
| In millions | 2022 | 2021 | |||||||||
| United States | $ | 9,333 | $ | 9,317 | |||||||
| EMEA | 738 | 745 | |||||||||
| Americas, other than U.S. | 378 | 397 | |||||||||
| Long-Lived Assets | $ | 10,449 | $ | 10,459 |
*(a)*Includes sales of $44 million in 2021 and $56 million in 2020 and operating profit (losses) of $9 million in 2021 and $1 million in 2020, from previously divested businesses. There were no sales or operating profit (losses) from previously divested businesses in 2022.
*(b)*Operating profits for industry segments include each segment’s percentage share of the profits of subsidiaries included in that segment that are less than wholly-owned. The pre-tax earnings for these subsidiaries is added here to present consolidated earnings from continuing operations before income taxes and equity earnings.
*(c)*Includes $44 million in 2021 and $56 million in 2020 from previously divested businesses.
*(d)*Net sales are attributed to countries based on the location of the seller.
*(e)*Export sales to unaffiliated customers were $3.2 billion in 2022, $2.6 billion in 2021 and $2.4 billion in 2020.
*(f)*Long-Lived Assets includes Forestlands and Plants, Properties and Equipment, net.
INTERIM FINANCIAL RESULTS (UNAUDITED)
| In millions, except per share amounts and stock prices | 1****st Quarter | 2****nd Quarter | 3****rd Quarter | 4th Quarter | Year | |||||||||||||||||||||||||||
| 2022 | ||||||||||||||||||||||||||||||||
| Net sales | $ | 5,237 | $ | 5,389 | $ | 5,402 | $ | 5,133 | $ | 21,161 | ||||||||||||||||||||||
| Earnings (loss) from continuing operations before income taxes and equity earnings | 362 | (a) | 514 | (a) | 313 | (a) | 322 | (a) | 1,511 | (a) | ||||||||||||||||||||||
| Gain (loss) from discontinued operations | 93 | (b) | 95 | (b) | 64 | (b) | (489) | (b) | (237) | (b) | ||||||||||||||||||||||
| Net earnings (loss) attributable to International Paper Company | 360 | (a-c) | 511 | (a-c) | 951 | (a-c) | (318) | (a-c) | 1,504 | (a-c) | ||||||||||||||||||||||
| Basic earnings (loss) per share attributable to International Paper Company common shareholders: | ||||||||||||||||||||||||||||||||
| Earnings (loss) from continuing operations | $ | 0.71 | $ | 1.13 | $ | 2.48 | $ | 0.48 | $ | 4.79 | ||||||||||||||||||||||
| Gain (loss) from discontinued operations | 0.25 | 0.26 | 0.18 | (1.38) | (0.65) | |||||||||||||||||||||||||||
| Net earnings (loss) | 0.96 | 1.39 | 2.66 | (0.90) | 4.14 | |||||||||||||||||||||||||||
| Diluted earnings (loss) per share attributable to International Paper Company common shareholders: | ||||||||||||||||||||||||||||||||
| Earnings (loss) from continuing operations | $ | 0.70 | $ | 1.13 | $ | 2.46 | $ | 0.48 | $ | 4.74 | ||||||||||||||||||||||
| Gain (loss) from discontinued operations | 0.25 | 0.25 | 0.18 | (1.38) | (0.64) | |||||||||||||||||||||||||||
| Net earnings (loss) | 0.95 | 1.38 | 2.64 | (0.90) | 4.10 | |||||||||||||||||||||||||||
| Dividends per share of common stock | 0.4625 | 0.4625 | 0.4625 | 0.4625 | 1.8500 | |||||||||||||||||||||||||||
| 2021 | ||||||||||||||||||||||||||||||||
| Net sales | $ | 4,593 | $ | 4,770 | $ | 4,914 | $ | 5,086 | $ | 19,363 | ||||||||||||||||||||||
| Earnings (loss) from continuing operations before income taxes and equity earnings | 306 | (d) | 252 | (d) | 397 | (d) | 44 | (d) | 999 | (d) | ||||||||||||||||||||||
| Gain (loss) from discontinued operations | 131 | (e) | 225 | (e) | 527 | (e) | 58 | (e) | 941 | (e) | ||||||||||||||||||||||
| Net earnings (loss) attributable to International Paper Company | 349 | (d-f) | 432 | (d-g) | 864 | (d-f) | 107 | (d-f) | 1,752 | (d-g) | ||||||||||||||||||||||
| Basic earnings (loss) per share attributable to International Paper Company common shareholders: | ||||||||||||||||||||||||||||||||
| Earnings (loss) from continuing operations | $ | 0.56 | $ | 0.53 | $ | 0.86 | $ | 0.13 | $ | 2.08 | ||||||||||||||||||||||
| Gain (loss) from discontinued operations | 0.33 | 0.57 | 1.36 | 0.15 | 2.42 | |||||||||||||||||||||||||||
| Net earnings (loss) | 0.89 | 1.10 | 2.22 | 0.28 | 4.50 | |||||||||||||||||||||||||||
| Diluted earnings (loss) per share attributable to International Paper Company common shareholders: | ||||||||||||||||||||||||||||||||
| Earnings (loss) from continuing operations | $ | 0.55 | $ | 0.52 | $ | 0.86 | $ | 0.13 | $ | 2.07 | ||||||||||||||||||||||
| Gain (loss) from discontinued operations | 0.33 | 0.57 | 1.34 | 0.15 | 2.40 | |||||||||||||||||||||||||||
| Net earnings (loss) | 0.88 | 1.09 | 2.20 | 0.28 | 4.47 | |||||||||||||||||||||||||||
| Dividends per share of common stock | 0.5125 | 0.5125 | 0.5125 | 0.4625 | 2.000 |
Note: International Paper's common shares (symbol: IP) are listed on the New York Stock Exchange.
Note: Since basic and diluted earnings per share are computed independently for each period and category, full year per share amounts may not equal the sum of the four quarters. In addition, the unaudited selected consolidated financial data are derived from our audited consolidated financial statements and have been revised to reflect discontinued operations.
Footnotes to Interim Financial Results
(a) Includes the following pre-tax charges (gains):
| 2022 | ||||||||||||||||||||||||||
| In millions | Q1 | Q2 | Q3 | Q4 | ||||||||||||||||||||||
| Debt extinguishment costs | $ | — | $ | — | $ | 93 | $ | — | ||||||||||||||||||
| EMEA Packaging goodwill impairment | — | — | — | 76 | ||||||||||||||||||||||
| Foreign currency cumulative translation loss related to sale of equity method investment | — | — | — | 10 | ||||||||||||||||||||||
| Timber monetization settlement interest | — | — | 55 | 3 | ||||||||||||||||||||||
| Litigation reserve adjustments | — | — | (15) | 11 | ||||||||||||||||||||||
| Environmental remediation reserve adjustment | — | 15 | — | 48 | ||||||||||||||||||||||
| Sylvamo investment - fair value adjustment | (46) | (3) | (16) | — | ||||||||||||||||||||||
| Other items | — | 6 | — | (4) | ||||||||||||||||||||||
| Non-operating pension expense | (49) | (47) | (48) | (48) | ||||||||||||||||||||||
| Total | $ | (95) | $ | (29) | $ | 69 | $ | 96 | ||||||||||||||||||
(b) Includes equity earnings from our Ilim equity method investment for the full year. Also includes a charge of $533 million for the three months ended December 31, 2022 related to the impairment of our equity method investment in connection with the announced plan to sell our interest in the Ilim joint venture.
(c) Includes the following tax expenses (benefits):
| 2022 | |||||||||||||||||||||||
| In millions | Q1 | Q2 | Q3 | Q4 | |||||||||||||||||||
| Tax benefit related to timber monetization settlement | $ | — | $ | — | $ | (604) | $ | — | |||||||||||||||
| Tax benefit related to exchange of Sylvamo shares | — | (31) | (35) | — | |||||||||||||||||||
| Tax impact of other special items | 11 | (4) | (29) | (15) | |||||||||||||||||||
| Foreign deferred tax valuation allowance | — | — | — | 45 | |||||||||||||||||||
| Tax impact of non-operating pension expense | 12 | 12 | 12 | 12 | |||||||||||||||||||
| Total | $ | 23 | $ | (23) | $ | (656) | $ | 42 |
(d) Includes the following pre-tax charges (gains):
| 2021 | ||||||||||||||||||||||||||
| In millions | Q1 | Q2 | Q3 | Q4 | ||||||||||||||||||||||
| Debt extinguishment costs | $ | 18 | $ | 170 | $ | 35 | $ | 238 | ||||||||||||||||||
| EMEA Packaging business optimization | 12 | — | — | — | ||||||||||||||||||||||
| Building a Better IP | — | — | — | 29 | ||||||||||||||||||||||
| Legal reserve adjustment | — | — | — | (5) | ||||||||||||||||||||||
| Environmental remediation reserve adjustment | — | 5 | 5 | — | ||||||||||||||||||||||
| Gain on sale of equity investment in Graphic Packaging | (74) | (130) | — | — | ||||||||||||||||||||||
| EMEA Packaging impairment - Turkey | 2 | (9) | — | — | ||||||||||||||||||||||
| Sylvamo investment - fair value adjustment | — | — | — | 32 | ||||||||||||||||||||||
| Real estate - office impairment | — | 21 | — | — | ||||||||||||||||||||||
| Other items | — | 11 | 9 | 1 | ||||||||||||||||||||||
| Non-operating pension expense | (52) | (51) | (50) | (47) | ||||||||||||||||||||||
| Total | $ | (94) | $ | 17 | $ | (1) | $ | 248 | ||||||||||||||||||
(e) Includes the operating earnings of the Printing Papers business and equity earnings from our Ilim equity method investment for the full year. Also includes the following charges (gains):
| 2021 | |||||||||||||||||||||||
| In millions | Q1 | Q2 | Q3 | Q4 | |||||||||||||||||||
| Printing Papers spin-off expenses | $ | 20 | $ | 20 | $ | 47 | $ | 5 | |||||||||||||||
| Gain on sale of Kwidzyn, Poland mill | — | — | (350) | 6 | |||||||||||||||||||
| Gain on sale of La Mirada, CA distribution center | — | — | (65) | — | |||||||||||||||||||
| Foreign value-added tax credit | — | (47) | 10 | — | |||||||||||||||||||
| Foreign and state taxes related to spin-off of Printing Papers business | — | — | 27 | (3) | |||||||||||||||||||
| Non-operating pension expense | (1) | (1) | — | — | |||||||||||||||||||
| Total | $ | 19 | $ | (28) | $ | (331) | $ | 8 |
(f) Includes the following tax expenses (benefits):
| 2021 | |||||||||||||||||||||||
| In millions | Q1 | Q2 | Q3 | Q4 | |||||||||||||||||||
| Tax impact of other special items | $ | 12 | $ | (14) | $ | (12) | $ | (73) | |||||||||||||||
| Tax impact of non-operating pension expense | 13 | 13 | 12 | 11 | |||||||||||||||||||
| Total | $ | 25 | $ | (1) | $ | — | $ | (62) |
(g) Includes the allocation of income to noncontrolling interest of $1 million for the three months ended June 30, 2021 related to the gain on the sale of our EMEA Packaging business in Turkey.
ITEM 9. CHANGES IN AND DISAGREEMENTS WITH ACCOUNTANTS ON ACCOUNTING AND FINANCIAL DISCLOSURE
None.
ITEM 9A. CONTROLS AND PROCEDURES
As of December 31, 2022, an evaluation was carried out under the supervision and with the participation of the Company’s management, including our principal executive officer and principal financial officer, of the effectiveness of our disclosure controls and procedures (as that term is defined in Rule 13a-15(f) and 15d-15(f) of the Exchange Act). Based upon this evaluation, our principal executive officer and principal financial officer have concluded that the Company’s disclosure controls and procedures were effective as of December 31, 2022.
CHANGES IN INTERNAL CONTROL OVER FINANCIAL REPORTING
There have been no changes in our internal control over financial reporting during the quarter ended December 31, 2022, that have materially affected, or are reasonably likely to materially affect, our internal control over financial reporting.
See Item 8. Financial Statements and Supplementary Data on pages 43 and 44 of this Form 10-K for management's annual report on our internal control over financial reporting and the attestation report of our independent public accounting firm.
None.
ITEM 9C. DISCLOSURE REGARDING FOREIGN JURISDICTIONS THAT PREVENT INSPECTIONS
None.
ITEM 10. DIRECTORS, EXECUTIVE OFFICERS AND CORPORATE GOVERNANCE
Information concerning our directors is hereby incorporated by reference to our definitive proxy statement that will be filed with the Securities and Exchange Commission ("SEC") within 120 days of the close of our fiscal year. The Audit and Finance Committee of the Board of Directors has at least one member who is a financial expert, as that term is defined in Item 401(d)(5) of Regulation S-K. Further information concerning the composition of the Audit and Finance Committee and our audit committee financial experts is hereby incorporated by reference to our definitive proxy statement that will be filed with the SEC within 120 days of the close of our fiscal year. Information with respect to our executive officers is set forth on pages 7 and 8 in Part I of this Form 10-K under the caption, “Information About Our Executive Officers.”
Executive officers of International Paper are elected to hold office until the next annual meeting of the Board of Directors following the annual meeting of shareholders and, until the election of successors, subject to removal by the Board.
The Company’s Code of Business Ethics (Code) is applicable to all employees of the Company, including the chief executive officer and senior financial officers, as well as the Board of Directors. We disclose any amendments to our Code and any waivers from a provision of our Code granted to our directors, chief executive officer and senior financial officers on our website within four business days following such amendment or waiver. To date, no waivers of the Code have been granted.
We make available free of charge on our website at www.internationalpaper.com, and in print to any shareholder who requests them, our Corporate Governance Principles, our Code of Business Ethics and the Charters of our Audit and Finance Committee, Management Development and Compensation Committee, Governance Committee and Public Policy and Environment Committee. Requests for copies may be directed to the corporate secretary at our corporate headquarters.
Information with respect to compliance with Section 16(a) of the Exchange Act and our corporate governance is hereby incorporated by reference to our definitive proxy statement that will be filed with the SEC within 120 days of the close of our fiscal year.
ITEM 11. EXECUTIVE COMPENSATION
Information with respect to the compensation of executives and directors of the Company is hereby incorporated by reference to our definitive proxy statement that will be filed with the SEC within 120 days of the close of our fiscal year.
A description of the security ownership of certain beneficial owners and management and equity compensation plan information is hereby incorporated by reference to our definitive proxy statement that will be filed with the SEC within 120 days of the close of our fiscal year.
ITEM 13. CERTAIN RELATIONSHIPS AND RELATED TRANSACTIONS, AND DIRECTOR INDEPENDENCE
A description of applicable information with respect to certain relationships and related transactions and director independence matters, is hereby incorporated by reference to our definitive proxy statement that will be filed with the SEC within 120 days of the close of our fiscal year.
ITEM 14. PRINCIPAL ACCOUNTING FEES AND SERVICES
Information with respect to fees paid to, and services rendered by, our independent registered public accounting firm, and our policies and procedures for pre-approving those services, is hereby incorporated by reference to our definitive proxy statement that will be filed with the SEC within 120 days of the close of our fiscal year.
ITEM 15. EXHIBITS AND FINANCIAL STATEMENT SCHEDULES
(1)Financial Statements – See Item 8. Financial Statements and Supplementary Data.
(2)Financial Statement Schedules – The following additional financial data should be read in conjunction with the consolidated financial statements in Item 8. Financial Statements and Supplementary Data. Schedules not included with this additional financial data have been omitted because they are not applicable, or the required information is shown in the consolidated financial statements or the notes thereto.
2022, 2021 and 2020
| (101.INS) | XBRL Instance Document - the instance document does not appear in the Interactive Data File because its XBRL tags are embedded within the inline XBRL document. * | ||||
| (101.SCH) | XBRL Taxonomy Extension Schema * | ||||
| (101.CAL) | XBRL Taxonomy Extension Calculation Linkbase * | ||||
| (101.DEF) | XBRL Taxonomy Extension Definition Linkbase * | ||||
| (101.LAB) | XBRL Taxonomy Extension Label Linkbase * | ||||
| (101.PRE) | XBRL Extension Presentation Linkbase * | ||||
| (104) | Cover Page Interactive Data File (formatted as Inline XBRL, and contained in Exhibit 101. * |
+ Management contract or compensatory plan or arrangement.
** Filed herewith*
*** Furnished herewith*
† Confidential treatment has been granted for certain information pursuant to Rule 24b-2 under the Securities Act of 1934, as amended.
None.
Pursuant to the requirements of Section 13 or 15(d) of the Securities Exchange Act of 1934, the Registrant has duly caused this report to be signed on its behalf by the undersigned, thereunto duly authorized.
INTERNATIONAL PAPER COMPANY
| By: | /S/ JOSEPH R. SAAB | February 17, 2023 | |||||||||
| Joseph R. Saab | |||||||||||
| Senior Vice President, General Counsel and Corporate Secretary |
POWER OF ATTORNEY
KNOW ALL MEN BY THESE PRESENTS, that each person whose signature appears below constitutes and appoints Timothy S. Nicholls, Joseph R. Saab and Amy M. Beeson as his or her true and lawful attorney-in-fact and agent, acting alone, with full power of substitution and resubstitution for him or her and in his or her name, place and stead, in any and all capacities, to sign any or all amendments to this annual report on Form 10-K, and to file the same, with all exhibits thereto and other documents in connection therewith, with the Securities and Exchange Commission, granting unto said attorney-in-fact full power and authority to do and perform each and every act and thing requisite or necessary to be done, hereby ratifying and confirming all that said attorney-in-fact and agent, or his or her substitute or substitutes, may lawfully do or cause to be done by virtue hereof.
Pursuant to the requirements of the Securities Exchange Act of 1934, this report has been signed below by the following persons on behalf of the registrant and in the capacities and on the dates indicated:
| Signature | Title | Date | ||||||||||||
| /S/ MARK S. SUTTON | Chairman of the Board & Chief Executive Officer and Director | February 17, 2023 | ||||||||||||
| Mark S. Sutton | ||||||||||||||
| /S/ CHRISTOPHER M. CONNOR | Director | February 17, 2023 | ||||||||||||
| Christopher M. Connor | ||||||||||||||
| /S/ AHMET C. DORDUNCU | Director | February 17, 2023 | ||||||||||||
| Ahmet C. Dorduncu | ||||||||||||||
| /S/ ILENE S. GORDON | Director | February 17, 2023 | ||||||||||||
| Ilene S. Gordon | ||||||||||||||
| /S/ ANDERS GUSTAFSSON | Director | February 17, 2023 | ||||||||||||
| Anders Gustafsson | ||||||||||||||
| /S/ JACQUELINE C. HINMAN | Director | February 17, 2023 | ||||||||||||
| Jacqueline C. Hinman |
| /s/ CLINTON A. LEWIS, JR. | Director | February 17, 2023 | ||||||||||||
| Clinton A. Lewis, Jr. | ||||||||||||||
| /s/ DONALD G. (DG) MACPHERSON | Director | February 17, 2023 | ||||||||||||
| Donald G. (DG) Macpherson | ||||||||||||||
| /s/ KATHRYN D. SULLIVAN | Director | February 17, 2023 | ||||||||||||
| Kathryn D. Sullivan | ||||||||||||||
| /s/ ANTON V. VINCENT | Director | February 17, 2023 | ||||||||||||
| Anton V. Vincent | ||||||||||||||
| /S/ RAY G. YOUNG | Director | February 17, 2023 | ||||||||||||
| Ray G. Young | ||||||||||||||
| /S/ TIMOTHY S. NICHOLLS | Senior Vice President and Chief Financial Officer | February 17, 2023 | ||||||||||||
| Timothy S. Nicholls | ||||||||||||||
| /S/ HOLLY G. GOUGHNOUR | Vice President – Finance and Corporate Controller | February 17, 2023 | ||||||||||||
| Holly G. Goughnour |
2022 LISTING OF FACILITIES
(all facilities are owned except noted otherwise)
| INDUSTRIAL PACKAGING | Modesto, California | Fridley, Minnesota | ||||||||||||
| Ontario, California | Minneapolis, Minnesota leased | |||||||||||||
| Containerboard | Salinas, California | Shakopee, Minnesota | ||||||||||||
| U.S.: | Sanger, California | White Bear Lake, Minnesota | ||||||||||||
| Pine Hill, Alabama | Santa Fe Springs, California (2 locations) | Houston, Mississippi | ||||||||||||
| Prattville, Alabama | Tracy, California | Jackson, Mississippi | ||||||||||||
| Selma, Alabama (Riverdale Mill) | Golden, Colorado | Magnolia, Mississippi leased | ||||||||||||
| Cantonment, Florida (Pensacola Mill) | Wheat Ridge, Colorado | Olive Branch, Mississippi | ||||||||||||
| Rome, Georgia | Putnam, Connecticut | Fenton, Missouri | ||||||||||||
| Savannah, Georgia | Orlando, Florida | Kansas City, Missouri (2 locations) | ||||||||||||
| Cayuga, Indiana | Plant City, Florida | Maryland Heights, Missouri | ||||||||||||
| Cedar Rapids, Iowa | Tampa, Florida leased | North Kansas City, Missouri leased | ||||||||||||
| Henderson, Kentucky | Columbus, Georgia | St. Joseph, Missouri | ||||||||||||
| Maysville, Kentucky | Forest Park, Georgia | St. Louis, Missouri | ||||||||||||
| Bogalusa, Louisiana | Griffin, Georgia | Omaha, Nebraska | ||||||||||||
| Campti, Louisiana | Lithonia, Georgia | McCarran, Nevada | ||||||||||||
| Mansfield, Louisiana | Savannah, Georgia | Barrington, New Jersey | ||||||||||||
| Vicksburg, Mississippi | Tucker, Georgia | Bellmawr, New Jersey | ||||||||||||
| Valliant, Oklahoma | Aurora, Illinois (3 locations) | Milltown, New Jersey | ||||||||||||
| Springfield, Oregon | Bedford Park, Illinois (2 locations) 1 leased | Spotswood, New Jersey | ||||||||||||
| Orange, Texas | Belleville, Illinois | Thorofare, New Jersey | ||||||||||||
| Carol Stream, Illinois | Binghamton, New York | |||||||||||||
| International: | Des Plaines, Illinois | Buffalo, New York | ||||||||||||
| Veracruz, Mexico | Lincoln, Illinois | Rochester, New York | ||||||||||||
| Kenitra, Morocco | Montgomery, Illinois | Scotia, New York | ||||||||||||
| Madrid, Spain | Northlake, Illinois | Utica, New York | ||||||||||||
| Rockford, Illinois | Charlotte, North Carolina (2 locations) 1 leased | |||||||||||||
| Corrugated Packaging | Butler, Indiana | Lumberton, North Carolina | ||||||||||||
| U.S.: | Crawfordsville, Indiana | Manson, North Carolina | ||||||||||||
| Bay Minette, Alabama | Fort Wayne, Indiana | Newton, North Carolina | ||||||||||||
| Decatur, Alabama | Indianapolis, Indiana (3 locations) | Statesville, North Carolina | ||||||||||||
| Dothan, Alabama leased | Saint Anthony, Indiana | Byesville, Ohio | ||||||||||||
| Huntsville, Alabama | Tipton, Indiana | Delaware, Ohio | ||||||||||||
| Conway, Arkansas | Cedar Rapids, Iowa | Eaton, Ohio | ||||||||||||
| Fort Smith, Arkansas (2 locations) | Waterloo, Iowa | Madison, Ohio | ||||||||||||
| Russellville, Arkansas (2 locations) | Garden City, Kansas | Marion, Ohio | ||||||||||||
| Tolleson, Arizona | Bowling Green, Kentucky | Marysville, Ohio leased | ||||||||||||
| Yuma, Arizona | Lexington, Kentucky | Middletown, Ohio | ||||||||||||
| Anaheim, California | Louisville, Kentucky | Mt. Vernon, Ohio | ||||||||||||
| Buena Park, California leased | Walton, Kentucky | Newark, Ohio | ||||||||||||
| Camarillo, California | Bogalusa, Louisiana | Streetsboro, Ohio | ||||||||||||
| Carson, California | Lafayette, Louisiana | Wooster, Ohio | ||||||||||||
| Cerritos, California leased | Shreveport, Louisiana | Oklahoma City, Oklahoma | ||||||||||||
| Compton, California | Springhill, Louisiana | Beaverton, Oregon (3 locations) | ||||||||||||
| Elk Grove, California | Auburn, Maine | Hillsboro, Oregon | ||||||||||||
| Exeter, California | Three Rivers, Michigan | Portland, Oregon | ||||||||||||
| Gilroy, California (2 locations) | Arden Hills, Minnesota | Salem, Oregon leased | ||||||||||||
| Los Angeles, California | Austin, Minnesota | Atglen, Pennsylvania |
A-1
| Biglerville, Pennsylvania (2 locations) | Puebla, Mexico leased | Bags | ||||||||||||
| Eighty-four, Pennsylvania | Reynosa, Mexico | U.S.: | ||||||||||||
| Hazleton, Pennsylvania | San Jose Iturbide, Mexico | Buena Park, California | ||||||||||||
| Kennett Square, Pennsylvania | Santa Catarina, Mexico | Beaverton, Oregon | ||||||||||||
| Lancaster, Pennsylvania | Silao, Mexico | Grand Prairie, Texas | ||||||||||||
| Mount Carmel, Pennsylvania | Toluca, Mexico | |||||||||||||
| Georgetown, South Carolina | Zapopan, Mexico | GLOBAL CELLULOSE FIBERS | ||||||||||||
| Laurens, South Carolina | Agadir, Morocco | |||||||||||||
| Lexington, South Carolina | Casablanca, Morocco | Pulp | ||||||||||||
| Ashland City, Tennessee leased | Tangier, Morocco | U.S.: | ||||||||||||
| Cleveland, Tennessee | Ovar, Portugal | Cantonment, Florida (Pensacola Mill) | ||||||||||||
| Elizabethton, Tennessee leased | Barcelona, Spain | Flint River, Georgia | ||||||||||||
| Morristown, Tennessee | Bilbao, Spain | Port Wentworth, Georgia | ||||||||||||
| Murfreesboro, Tennessee | Gandia, Spain | Columbus, Mississippi | ||||||||||||
| Amarillo, Texas | Grinon, Spain | New Bern, North Carolina | ||||||||||||
| Carrollton, Texas (2 locations) | Las Palmas, Spain | Riegelwood, North Carolina | ||||||||||||
| Edinburg, Texas | Madrid, Spain | Georgetown, South Carolina | ||||||||||||
| El Paso, Texas | Montblanc, Spain | Franklin, Virginia | ||||||||||||
| Ft. Worth, Texas leased | Tavernes de la Valldigna, Spain | |||||||||||||
| Grand Prairie, Texas | Tenerife, Spain | International: | ||||||||||||
| Hidalgo, Texas | Valls, Spain | Grande Prairie, Alberta, Canada | ||||||||||||
| McAllen, Texas | Gdansk, Poland | |||||||||||||
| San Antonio, Texas (2 locations) | Recycling | |||||||||||||
| Sealy, Texas | U.S.: | DISTRIBUTION | ||||||||||||
| Waxahachie, Texas | Phoenix, Arizona | |||||||||||||
| Lynchburg, Virginia | Fremont, California | International: | ||||||||||||
| Petersburg, Virginia | Norwalk, California | Guangzhou, China leased | ||||||||||||
| Richmond, Virginia | West Sacramento, California | Hong Kong, China leased | ||||||||||||
| Moses Lake, Washington | Itasca, Illinois | Shanghai, China leased | ||||||||||||
| Olympia, Washington | Des Moines, Iowa | Japan leased | ||||||||||||
| Yakima, Washington | Wichita, Kansas | Korea leased | ||||||||||||
| Fond du Lac, Wisconsin | Roseville, Minnesota | Singapore leased | ||||||||||||
| Manitowoc, Wisconsin | Omaha, Nebraska | |||||||||||||
| Charlotte, North Carolina | ||||||||||||||
| International: | Beaverton, Oregon | |||||||||||||
| Rancagua, Chile | Springfield, Oregon leased | |||||||||||||
| Cabourg, France | Carrollton, Texas | |||||||||||||
| Chalon-sur-Saone, France | Salt Lake City, Utah | |||||||||||||
| LePuy, France (Espaly Box Plant) | Richmond, Virginia | |||||||||||||
| Mortagne, France | Kent, Washington | |||||||||||||
| Saint Amand, France | ||||||||||||||
| Bellusco, Italy | International: | |||||||||||||
| Catania, Italy | Monterrey, Mexico leased | |||||||||||||
| Pomezia, Italy | Xalapa, Veracruz, Mexico leased | |||||||||||||
| San Felice, Italy | ||||||||||||||
| Apodaco (Monterrey), Mexico leased | ||||||||||||||
| Ixtaczoquitlan, Mexico | ||||||||||||||
| Juarez, Mexico leased (2 locations) | ||||||||||||||
| Los Mochis, Mexico | ||||||||||||||
A-2
2022 CAPACITY INFORMATION
| (in thousands of short tons except as noted) | U.S. | EMEA | Americas, other than U.S. | Total | |||||||||||||||||||||||||
| Industrial Packaging | |||||||||||||||||||||||||||||
| Containerboard (a) | 13,823 | 524 | 27 | 14,374 | |||||||||||||||||||||||||
| Global Cellulose Fibers | |||||||||||||||||||||||||||||
| Dried Pulp (in thousands of metric tons) | 2,963 | — | 388 | 3,351 | |||||||||||||||||||||||||
(a) In addition to Containerboard, this also includes saturated kraft, kraft bag, and gypsum.
A-3
Previous: Cover and table of contents