 filings.tools
International Paper 10-K 2023-12-31
Filed 2024-02-16. 2 sections, 496K characters. Original on sec.gov · Markdown · JSON
Cover and table of contents
UNITED STATES
SECURITIES AND EXCHANGE COMMISSION
WASHINGTON, D.C. 20549
FORM 10-K
| ☒ | ANNUAL REPORT PURSUANT TO SECTION 13 OR 15(d) OF THE SECURITIES EXCHANGE ACT OF 1934 | |||||||
| For the fiscal year ended | ||||||||
| 12/31/2023 | ||||||||
| or | ||||||||
| ☐ | TRANSITION REPORT PURSUANT TO SECTION 13 OR 15(d) OF THE SECURITIES EXCHANGE ACT OF 1934 | |||||||
| For the transition period from - to - |
Commission File No. 1-3157
INTERNATIONAL PAPER COMPANY
(Exact name of registrant as specified in its charter)
| New York | 13-0872805 | |||||||
| (State or other jurisdiction of incorporation or organization) | (I.R.S. Employer Identification No.) |
| 6400 Poplar Avenue | |||||||||||
| Memphis, | Tennessee | ||||||||||
| (Address of principal executive offices) | |||||||||||
| 38197 | |||||||||||
| (Zip Code) | |||||||||||
| Registrant's telephone number, including area code: | 901 | 419-9000 |
Securities registered pursuant to Section 12(b) of the Act:
| Title of each class | Trading symbol(s) | Name of each exchange on which registered | ||||||
| Common Shares | IP | New York Stock Exchange |
Securities Registered Pursuant to Section 12(g) of the Act: None
Indicate by check mark if the registrant is a well-known seasoned issuer, as defined in Rule 405 of the Securities Act.
Yes ý No ¨
Indicate by check mark if the registrant is not required to file reports pursuant to Section 13 or Section 15(d) of the Act.
Yes ¨ No ý
Indicate by check mark whether the registrant (1) has filed all reports required to be filed by Section 13 or 15(d) of the Securities Exchange Act of 1934 during the preceding 12 months (or for such shorter period that the registrant was required to file such reports), and (2) has been subject to such filing requirements for the past 90 days. Yes ý No ¨
Indicate by check mark whether the registrant has submitted electronically every Interactive Data File required to be submitted pursuant to Rule 405 of Regulation S-T (section 232.405 of this chapter) during the preceding 12 months (or for such shorter period that the registrant was required to submit such files). Yes ý No ¨
Indicate by check mark whether the registrant is a large accelerated filer, an accelerated filer, a non-accelerated filer, a smaller reporting company or an emerging growth company. See definitions of “large accelerated filer,” “accelerated filer,” “smaller reporting company,” and "emerging growth company" in Rule 12b-2 of the Exchange Act.
| Large accelerated filer | Accelerated filer | Non-accelerated filer | Smaller reporting company | Emerging growth company | ||||||||||||||||||||||
| ☒ | ☐ | ☐ | ☐ | ☐ |
If an emerging growth company, indicate by check mark if the registrant has elected not to use the extended transition period for complying with any new or revised financial accounting standards provided pursuant to Section 13 (a) of the Exchange Act. o
Indicate by check mark whether the registrant has filed a report on and attestation to its management's assessment of the effectiveness of its internal control over financial reporting under Section 404(b) of the Sarbanes-Oxley Act (15 U.S.C. 7262(b)) by the registered public accounting firm that prepared or issued its audit report. ☒
Indicate by check mark whether the registrant is a shell company (as defined in Rule 12b-2 of the Act). Yes ☐ No ý
If securities are registered pursuant to Section 12(b) of the Act, indicate by check mark whether the financial statements of the registrant included in the filing reflect the correction of an error to previously issued financial statements. ☐
Indicate by check mark whether any of those error corrections are restatements that required a recovery analysis of incentive-based compensation received by any of the registrant’s executive officers during the relevant recovery period pursuant to §240.10D-1(b). ¨
The aggregate market value of the Company’s outstanding common stock held by non-affiliates of the registrant, computed by reference to the closing price as reported on the New York Stock Exchange, as of the last business day of the registrant’s most recently completed second fiscal quarter (June 30, 2023) was approximately $10,960,397,116.
The number of shares outstanding of the Company’s common stock as of February 9, 2024 was 346,353,824.
Documents incorporated by reference:
Portions of the registrant’s proxy statement filed within 120 days of the close of the registrant’s fiscal year in connection with registrant’s 2024 annual meeting of shareholders are incorporated by reference into Part III of this Form 10-K.
INTERNATIONAL PAPER COMPANY
INDEX TO ANNUAL REPORT ON FORM 10-K
FOR THE YEAR ENDED DECEMBER 31, 2023
| PART I. | 1 | |||||||
| ITEM 1. | BUSINESS. | 1 | ||||||
| General | 1 | |||||||
| Human Capital | 2 | |||||||
| Competition and Costs | 4 | |||||||
| Marketing and Distribution | 5 | |||||||
| Description of Principal Products | 5 | |||||||
| Sales Volumes by Product | 5 | |||||||
| Government Regulation | 5 | |||||||
| Environmental Protection | 5 | |||||||
| Climate Change | 6 | |||||||
| Raw Materials | 9 | |||||||
| Information About Our Executive Officers | 9 | |||||||
| Forward-looking Statements | 10 | |||||||
| ITEM 1A. | RISK FACTORS. | 11 | ||||||
| ITEM 1B. | **[UNRESOLVED STAFF COMMENTS.](#i70edb4f26fa942c5bf19ab3232f |
Showing the first 8K of 142K characters. Open the full section
Item 5. MARKET FOR REGISTRANT’S COMMON EQUITY, RELATED STOCKHOLDER MATTERS AND ISSUER PURCHASES OF EQUITY SECURITIES
As of the filing of this Annual Report on Form 10-K, the Company’s common shares are traded on the New York Stock Exchange (NYSE: IP). As of February 9, 2024, there were approximately 8,188 record holders of common stock of the Company.
We pay regular quarterly cash dividends and expect to continue to pay regular quarterly cash dividends in the foreseeable future, though each quarterly dividend payment is subject to review and approval by our Board of Directors.
The table below presents information regarding the Company’s purchases of its equity securities for the time periods presented.
PURCHASES OF EQUITY SECURITIES BY THE ISSUER AND AFFILIATED PURCHASERS.
| Period | Total Number of Shares Purchased (a) | Average Price Paid per Share | Total Number of Shares (or Units) Purchased as Part of Publicly Announced Programs | Maximum Number (or Approximate Dollar Value) of Shares that May Yet Be Purchased Under the Plans or Programs (in billions) | ||||||||||
| October 1, 2023 - October 31, 2023 | 5,373 | $ | 35.19 | — | $ | 2.96 | ||||||||
| November 1, 2023 - November 30, 2023 | 3,992 | 33.71 | — | 2.96 | ||||||||||
| December 1, 2023 - December 31, 2023 | 1,241 | 38.82 | — | 2.96 | ||||||||||
| Total | 10,606 |
*(a)*10,606 shares were acquired from employees or members of our Board of Directors as a result of share withholdings to pay income taxes under the Company's restricted stock program. On October 11, 2022, our Board of Directors increased the authorization up to a total of $3.35 billion shares. This repurchase program does not have an expiration date. As of December 31, 2023, approximately $2.96 billion aggregate shares of our common stock remained authorized for repurchase.
PERFORMANCE GRAPH
The performance graph shall not be deemed "soliciting material" or to be "filed" with the Commission or subject to Regulation 14A or 14C under, or to the liabilities of Section 18 of the Securities Exchange Act of 1934, as amended, (the "Exchange Act") and will not be deemed to be incorporated by reference into any filing of the Company under the Securities Act of 1933, as amended, or the Exchange Act, except to the extent
the Company specifically incorporates it by reference into such a filing.
The following line graph compares a $100 investment in Company stock on December 31, 2018 with a $100 investment in our peer group and the S&P Composite-500 Stock Index (S&P 500 Index) also made at market close on December 31, 2018. The graph portrays total return, 2018-2023, assuming reinvestment of all dividends.
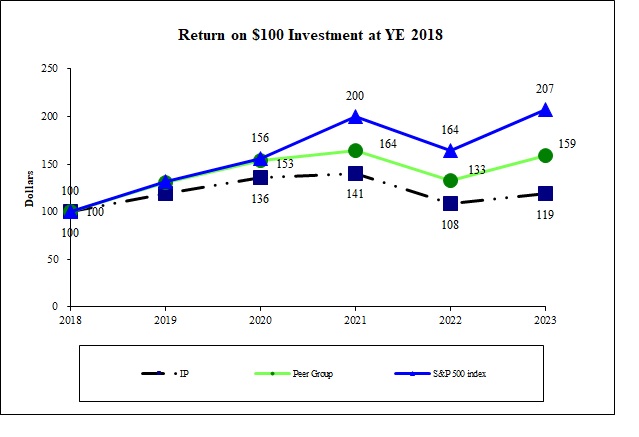
1)The companies included in the peer group are DS Smith PLC, Klabin S.A., Mondi Group, Packaging Corporation of America, Smurfit Kappa Group, Stora Enso Group, and WestRock Company.
2)Returns are calculated in $USD.
ITEM 7. MANAGEMENT’S DISCUSSION AND ANALYSIS OF FINANCIAL CONDITION AND RESULTS OF OPERATIONS
The following discussion and analysis of our financial condition and results of operations should be read in conjunction with our consolidated financial statements and related notes included in “Financial Statements
and Supplementary Data” of this Annual Report on Form 10-K. In addition to historical consolidated financial information, the following discussion contains forward-looking statements that reflect our plans, estimates, and beliefs that involve significant risks and uncertainties. Our actual results could differ materially from those discussed in the forward-looking statements. Factors that could cause or contribute to those differences include those discussed below and elsewhere in this Annual Report on Form 10-K,
particularly in “Risk Factors” and “Forward-Looking Statements.”
The following generally discusses 2023 and 2022 items and year-to-year comparisons between 2023 and 2022. Discussion of historical items in 2021, and year-to-year comparisons between 2022 and 2021, can be found in our Annual Report on Form 10-K for the fiscal year ended December 31, 2022, filed with the SEC on February 17, 2023, under Part II, Item 7, Management’s Discussion and Analysis of Financial Condition and Results of Operations.
Full-year 2023 net earnings attributable to shareholders were $288 million ($0.82 per diluted share) compared with $1.5 billion ($4.10 per diluted share) for full-year 2022.
During 2023, International Paper executed well, both commercially and operationally, as we navigated an uncertain and challenging demand environment. During much of the year, underlying demand for our products was lower as consumers prioritized spending on services and essential goods. This trend was influenced by the pull forward of goods during the pandemic, as well as by inflationary pressures and rising interest rates that impacted the consumer. Demand for our products was further constrained by inventory destocking as our customers, and the broader supply chain, worked through elevated inventories of their products. The lower demand combined with declining sales prices and continued cost inflation resulted in lower sales and earnings in 2023 as compared to 2022. During 2023, we remained focused on mitigating the impact of these challenges through commercial and cost reduction initiatives. We advanced our strategies to improve profitability across our portfolio by investing in capabilities in our Industrial Packaging business to enhance our value proposition to align with customer needs and optimizing our Global Cellulose Fibers business by reducing our exposure to commodity pulp. We took strategic actions to structurally reduce fixed costs in our mill system in both our Industrial Packaging and Global Cellulose Fibers businesses. We also made significant progress in Building a Better IP, driven by commercial and process improvement initiatives, resulting in benefits exceeding our 2023 target. Regarding capital allocation in 2023, we returned approximately $840 million to shareowners including approximately $640 million of dividends and $200 million of share repurchases. Finally, during 2023, we completed the sale of our ownership stake in Ilim for $508 million. International Paper no longer has investments in Russia following completion of this sale.
Comparing 2023 performance to 2022, price and mix was lower in our North American Industrial Packaging business due to prior index movements, lower export prices and higher export mix, as demand improved. Price in our Global Cellulose Fibers business was lower due to prior index movements and an unfavorable mix driven by lower absorbent pulp shipments. Volume in both business segments was impacted by ongoing inventory destocking across the supply chain. While there was demand recovery in the second half of the year in both business segments, volume was lower in our North American Industrial Packaging business as consumers shifted priorities toward non-discretionary goods and services while dealing with inflation. Volume in our Global Cellulose Fibers business was also impacted by lower demand as a result of the slowdown in the global economy. Operations and costs in both the North American Industrial Packaging and Global Cellulose Fibers businesses were higher reflecting the impact of inflation on materials and services along with the impact of higher unabsorbed costs resulting from increased economic downtime in the current year. Planned maintenance outage costs were lower in our North American Industrial Packaging business while higher in our Global Cellulose Fib
Showing the first 8K of 354K characters. Open the full section