 filings.tools
Illinois Tool Works (ITW) 10-K risk factor changes: FY2015 vs FY2014
The 2015-12-31 10-K against the 2014-12-31 one, compared heading by heading and sentence by sentence. One of these filings carries no fiscal year tag, so its year is the calendar year of the period end.
Item 1A13 rewritten9 added2 removed109 unchanged
All filing items998 rewritten787 added635 removed1,390 unchanged
Summary
counted, not written
- Item 1A headings could not be compared: only 0 carried over between the two years, which usually means one filing was read wrongly, so none is reported as new or removed.
- Sentence by sentence, 787 added, 635 removed, 998 rewritten and 1,390 unchanged across 16 items that differ.
Sentences by item
21 items, with every count and a link to each item that changed
Underlined words on a shaded ground are new in FY2015; struck-through words were in FY2014. Sentences that are wholly new or wholly gone are labelled rather than marked.
Item 1A. Risk Factors
13 rewritten, 9 added, 2 removed, 109 unchanged
Slower economic growth, financial market instability, high unemployment, government deficit reduction, sequestration and other austerity measures impacting the markets we serve can adversely affect the Company’s businesses by reducing demand for the Company's products and services, limiting financing available to the Company's customers, increasing order cancellations and the difficulty in [added: collecting accounts receivable, increasing price competition, and increasing the risk that counterparties to the Company's contractual arrangements will become insolvent or otherwise unable to fulfill their obligations.]
The timing and amount of benefits from the Company’s [removed: 2013 - 2017] enterprise initiatives may not be as expected and the Company's financial results could be adversely impacted.
The Company’s [removed: 2013 - 2017] enterprise strategy and associated initiatives include portfolio management, business structure simplification and strategic sourcing.
The portfolio management initiative, which included divesting businesses no longer aligned with the Company’s long-term objectives, is essentially complete; however, product line [removed: simplification] and customer base simplification, which is a core element of the Company’s 80/20 [removed: business] [added: management] process, is being reapplied to the Company’s scaled up operating divisions and remains an active element of this initiative.
Although these activities are expected to improve future operating margins and organic revenue growth, they [removed: may] [added: are also expected to] have a negative impact on the Company’s overall organic revenue growth in the short term.
[removed: The] [added: In addition, the] Company [removed: has made significant progress on] [added: continues to seek to benefit from] its [removed: business structure simplification] [added: size] and [added: scale in the procurement process through its] strategic sourcing initiatives, [removed: but scaling up of smaller businesses into larger businesses] and [added: the] leveraging [added: of] purchasing power across businesses involves some execution risk.
The Company funds its share repurchases with free [removed: operating] cash flow and short-term borrowings.
Any such improper actions could subject the Company to civil or criminal investigations, [added: could lead to substantial civil or criminal monetary and non-monetary penalties against the Company or its subsidiaries, or could damage its reputation.]
Significant long-term fluctuations in relative currency values, and in particular, an increase in the value of the U.S. Dollar against foreign currencies, [added: has had and] could have an adverse effect on profitability and financial condition.
Due to pricing pressure or other factors, the Company may not be able to pass along increased raw material and components parts [removed: prices to its customers in the form of price increases or its ability to do so could be delayed.]
The Company's effective tax rate could be adversely affected by changes in the mix of earnings among countries with differing statutory tax rates, changes in the valuation allowance of deferred tax assets or [added: changes in] tax laws.
Forward-looking statements may be identified by the use of words such as "believe," "expect," "plans," "intends," "may," "strategy," "prospects," "estimate," "project," "target," "anticipate," "guidance," "forecast," and other similar words, including, without limitation, statements regarding the expected acquisition or disposition of businesses, economic conditions in various geographic regions, the timing and amount of share repurchases, the Company's Enterprise Strategy and its ability to manage its strategic business initiatives and the timing and amount of benefits therefrom, the adequacy of internally generated funds and credit [removed: facilities,] [added: facilities to service debt and finance] the [removed: ability] [added: Company's capital allocation priorities, the sufficiency of U.S. generated cash] to fund [removed: debt service obligations,] [added: cash requirements in] the [added: U.S., the] cost and availability of additional financing, the Company's portion of future benefit payments related to pension and postretirement benefits, the availability of raw materials and energy, the expiration of any one of the Company's patents, the cost of compliance with environmental regulations, the likelihood of future goodwill or intangible asset impairment charges, the impact of failure of the Company's employees to comply with applicable laws and regulations, the impact of foreign currency fluctuations, the outcome of outstanding legal proceedings, the impact of adopting new accounting pronouncements, and the [removed: estimated timing and amount related to the resolution of tax matters.]
[removed: Shareholders] [added: Investors] should not assume that ITW agrees with any statement or report issued by any analyst irrespective of the content of the statement or report.
The Company's business structure simplification initiative is also essentially completed, although efforts to realize efficiencies in structure are continuous.
Also, as its portfolio and 80/20 management activities have positioned its businesses for profitable growth, the Company has shifted its focus to organic growth and has expressed its belief that organic growth will be 200 basis points above global GDP by the end of 2017.
prices to its customers in the form of price increases or its ability to do so could be delayed.
If the Company is unable to protect its information technology infrastructure against service interruptions, data corruption, cyber-based attacks or network security breaches, there could be a negative impact on operating results or the Company may suffer financial or reputational damage.
The Company relies on information technology networks and systems, including the Internet, to process, transmit and store electronic information, and to manage or support a variety of business processes and activities, including procurement, manufacturing, distribution, invoicing and collection.
These technology networks and systems may be susceptible to damage, disruptions or shutdowns due to failures during the process of upgrading or replacing software, databases or components; power outages; hardware failures; or computer viruses.
In addition, security breaches could result in unauthorized disclosure of confidential information.
If these information technology systems suffer severe damage, disruption, or shutdown, and business continuity plans do not effectively resolve the issues in a timely manner, there could be a negative impact on operating results or the Company may suffer financial or reputational damage.
estimated timing and amount related to the resolution of tax matters.
collecting accounts receivable, increasing price competition, and increasing the risk that counterparties to the Company's contractual arrangements will become insolvent or otherwise unable to fulfill their obligations.
could lead to substantial civil or criminal monetary and non-monetary penalties against the Company or its subsidiaries, or could damage its reputation.
Item 7. Management's Discussion and Analysis of Financial Condition and Results of Operations
226 rewritten, 520 added, 338 removed, 271 unchanged
Illinois Tool Works Inc. (the "Company" or "ITW") is a global manufacturer of a diversified range of industrial products and equipment with [removed: approximately 90] [added: 84] divisions in 57 countries.
As of December 31, [removed: 2014,] [added: 2015,] the Company employed approximately [removed: 49,000] [added: 48,000] persons.
Instead, the Company's corporate management collects data on several key measurements: operating [removed: revenues,] [added: revenue,] operating income, operating [removed: margins,] [added: margin,] overhead costs, number of months on hand in inventory, days sales outstanding in accounts receivable, past due receivables and return on invested capital.
[added: | • |] Operating leverage [removed: is] [added: -] the estimated effect of the organic revenue volume changes on organic operating income, assuming variable margins remain the same as the prior period. [added: |]
[removed: Selling price versus material cost comparisons represent] [added: | • | Price/cost \- represents] the estimated net impact of increases or decreases in the cost of materials used in the Company's products versus changes in the selling price to the Company's customers. [added: |]
[removed: ITW’s Enterprise Strategy is centered on three] [added: These] key initiatives [removed: -] [added: were a major focus of the Company in 2012-2015, which included] portfolio management, business structure [removed: simplification,] [added: simplification] and strategic sourcing.
These 80/20 [removed: efforts] [added: initiatives] can result in restructuring [removed: projects] [added: initiatives] that reduce [removed: costs,] [added: costs] and improve profitability and returns.
[removed: Product] [added: This was achieved through product] line [removed: and customer base] simplification [added: which] focuses on eliminating the complexity and overhead costs associated with smaller product lines and customers, and focuses businesses on supporting and growing their largest customers and product lines.
[removed: In] [added: | • | Product line simplification (PLS) \- focuses businesses on eliminating] the [removed: short-term,] [added: complexity and overhead costs associated with smaller] product [removed: line] [added: lines] and [removed: customer base simplification] [added: customers, and focuses businesses on supporting and growing their largest customers and product lines; in the short-term, PLS] may result in a decrease in revenue and overhead costs while improving operating margin. [added: In the long-term, PLS is expected to result in growth in revenue, profitability, and returns. |]
Financial Statements and Supplementary Data for further [removed: discussion of this transaction.][added: information.]
The operating results of the businesses discussed [removed: above, as well as certain previously divested businesses,] [added: above] are reported as discontinued operations in the statement of income for all periods presented.
As of the second quarter of 2014, the Company [removed: has] [added: had] completed the divestiture of all of the businesses previously classified as discontinued operations.
Financial Statements and Supplementary Data for [removed: discussion of the Company’s discontinued operations.][added: further information.]
The Company’s consolidated results of operations for [removed: 2014, 2013] [added: 2015, 2014] and [removed: 2012] [added: 2013] are summarized as follows:
| Dollars in millions | [removed: 2014] | [added: 2015] | | | [removed: 2013] | [added: 2014] | | | [removed: 2012] | [added: 2013] | | [added: |]
| Operating income | [removed: 2,888] | [added: $] | [added: 2,867] | | [removed: 2,514] | [added: $] | [added: 2,888] | | [removed: 2,475] | [added: $] | [added: 2,514] | [added: |]
[removed: | |] 2014 [removed: Compared] [added: compared] to 2013 [removed: | | | | | | | | | 2013 Compared to 2012 | | | | | | | |]
[added: | • |] Operating [removed: revenues] [added: revenue] increased [removed: 2.5% in 2014 versus 2013] [added: $349 million, or 2.5%,] due to an increase in organic and acquisition [removed: revenues,] [added: revenue,] partially offset by the unfavorable effect of currency translation which primarily occurred in the fourth quarter. [added: Acquisitions primarily included the purchase of a European consumer packaging equipment business and a Chinese food equipment business in the third quarter of 2013. |]
[removed: Total organic revenues increased 2.6% in 2014 versus 2013 primarily due to 8.9% growth] [added: | ◦ | Growth] in the Automotive OEM [removed: segment] and [removed: 4.7% growth in] the Food Equipment [removed: segment,] [added: segments was] partially offset by modest declines in the Polymers & Fluids and Specialty Products segments. [added: |]
[added: | ◦ |] European organic [removed: revenues] [added: revenue] increased 2.4% primarily driven by the Automotive OEM, Food Equipment and Test & Measurement and Electronics segments, partially offset by [added: the] Welding, Polymers & Fluids and Construction [removed: Products.][added: Products segments. |]
[added: | ◦ |] Asia Pacific organic [removed: revenues] [added: revenue] increased 4.9% primarily due to growth in [added: the] Automotive OEM [added: segment] in China and [added: the] Construction Products [added: segment] in Australia. [added: |]
[added: | ◦ |] North American organic [removed: revenues] [added: revenue] increased 2.3% primarily due to growth in the Automotive OEM, Welding and Food Equipment segments. [added: |]
[removed: Acquisitions primarily included] [added: | • | Operating revenue increased 6.4% due to an increase in organic and acquisition revenue. The increase in revenue from acquisitions was due to] the purchase of a [removed: European consumer packaging equipment business and a] Chinese food equipment business in the third quarter of 2013. [added: |]
[removed: This] [added: | ◦ | North American organic revenue decreased 0.5% as a decline in the Welding and Test & Measurement and Electronics segments] was partially offset by growth in the [removed: North American] Automotive OEM, Food [removed: Equipment,] [added: Equipment] and Construction Products [removed: businesses.][added: segments. |]
[added: | • |] Operating [removed: income] [added: revenue] increased [removed: 14.9% in 2014 versus 2013] [added: 8.1%] primarily due to [removed: changes in variable margins and overhead costs,] an increase in organic [removed: revenues and lower restructuring expenses,] [added: revenue,] partially offset by the unfavorable effect of currency translation. [added: |]
[removed: The changes in variable margins and overhead costs] [added: | • | Record operating margin of 21.4%] increased [removed: margins by 140] [added: 150] basis points [removed: over the prior year] primarily due to the [removed: benefits] [added: benefit] of the Company's enterprise [removed: initiatives,] [added: initiatives related to] business structure simplification and strategic [removed: sourcing, which] [added: sourcing that] contributed [removed: 120] [added: 110] basis [removed: points of margin improvement,] [added: points. Lower restructuring expenses and] favorable [removed: selling price versus material cost comparisons of 10] [added: price/cost each contributed 20] basis [removed: points, and lower] [added: points of] operating [removed: expenses.][added: margin expansion. |]
The reconciliation of segment operating [removed: revenues] [added: revenue] and operating income to total operating [removed: revenues] [added: revenue] and operating income is as follows:
| In millions | [removed: 2014] [added: 2015] | | | | [removed: 2013] [added: 2014] | | | | [removed: 2012] [added: 2013] | | |
| Automotive OEM | $ | [removed: 2,590] [added: 2,529] | | | $ | [removed: 2,396] [added: 2,590] | | | $ | [removed: 2,171] [added: 2,396] | |
| Test & Measurement and Electronics | [removed: 2,204] [added: 1,969] | | | | [removed: 2,176] [added: 2,204] | | | | [removed: 2,299] [added: 2,176] | | |
| Food Equipment | [removed: 2,177] [added: 2,096] | | | | [removed: 2,047] [added: 2,177] | | | | [removed: 1,939] [added: 2,047] | | |
| Polymers & Fluids | [removed: 1,927] [added: 1,712] | | | | [removed: 1,993] [added: 1,927] | | | | [removed: 2,063] [added: 1,993] | | |
| Welding | [removed: 1,850] [added: 1,650] | | | | [removed: 1,837] [added: 1,850] | | | | [removed: 1,847] [added: 1,837] | | |
| Construction Products | [removed: 1,707] [added: 1,587] | | | | [removed: 1,717] [added: 1,707] | | | | [removed: 1,724] [added: 1,717] | | |
| Specialty Products | [removed: 2,055] [added: 1,885] | | | | [removed: 2,007] [added: 2,055] | | | | [removed: 1,871] [added: 2,007] | | |
| Total [removed: Segments] | [removed: 14,484] [added: $] | [added: 13,405] | | | [removed: 14,135] [added: $] | [added: 14,484] | | | [removed: 13,870] [added: $] | [added: 14,135] | |
| Automotive OEM | $ | [removed: 600] [added: 613] | | | $ | [removed: 490] [added: 600] | | | $ | [removed: 421] [added: 490] | |
| Test & Measurement and Electronics | [removed: 340] [added: 322] | | | | [removed: 321] [added: 340] | | | | [removed: 342] [added: 321] | | |
| Food Equipment | [removed: 453] [added: 498] | | | | [removed: 385] [added: 453] | | | | [removed: 332] [added: 385] | | |
| Polymers & Fluids | [removed: 357] [added: 335] | | | | [removed: 335] [added: 357] | | | | [removed: 327] [added: 335] | | |
THE ITW BUSINESS MODEL
The powerful and highly differentiated ITW Business Model is the Company’s core source of value creation.
This business model is the Company’s competitive advantage and defines how ITW creates value for its shareholders and comprises three unique elements:
| • | ITW’s 80/20 management process is the operating system that is applied in every ITW business. Initially introduced as a manufacturing efficiency tool in the 1980’s, ITW has continually refined, improved and expanded 80/20 into a proprietary, holistic business management process that generates significant value for the Company. Through the application of data-driven insights generated by 80/20 practice, ITW focuses on its largest and best opportunities (the “80”) and eliminates complexity associated with the less profitable opportunities (the “20”). 80/20 enables ITW businesses to consistently deliver world-class operational excellence in regards to product availability, quality, and innovation, while generating superior financial performance; |
| • | Customer-back innovation has fueled decades of profitable growth at ITW. The Company’s unique innovation approach is built on the insight gathered from the 80/20 management process. Working from the customer back, ITW businesses position themselves as the go-to problem solver for their “80” customers. ITW’s innovation efforts are focused on understanding customer needs, particularly those in “80” markets with solid long-term growth fundamentals, and then creating unique solutions to address those needs. These customer insights and learnings drive innovation at ITW and have contributed to a portfolio of more than 16,000 granted and pending patents; |
| • | ITW’s decentralized, entrepreneurial culture allows ITW businesses to be fast, focused, and responsive. ITW businesses have significant flexibility within the framework of the ITW Business Model to customize their approach in order to best serve their customers. ITW colleagues are clear about what is expected of them with regard to ITW’s business model, strategy, and values. This leads to a focused and simple organizational structure that, combined with outstanding execution, delivers operational excellence adapted to their specific customers and end markets. |
In 2013, ITW began the process of transitioning the Company onto its current strategic path to fully leverage the compelling performance potential of the ITW Business Model.
Since then, ITW has made considerable progress, as evidenced by the Company’s strong financial performance over the past three years.
The roots of ITW’s Enterprise Strategy began in 2011-2012, when the Company undertook a complete review of its performance.
ITW gathered deep insights from its businesses that were delivering consistent above-market growth with best-in-class margins and returns, and defined a strategy to replicate that performance throughout the Company.
Based on this rigorous and thorough evaluation, ITW determined two paths to deliver world-class financial performance and compelling long-term returns for its shareholders.
One, ITW needed to shift the Company's primary growth engine to organic; and two, the Company needed to leverage the ITW Business Model to deliver best-in-class margins and returns.
Shift the Company’s Core Growth Engine to Organic
In order to pivot to fully focus on organic growth, the Company needed to first accomplish several preparatory steps.
The first step, portfolio management, was to construct and maintain a business portfolio capable of delivering consistent above-market organic growth.
As part of this initiative to realign the portfolio, ITW exited businesses that were operating in commoditized market spaces and prioritized sustainable differentiation as a must-have requirement for all ITW businesses.
This process included both divesting entire businesses and exiting commoditized product lines and customers inside otherwise highly differentiated ITW divisions.
As a result of this work, ITW’s business portfolio now has significantly higher organic growth potential.
ITW segments and divisions now possess attractive and differentiated product lines and end markets as they continue to improve margins and generate price/cost increases.
Most of this initiative is complete and ITW businesses are demonstrating notably improved financial performance; the Company expects the remaining product line simplification work to largely be accomplished in 2016.
The second step, business structure simplification, was to scale-up ITW’s operating structure to support increased engineering, marketing, and sales resources, and to improve global reach and competitiveness, all of which were critical to ITW’s ability to drive accelerated organic growth.
ITW now has 84 scaled-up divisions with significantly enhanced focus on growth investments, core customers and products, and customer-back innovation.
With the portfolio realignment and scale-up work largely complete, the Company is now able to shift its focus to preparing for, and accelerating, organic growth.
As a third preparatory step, ITW is currently in the process of reapplying 80/20 to optimize its newly scaled-up divisions for growth.
This process involves first using 80/20 to build a foundation of operational excellence, and then applying 80/20-driven insights to identify the best opportunities to drive organic growth.
Once the business is operationally excellent and has identified the right growth opportunities, the final step is to accelerate organic growth.
The process of preparing for accelerated organic growth generally takes 18 to 24 months.
Based on the financial performance of the divisions that are further along in this process, the Company believes that this framework is capable of delivering above market organic growth in all ITW segments.
Many ITW divisions are ready to grow and growing above their respective markets, while the rest of the Company’s divisions are at various phases of preparing to grow.
ITW management is fully aligned on this plan and very focused on executing it.
By the end of 2016, the Company expects approximately 85 percent of its businesses to be ready to grow.
Leverage the ITW Business Model to Deliver Best-in-Class Margins and Returns
The Company’s work to deliver best-in-class margins and returns is focused on two key areas of ongoing activity.
The first is strategic sourcing, where the Company seeks to benefit from its size and scale in procurement processes.
Sourcing is now a core strategic and operational capability and this improved competitiveness supports ITW’s organic growth framework.
The Company’s 80/20-enabled sourcing organization has delivered an average of 1 percent reduction in spend each year in 2013-2015 and is on track to do the same in 2016 and 2017.
The second element of the margin and return area of focus is to better leverage the full power of the ITW Business Model through a much more consistent and focused approach to 80/20 best practice implementation across the Company.
ITW has clearly defined what excellence in the practice of ITW’s 80/20 management process looks like and the result is significant opportunity to create meaningful incremental improvement in margins and returns as evidenced by the
Company’s improvement in both operating margin and after-tax return on invested capital.
TERMS USED BY ITW
Management analyzes the Company's consolidated results of operations and the results of each segment by identifying the effects of changes in the results of the organic business (businesses that have been included in the Company's results of operations for more than 12 months), newly acquired and recently divested companies, restructuring costs, goodwill and intangible asset impairment charges, and currency translation on the operating revenues and operating income of each segment.
The changes to operating income of organic businesses include the estimated effects of both operating leverage and changes in variable margins and overhead costs.
As manufacturing and administrative overhead costs usually do not significantly change as a result of revenues increasing or decreasing, the percentage change in operating income due to operating leverage is usually more than the percentage change in the revenues.
Changes in variable margins and overhead costs represent the estimated effect of non-volume related changes in the operating income of organic businesses and may be driven by a number of factors, including changes in product mix, the cost of raw materials, labor and overhead, and pricing to customers.
Management reviews these price versus cost comparisons by analyzing the net impact of changes to each segment's operating margin.
In 2012, the Company embarked on an Enterprise Strategy with the objective of fully leveraging ITW’s core capabilities to deliver strong financial performance.
These enterprise initiatives are expected to enhance the business through 2017 and are targeted at expanding organic revenue growth and improving profitability and returns.
The foundation of this strategy is a set of business practices referred to as the ITW Business Model consisting of three core elements:
80/20 Business Process - The concept of the 80/20 business process is to focus on what is most important (the 20% of the items which account for 80% of the value) and to spend less time and resources on the less important (the 80% of the items which account for 20% of the value).
The Company uses this 80/20 business process to simplify and focus on the key drivers of business profitability, and as a result, reduces complexity that often creates unnecessary expense and disguises what is truly important.
The Company utilizes the 80/20 process in all aspects of its business.
Common applications of the 80/20 business process include:
| • | Simplifying product lines by reducing the number of products offered by combining the features of similar products, outsourcing products or eliminating low-value products. |
| • | Segmenting the customer base by focusing on the 80/20 customers separately and finding alternative ways to serve the 20/80 customers. |
| • | Simplifying the supplier base by partnering with 80/20 suppliers and reducing the number of 20/80 suppliers. |
| • | Designing business processes, systems and measurements around the 80/20 activities. |
The result of the application of this 80/20 business process is that the Company has over time improved its long-term operating and financial performance.
Customer-Back Innovation - ITW’s customer-back approach to innovation builds on the Company’s 80/20 business process to help ITW businesses focus on the most profitable customers and invent solutions to solve their specific problems.
ITW businesses are focused on building relationships with these major customers to develop deep knowledge and insight around their needs.
These customer insights and learnings drive innovation at ITW.
The Company actively protects its innovation through a patent portfolio of approximately 10,000 active patents.
Decentralized Entrepreneurial Culture - ITW businesses have significant flexibility within the framework of the ITW Business Model to customize their approach in order to best serve their customers.
This leads to a focused and simple organizational structure that can deliver operational excellence adapted to their customers and end markets.
KEY INITIATIVES
Portfolio Management - The Company's portfolio management initiative aims to construct a business portfolio that leverages the Company’s differentiated business model and growth potential.
As part of this initiative, the Company reviews its operations for businesses that may no longer be aligned with its long-term objectives.
As a result, the Company's divestiture activity increased in 2012, 2013 and 2014.
With the sale of the Company's former Industrial Packaging segment on May 1, 2014, the divestiture element of the Company's portfolio management initiative is essentially complete.
The Company has historically acquired businesses with complementary products and services as well as larger acquisitions that represent potential new platforms.
Going forward, the Company will emphasize organic growth, while acquisitions will be targeted to bolt-on acquisitions that support and accelerate organic growth in existing segments, and new platforms that expand the Company’s long-term growth and earnings potential.
Refer to the Discontinued Operations note in Item 8 - Financial Statements and Supplementary Data for discussion of the Company’s discontinued operations.
Another key aspect of the portfolio management initiative is the focus on product line and customer base simplification.
Product line and customer base simplification is a core element of the Company's 80/20 business process.
Over the long-term, product line and customer base simplification results in growth in revenue, profitability and returns, and is key to improving the Company's long-term operating and financial performance.
Business Structure Simplification - The business structure simplification initiative simplifies the Company's organizational model and adds scale to the Company's operating divisions in order to increase organic revenue growth, enhance global competitiveness and drive operational efficiencies.
This initiative focuses on reducing the number of the Company's operating divisions and increasing the average revenue size of each division, while retaining the positive attributes of a decentralized operating model.
The Company expects to enhance its profitability and returns through a combination of applying its 80/20 business process to the new divisions, more focused growth investments and reduced infrastructure.
Strategic Sourcing - The Company's strategic sourcing initiative focuses on building sourcing capability in order to leverage purchasing scale to enhance profitability and global competitiveness.
It incorporates both enterprise-level and segment-level purchasing that cross the Company's many businesses.
DIVESTITURE OF MAJORITY INTEREST IN FORMER DECORATIVE SURFACES SEGMENT
An excerpt. Shown here: 40 of 226 rewritten, 40 of 520 added and 40 of 338 removed. The counts are complete. For every sentence, read Item 7. Management's Discussion and Analysis of Financial Condition and Results of Operations in the FY2015 filing and the FY2014 filing.
Item 7A. Quantitative and Qualitative Disclosures About Market Risk
15 rewritten, 8 added, 8 removed, 11 unchanged
| | [removed: |] 0.90% Notes Due | | | | 1.95% Notes Due | | | | 6.25% Notes Due | | | | 4.88% Notes Due thru | | | | 3.375% Notes Due | | | | 1.75% Euro Notes Due | | | | [added: 1.25% Euro Notes Due | | | |] 3.50% Notes Due | | | | [added: 2.125% Euro Notes Due | | | |] 3.00% Euro Notes Due | | | | 4.875% Notes Due | | | | 3.9% Notes Due | | |
| In millions | [removed: |] Feb 25, 2017 | | | | Mar 1, 2019 | | | | Apr 1, 2019 | | | | Dec 31, 2020 | | | | Sep 15, 2021 | | | | May 20, 2022 | | | | [added: May 22, 2023 | | | |] Mar 1, 2024 | | | | May [added: 22, 2030 | | | | May] 19, 2034 | | | | Sep 15, 2041 | | | | Sep 1, 2042 | | |
| As of December 31, 2014: | | | | | | | | | | | | | | | | | | | | | | | | | | | | | | | | | | | | | | | | | [added: | | | | | | |]
| Estimated cash outflow by year of principal maturity | | | | | | | | | | | | | | | | | | | | | | | | | | | | | | | | | | | | | | | | | [added: | | | | | | |]
| [removed: 2015] [added: As of December 31, 2015:] | | [removed: $] | [removed: —] | | | [removed: $] | [removed: —] | | | [removed: $] | [removed: —] | | | [removed: $] | [removed: 1] | | | [removed: $] | [removed: —] | | | [removed: $] | [removed: —] | | | [removed: $] | [removed: —] | | | [removed: $] | [removed: —] | | | [removed: $] | [removed: —] | | | [removed: $] | [removed: —] | | [added: | | | | | | |]
| 2016 | [added: $] | — | | | [added: $] | — | | | [added: $] | — | | | [added: $] | — | | | [added: $] | — | | | [added: $] | — | | | [added: $] | — | | | [added: $] | — | | | [added: $] | — | | | [added: $] | — | | | [added: $ | — | | | $ | — | |]
| 2017 | [removed: |] 650 | | | | — | | | | — | | | | — | | | | — | | | | — | | | | — | | | | — | | | | — | | | | — | | | [added: | — | | | | — | | |]
| 2018 | [added: —] | [added: | | |] — | | | | — | | | | — | | | | — | | | | — | | | | — | | | | — | | | | — | | | | — | | | | — | | | [added: | — | | |]
| 2019 | [removed: |] — | | | | 650 | | | | 700 | | | | — | | | | — | | | | — | | | | — | | | | — | | | | — | | | | — | | | [added: | — | | | | — | | |]
| [removed: 2020] [added: 2021] and thereafter | [removed: |] — | | | | — | | | | — | | | | [removed: 4] [added: —] | | | | 350 | | | | [removed: 605] [added: 543] | | | | [added: 543 | | | |] 700 | | | | [removed: 605] [added: 543] | | | | [added: 543 | | | |] 650 | | | | 1,100 | | |
| Estimated fair value | [removed: |] 648 | | | | 651 | | | | 817 | | | | 6 | | | | 369 | | | | 640 | | | | [added: — | | | |] 735 | | | | [added: — | | | |] 702 | | | | 746 | | | | 1,110 | | |
| Total estimated cash outflow | [removed: |] $ | [removed: —] [added: 650] | | | $ | [removed: —] [added: 650] | | | $ | 700 | | | $ | [removed: 8] [added: 5] | | | $ | 350 | | | $ | [removed: —] [added: 605] | | | $ | — | | | $ | [added: 700 | | | $ |] — | | | $ | [added: 605 | | | $ |] 650 | | | $ | 1,100 | |
The Company designated [removed: the] €1.0 billion of Euro notes [added: issued in May 2014 and €1.0 billion of Euro notes issued in May 2015] as [removed: a hedge] [added: hedges] of a portion of its net investment in Euro-denominated foreign operations to reduce foreign currency risk associated with the investment in these operations.
Changes in the value of this debt resulting from fluctuations in the Euro to U.S. Dollar exchange rate have been recorded as foreign currency translation adjustments within Accumulated other comprehensive [removed: income.][added: income (loss).]
The [added: cumulative] unrealized gain recorded in Accumulated other comprehensive income [added: (loss)] related to the net investment hedge was [added: $308 million and] $158 million [removed: for the year ended] [added: as of] December 31, [removed: 2014.][added: 2015 and December 31, 2014, respectively.]
| | | | | | | | | | | | | | | | | | | | | | | | | | | | | | | | | | | | | | | | | | | | | | | | |
| --- | --- | --- | --- | --- | --- | --- | --- | --- | --- | --- | --- | --- | --- | --- | --- | --- | --- | --- | --- | --- | --- | --- | --- | --- | --- | --- | --- | --- | --- | --- | --- | --- | --- | --- | --- | --- | --- | --- | --- | --- | --- | --- | --- | --- | --- | --- | --- |
| | | | | | | | | | | | | | | | | | | | | | | | | | | | | | | | | | | | | | | | | | | | | | | | |
| 2020 | — | | | | — | | | | — | | | | 4 | | | | — | | | | — | | | | — | | | | — | | | | — | | | | — | | | | — | | | | — | | |
| Estimated fair value | 649 | | | | 655 | | | | 790 | | | | 4 | | | | 362 | | | | 564 | | | | 538 | | | | 727 | | | | 530 | | | | 569 | | | | 708 | | | | 1,051 | | |
| Carrying value | 649 | | | | 647 | | | | 698 | | | | 4 | | | | 347 | | | | 536 | | | | 536 | | | | 695 | | | | 536 | | | | 528 | | | | 635 | | | | 1,080 | | |
| | | | | | | | | | | | | | | | | | | | | | | | | | | | | | | | | | | | | | | | | | | | | | | | |
| Carrying value | 648 | | | | 647 | | | | 697 | | | | 5 | | | | 347 | | | | 597 | | | | — | | | | 694 | | | | — | | | | 588 | | | | 635 | | | | 1,079 | | |
| | | | | | | | | | | | | | | | | | | | | | | | | | | | | | | | | | | | | | | | | |
| --- | --- | --- | --- | --- | --- | --- | --- | --- | --- | --- | --- | --- | --- | --- | --- | --- | --- | --- | --- | --- | --- | --- | --- | --- | --- | --- | --- | --- | --- | --- | --- | --- | --- | --- | --- | --- | --- | --- | --- | --- |
| Carrying value | | 649 | | | | 649 | | | | 700 | | | | 5 | | | | 349 | | | | 600 | | | | 698 | | | | 594 | | | | 641 | | | | 1,090 | | |
| As of December 31, 2013: | | | | | | | | | | | | | | | | | | | | | | | | | | | | | | | | | | | | | | | | |
| Estimated fair value | | — | | | | — | | | | 834 | | | | 8 | | | | 350 | | | | — | | | | — | | | | — | | | | 649 | | | | 944 | | |
| Carrying value | | — | | | | — | | | | 700 | | | | 7 | | | | 349 | | | | — | | | | — | | | | — | | | | 641 | | | | 1,090 | | |
In October 2007, the Company, through a wholly-owned European subsidiary, issued €750 million of 5.25% Euro notes due October 1, 2014, which were paid on the due date.
In addition, in May 2014, the Company issued €500 million of 1.75% Euro notes due May 20, 2022 and €500 million of 3.0% Euro notes due May 19, 2034.
Item 1. Business
56 rewritten, 60 added, 71 removed, 232 unchanged
The Company is a global manufacturer of a diversified range of industrial products and equipment with [removed: approximately 90] [added: 84] divisions in 57 countries.
As of December 31, [removed: 2014,] [added: 2015,] the Company employed approximately [removed: 49,000] [added: 48,000] persons.
[removed: Automotive OEM:] Businesses in this segment produce components and fasteners for automotive-related applications.
| • | plastic and metal components, fasteners and assemblies for automobiles, light [removed: trucks,] [added: trucks] and other industrial uses. |
[removed: Test & Measurement and Electronics:] Businesses in this segment produce equipment, consumables, and related software for testing and measuring of materials and structures, as well as equipment and consumables used in the production of electronic subassemblies and microelectronics.
[removed: In the] [added: |] Test & Measurement and Electronics [removed: segment, products include:][added: | 289 | | | | 301 | | |]
[removed: Polymers & Fluids:] Businesses in this segment produce adhesives, sealants, lubrication and cutting fluids, [removed: janitorial] and [removed: hygiene products, and] fluids and polymers for auto aftermarket maintenance and appearance.
[removed: In the Polymers & Fluids segment, products] [added: Products in this segment] include:
[removed: Welding:] Businesses in this segment produce arc welding equipment, consumables and accessories for a wide array of industrial and commercial applications.
[removed: In the Welding segment, products] [added: Products in this segment] include:
Construction Products: [removed: Businesses in this] [added: This] segment [removed: produce construction] [added: is a branded supplier of innovative engineered] fastening systems and [removed: truss products.][added: solutions.]
[removed: In the Construction] Products [removed: segment, products] [added: in this segment] include:
Specialty Products: [removed: Diversified businesses in this] [added: This] segment [removed: produce] [added: is focused on diversified niche market opportunities that deliver strong operating results with substantial patent protection producing] beverage packaging equipment and consumables, product coding and marking equipment and consumables, and appliance components and fasteners.
[removed: In the Specialty] Products [removed: segment, products] [added: in this segment] include:
[removed: ITW’s Enterprise Strategy is centered on three] [added: These] key initiatives [removed: -] [added: were a major focus of the Company in 2012-2015, which included] portfolio management, business structure [removed: simplification,] [added: simplification] and strategic sourcing.
These 80/20 [removed: efforts] [added: initiatives] can result in restructuring [removed: projects] [added: initiatives] that reduce [removed: costs,] [added: costs] and improve profitability and returns.
[removed: Product] [added: This was achieved through product] line [removed: and customer base] simplification [added: which] focuses on eliminating the complexity and overhead costs associated with smaller product lines and customers, and focuses businesses on supporting and growing their largest customers and product lines.
Financial Information about Segments [removed: and Markets]
| Automotive [removed: OEM/Tiers | 91 | % | | 8 | % | | — | % | | 4 | % | | 3 | % | | —] [added: OEM] | [removed: %] [added: $] | [added: 403] | [removed: —] | [removed: %] | [added: $] | [removed: 19] [added: 414] | [removed: %] |
Backlog by segment as of December 31, [removed: 2014] [added: 2015] and [removed: 2013] [added: 2014] was as follows:
| In millions | [removed: 2014] [added: 2015] | | | | [removed: 2013] [added: 2014] | | |
| Food Equipment | [removed: 237] [added: 203] | | | | [removed: 218] [added: 237] | | |
| Polymers & Fluids | [removed: 60] [added: 53] | | | | [removed: 66] [added: 60] | | |
| Welding | [removed: 84] [added: 68] | | | | [removed: 92] [added: 84] | | |
| Construction Products | [removed: 28] [added: 34] | | | | [removed: 31] [added: 28] | | |
| Specialty Products | [removed: 263] [added: 237] | | | | [removed: 290] [added: 263] | | |
| Total | $ | [removed: 1,387] [added: 1,287] | | | $ | [removed: 1,405] [added: 1,387] | |
Backlog orders scheduled for shipment beyond calendar year [removed: 2015] [added: 2016] were not material as of December 31, [removed: 2014.][added: 2015.]
This structure enables the Company's businesses to drive operational excellence utilizing the Company's 80/20 [removed: business] [added: management] process and leveraging its product innovation capabilities.
Research and development expenses were [removed: $227] [added: $218] million in [removed: 2014, $240] [added: 2015, $227] million in [removed: 2013] [added: 2014] and $240 million in [removed: 2012.][added: 2013.]
The Company owns approximately 3,400 unexpired U.S. patents and [removed: 6,600] [added: 7,200] foreign patents covering articles, methods and machines.
In addition, the Company has approximately [removed: 1,600] [added: 1,500] applications for patents pending in the U.S. Patent Office and [removed: 4,100 applications pending in foreign patent offices.]
The Company maintains a patent [removed: department] [added: group] for the administration of patents and processing of patent applications.
The Company employed approximately [removed: 49,000] [added: 48,000] persons as of December 31, [removed: 2014] [added: 2015] and considers its employee relations to be excellent.
The Company's revenues from sales to customers outside the U.S. were approximately [added: 54% of revenues in 2015 and] 57% of revenues in [removed: 2014, 2013] [added: 2014] and [removed: 2012.][added: 2013.]
Executive Officers of the Company as of February [removed: 13, 2015] [added: 11, 2016] were as follows:
| E. Scott Santi | [removed: President] [added: Chairman] & Chief Executive Officer | [removed: 53] [added: 54] | |
| John R. Hartnett | Executive Vice President | [removed: 54] [added: 55] | |
| Michael M. Larsen | Senior Vice President & Chief Financial Officer | [removed: 46] [added: 47] | |
| Mary K. Lawler | Senior Vice President & Chief Human Resources Officer | [removed: 49] [added: 50] | |
Automotive OEM: This segment is a global, niche supplier to top tier OEMs, providing unique innovation to address pain points for sophisticated customers with complex problems.
This segment primarily serves the automotive original equipment manufacturers and tiers market.
Test & Measurement and Electronics: This segment is a branded and innovative producer of test and measurement and electronic manufacturing and maintenance, repair, and operations, or "MRO" solutions that improve efficiency and quality for customers in diverse end markets.
This segment primarily serves the electronics, general industrial, industrial capital goods, automotive original equipment manufacturers and tiers, and consumer durables markets.
Food Equipment: This segment is a highly focused and branded industry-leader in commercial food equipment differentiated by innovation and integrated service offerings.
This segment primarily serves the food institutional/restaurant, food service and food retail markets.
Polymers & Fluids: This segment is a highly branded supplier to niche markets that require value-added, differentiated products.
This segment primarily serves the automotive aftermarket, general industrial, MRO, and construction markets.
Welding: This segment is a branded value-added equipment and specialty consumable manufacturer with innovative and leading technology.
This segment primarily serves the general industrial market, which includes fabrication, shipbuilding and other general industrial markets, and energy, MRO, construction, and industrial capital goods markets.
Products in this segment include:
This segment primarily serves the residential construction, renovation/remodel construction and commercial construction markets.
Products in this segment include:
This segment primarily serves the food and beverage, consumer durables, general industrial, printing and publishing and industrial capital goods markets.
Products in this segment include:
The ITW Business Model
The powerful and highly differentiated ITW Business Model is the Company’s core source of value creation.
This business model is the Company’s competitive advantage and defines how ITW creates value for its shareholders and comprises three unique elements:
| • | ITW’s 80/20 management process is the operating system that is applied in every ITW business. Initially introduced as a manufacturing efficiency tool in the 1980’s, ITW has continually refined, improved and expanded 80/20 into a proprietary, holistic business management process that generates significant value for the Company. Through the application of data-driven insights generated by 80/20 practice, ITW focuses on its largest and best opportunities (the “80”) and eliminates complexity associated with the less profitable opportunities (the “20”). 80/20 enables ITW businesses to consistently deliver world-class operational excellence in regards to product availability, quality, and innovation, while generating superior financial performance; |
| • | Customer-back innovation has fueled decades of profitable growth at ITW. The Company’s unique innovation approach is built on the insight gathered from the 80/20 management process. Working from the customer back, ITW businesses position themselves as the go-to problem solver for their “80” customers. ITW’s innovation efforts are focused on understanding customer needs, particularly those in “80” markets with solid long-term growth fundamentals, and then creating unique solutions to address those needs. These customer insights and learnings drive innovation at ITW and have contributed to a portfolio of more than 16,000 granted and pending patents; |
| • | ITW’s decentralized, entrepreneurial culture allows ITW businesses to be fast, focused, and responsive. ITW businesses have significant flexibility within the framework of the ITW Business Model to customize their approach in order to best serve their customers. ITW colleagues are clear about what is expected of them with regard to ITW’s business model, strategy, and values. This leads to a focused and simple organizational structure that, combined with outstanding execution, delivers operational excellence adapted to their specific customers and end markets. |
In 2013, ITW began the process of transitioning the Company onto its current strategic path to fully leverage the compelling performance potential of the ITW Business Model.
Since then, ITW has made considerable progress, as evidenced by the Company’s strong financial performance over the past three years.
The roots of ITW’s Enterprise Strategy began in 2011-2012, when the Company undertook a complete review of its performance.
ITW gathered deep insights from its businesses that were delivering consistent above-market growth with best-in-class margins and returns, and defined a strategy to replicate that performance throughout the Company.
Based on this rigorous and thorough evaluation, ITW determined two paths to deliver world-class financial performance and compelling long-term returns for its shareholders.
One, ITW needed to shift the Company's primary growth engine to organic; and two, the Company needed to leverage the ITW Business Model to deliver best-in-class margins and returns.
Shift the Company’s Core Growth Engine to Organic
In order to pivot to fully focus on organic growth, the Company needed to first accomplish several preparatory steps.
The first step, portfolio management, was to construct and maintain a business portfolio capable of delivering consistent above-market organic growth.
As part of this initiative to realign the portfolio, ITW exited businesses that were operating in commoditized market spaces and prioritized sustainable differentiation as a must-have requirement for all ITW businesses.
This process included both divesting entire businesses and exiting commoditized product lines and customers inside otherwise highly differentiated ITW divisions.
As a result of this work, ITW’s business portfolio now has significantly higher organic growth potential.
ITW segments and divisions now possess attractive and differentiated product lines and end markets as they continue to improve margins and generate price/cost increases.
Most of this initiative is complete and ITW businesses are demonstrating notably improved financial performance; the Company expects the remaining product line simplification work to largely be accomplished in 2016.
The second step, business structure simplification, was to scale-up ITW’s operating structure to support increased engineering, marketing, and sales resources, and to improve global reach and competitiveness, all of which were critical to ITW’s ability to drive accelerated organic growth.
ITW now has 84 scaled-up divisions with significantly enhanced focus on growth investments, core customers and products, and customer-back innovation.
With the portfolio realignment and scale-up work largely complete, the Company is now able to shift its focus to preparing for, and accelerating, organic growth.
As a third preparatory step, ITW is currently in the process of reapplying 80/20 to optimize its newly scaled-up divisions for growth.
This process involves first using 80/20 to build a foundation of operational excellence, and then applying 80/20-driven insights to identify the best opportunities to drive organic growth.
In the Automotive OEM segment, products and services include:
| | |
| --- | --- |
Food Equipment: Businesses in this segment produce commercial food equipment and provide related service.
In the Food Equipment segment, products and services include:
In 2012, the Company embarked on an Enterprise Strategy with the objective of fully leveraging ITW’s core capabilities to deliver strong financial performance.
These enterprise initiatives are expected to enhance the business through 2017 and are targeted at expanding organic revenue growth and improving profitability and returns.
The foundation of this strategy is a set of business practices referred to as the ITW Business Model consisting of three core elements:
80/20 Business Process - The concept of the 80/20 business process is to focus on what is most important (the 20% of the items which account for 80% of the value) and to spend less time and resources on the less important (the 80% of the items which account for 20% of the value).
The Company uses this 80/20 business process to simplify and focus on the key drivers of business profitability, and as a result, reduces complexity that often creates unnecessary expense and disguises what is truly important.
The Company utilizes the 80/20 process in all aspects of its business.
Common applications of the 80/20 business process include:
| • | Simplifying product lines by reducing the number of products offered by combining the features of similar products, outsourcing products or eliminating low-value products. |
| • | Segmenting the customer base by focusing on the 80/20 customers separately and finding alternative ways to serve the 20/80 customers. |
| • | Simplifying the supplier base by partnering with 80/20 suppliers and reducing the number of 20/80 suppliers. |
| • | Designing business processes, systems and measurements around the 80/20 activities. |
The result of the application of this 80/20 business process is that the Company has over time improved its long-term operating and financial performance.
Customer-Back Innovation - ITW’s customer-back approach to innovation builds on the Company’s 80/20 business process to help ITW businesses focus on the most profitable customers and invent solutions to solve their specific problems.
ITW businesses are focused on building relationships with these major customers to develop deep knowledge and insight around their needs.
These customer insights and learnings drive innovation at ITW.
The Company actively protects its innovation through a patent portfolio of approximately 10,000 active patents.
Decentralized Entrepreneurial Culture - ITW businesses have significant flexibility within the framework of the ITW Business Model to customize their approach in order to best serve their customers.
This leads to a focused and simple organizational structure that can deliver operational excellence adapted to their customers and end markets.
Key Initiatives
Portfolio Management - The Company's portfolio management initiative aims to construct a business portfolio that leverages the Company’s differentiated business model and growth potential.
As part of this initiative, the Company reviews its operations for businesses that may no longer be aligned with its long-term objectives.
As a result, the Company's divestiture activity increased in 2012, 2013 and 2014.
With the sale of the Company's former Industrial Packaging segment on May 1, 2014, the divestiture element of the Company's portfolio management initiative is essentially complete.
The Company has historically acquired businesses with complementary products and services as well as larger acquisitions that represent potential new platforms.
Going forward, the Company will emphasize organic growth, while acquisitions will be targeted to bolt-on acquisitions that support and accelerate organic growth in existing segments, and new platforms that expand the Company’s long-term growth and earnings potential.
Refer to the Discontinued Operations note in Item 8 - Financial Statements and Supplementary Data for discussion of the Company’s discontinued operations.
Another key aspect of the portfolio management initiative is the focus on product line and customer base simplification.
Product line and customer base simplification is a core element of the Company's 80/20 business process.
In the short-term, product line and customer base simplification may result in a decrease in revenue and overhead costs while improving operating margin.
Over the long-term, product line and customer base simplification results in growth in revenue, profitability and returns, and is key to improving the Company's long-term operating and financial performance.
Business Structure Simplification - The business structure simplification initiative simplifies the Company's organizational model and adds scale to the Company's operating divisions in order to increase organic revenue growth, enhance global competitiveness and drive operational efficiencies.
This initiative focuses on reducing the number of the Company's operating divisions and increasing the average revenue size of each division, while retaining the positive attributes of a decentralized operating model.
The Company expects to enhance its profitability and returns through a combination of applying its 80/20 business process to the new divisions, more focused growth investments and reduced infrastructure.
Strategic Sourcing - The Company's strategic sourcing initiative focuses on building sourcing capability in order to leverage purchasing scale to enhance profitability and global competitiveness.
It incorporates both enterprise-level and segment-level purchasing that cross the Company's many businesses.
An excerpt. Shown here: 40 of 56 rewritten, 40 of 60 added and 40 of 71 removed. The counts are complete. For every sentence, read Item 1. Business in the FY2015 filing and the FY2014 filing.
Cover and table of contents
25 rewritten, 5 added, 3 removed, 71 unchanged
For the fiscal year ended December 31, [removed: 2014][added: 2015]
Indicate by check mark if disclosure of delinquent filers pursuant to Item 405 of Regulation S-K is not contained herein, and will not be contained, to the best of registrant’s knowledge, in definitive proxy or information statements incorporated by reference in Part III of this Form 10-K or any amendment to this Form 10-K. [removed: x][added: o]
The aggregate market value of the voting stock held by non-affiliates of the registrant as of June 30, [removed: 2014] [added: 2015] was approximately [removed: $28.2] [added: $26.7] billion based on the New York Stock Exchange closing sales price as of June 30, [removed: 2014.][added: 2015.]
| Portions of the [removed: 2015] [added: 2016] Proxy Statement for Annual Meeting of Stockholders to be held on May [removed: 8, 2015.] [added: 6, 2016.] | | Part III |
| Item 1. | Business | [removed: [3](#sEDE491A3D723464C6BA52E3E04954DF1)] [added: [3](#sFBC4147A53F52962C45D2D717593E5DB)] |
| Item 1A. | Risk Factors | [removed: [10](#sAA11F29A92B956B7531E2E3E1FA0218F)] [added: [10](#sCD1D3C14C69B634693802D71986427E4)] |
| Item 1B. | Unresolved Staff Comments | [removed: [14](#s4810AD7C6865D339AB012E3E1FC7A45A)] [added: [14](#s2103B756B7B71FB164712D719887C2DD)] |
| Item 2. | Properties | [removed: [14](#sB12824F6EBE22D81150B2E3E03FD0573)] [added: [14](#s1D0C3926C67F6D5E88D82D7179F47112)] |
| Item 3. | Legal Proceedings | [removed: [14](#sF89C4F2041E51BC0BD2F2E3E201B5D87)] [added: [14](#s0F7A3EFE45DA16F1534C2D7198DAFC49)] |
| Item 4. | Mine Safety Disclosures | [removed: [14](#s01BC2E1F1DBCAFC4829A2E3E203C315E)] [added: [14](#s1A0F0F491093FC50D0B72D71990CE941)] |
| Item 5. | Market for Registrant’s Common Equity, Related Stockholder Matters and Issuer Purchases of Equity Securities | [removed: [15](#sE0277D5AF7967E9FF5F22E3E0881B3CB)] [added: [15](#sCD9CD0489E85A894FAFE2D717A8261E9)] |
| Item 6. | Selected Financial Data | [removed: [16](#s4CA3FA2CD6336B73F7962E3E20C017AC)] [added: [16](#sEFD3A12EAC47433B5B1D2D719980C5B8)] |
| Item 7. | Management's Discussion and Analysis of Financial Condition and Results of Operations | [removed: [17](#s15D5B1880A5F95EFC3C92E3E20E3459B)] [added: [18](#sBE53BF20A5CB91AFF6542D7199B3722E)] |
| Item 7A. | Quantitative and Qualitative Disclosures About Market Risk | [removed: [42](#s203F666ECCEE995773FF2E3E264AEE5C)] [added: [39](#s33964C708E134E343CDF2D719F3B26F1)] |
| Item 8. | Financial Statements and Supplementary Data | [removed: [43](#s282827AFC29442BEDA632E3E266BC155)] [added: [40](#s517FA2726840ABEE34992D719F5C2B25)] |
| Item 9. | Changes in and Disagreements With Accountants on Accounting and Financial Disclosure | [removed: [78](#s3CCE4EAC9DCBE481B01E2E3E2D413C73)] [added: [71](#sAE9C0023E263FA8536D22D71A640B93A)] |
| Item 9A. | Controls and Procedures | [removed: [78](#sD948F7A541B84B76BAA32E3E2D730FF4)] [added: [71](#s0ECE0BD21C9BD8B259A22D71A6668619)] |
| Item 9B. | Other Information | [removed: [78](#s113958916E8F7D753FFB2E3E2D95B2BC)] [added: [71](#s7C7B1B052458463CFE622D71A6870B75)] |
| Item 10. | Directors, Executive Officers and Corporate Governance | [removed: [79](#s83BB0358D1DB944AD9972E3E2DE87758)] [added: [72](#s98B7E8B3C55E8642BB192D71A6D8B7F7)] |
| Item 11. | Executive Compensation | [removed: [79](#s162009BBED00A0031C5F2E3E2E1AF559)] [added: [72](#sC3A7809735C1FE1AED632D71A70B32F6)] |
| Item 12. | Security Ownership of Certain Beneficial Owners and Management and Related Stockholder Matters | [removed: [79](#s15C98D8E1B91D032E33D2E3E2E3B0A0D)] [added: [72](#s68C66C127A820D51070C2D71A72D7A38)] |
| Item 13. | Certain Relationships and Related Transactions, and Director Independence | [removed: [79](#s4FBC49203F6C520206502E3E2E6CC747)] [added: [72](#s276674C3321915DE12282D71A76002E6)] |
| Item 14. | Principal Accounting Fees and Services | [removed: [79](#s121DF91AC85CF2BC118F2E3E2E8F6BFA)] [added: [72](#sC8535A36F2E5CEE8F83C2D71A7808DC9)] |
| Item 15. | Exhibits and Financial Statement Schedules | [removed: [80](#s78E069520CBD5B07637C2E3E2EE2872F)] [added: [73](#sDADCB8234E3AA75A05412D71A7D3E672)] |
| Exhibit Index | | [removed: [82](#s0FA31C9C06D3FD7251292E3E2F3561B9)] [added: [75](#sCA9AE4CC8CDCA6EFABE62D71A8260222)] |
10-K 1 itw-20151231x10k.htm 10-K
| 1.25% Euro Notes due 2023 | | New York Stock Exchange |
| 2.125% Euro Notes due 2030 | | New York Stock Exchange |
Shares of Common Stock outstanding at January 31, 2016: 363,766,897.
| Signatures | | [74](#sCA5C9265B813940B66922D71A804BE64) |
10-K 1 itw-20141231x10k.htm 10-K
Shares of Common Stock outstanding at January 31, 2015: 379,447,026.
| Signatures | | [81](#s2DD3267A9FE85E2133962E3E2F14DCB9) |
Item 2. Properties
10 rewritten, 1 added, 1 removed, 11 unchanged
As of December 31, [removed: 2014,] [added: 2015,] the Company operated the following plants and office facilities, excluding regional sales offices and warehouse facilities:
| Automotive OEM | | [removed: 61] [added: 53] | | | [removed: 31] [added: 38] | | | [removed: 92] [added: 91] | |
| Test & Measurement and Electronics | | [removed: 27] [added: 24] | | | [removed: 71] [added: 73] | | | [removed: 98] [added: 97] | |
| Food Equipment | | [removed: 22] [added: 19] | | | 18 | | | [removed: 40] [added: 37] | |
| Polymers & Fluids | | [removed: 40] [added: 26] | | | [removed: 38] [added: 46] | | | [removed: 78] [added: 72] | |
| Welding | | [removed: 27] [added: 25] | | | [removed: 25] [added: 22] | | | [removed: 52] [added: 47] | |
| Construction Products | | [removed: 36] [added: 32] | | | [removed: 32] [added: 24] | | | [removed: 68] [added: 56] | |
| Specialty Products | | [removed: 52] [added: 44] | | | [removed: 41] [added: 47] | | | [removed: 93] [added: 91] | |
| Corporate | | [removed: 2] [added: 1] | | | [removed: 11] [added: 10] | | | [removed: 13] [added: 11] | |
The Company operated [removed: 328] [added: 314] plants and office facilities outside of the U.S. Principal countries include [removed: Australia, Brazil, Canada,] China, [removed: Czech Republic,] France, [removed: Germany, India, Italy, Mexico, Spain,] [added: Germany] and the United Kingdom.
| Total | | 224 | | | 278 | | | 502 | |
| Total | | 267 | | | 267 | | | 534 | |
Item 5. Market for Registrant’s Common Equity, Related Stockholder Matters and Issuer Purchases of Equity Securities
5 rewritten, 21 added, 14 removed, 12 unchanged
Quarterly market price and dividend data for [removed: 2014] [added: 2015] and [removed: 2013] [added: 2014] were as shown below:
There were approximately [removed: 7,185] [added: 6,822] holders of record of common stock as of January 31, [removed: 2015.][added: 2016.]
[removed: ][added: 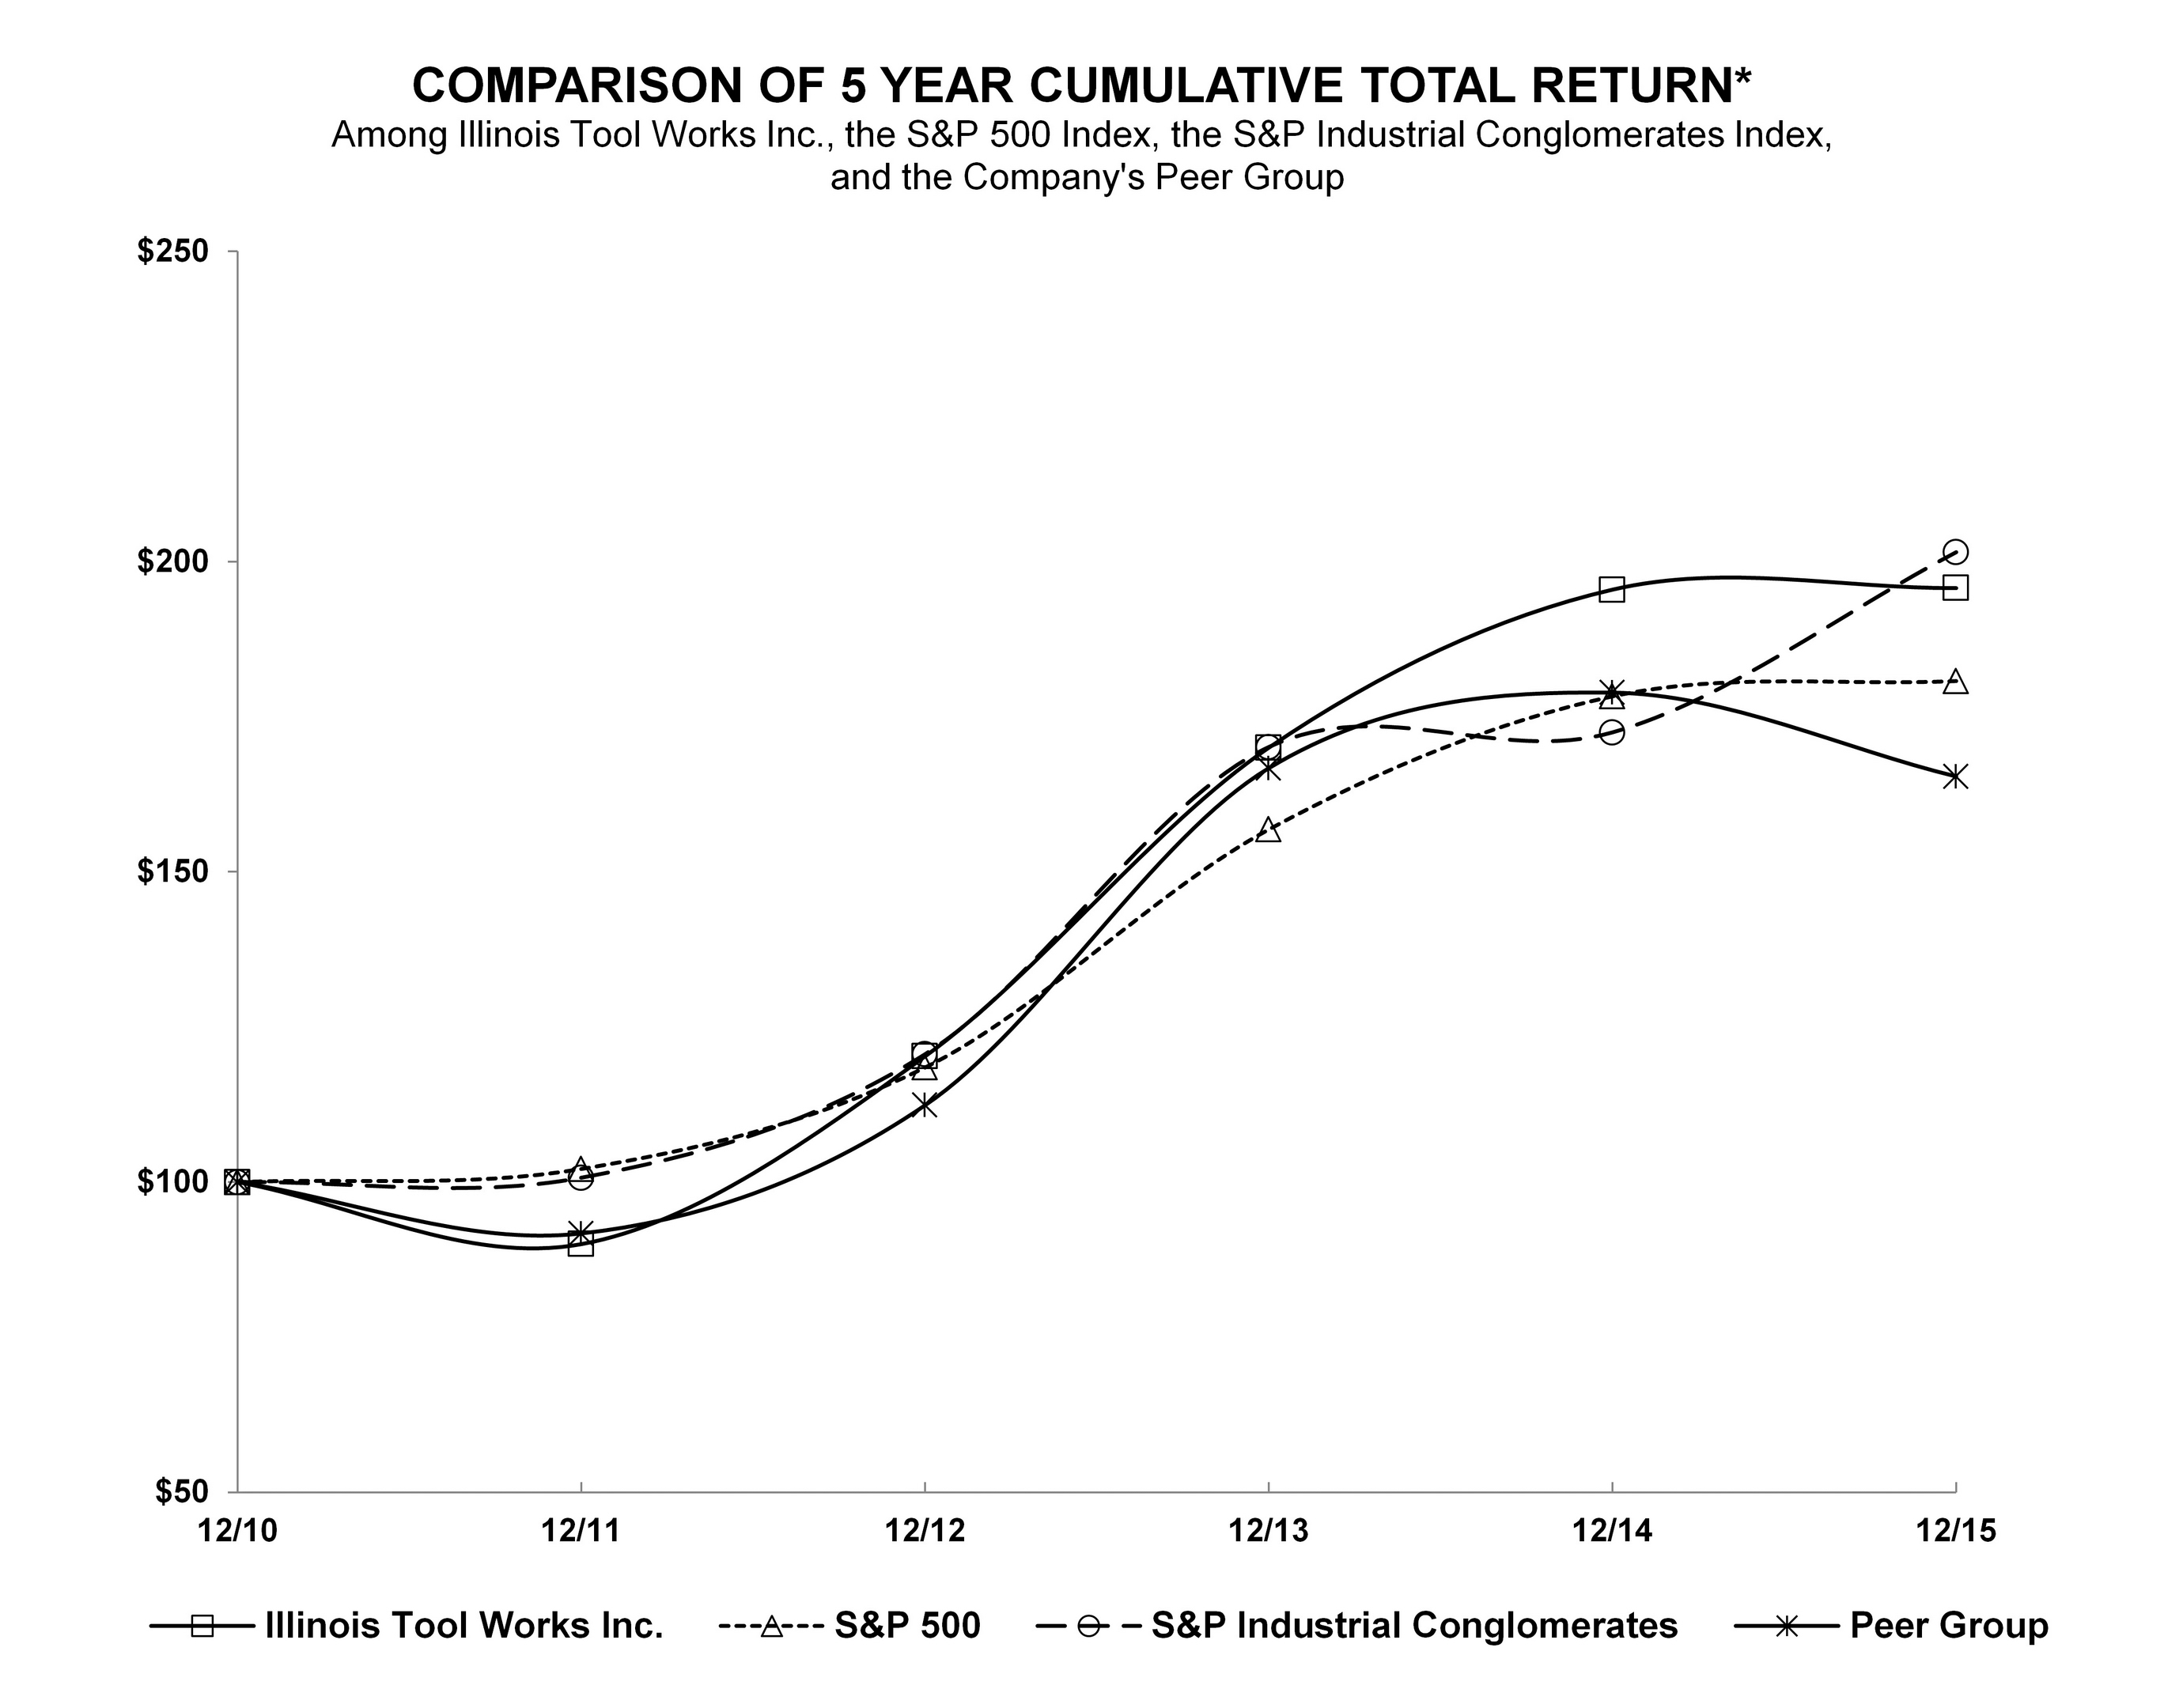]
Repurchases of Common Stock—On [removed: August 2, 2013,] [added: February 13, 2015,] the Company’s Board of Directors authorized a stock repurchase program which provides for the [removed: buyback] [added: repurchase] of up to $6.0 billion of the Company’s common stock over an open-ended period of time (the [removed: "2013] [added: "2015] Program").
[removed: Share] [added: There was no share] repurchase activity under the [removed: Company’s] [added: Company's] share repurchase program for the fourth quarter of [removed: 2014 was as follows:][added: 2015.]
| 2015: | | | | | | | | | | | |
| Fourth quarter | $ | 95.00 | | | $ | 80.16 | | | $ | 0.55 | |
| Third quarter | 94.33 | | | | 78.79 | | | | 0.55 | | |
| Second quarter | 99.92 | | | | 91.41 | | | | 0.485 | | |
| First quarter | 100.14 | | | | 90.43 | | | | 0.485 | | |
*Assumes $100 invested on 12/31/10 in stock or index, including reinvestment of dividends.
Fiscal year ended December 31.
Copyright© 2016 S&P, a division of McGraw Hill Financial.
All rights reserved.
In 2015, the Company replaced the S&P Industrial Conglomerates index with the following group of 19 public companies which represents the Company's peer group:
| | | |
| --- | --- | --- |
| | | |
| 3M Company | E.I. du Pont de Nemours and Company | Masco Corporation |
| BorgWarner Inc. | Eaton Corporation plc | Parker-Hannifin Corporation |
| Caterpillar Inc. | Emerson Electric Co. | PPG Industries, Inc. |
| Cummins Inc. | Honeywell International Inc. | Pentair plc |
| Danaher Corporation | Ingersoll-Rand plc | Stanley Black & Decker, Inc. |
| Deere & Company | Johnson Controls, Inc. | Textron Inc. |
| Dover Corporation | | |
As of December 31, 2015, there were approximately $5.4 billion of authorized repurchases remaining under the 2015 Program.
| 2013: | | | | | | | | | | | |
| Fourth quarter | $ | 84.32 | | | $ | 73.60 | | | $ | 0.42 | |
| Third quarter | 78.56 | | | | 68.16 | | | | 0.42 | | |
| Second quarter | 71.74 | | | | 60.02 | | | | 0.38 | | |
| First quarter | 65.60 | | | | 59.71 | | | | 0.38 | | |
As of December 31, 2014, approximately $1.4 billion of share repurchases remain outstanding under this program.
| | | | | | | | | | | | | | |
| --- | --- | --- | --- | --- | --- | --- | --- | --- | --- | --- | --- | --- | --- |
| In millions except per share amounts | | | | | | | | | | | | | |
| Period | Total Number of Shares Purchased | | | Average Price Paid Per Share | | | | Total Number of Shares Purchased as Part of Publicly Announced Program | | | Maximum Value of Shares That May Yet Be Purchased Under Program | | |
| October 2014 | 3.5 | | | $ | 86.29 | | | 3.5 | | | $ | 1,953 | |
| November 2014 | 4.4 | | | $ | 93.52 | | | 4.4 | | | $ | 1,544 | |
| December 2014 | 1.0 | | | $ | 94.80 | | | 1.0 | | | $ | 1,448 | |
| Total | 8.9 | | | | | | | 8.9 | | | | | |
Item 6. Selected Financial Data
11 rewritten, 18 added, 5 removed, 11 unchanged
| In millions except per share amounts | [removed: 2014] [added: 2015] | | | | [removed: 2013] [added: 2014] | | | | [removed: 2012] [added: 2013] | | | | [removed: 2011] [added: 2012] | | | | [removed: 2010] [added: 2011] | | |
| Operating [removed: revenues] [added: revenue] | $ | [removed: 14,484] [added: 13,405] | | | $ | [removed: 14,135] [added: 14,484] | | | $ | [removed: 14,791] [added: 14,135] | | | $ | [removed: 14,515] [added: 14,791] | | | $ | [removed: 12,625] [added: 14,515] | |
| Income from continuing operations | [removed: 1,890] [added: 1,899] | | | | [removed: 1,630] [added: 1,890] | | | | [removed: 2,233] [added: 1,630] | | | | [removed: 1,775] [added: 2,233] | | | | [removed: 1,258] [added: 1,775] | | |
| Basic | [removed: 4.70] [added: 5.16] | | | | [removed: 3.65] [added: 4.70] | | | | [removed: 4.75] [added: 3.65] | | | | [removed: 3.61] [added: 4.75] | | | | [removed: 2.51] [added: 3.61] | | |
| Diluted | [removed: 4.67] [added: 5.13] | | | | [removed: 3.63] [added: 4.67] | | | | [removed: 4.72] [added: 3.63] | | | | [removed: 3.59] [added: 4.72] | | | | [removed: 2.50] [added: 3.59] | | |
| Cash dividends declared per common share | [removed: 1.81] [added: 2.07] | | | | [removed: 1.60] [added: 1.81] | | | | [removed: 1.48] [added: 1.60] | | | | [removed: 1.40] [added: 1.48] | | | | [removed: 1.30] [added: 1.40] | | |
Certain reclassifications of prior year data have been made to conform to current year reporting, including discontinued operations [added: and adoption of new accounting guidance] as discussed below.
For businesses reported as discontinued operations in the statement of [removed: income,] [added: income prior to adoption,] all related prior period income statement information has been [removed: restated to conform to the current year reporting of these businesses.][added: restated.]
Income from discontinued operations was $1.1 billion, $49 million, $637 million, [removed: $296 million,] and [removed: $245] [added: $296] million in the years 2014, 2013, 2012, [removed: 2011,] and [removed: 2010,] [added: 2011,] respectively.
Financial Statements and Supplementary Data for further [removed: discussion of this transaction.][added: information.]
[removed: Information] [added: Additional information] on the comparability of results is included in Item 7.
| Total assets at year-end | 15,729 | | | | 17,465 | | | | 19,599 | | | | 19,138 | | | | 17,946 | | |
| Long-term debt at year-end | 6,896 | | | | 5,943 | | | | 2,771 | | | | 4,564 | | | | 3,471 | | |
In April 2014, the Financial Accounting Standards Board ("FASB") issued authoritative guidance to change the criteria for reporting discontinued operations.
Under the new guidance, only disposals representing a strategic shift in a company's operations and financial results should be reported as discontinued operations.
In addition, disclosure of the pre-tax income attributable to a disposal of a significant part of an organization that does not qualify as a discontinued operation is required.
The Company adopted this new guidance effective January 1, 2015.
The new guidance applies prospectively to new disposals and new classifications of disposal groups held for sale after such date.
There were no discontinued operations during 2015 under this new accounting guidance.
In April 2015, the FASB issued authoritative guidance to simplify the balance sheet presentation of long-term debt issuance costs.
Under the new guidance, long-term debt issuance costs are presented as a reduction of the carrying amount of the related long-term debt.
The Company early adopted this guidance in the fourth quarter of 2015 and restated $38 million, $22
million, $26 million, and $17 million of deferred long-term debt issuance costs from Other assets to Long-term debt in the years 2014, 2013, 2012, and 2011, respectively.
Refer to the Debt note in Item 8.
In November 2015, the FASB issued authoritative guidance to simplify the presentation of deferred taxes.
Under the new guidance, all deferred tax assets and liabilities are presented as noncurrent in the statement of financial position.
Early adoption of this guidance in the fourth quarter of 2015 decreased total assets by $175 million, $345 million, $145 million, and $21 million in the years 2014, 2013, 2012, and 2011, respectively.
Refer to the Income Taxes note in Item 8.
Financial Statements and Supplementary Data for further information.
| Total assets at year-end | 17,678 | | | | 19,966 | | | | 19,309 | | | | 17,984 | | | | 16,412 | | |
| Long-term debt at year-end | 5,981 | | | | 2,793 | | | | 4,589 | | | | 3,488 | | | | 2,542 | | |
The Company periodically reviews its operations for businesses that may no longer be aligned with its enterprise initiatives and long-term objectives.
As a result, the Company may commit to a plan to exit or dispose of certain businesses and present them as discontinued operations.
See the Divestiture of Majority Interest in Former Decorative Surfaces Segment note in Item 8.
Item 8. Financial Statements and Supplementary Data
597 rewritten, 143 added, 183 removed, 497 unchanged
ITW management assessed the effectiveness of the Company’s internal control over financial reporting as of December 31, [removed: 2014.][added: 2015.]
Based on our assessment we believe that, as of December 31, [removed: 2014,] [added: 2015,] the Company’s internal control over financial reporting is effective based on those criteria.
The effectiveness of the Company’s internal control over financial reporting as of December 31, [removed: 2014] [added: 2015] has been audited by Deloitte & Touche LLP, an independent registered public accounting firm, as stated in their report herein.
| /s/ E. Scott Santi E. Scott Santi [removed: President] [added: Chairman] & Chief Executive Officer February [removed: 13, 2015] [added: 11, 2016] | | /s/ Michael M. Larsen Michael M. Larsen Senior Vice President & Chief Financial Officer February [removed: 13, 2015] [added: 11, 2016] |
Glenview, [removed: IL][added: Illinois]
We have audited the accompanying consolidated statements of financial position of Illinois Tool Works Inc. and subsidiaries (the "Company") as of December 31, [removed: 2014] [added: 2015] and [removed: 2013,] [added: 2014,] and the related consolidated statements of income, comprehensive income, income reinvested in the business, and cash flows for each of the three years in the period ended December 31, [removed: 2014.][added: 2015.]
We also have audited the Company's internal control over financial reporting as of December 31, [removed: 2014,] [added: 2015,] based on criteria established in Internal Control - Integrated Framework (2013) issued by the Committee of Sponsoring Organizations of the Treadway Commission.
In our opinion, the consolidated financial statements referred to above present fairly, in all material respects, the financial position of Illinois Tool Works Inc. and [removed: Subsidiaries] [added: subsidiaries] as of December 31, [removed: 2014] [added: 2015] and [removed: 2013,] [added: 2014,] and the results of their operations and their cash flows for each of the three years in the period ended December 31, [removed: 2014,] [added: 2015,] in conformity with accounting principles generally accepted in the United States of America.
Also, in our opinion, the Company maintained, in all material respects, effective internal control over financial reporting as of December 31, [removed: 2014,] [added: 2015,] based on the criteria established in Internal Control - Integrated Framework (2013) issued by the Committee of Sponsoring Organizations of the Treadway Commission.
| In millions except per share amounts | [removed: 2014] [added: 2015] | | | | [removed: 2013] [added: 2014] | | | | [removed: 2012] [added: 2013] | | |
| Operating [removed: Revenues] [added: Revenue] | $ | [removed: 14,484] [added: 13,405] | | | $ | [removed: 14,135] [added: 14,484] | | | $ | [removed: 14,791] [added: 14,135] | |
| Cost of [removed: revenues] [added: revenue] | [removed: 8,673] [added: 7,888] | | | | [removed: 8,554] [added: 8,673] | | | | [removed: 9,134] [added: 8,554] | | |
| Selling, administrative, and research and development expenses | [removed: 2,678] [added: 2,417] | | | | [removed: 2,815] [added: 2,678] | | | | [removed: 2,928] [added: 2,815] | | |
| Amortization of intangible assets | [removed: 242] [added: 231] | | | | [removed: 250] [added: 242] | | | | [removed: 252] [added: 250] | | |
| Impairment of goodwill and other intangible assets | [removed: 3] [added: 2] | | | | [removed: 2] [added: 3] | | | | 2 | | |
| Operating Income | [removed: 2,888] [added: 2,867] | | | | [removed: 2,514] [added: 2,888] | | | | [removed: 2,475] [added: 2,514] | | |
| Interest expense | [removed: (250] [added: (226] | | ) | | [removed: (239] [added: (250] | | ) | | [removed: (213] [added: (239] | | ) |
| Other income (expense) | [removed: 61] [added: 78] | | | | [removed: 72] [added: 61] | | | | [removed: 11] [added: 72] | | |
| Income from Continuing Operations Before Income Taxes | [removed: 2,699] [added: 2,719] | | | | [removed: 2,347] [added: 2,699] | | | | [removed: 3,206] [added: 2,347] | | |
| Income taxes | [removed: 809] [added: 820] | | | | [removed: 717] [added: 809] | | | | [removed: 973] [added: 717] | | |
| Income from Continuing Operations | [removed: 1,890] [added: 1,899] | | | | [removed: 1,630] [added: 1,890] | | | | [removed: 2,233] [added: 1,630] | | |
| Income from Discontinued Operations | [removed: 1,056] [added: —] | | | | [removed: 49] [added: 1,056] | | | | [removed: 637] [added: 49] | | |
| Net Income | $ | [removed: 2,946] [added: 1,899] | | | $ | [removed: 1,679] [added: 2,946] | | | $ | [removed: 2,870] [added: 1,679] | |
| Basic | $ | [removed: 4.70] [added: 5.16] | | | $ | [removed: 3.65] [added: 4.70] | | | $ | [removed: 4.75] [added: 3.65] | |
| Diluted | $ | [removed: 4.67] [added: 5.13] | | | $ | [removed: 3.63] [added: 4.67] | | | $ | [removed: 4.72] [added: 3.63] | |
| Basic | $ | [removed: 2.63] [added: —] | | | $ | [removed: 0.11] [added: 2.63] | | | $ | [removed: 1.36] [added: 0.11] | |
| Diluted | $ | [removed: 2.61] [added: —] | | | $ | [removed: 0.11] [added: 2.61] | | | $ | [removed: 1.35] [added: 0.11] | |
| Basic | $ | [removed: 7.33] [added: 5.16] | | | $ | [removed: 3.76] [added: 7.33] | | | $ | [removed: 6.11] [added: 3.76] | |
| Diluted | $ | [removed: 7.28] [added: 5.13] | | | $ | [removed: 3.74] [added: 7.28] | | | $ | [removed: 6.06] [added: 3.74] | |
| In millions | [removed: 2014] [added: 2015] | | | | [removed: 2013] [added: 2014] | | | | [removed: 2012] [added: 2013] | | |
| Other Comprehensive [removed: Income:] [added: Income (Loss):] | | | | | | | | | | | |
| [removed: Foreign] [added: Total foreign] currency translation adjustments | [removed: (939] | [added: (860] | [added: |] ) | | [removed: (193] [added: (939] | | ) | | [removed: 94] [added: (193] | | [added: )] |
| Pension and other postretirement benefit adjustments, net of tax | [removed: (103] [added: 14] | | [removed: )] | | [removed: 284] [added: (103] | | [added: )] | | [removed: (25] [added: 284] | | [removed: )] |
| Comprehensive Income | $ | [removed: 1,904] [added: 1,053] | | | $ | [removed: 1,770] [added: 1,904] | | | $ | [removed: 2,939] [added: 1,770] | |
| Beginning Balance | $ | [removed: 14,943] [added: 17,173] | | | $ | [removed: 13,973] [added: 14,943] | | | $ | [removed: 11,794] [added: 13,973] | |
| Net [removed: income] [added: Income] | [removed: 2,946] [added: $] | [added: 1,899] | | | [removed: 1,679] [added: $] | [added: 2,946] | | | [removed: 2,870] [added: $] | [added: 1,679] | |
| Cash dividends declared | [removed: (716] [added: (756] | | ) | | [removed: (709] [added: (716] | | ) | | [removed: (691] [added: (709] | | ) |
| Ending Balance | $ | [removed: 17,173] [added: 18,316] | | | $ | [removed: 14,943] [added: 17,173] | | | $ | [removed: 13,973] [added: 14,943] | |
| In millions except shares | [removed: 2014] [added: 2015] | | | | [removed: 2013] [added: 2014] | | |
| Cash and equivalents | $ | [removed: 3,990] [added: 3,090] | | | $ | [removed: 3,618] [added: 3,990] | |
| Net income | 1,899 | | | | 2,946 | | | | 1,679 | | |
| Other assets | 1,087 | | | | 1,111 | | |
| | $ | 15,729 | | | $ | 17,465 | |
| | $ | 15,729 | | | $ | 17,465 | |
| Net income | $ | 1,899 | | | $ | 2,946 | | | $ | 1,679 | |
There were no discontinued operations during 2015 under this new accounting guidance.
For businesses reported as discontinued operations in the statement of income prior to adoption, all related prior period income statement information has been restated.
No goodwill recorded for acquisitions during 2015 will be tax deductible.
| | $ | 297 | |
| | | $ | 78 | | | $ | 61 | | | $ | 72 | |
Equity income (loss) in Wilsonart is related to the Company's 49% ownership interest in Wilsonart International Holdings LLC accounted for under the equity method of accounting.
Refer to the Other Assets note for further information regarding this investment.
| | | 58 | | | | 59 | | | | 48 | | |
In November 2015, the FASB issued authoritative guidance to simplify the presentation of deferred taxes.
Under the new guidance, all deferred tax assets and liabilities are presented as noncurrent in the statement of financial position.
The Company early adopted this guidance in the fourth quarter of 2015 and applied it retrospectively to all periods presented.
Due to the restatement of current deferred tax assets and liabilities to noncurrent, adoption of this guidance resulted in an increase of noncurrent deferred tax assets of $37 million and a decrease of noncurrent deferred tax liabilities of $167 million as of December 31, 2014.
| 2020 | 80 | | |
| 2023-2035 | 52 | | |
| | $ | 2,362 | |
| France | | 2013-2015 |
| Australia | | 2011-2015 |
| Weighted-average common shares | | 367.9 | | | | 401.7 | | | | 446.2 | | |
Cash and Equivalents include cash on hand and instruments having original maturities of three months or less.
Trade Receivables are net of allowances for uncollectible accounts, including reserves for customer credits and cash discounts.
| In millions | | 2015 | | | | 2014 | | |
| | | $ | 1,086 | | | $ | 1,180 | |
| In millions | | 2015 | | | | 2014 | | |
| | | $ | 341 | | | $ | 401 | |
| In millions | | 2015 | | | | 2014 | | |
| | | | | | | | | | | | | | | | | | | | | | | | | | | | | | | | |
| --- | --- | --- | --- | --- | --- | --- | --- | --- | --- | --- | --- | --- | --- | --- | --- | --- | --- | --- | --- | --- | --- | --- | --- | --- | --- | --- | --- | --- | --- | --- | --- |
| | | | | | | | | | | | | | | | | | | | | | | | | | | | | | | | |
| 2015 activity: | | | | | | | | | | | | | | | | | | | | | | | | | | | | | | | |
| Balance, December 31, 2015 | $ | 277 | | | $ | 1,355 | | | $ | 259 | | | $ | 894 | | | $ | 261 | | | $ | 516 | | | $ | 877 | | | $ | 4,439 | |
| | | 2015 | | | | | | | | | | | | 2014 | | | | | | | | | | |
| Other | | 475 | | | | (446 | | ) | | 29 | | | | 471 | | | | (430 | | ) | | 41 | | |
| 2016 | $ | 217 | |
| 2017 | 196 | | |
| 2019 | 153 | | |
February 13, 2015
| Gain on sale of interest in Decorative Surfaces | — | | | | — | | | | 933 | | |
| Other assets | 1,149 | | | | 1,197 | | |
| | $ | 17,678 | | | $ | 19,966 | |
| Change in deferred income taxes | 55 | | | | 6 | | | | 243 | | |
| Supplementary Non-Cash Investing Information: | | | | | | | | | | | |
The transaction closed on October 31, 2012 resulting in a pre-tax gain of $933 million ($632 million after-tax) in the fourth quarter of 2012.
Under the terms of the Investment Agreement, the Company contributed the assets and stock of the Decorative Surfaces segment to a newly formed entity, Wilsonart International Holdings LLC ("Wilsonart").
Through a combination of CD&R’s equity investment in Wilsonart and new third party borrowings by a subsidiary of Wilsonart, the Company and its subsidiaries received payments of approximately $1.05 billion from Wilsonart and its subsidiaries as well as common units (the "Common Units") initially representing approximately 49% (on an as-converted basis) of the total outstanding equity of Wilsonart immediately following the closing of the transaction.
As of October 31, 2012, the Company ceased consolidating the results of the Decorative Surfaces segment and now reports its ownership interest in Wilsonart using the equity method of accounting.
The Company recorded its initial equity investment in Wilsonart at fair value.
The fair value was determined using an implied equity value approach, which is a Level 3 valuation method.
Under this approach, the total equity of Wilsonart was valued using an option pricing model and the value of the Preferred Units was deducted to arrive at the implied equity value of the Common Units.
The significant unobservable inputs utilized in this calculation were the expected term of the investment and assumed volatility during the term.
The Company also applied a discount factor to the implied equity value of the Common Units due to the lack of marketability of the Common Units.
The fair value of the Company’s retained ownership interest was determined to be $204 million and resulted in a pre-tax gain of $51 million related to the retained interest, which was included in the pre-tax gain noted above.
The Company’s equity investment in Wilsonart is reported in Other assets in the consolidated statement of financial position.
The Company recorded a pre-tax loss of $30 million for the two-month period ended December 31, 2012 in Other income (expense) primarily due to transaction costs related to the formation of Wilsonart and the impact of purchase accounting.
The Company recorded pre-tax losses of $9
million and $14 million for the years ended December 31, 2014 and 2013, respectively, in Other income (expense) related to its interest in Wilsonart.
Additionally, as of November 1, 2012, the operating results of Decorative Surfaces are no longer reviewed by senior management of the Company and therefore, effective the fourth quarter of 2012, Decorative Surfaces was no longer a reportable segment of the Company.
Historical operating results of the former Decorative Surfaces segment for 2012 were as follows:
| | | | | |
| --- | --- | --- | --- | --- |
| In millions | | For the Ten Months Ended October 31, 2012 | | |
| Operating revenues | | $ | 921 | |
| Operating income | | 143 | | |
Discontinued Operations—The Company periodically reviews its operations for businesses that may no longer be aligned with its enterprise initiatives and long-term objectives.
As a result, the Company may commit to a plan to exit or dispose of certain businesses and present them as discontinued operations.
The following summarizes the Company’s discontinued operations.
The Company classified the Industrial Packaging segment as held for sale beginning in the third quarter of 2013 and no longer presented this segment as part of its continuing operations.
On February 6, 2014, the Company announced that it had signed a definitive agreement to sell its Industrial Packaging business to The Carlyle Group for $3.2 billion.
The transaction was completed on May 1, 2014, resulting in a pre-tax gain of $1.7 billion ($1.1 billion after-tax) in the second quarter of 2014 which was included in Income from discontinued operations.
The Company also reclassified certain previously divested businesses as discontinued operations in the first quarter of 2013.
These included a consumer packaging business that was previously included in the Specialty Products segment, a packaging distribution business which was previously included in the former Industrial Packaging segment, and a welding manufacturing business previously included in the Welding segment.
2011 Discontinued Operations\-In April 2011, the Company entered into a definitive agreement to sell its finishing group of businesses included within the Specialty Products segment to Graco Inc. in a $650 million cash transaction.
The sale of the finishing business to Graco was completed on April 2, 2012.
Additionally, in the second quarter of 2011, the Company’s Board of Directors approved plans to divest a consumer packaging business in the Specialty Products segment.
The consumer packaging business was sold in the third quarter of 2012.
| | | | | | | | | | | | | |
An excerpt. Shown here: 40 of 597 rewritten, 40 of 143 added and 40 of 183 removed. The counts are complete. For every sentence, read Item 8. Financial Statements and Supplementary Data in the FY2015 filing and the FY2014 filing.
Item 9A. Controls and Procedures
3 rewritten, 0 added, 0 removed, 4 unchanged
The Company’s management, with the participation of the Company’s [removed: President] [added: Chairman] & Chief Executive Officer and Senior Vice President & Chief Financial Officer, has evaluated the effectiveness of the Company’s disclosure controls and procedures (as defined in Exchange Act Rule 13a-15(e)) as of December 31, [removed: 2014.][added: 2015.]
Based on such evaluation, the Company’s [removed: President] [added: Chairman] & Chief Executive Officer and Senior Vice President & Chief Financial Officer have concluded that, as of December 31, [removed: 2014,] [added: 2015,] the Company’s disclosure controls and procedures were effective.
In connection with the evaluation by management, including the Company’s [removed: President] [added: Chairman] & Chief Executive Officer and Senior Vice President & Chief Financial Officer, no changes in the Company’s internal control over financial reporting (as defined in Exchange Act Rule 13a-15(f)) during the quarter ended December 31, [removed: 2014] [added: 2015] were identified that have materially affected or are reasonably likely to materially affect the Company’s internal control over financial reporting.
Item 10. Directors, Executive Officers and Corporate Governance
4 rewritten, 0 added, 0 removed, 1 unchanged
Information regarding the Directors of the Company is incorporated by reference from the information under the captions "Election of Directors" and "Corporate Governance Policies and Practices" in the Company’s Proxy Statement for the [removed: 2015] [added: 2016] Annual Meeting of Stockholders.
Information regarding the Audit Committee and its Financial Experts is incorporated by reference from the information under the captions "Board of Directors and Its Committees" and "Audit Committee Report" in the Company’s Proxy Statement for the [removed: 2015] [added: 2016] Annual Meeting of Stockholders.
Information regarding compliance with Section 16(a) of the Exchange Act is incorporated by reference from the information under the caption "Section 16(a) Beneficial Ownership Reporting Compliance" in the Company’s Proxy Statement for the [removed: 2015] [added: 2016] Annual Meeting of Stockholders.
Information regarding the Company’s code of ethics that applies to the Company’s [removed: President] [added: Chairman] & Chief Executive Officer, Senior Vice President & Chief Financial Officer, and key financial and accounting personnel is incorporated by reference from the information under the caption "Corporate Governance Policies and Practices" in the Company’s Proxy Statement for the [removed: 2015] [added: 2016] Annual Meeting of Stockholders.
Item 11. Executive Compensation
1 rewritten, 0 added, 0 removed, 0 unchanged
This information is incorporated by reference from the information under the captions [removed: "Executive] [added: "NEO] Compensation," "Director Compensation," "Compensation Discussion and Analysis" and "Compensation Committee Report" in the Company’s Proxy Statement for the [removed: 2015] [added: 2016] Annual Meeting of Stockholders.
Item 12. Security Ownership of Certain Beneficial Owners and Management and Related Stockholder Matters
1 rewritten, 0 added, 0 removed, 0 unchanged
This information is incorporated by reference from the information under the captions "Ownership of ITW Stock" and "Equity Compensation Plan Information" in the Company’s Proxy Statement for the [removed: 2015] [added: 2016] Annual Meeting of Stockholders.
Item 13. Certain Relationships and Related Transactions, and Director Independence
2 rewritten, 0 added, 0 removed, 0 unchanged
Information regarding certain relationships and related transactions is incorporated by reference from the information under the captions "Ownership of ITW Stock," "Certain Relationships and Related Transactions" and "Corporate Governance Policies and Practices" in the Company’s Proxy Statement for the [removed: 2015] [added: 2016] Annual Meeting of Stockholders.
Information regarding director independence is incorporated by reference from the information under the captions "Corporate Governance Policies and Practices" and "Categorical Standards for Director Independence" in the Company’s Proxy Statement for the [removed: 2015] [added: 2016] Annual Meeting of Stockholders.
Item 14. Principal Accounting Fees and Services
1 rewritten, 0 added, 0 removed, 1 unchanged
This information is incorporated by reference from the information under the captions "Ratification of the Appointment of Independent Registered Public Accounting Firm" and "Audit Fees" in the Company’s Proxy Statement for the [removed: 2015] [added: 2016] Annual Meeting of Stockholders.
Item 15. Exhibits and Financial Statement Schedules
28 rewritten, 2 added, 10 removed, 152 unchanged
(ii) Pursuant to Regulation S-K, Item 601(b)(4)(iii), the Company has not filed with Exhibit 4 any debt instruments for which the total amount of securities authorized thereunder is less than 10% of the total assets of the Company and its subsidiaries on a consolidated basis as of December 31, [removed: 2014,] [added: 2015,] with the exception of the Officers' Certificates related to the 0.90% Notes due 2017, the 1.95% Notes due 2019, the 6.25% Notes due 2019, the 3.375% Notes due 2021, the 1.75% Euro Notes due 2022, the [added: 1.25% Euro Notes due 2023, the] 3.50% Notes due 2024, the [added: 2.125% Euro Notes due 2030, the] 3.00% Euro Notes due 2034, the 4.875% Notes due 2041, and the 3.90% Notes due 2042, which are described as Exhibit numbers 4(a) through [removed: (g)] [added: (h)] in the Exhibit Index.
Pursuant to the requirements of Section 13 or 15(d) of the Securities Exchange Act of 1934, the registrant has duly caused this report to be signed on its behalf by the undersigned, thereunto duly authorized on this [removed: 13th] [added: 11th] day of February [removed: 2015.][added: 2016.]
| | | [removed: President] [added: Chairman] & Chief Executive Officer |
Pursuant to the requirements of the Securities Exchange Act of 1934, this report has been signed by the following persons on behalf of the registrant and in the capacities indicated on this [removed: 13th] [added: 11th] day of February [removed: 2015.][added: 2016.]
| /s/ E. SCOTT SANTI | | [removed: President] [added: Chairman] & Chief Executive Officer, Director |
| ROBERT [removed: C. MCCORMACK] [added: S. MORRISON] | | Director |
| 3(b) | | By-laws of Illinois Tool Works Inc., as amended and restated as of [removed: August 8, 2014,] [added: December 11, 2015,] filed as Exhibit [removed: 3] [added: 3(b)(ii)] to the Company’s Form 8-K filed on [removed: August 8, 2014] [added: December 17, 2015] (Commission File No. 1-4797) and incorporated herein by reference. |
| 4(e) | | Officers' Certificate dated August 28, 2012, establishing the terms, and setting forth the forms, of the 3.9% Notes due 2042, filed as Exhibit 4.1 to the Company's Current Report on Form 8-K filed on August 28, 2012 (Commission File No. [removed: 1-4797)] [added: 001-4797)] and incorporated herein by reference. |
| [removed: 10(e)*] [added: 10(f)*] | | Form of stock option terms filed as Exhibit 10(o) to the Company’s Annual Report on Form 10-K for the fiscal year ended December 31, 2007 (Commission File No. 1-4797) and incorporated herein by reference. |
| [removed: 10(f)*] [added: 10(g)*] | | Form of stock option terms filed as Exhibit 99.1 to the Company’s Current Report on Form 8-K filed on February 5, 2009 (Commission File No. 1-4797) and incorporated herein by reference. |
| [removed: 10(g)*] [added: 10(h)*] | | Form of stock option terms filed as Exhibit 99.1 to the Company’s Current Report on Form 8-K filed on February 9, 2011 (Commission File No. 1-4797) and incorporated herein by reference. |
| [removed: 10(h)*] [added: 10(i)*] | | Form of stock option terms filed as Exhibit 99.1 to the Company’s Current Report on Form 8-K filed on February 7, 2012 (Commission File No. 1-4797) and incorporated herein by reference. |
| [removed: 10(i)*] [added: 10(j)*] | | Form of stock option terms filed as Exhibit 99.1 to the Company’s Current Report on Form 8-K filed on February 13, 2014 (Commission File No. 1-4797) and incorporated herein by reference. |
| [removed: 10(j)*] [added: 10(o)*] | | Form of restricted stock unit terms filed as Exhibit 99.2 to the [removed: Company’s] [added: Company's] Current Report on Form 8-K filed on February [removed: 7, 2012] [added: 9, 2016] (Commission File No. 1-4797) and incorporated herein by reference. |
| 10(l)* | | Form of performance restricted stock unit terms filed as Exhibit 99.3 to the Company’s Current Report on Form 8-K filed on February [removed: 7, 2012] [added: 13, 2014] (Commission File No. 1-4797) and incorporated herein by reference. |
| [removed: 10(m)*] [added: 10(p)*] | | Form of performance restricted stock unit terms filed as Exhibit 99.3 to the [removed: Company’s] [added: Company's] Current Report on Form 8-K filed on February [removed: 13, 2014] [added: 9, 2016] (Commission File No. 1-4797) and incorporated herein by reference. |
| [removed: 10(n)*] [added: 10(m)*] | | Form of [removed: company-wide growth plan grant] [added: Long-Term Incentive Cash Grant] filed as Exhibit 99.4 to the Company’s Current Report on Form 8-K filed on February [removed: 7, 2012] [added: 13, 2014] (Commission File No. 1-4797) and incorporated herein by reference. |
| [removed: 10(o)*] [added: 10(q)*] | | Form of Long-Term Incentive Cash Grant filed as Exhibit 99.4 to the [removed: Company’s] [added: Company's] Current Report on Form 8-K filed on February [removed: 13, 2014] [added: 9, 2016] (Commission File No. 1-4797) and incorporated herein by reference. |
| [removed: 10(p)*] [added: 10(r)*] | | Illinois Tool Works Inc. 2011 Executive Incentive Plan, filed as Exhibit 99.1 to the Company’s Current Report on Form 8-K filed on December 16, 2010 (Commission File No. 1-4797) and incorporated herein by reference. |
| [removed: 10(q)*] [added: 10(s)*] | | Illinois Tool Works Inc. Executive Contributory Retirement Income Plan as amended and restated, effective January 1, 2010, filed as exhibit 10 to the Company’s Current Report on Form 8-K filed on November 5, 2009 (Commission File No. 1-4797) and incorporated herein by reference. |
| [removed: 10(r)*] [added: 10(t)*] | | Illinois Tool Works Inc. Nonqualified Pension Plan, effective January 1, 2008, as amended and approved by the Board of Directors on December 22, 2008, filed as Exhibit 10(p) to the Company’s Annual Report on Form 10-K for the fiscal year ended December 31, 2008 (Commission File No. 1-4797) and incorporated herein by reference. |
| [removed: 10(s)*] [added: 10(u)*] | | Illinois Tool Works Inc. 2011 Change-in-Control Severance Compensation Policy, filed as Exhibit 99.3 to the Company’s Current Report on Form 8-K filed on December 16, 2010 (Commission File No. 1-4797) and incorporated herein by reference. |
| [removed: 10(t)*] [added: 10(v)*] | | Illinois Tool Works Inc. Amended and Restated Directors’ Deferred Fee Plan effective May 2, 2014, filed as Exhibit 10.1 to the Company’s Quarterly Report on Form 10-Q for the quarterly period ended June 30, 2014 (Commission File No. 1-4797) and incorporated herein by reference. |
| [removed: 10(u)*] [added: 10(e)*] | | Illinois Tool Works Inc. [removed: Phantom Stock] [added: 2015 Long-Term Incentive] Plan [removed: for Non-Officer Directors, as approved by the Board of Directors on December 5, 2008,] [added: effective May 8, 2015,] filed as Exhibit [removed: 10(s)] [added: 10.1] to the [removed: Company’s Annual] [added: Company's Quarterly] Report on Form [removed: 10-K] [added: 10-Q] for the [removed: fiscal year] [added: quarterly period] ended [removed: December] [added: March] 31, [removed: 2008] [added: 2015] (Commission File No. 1-4797) and incorporated herein by reference. |
| [removed: 10(v)*] [added: 10(w)*] | | Illinois Tool Works Inc. 2011 Cash Incentive Plan, filed as Exhibit 99.1 to the Company’s Form 8-K filed on May 12, 2011 (Commission File No. 1-4797) and incorporated herein by reference. |
| [removed: 10(w)] [added: 10(n)*] | | [removed: Letter Agreement, dated January 12, 2012, among the Company, Relational Investors LLC and the other parties named in the Letter Agreement,] [added: Form of stock option terms] filed as Exhibit 99.1 to the Company's Current Report on Form 8-K filed on [removed: January 13, 2012] [added: February 9, 2016] (Commission File No. 1-4797) and incorporated herein by reference. |
| [removed: 10(z)*] [added: 10(x)*] | | [removed: Severance Letter Agreement executed May 1, 2013 between Craig Hindman and Illinois Tool Works Inc.,] [added: First Amendment to the ITW Contributory Retirement Income Plan dated February 15, 2013,] filed as Exhibit [removed: 10.4] [added: 10.2] to the Company’s Current [removed: Report on] Form 10-Q filed [added: on] May 3, 2013 (Commission File No. 1-4797) and incorporated herein by reference. |
| | The following financial information from Illinois Tool Works [removed: Inc. Company's] [added: Inc.'s] Annual Report on Form 10-K for the year ended December 31, [removed: 2014,] [added: 2015,] formatted in XBRL (Extensible Business Reporting Language): (i) Statement of Income, (ii) Statement of Comprehensive Income, (iii) Statement of Income Reinvested in the Business (iv) Statement of Financial Position, (v) Statement of Cash Flows and (vi) related Notes to Financial Statements. |
2015
| 4(h) | | Officers’ Certificate dated May 19, 2015, establishing the terms, and setting forth the forms, of the 1.25% Euro Notes due 2023 and the 2.125% Euro Notes due 2030, filed as Exhibit 4.1 to the Company’s Form 8-K filed on May 22, 2015 (Commission File No. 001-04797) and incorporated herein by reference. |
| | | |
| DON H. DAVIS, JR. | | Director |
| ROBERT S. MORRISON | | Chairman of the Board |
2014
| 10(x) | | Letter Agreement dated March 1, 2013, among Illinois Tool Works Inc., Relational Investors LLC and the other parties named in the Letter Agreement, extending Letter Agreement dated January 12, 2012, filed as Exhibit 99.1 to the Company’s Current Report on Form 8-K filed on January 29, 2013 (Commission File No. 1-4797) and incorporated herein by reference. |
| 10(y)* | | Retention and Incentive Award Letter Agreement, executed May 1, 2013 between Craig Hindman and Illinois Tool Works Inc., filed as Exhibit 10.3 to the Company’s Current Form 10-Q filed on May 3, 2013 (Commission No. 1-4797) and incorporated herein by reference. |
| 10(aa)* | | Letter Agreement by and between Illinois Tool Works Inc. and Michael M. Larsen dated August 14, 2013, filed as Exhibit 10.3 to the Company’s Current Report on Form 10-Q filed November 1, 2013 (Commission File No. 1-4797) and incorporated herein by reference. |
| 10(bb)* | | First Amendment to the ITW Contributory Retirement Income Plan dated February 15, 2013, filed as Exhibit 10.2 to the Company’s Current Form 10-Q filed on May 3, 2013 (Commission File No. 1-4797) and incorporated herein by reference. |
| | |
| --- | --- |