 filings.tools
Jacobs Solutions 10-K 2018-09-28
Filed 2018-11-21. 21 sections, 513K characters. Original on sec.gov · Markdown · JSON
Cover and table of contents
10-K 1 jecfy201810-k.htm 10-K
UNITED STATES
SECURITIES AND EXCHANGE COMMISSION
Washington, D.C. 20549
FORM 10-K
ANNUAL REPORT PURSUANT TO
SECTION 13 OR 15(d) OF THE SECURITIES EXCHANGE ACT OF 1934
For the fiscal year ended September 28, 2018 Commission File No. 1-7463
Jacobs Engineering Group Inc.
| Delaware | 95-4081636 | |
| State of incorporation | IRS Employer identification number | |
| 1999 Bryan Street, Suite 1200 Dallas, Texas 75201 | (214) 583-8500 | |
| Address of principal executive offices | Telephone number (including area code) |
Securities registered pursuant to Section 12(b) of the Act:
| Title of Each Class | Name of Each Exchange on Which Registered | |
| Common Stock, $1 par value | New York Stock Exchange |
Securities registered pursuant to Section 12(g) of the Act: None
Indicate by check-mark if the Registrant is a well-known seasoned issuer, as defined in Rule 405 of the Securities Act: ☒ Yes ☐ No
Indicate by check-mark if the Registrant is not required to file reports pursuant to Section 13 or 15(d) of the Act. ☐ Yes ☒ No
Indicate by check-mark whether the Registrant (1) has filed all reports required to be filed by Section 13 or 15(d) of the Securities Exchange Act of 1934 during the preceding 12 months (or for such shorter period that the Registrant was required to file such reports), and (2) has been subject to such filing requirements for the past 90 days. ☒ Yes ☐ No
Indicate by check-mark whether the Registrant: has submitted electronically every Interactive Data File required to be submitted pursuant to Rule 405 of Regulation S-T (§232.405 of this chapter) during the preceding 12 months (or for such shorter period that the Registrant was required to submit such files). ☒ Yes ☐ No
Indicate by check-mark if disclosure of delinquent filers pursuant to Item 405 of Regulation S-K (§229.405 of this chapter) is not contained herein, and will not be contained, to the best of the Registrant’s knowledge, in definitive proxy or information statements incorporated by reference in Part III of this Form 10-K or any amendment to this Form 10-K. ☒
Indicate by check-mark whether the Registrant is a large accelerated filer, an accelerated filer, a non-accelerated filer or a smaller reporting company. See the definitions of “large accelerated filer”, “accelerated filer” and “smaller reporting company” in Rule 12b-2 of the Exchange Act.
| Large accelerated filer | ☒ | Accelerated filer | ☐ | |||
| Non-accelerated filer | ☐ | Smaller reporting company | ☐ | |||
| Emerging growth company | ☐ |
If an emerging growth company, indicate by check mark if the registrant has elected not to use the extended transition period for complying with any new or revised financial accounting standards provided pursuant to Section 13(a) of the Exchange Act. ☐
Indicate by check-mark whether the Registrant is a shell company (as defined in Rule 12b-2 of the Act) ☐ Yes ☒ No
There were 142,263,898 shares of common stock outstanding as of November 12, 2018. The aggregate market value of the Registrant’s common equity held by non-affiliates was approximately $8.3 billion as of March 30, 2018, based upon the last reported sales price on the New York Stock Exchange on that date.
DOCUMENTS INCORPORATED BY REFERENCE
Portions of the Registrant’s definitive proxy statement to be issued in connection with its 2019 annual meeting of shareholders are incorporated by reference into Part III of this Annual Report on Form 10-K where indicated.
JACOBS ENGINEERING GROUP INC.
Fiscal 2018 Annual Report on Form 10-K
Explanatory Note
On November 20, 2018, Jacobs Engineering Group Inc. (the “Company”) issued a press release announcing its financial results for the fiscal year ended September 28, 2018 and certain other financial information. A copy of the press release was attached to a Form 8-K furnished by the Company to the Securities and Exchange Commission on November 20, 2018. As previously noted by Company management, at the time it issued such press release the Company was continuing to finalize its year end audit processes, including with respect to income taxes. In that regard, the Company’s final 2018 income tax expense also includes approximately $15.0 million in deferred income taxes associated with adjustments with respect to valuation allowances on foreign tax credits associated with the acquisition of the CH2M business that had not been included in the Company’s press release. The impact of these adjustments was, on a U.S. GAAP basis, $(0.10) per share for the fourth quarter and $(0.11) per share for the fiscal year ended September 28, 2018. These revised amounts are included in the results reported in this Form 10-K. These adjustments do not impact the adjusted EPS results for the fourth quarter or the fiscal year ended September 28, 2018 reported in the press release. In connection with these adjustments, the Company’s management identified a material weakness in the Company’s internal control over financial reporting. See Item 9A, "Controls and Procedures" in this Form 10-K.
Page 2
JACOBS ENGINEERING GROUP INC.
Fiscal 2018 Annual Report on Form 10-K
Table of Contents
Page 3
PART I
FORWARD-LOOKING STATEMENTS
In addition to historical information, this Annual Report on Form 10-K contains forward-looking statements within the meaning of the Private Securities Litigation Reform Act of 1995, including, among other things, statements regarding our future operations, financial condition, and business strategies and future economic and industry conditions. Forward-looking statements are statements that do not directly relate to any historical or current fact. When used herein, words such as "expects," "anticipates," "believes," "seeks," "estimates," "plans," "intends," “future,” “will,” “would,” “could,” “can,” “may,” and similar words are intended to identify forward-looking statements. You should not place undue reliance on these forward-looking statements. Although such statements are based on management’s current estimates and expectations and/or currently available competitive, financial, and economic data, forward-looking statements are inherently uncertain and involve risks and uncertainties that could cause our actual results to differ materially from what may be inferred from the forward-looking statements. Factors that could cause or contribute to such differences include, but are not limited to, those listed and discussed in Item 1A— Risk Factors below. We undertake no obligation to release publicly any revisions or updates to any forward-looking statements. We encourage you to read carefully the risk factors described herein and in other documents we file from time to time with the United States Securities and Exchange Commission (the "SEC").
Unless the context otherwise requires, all references herein to "Jacobs" or the "Registrant" are to Jacobs Engineering Group Inc. and its predecessors, and references to the "Company", "we", "us" or "our" are to Jacobs Engineering Group Inc. and its consolidated subsidiaries.
Item 1. BUSINESS
General Background Information
We are one of the largest technical professional services firms in the world. We provide a diverse range of technical, professional and construction services to a large number of industrial, commercial and governmental clients.
We focus our services on clients operating in the following sectors:
| • | Water; |
| • | Environmental; |
| • | Transportation; |
| • | Programs for various national governments, including aerospace, defense and nuclear programs; |
| • | Buildings and advanced facilities (including specialized building for clients operating in the fields of healthcare, education and high technology, governmental complexes, other specialized civic and mission critical buildings, installations and laboratories and retail and commercial buildings); |
| • | Infrastructure and telecommunications; |
| • | Food and consumer products; |
| • | Technology and manufacturing; |
| • | Power; |
| • | Pulp and paper; |
| • | Oil and gas exploration, production and refining; and |
| • | Chemicals and polymers, among others. |
Jacobs was founded in 1947 and incorporated as a Delaware corporation in 1987. We are headquartered in Dallas, Texas, USA and provide our services through more than 200 offices located around the globe in North America, South America, Europe, the Middle East, India, Australia, Africa and Asia.
How We Operate
As a broad-based technical professional services firm, we offer a range of services to help our clients maintain a competitive edge in their respective markets. From consulting and feasibility studies to design, engineering, construction, start-up and commissioning and then to operations and maintenance, we customize our services to meet business and project goals. Our
Page 4
global network of professionals work with a multi-office approach in an effort to provide clients with the best, most economical project or program solutions.
We strive to provide client value through continuous improvement in our performance. We regularly monitor our clients' expectations, our project delivery protocols and system, and our operational performance. Tools such as our Jacobs Value Enhancing Practices, Global Standard Operating Procedures, project reviews, the Jacobs System to Ensure Project Success ("JSTEPS") and Safe Plans of Action ("SPAs") provide added value to our clients' projects. They also allow us to create performance improvement actions during the project execution. Through continuous improvement, with our tools and our processes, we believe we can offer our clients superior value when they do business with us.
JacobsValue+ SM ("Value Plus") is an internal tool we use to document and quantify the actual value or savings we provide to our clients and their projects. Some of the benefits achieved through the Value Plus program include lower total installed costs, shorter schedules and reduced life cycle costs. Value Plus is implemented at project initiation: a project goal is created and cost-saving ideas are entered into the Value Plus database. When the Value Plus cycle is complete, the project team and client identify and agree on the unique cost and/or schedule reductions for the project.
The Company’s Strategy
Our strategy is based on three key priorities:
| • | Build a High Performance Culture - Reinforce a culture of accountability, inspirational leadership and innovation that will drive long-term outperformance; |
| • | Transform the Core - Fundamentally change the way we operate to improve project delivery, sales effectiveness and business excellence; and |
| • | Grow Profitably - Execute a balanced strategy focused on organic growth, mergers and acquisitions and active portfolio management to drive profitable growth in the most attractive sectors and geographies. |
Employees and Safety
Our employees are our most important and valuable asset. The prevention of job-related injuries is given top priority. It is the policy of the Company to provide and maintain a safe and healthy working environment and to follow operating practices that safeguard all employees and result in a more efficient operation. BeyondZero® is the name of the global program that promotes our culture of caring and goes beyond efforts to have an incident and injury-free safety performance. We implement a culture of caring where concern for employees' health, safety and welfare extends outside the office, beyond the project site fences and into their homes, cars and all the places where they interact with family, friends and fellow employees. We also have a mental health program that aims to promote positive mental health across our Company.
We strive to present a clear and consistent image of our Company to our clients, employees, shareholders and business partners, regarding how we behave, how we communicate, how we look and most importantly, how our promises to our clients are delivered, anywhere in the world.
We accomplish this foremost through our vision, mission and values, which allow us to behave as one company and unify us worldwide. By keeping our values as a central focus of our Company, we are able to think the same way and arrive at similar conclusions, regardless of our physical location. With respect to our values:
-
Our values stand on a foundation of safety and integrity;
-
People are the heart of our business;
-
Clients are our valued partners;
-
Performance excellence is our commitment; and
-
Profitable growth is an imperative.
Our Vision statement, “Providing solutions for a more connected sustainable world” underpins our commitment to sustainability. Plan Beyond is how we define and identify our approach to sustainability. Building on BeyondZero and our culture of caring, Plan Beyond helps us to focus on looking beyond our company and how we contribute as a global corporate citizen. Our sustainability activities encompass stakeholders at Jacobs including our clients, our people and wider communities, our supply chain partners and our investors. Our people are empowered to explore, to innovate and to develop solutions that help our clients deliver their sustainability goals. We have the experience and competency to assist our clients with the challenges of climate change, resilience of cities and infrastructure, efficient procurement, resource reuse and recycling, water resource management, energy source management and environmental protection and enhancement.
Page 5
As our Company values espouse, people are the heart of our business. It is the talent of our people that is the key to our contribution to achieving our company vision. By their innovation and determination to embed sustainability into their design and delivery of service, we will contribute significantly to address the challenges facing sustainability through the thousands of clients and their stakeholders, whom we work with every year.
Applying the best, most efficient and effective sustainable solutions for clients worldwide, in all major industries in which our clients operate, allows us to make a significant contribution to a safe and sustainable future. We periodically issue a Sustainability Report that describes many of our efforts and accomplishments regarding sustainability.
With respect to human resources, our goal is to establish an inclusive, diverse workplace that energizes the people who fuel our Company's growth. Although we are a large company with a workforce of approximately 80,000 people in over 40 countries, our employees are unified in their focus on superior value, safety and ethical business practices regardless of the country in which they work and employees frequently move around the globe as they grow their careers.
Growth Strategy
Jacobs has grown significantly since its founding in 1947. Both organic growth and strategic acquisitions play an important part of the Company’s growth strategy. We have acquired and integrated numerous companies over the years that have enhanced our capabilities, geographic reach and offerings.
In terms of organic growth, our relationship-based business model is central to our sustained growth and profitability. We pursue the development of long-term relationships and alliances with our clients. By working with our clients to solve their challenges, we increase our understanding of their overall business needs, as well as the unique technical requirements of their specific projects. This increased understanding enables us to provide superior value to our clients. Our approach provides us with opportunities to market the following services to our clients:
| • | Consulting; |
| • | System enhancements; |
| • | Pre-design phases of large projects, which include master planning, project permitting and project finance options; |
| • | Design phase; and |
| • | Construction, post-start-up and commissioning phases of a facility, including operations and maintenance services. |
Our relationships with clients also present ongoing opportunities to expand into adjacent sectors. For example, clients operating in the mining and minerals market often have a need for our infrastructure and buildings capabilities. The same is true for clients operating in other sectors.
We market our services to clients in a wide range of public, institutional, process and industrial sectors. We are able to price contracts competitively and enhance overall profitability while delivering additional value to our clients by integrating and bundling our services and providing differentiated solutions. In complex economic times, we believe we have the ability to evolve along with industry cycles worldwide. When opportunities decrease in a particular sector or geography, other opportunities often increase. Because of our focused industry diversity, we believe we are well positioned to address a wide range of opportunities across many sectors and geographies, which helps us grow our business.
The Role of Strategic Transactions in the Development of Our Business
Jacobs pursues acquisitions, divestitures and other transactions to drive long-term value and profitable growth by positioning us in the most attractive sectors and geographies. When we review acquisition targets, we are conscious of the effect the acquisition may have on our client base. We favor acquisitions that are aligned with our growth strategy, which target enhancements of our capabilities and add value to our customers and shareholders. We do this by (i) expanding into a new client sector; (ii) enhancing the range of services we provide existing clients; and/or (iii) accessing new geographic areas in which our clients either already operate or plan to expand. By expanding into new geographic areas and adding to our existing technical and project management capabilities, we strive to position ourselves as a preferred, single-source provider of technical, professional, and construction services to our clients.
See the following brief description of some of our recent key acquisitions:
Page 6
| • | On December 15, 2017, we acquired CH2M HILL Companies, Ltd (CH2M) headquartered in Denver, Colorado. CH2M provides international engineering, construction and technical services. |
| • | On August 31, 2017, we acquired Blue Canopy, LLC headquartered in Reston, Virginia. Blue Canopy provides data analytics, cybersecurity and application development. |
| • | On January 27, 2017, we acquired Aquenta Consulting Pty Ltd. (“Aquenta”) headquartered in Sydney, Australia. Aquenta provides integrated project services. |
| • | On April 12, 2016, we acquired The Van Dyke Technology Group, Inc. (“Van Dyke”) headquartered in Columbia, Maryland. Van Dyke provides advanced cybersecurity services and solutions designed to protect sensitive information within classified networks, with a focus on supporting the U.S. Intelligence Community. |
| • | On December 7, 2015, we acquired J.L. Patterson & Associates (“JLP”) headquartered in Orange, California. JLP is a consulting and professional services engineering firm specializing in rail planning, environmental permitting, design and construction management. It provides services to numerous public transit agencies and is a major provider of professional consulting services to Class 1 railroads across the U.S. |
In line with our strategy of driving long-term value and profitable growth, on October 21, 2018, Jacobs and WorleyParsons Limited, a company incorporated in Australia (“Buyer”), entered into a Stock and Asset Purchase Agreement pursuant to which Buyer agreed to acquire the Company’s Energy, Chemicals and Resource business (the "ECR Business") for an aggregate purchase price of $3.3 billion. The Transaction is expected to close in the first half of calendar year 2019.
For additional information regarding certain issues related to our acquisition strategy, please refer to Item 1A- Risk Factors below.
Lines of Business
During the second quarter of fiscal 2018, we reorganized our operating and reporting structure around three global lines of business (“LOBs”), which also serve as the Company’s operating segments: (i) Aerospace, Technology, Environmental and Nuclear, (ii) Buildings, Infrastructure and Advanced Facilities, and (iii) Energy, Chemicals and Resources. This reorganization occurred in conjunction with the integration of CH2M into the Company's legacy businesses, and was intended to better serve our global clients, leverage our workforce, help streamline operations and provide enhanced growth opportunities. The Company’s LOB leadership and internal reporting structures report to the Chief Executive Officer, who is also the Chief Operating Decision Maker (“CODM”), and enable the CODM to evaluate the performance of each of these segments and make appropriate resource allocations among each of the segments. The sales function is managed on an LOB basis, and accordingly, the associated cost is embedded in the new segments and reported to the respective LOB presidents. In addition, a portion of the costs of other support functions (e.g., finance, legal, human resources and information technology) is allocated to each LOB using methodologies which, we believe, effectively attribute the cost of these support functions to the revenue generating activities of the Company on a rational basis. The cost of the Company’s cash incentive plan, the Management Incentive Plan (“MIP”) and the expense associated with the Jacobs Engineering Group Inc. 1999 Stock Incentive Plan (“1999 SIP”) have likewise been charged to the LOBs except for those amounts determined to relate to the business as a whole (which amounts remain in other corporate expenses).
Segments
As discussed above, the services we provide fall into the following three lines of business (“LOB”): (i) Aerospace, Technology, Environmental and Nuclear, (ii) Buildings, Infrastructure, and Advanced Facilities and (iii) Energy, Chemicals and Resources which are also the Company’s reportable segments.
For additional information regarding our segments, including information about our financial results by segment and financial results by geography, see Note 17 - Segment Information of Notes to Consolidated Financial Statements beginning on page F-1 of this Annual Report on Form 10-K.
Aerospace, Technology, Environmental and Nuclear (ATEN)
We provide an in-depth range of scientific, engineering, construction, nuclear, environmental and technical support services to the aerospace, defense, technical and automotive industries in several countries. Long-term clients include the Ministry of Defence in the U.K., the U.K. Nuclear Decommissioning Authority, NASA, the U.S. Department of Energy ("DoE"), the U.S. Department of Defense (“DoD”), the U.S. Special Operations Command ("USSOCOM"), the U.S. Intelligence community and the Australian Department of Defence. Specific to NASA, one of our major government customers in the U.S., is our ability to design, build, operate and maintain highly complex facilities relating to space systems, including test and evaluation facilities, launch facilities and support infrastructure. We provide support to all phases of the nuclear life-cycle from initial planning through design, construction, commissioning, operations and decommissioning/decontamination on government sites within the U.S. and Canada
Page 7
and on both government and commercial sites in the U.K. We provide environmental characterization and restoration services to commercial and government customers both in the U.S. and U.K. This includes designing, building and operating high hazard remediation systems including for radiologically contaminated media.
In addition, we design and build aerodynamic, climatic, altitude and acoustic facilities in support of the automotive industry, as well as provide a wide range of services in the telecommunications market.
Our experience in the defense sector includes military systems acquisition management and strategic planning; operations and maintenance of test facilities and ranges; test and evaluation services in computer, laboratory, facility and range environments; test facility computer systems instrumentation and diagnostics; and test facility design and build. We also provide systems engineering and integration of complex weapons and space systems, as well as hardware and software design of complex flight and ground systems.
We have provided advanced technology engineering services to the DoD for more than 50 years, and currently support major defense programs in the U.S. and internationally. We operate and maintain several DoD test centers and provide services and assist in the acquisition and development of systems and equipment for Special Operations Forces, as well as the development of biological, chemical, and nuclear detection and protection systems.
We maintain enterprise information systems for government and commercial clients worldwide, ranging from the operation of complex computational networks to the development and validation of specific software applications. We also support the DoD and the intelligence community in a number of information technology programs, including network design, integration, and support; command and control technology; development and maintenance of databases and customized applications; and cyber security solutions.
Buildings, Infrastructure and Advanced Facilities (BIAF)
We provide services to broad sectors including buildings, water, transportation (roads, rail, aviation and ports) and advanced facilities for life sciences, semiconductors, data centers, consumer products and other advanced manufacturing operations throughout North America, Europe, India, the Middle East, Australia and Asia. Our representative clients include national government departments/agencies in the U.S., Europe, U.K., Australia and Asia, state and local departments of transportation within the U.S. and private industry firms.
Typical projects include providing development/rehabilitation plans for highways, bridges, transit, tunnels, airports, railroads, intermodal facilities and maritime or port projects. Our interdisciplinary teams can work independently or as an extension of the client’s staff. We have experience with alternative financing methods, which have been used in Europe through the privatization of public infrastructure systems.
Our water infrastructure group aids emerging economies, which are investing heavily in water and wastewater systems and governments in North America and Europe, which are addressing the challenges of drought and an aging infrastructure system. We develop or rehabilitate critical water resource systems, water/wastewater conveyance systems and flood defense projects. We provide full life cycle services including engineering design, construction management, design build and operations and maintenance.
We also plan, design and construct buildings for a variety of clients and markets. We believe our global presence and understanding of contracting and delivery demands keep us well positioned to provide professional services worldwide. Our diversified client base encompasses both public and private sectors and relates primarily to institutional, commercial, government and corporate buildings, including projects at many of the world's leading medical and research centers, and universities. We focus our efforts and resources in two areas: where capital-spending initiatives drive demand, and where changes and advances in
technology require innovative, value-adding solutions. We also provide integrated facility management services (sometimes through joint ventures with third parties) for which we assume responsibility for the ongoing operation and maintenance of entire commercial or industrial complexes on behalf of clients.
We have specific capabilities in energy and power, master planning, and commissioning of office headquarters, aviation facilities, mission-critical facilities, municipal and civic buildings, courts and correctional facilities, mixed-use and commercial centers, healthcare and education campuses and recreational complexes. For advanced technology clients, who require highly specialized buildings in the fields of medical research, nano science, biotechnology and laser sciences, we offer total integrated design and construction management solutions. We also have global capabilities in the pharma-bio, data center, government
intelligence, corporate headquarters/interiors and science and technology-based education markets. Our government building projects include large, multi-year programs in the U.S. and Europe supporting various U.S. and U.K. government agencies.
Page 8
We provide our Life Sciences clients single-point consulting, engineering, procurement, construction management and validation project delivery, enabling us to execute capital programs on a single-responsibility basis. Typical projects in the life sciences sector include laboratories, research and development facilities, pilot plants, bulk active pharmaceutical ingredient production facilities, full-scale biotechnology production facilities and tertiary manufacturing facilities. Our manufacturing business areas include the Food & Beverage, Consumer Products and Pulp & Paper markets.
We provide services relating to modular construction, as well as other consulting and strategic planning to help our clients complete capital projects faster and more efficiently.
In addition, we offer services in containment, barrier technology, locally controlled environments, building systems automation and off-the-site design and fabrication of facility modules, as well as vaccine production and purification and aseptic processing.
Energy, Chemicals and Resources (ECR)
We serve the energy, chemicals and resources sectors, including upstream, midstream and downstream oil, gas, refining, chemicals and mining and minerals industries. We provide integrated delivery of complex projects for our Oil and Gas, Refining and Petrochemicals clients. Bridging the upstream, midstream and downstream industries, our services encompass consulting, engineering, procurement, construction, maintenance and project management.
We provide services relating to onshore and offshore oil and gas production facilities, including fixed and floating platforms and subsea tie-backs, as well as full field development solutions, including processing facilities, gathering systems, transmission pipelines and terminals. Our heavy oil experience makes us a leader in upgrading, steam-assisted gravity drainage and in-situ oil sands projects. We have developed modular well pad and central processing facility designs. We also provide fit-for-purpose and standardized designs in the onshore conventional and unconventional space, paying particular attention to water and environmental issues.
In addition, we provide our refining customers with feasibility/economic studies, technology evaluation and conceptual engineering, front end loading (FEED), detailed engineering, procurement, construction, maintenance and commissioning services. We deliver installed engineering, procurement and construction (EPC) solutions as to grass root plants, expansions and revamps of existing units. We have engineering alliances and maintenance programs that span decades with core clients. With the objective of driving our clients’ total installed costs down, we endeavor to leverage emerging market sourcing and high value engineering. Our Comprimo Sulfur Solutions® is a significant technology for gas treatment and sulfur recovery plants around the world.
We provide services to technically complex petrochemical facilities, from new manufacturing complexes to expansions and modifications and management of plant relocations. We have experience with many licensed technologies, integrated basic petrochemicals, commodity and specialty chemicals projects and olefins, aromatics, synthesis gas and their respective derivatives.
Our mining and minerals business targets the non-ferrous and ferrous metal markets, precious metals, energy minerals (uranium, coal, oil sands), and industrial and fertilizer minerals (borates, trona, phosphates and potash). We work with many resource companies undertaking new and existing facility upgrades, process plant and underground and surface material handling and infrastructure developments.
We offer project management, front-end studies, full engineering, procurement and construction management (“EPCM”), and engineering, procurement and construction (“EPC”) capabilities and completions, commissioning and start-up services specializing in new plant construction, brownfield expansions and sustaining capital and maintenance projects. We are also able to deliver value to our mining clients by providing distinctive adjacent large infrastructure capabilities to support their mining operations.
We provide a wide range of services, technology and manufactured equipment through our specialty chemicals group, where we own and license our proprietary technology. Our specialty chemicals areas are focused on sulfuric acid, sulphur, bleaching chemicals for pulp & paper and synthetic chemicals and manufactured equipment.
Our global Field Services unit supports construction and operations and maintenance (“O&M”) across the company and performs our direct hire services.
Our construction activities include providing both construction management services and traditional field construction services to our clients. Historically, our field construction activities focused primarily on those construction projects where we perform much of the related engineering and design work (EPC/EPCM). However, we deliver construction-only projects when we
Page 9
have negotiated pricing and other contract terms we deem acceptable and which result in a fair return for the degree of risk we assume.
In our O&M business, we provide all services required to operate and maintain large, complex facilities on behalf of clients including asset management, direct hire maintenance and operations, complex turn-around planning and execution and small capital programs. We provide key management and support services over all aspects of the operations of a facility, including managing subcontractors and other on-site personnel.
Backlog
Backlog is not a defined measure and our methodology for determining backlog may vary from the methodology used by other companies. Currently, we report a combined backlog number based upon the legacy reporting methodologies used by Jacobs and the acquired business of CH2M prior to the acquisition while we work to harmonize these reporting methodologies as part of the Company's integration activities underway.
We include in backlog the total dollar amount of revenues we expect to record in the future as a result of performing work under contracts that have been awarded to us. Our policy with respect to O&M contracts, however, is to include in backlog the amount of revenues we expect to receive for one succeeding year, regardless of the remaining life of the contract. For national government programs (other than national government O&M contracts, which are subject to the same policy applicable to all other O&M contracts), our policy is to include in backlog the full contract award, whether funded or unfunded, excluding option periods. Because of variations in the nature, size, expected duration, funding commitments and the scope of services required by our contracts, the timing of when backlog will be recognized as revenues can vary greatly between individual contracts.
Consistent with industry practice, substantially all of our contracts are subject to cancellation or termination at the option of the client, including our U.S government work. While management uses all information available to it to determine backlog, at any given time our backlog is subject to changes in the scope of services to be provided as well as increases or decreases in costs relating to the contracts included therein. Backlog is not necessarily an indicator of future revenues.
Because certain contracts (e.g., contracts relating to large EPC projects as well as national government programs) can cause large increases to backlog in the fiscal period in which we recognize the award, and because many of our contracts require us to provide services that span over a number of fiscal quarters (and sometimes over fiscal years), we evaluate our backlog on a year-over-year basis, rather than on a sequential, quarter-over-quarter basis.
The following table summarizes our backlog for the years ended September 28, 2018, September 29, 2017 and September 30, 2016 (in millions):
| September 28, 2018 | September 29, 2017 | September 30, 2016 | ||||||||||
| Aerospace, Technology, Environmental and Nuclear | $ | 8,857 | $ | 6,358 | $ | 4,472 | ||||||
| Buildings, Infrastructure and Advanced Facilities | 11,376 | 6,789 | 7,063 | |||||||||
| Energy, Chemicals and Resources | 7,066 | 6,642 | 7,226 | |||||||||
| Total | $ | 27,299 | $ | 19,789 | $ | 18,761 |
For additional information regarding our backlog including those risk factors specific to backlog, please refer to Item 1A - Risk Factors, and Item 7 - Management’s Discussion and Analysis of Financial Condition and Results of Operations below. Subject to the factors discussed in Item 1A - Risk Factors, we estimate that approximately $10 billion, or 36%, of total backlog at September 28, 2018 will be realized as revenues within the next fiscal year.
Significant Customers
The following table sets forth the percentage of total revenues earned directly or indirectly from agencies of the U.S. federal government for each of the last five fiscal years:
| 2018 | 2017 | 2016 | 2015 | 2014 | ||||
| 23% | 19% | 21% | 22% | 18% |
Page 10
Given the percentage of total revenue derived directly from the U.S. federal government, the loss of U.S. federal government agencies as customers would have a material adverse effect on the Company. In addition, any or all of our government contracts could be terminated, we could be suspended or debarred from all government contract work, or payment of our costs could be disallowed. Approximately 94% of revenue derived directly from the U.S. federal government is in the ATEN segment. For more information on risks relating to our government contracts, see Item 1A - Risk Factors.
Financial Information About Geographic Areas
Selected financial information regarding the geographic areas in which we operate is included in Note 17 - Segment Information of Notes to Consolidated Financial Statements beginning on page F-1 of this Annual Report on Form 10-K and is incorporated herein by reference. For fiscal 2018, approximately 36% of our revenues were earned from clients outside the United States. Our international operations are subject to a variety of risks, which are described under Item 1A - Risk Factors below.
Contracts
While there is considerable variation in the pricing provisions of the contracts we undertake, our contracts generally fall into two broad categories: cost-reimbursable and fixed-price. The following table sets forth the percentages of total revenues represented by these types of contracts for each of the last five fiscal years:
| 2018 | 2017 | 2016 | 2015 | 2014 | |||||
| Cost-reimbursable | 76% | 81% | 82% | 83% | 83% | ||||
| Fixed-price | 24% | 19% | 18% | 17% | 17% |
In accordance with industry practice, most of our contracts (including those with the U.S. federal government) are subject to termination at the discretion of the client, which is discussed in greater detail in Item 1A - Risk Factors. In such situations, our contracts typically provide for reimbursement of costs incurred and payment of fees earned through the date of termination.
When we are directly responsible for engineering, design, procurement and construction of a project or the maintenance of a client’s plant or facility, we reflect the costs of materials, equipment and subcontracts in both revenues and costs. The following table sets forth the approximate amount of such pass-through costs included in revenues for each of the last five fiscal years (in millions of dollars):
| 2018 | 2017 | 2016 | 2015 | 2014 | ||||||||||||||
| $ | 3,058.6 | $ | 2,539.3 | $ | 2,489.9 | $ | 2,602.6 | $ | 2,954.9 |
On other projects, where the client elects to pay for such items directly and we have no associated responsibility for such items, these amounts are not reflected in either revenues or costs.
Cost-Reimbursable Contracts
Cost-reimbursable contracts generally provide for reimbursement of costs incurred plus an amount of profit. The profit element may be in the form of a simple mark-up applied to the labor costs incurred or it may be in the form of a fee, or a combination of a mark-up and a fee. The fee element can also take several forms. The fee may be a fixed amount; it may be an amount based on a percentage of the costs incurred; or it may be an incentive fee based on targets, milestones, or performance factors defined in the contract. In general, we prefer cost-reimbursable contracts because we believe the primary reason for awarding a contract to us should be our technical expertise and professional qualifications rather than price.
Fixed-Price Contracts
Fixed-price contracts include both “lump sum bid” contracts and “negotiated fixed-price” contracts. Under lump sum bid contracts, we typically bid against other contractors based on client-furnished specifications. This type of pricing presents certain inherent risks, including the possibility of ambiguities in the specifications received, problems with new technologies, and economic and other changes that may occur over the contract period. Additionally, it is not unusual for lump sum bid contracts to lead to an adversarial relationship with clients, which is contrary to our relationship-based business model. Accordingly, lump sum bid contracts are not our preferred form of contract, and, as such, the Company has rarely entered into individual lump sum bid contracts that are material to its financial results. In contrast, under a negotiated fixed-price contract, we are selected as the contractor first and then we negotiate a price with our client. Negotiated fixed-price contracts frequently exist in single-responsibility arrangements where we perform some portion of the work before negotiating the total price of the project. Thus,
Page 11
although both types of contracts involve a firm price for the client, the lump sum bid contract provides the greater degree of risk to us. However, because of economies that may be realized during the contract term, both negotiated fixed-price and lump sum bid contracts may offer greater profit potential than other types of contracts. The Company carefully manages the risk inherent in these types of contracts. In recent years, most of our fixed-price work has been either negotiated fixed-price contracts or lump sum bid contracts for project services, rather than turnkey construction.
Competition
We compete with a large number of companies across the world. Typically, no single company or companies dominate the market in which we provide services. We compete based on the following factors, among others: price of services, technical capabilities, reputation for quality, safety record, availability of qualified personnel, ability to timely perform work and willingness to accept project-related risk. For more information regarding the competitive conditions in our business, please refer to Item 1A - Risk Factors below.
Employees
At September 28, 2018, we had approximately 74,400 full-time, staff employees (including contract staff). Additionally, as of September 28, 2018, there were approximately 6,400 persons employed in the field on a project basis. The number of field employees varies in relation to the number and size of the maintenance and construction projects in progress at any particular time.
Executive Officers of the Registrant
The information required by Paragraph (a), and Paragraphs (c) through (g) of Item 401 of Regulation S-K (except for information required by Paragraph (e) of that Item to the extent the required information pertains to our executive officers) and Item 405 of Regulation S-K is set forth under the captions “Members of the Board of Directors” and “Section 16(a) Beneficial Ownership Reporting Compliance” in our definitive proxy statement to be filed with the SEC pursuant to Regulation 14A within 120 days after the close of our fiscal year and is incorporated herein by reference.
The following table presents the information required by Paragraph (b) of Item 401 of Regulation S-K.
| Name | Age | Position with the Company | Year Joined the Company | ||||
| Steven J. Demetriou | 60 | Chairman and Chief Executive Officer | 2015 | ||||
| Kevin C. Berryman | 59 | Executive Vice President and Chief Financial Officer | 2014 | ||||
| Terence D. Hagen | 54 | Chief Operating Officer | 1987 | ||||
| Robert V. Pragada | 50 | Chief Operating Officer | 2016 | ||||
| Vinayak R. Pai | 52 | President, Energy, Chemicals and Resources | 2013 | ||||
| Joanne Caruso | 58 | Chief Legal and Administration Officer | 2012 | ||||
| William B. Allen, Jr. | 54 | Senior Vice President and Chief Accounting Officer | 2016 | ||||
| Michael R. Tyler | 62 | Senior Vice President, General Counsel and Chief Compliance Officer | 2013 |
All of the officers listed in the preceding table serve in their respective capacities at the pleasure of the Board of Directors of the Company.
Mr. Demetriou joined the Company in August 2015. Mr. Demetriou served as Chairman and CEO of Aleris Corporation for 14 years, a global downstream aluminum producer based in Cleveland, Ohio. Over the course of his career, he has gained broad experience with companies in a range of industries including metals, specialty chemicals, oil & gas, manufacturing and fertilizers.
Mr. Berryman joined the Company in December 2014. Mr. Berryman served as EVP and CFO for five years at International Flavors and Fragrances Inc., an S&P 500 company and leading global creator of flavors and fragrances used in a wide variety of consumer products. Prior to that, he spent 25 years at Nestlé in a number of finance roles including treasury, mergers & acquisitions, strategic planning and control.
Page 12
Mr. Hagen joined the Company in 1987. Mr. Hagen has worked in a number of the Company’s market sectors in both senior operational and sales roles. Prior to becoming Chief Operating Officer, Mr. Hagen served as President of Aerospace, Technology, Environmental and Nuclear (ATEN) and as Executive Vice President, Global Sales and Marketing.
Mr. Pragada rejoined the Company in February 2016 after serving as President and Chief Executive Officer of The Brock Group since August 2014. From March 2006 to August 2014 Mr. Pragada served in executive and senior management capacities with the Company.
Mr. Pai joined the Company in 2013. Prior to becoming President of Energy, Chemicals and Resources (ECR) in December 2017, Mr. Pai was a Senior Vice President, holding various executive and senior management positions within ECR.
Ms. Caruso joined the Company in 2012. Prior to becoming Chief Legal and Administration Officer, Ms. Caruso was Senior Vice President of Human Resources and previously Senior Vice President, Global Litigation. Prior to joining the Company, Ms. Caruso was a partner in two international law firms, Howrey LLP and Baker & Hostetler LLP.
Mr. Allen joined the Company in October 2016. Mr. Allen served as Vice President, Finance and Principal Accounting Officer at Lyondellbasell Industries, N.V. from 2013 to 2016. Prior to that, he was with Albemarle Corporation, where he served as Vice President, Corporate Controller and Chief Accounting Officer from 2009 to 2013 after serving in CFO roles for their Catalysts and Fine Chemistry businesses from 2005 to 2009.
Mr. Tyler joined the Company in June 2013. He previously served as Executive Vice President, General Counsel and Secretary of Sanmina Corporation, a global electronics manufacturing services provider from April 2007 to June 2013, and Chief Legal and Administrative Officer of Gateway, Inc., a computer hardware company, from January 2004 to April 2007.
Available Information
You may read and copy any materials we file with the SEC at the SEC’s Public Reference Room located at 100 F Street N.E., Washington, D.C. 20549. In order to obtain information about the operation of the Public Reference Room, a person may call the SEC at 1-800-732-0330. The SEC also maintains a site on the Internet that contains reports, proxy and information statements, and other information regarding issuers that file electronically with the SEC. The SEC’s website is http://www.sec.gov. You may also read and download the various reports we file with, or furnish to, the SEC free of charge from our website at www.jacobs.com.
Item 1A. RISK FACTORS
We operate in a changing global environment that involves numerous known and unknown risks and uncertainties that could materially adversely affect our business, financial condition and results of operations. The risks described below highlight some of the factors that have affected and could affect us in the future. We may also be affected by unknown risks or risks that we currently think are immaterial. If any such events actually occur, our business, financial condition and results of operations could be materially adversely affected.
Construction and maintenance sites are inherently dangerous workplaces. If we, the owner, or others working at the project site fail to maintain safe work sites, we can be exposed to significant financial losses and reputational harm, as well as civil and criminal liabilities.
Construction and maintenance sites often put our employees and others in close proximity with large pieces of mechanized equipment, moving vehicles, chemical and manufacturing processes and highly regulated materials, in a challenging environment and often in geographically remote locations. If we fail to implement such procedures or if the procedures we implement are ineffective, or if others working at the site fail to implement and follow appropriate safety procedures, our employees and others may become injured, disabled or even lose their lives, the completion or commencement of our projects may be delayed and we may be exposed to litigation or investigations. Unsafe work sites also have the potential to increase employee turnover, increase the cost of a project to our clients and raise our operating and insurance costs. Any of the foregoing could result in financial losses or reputational harm, which could have a material adverse impact on our business, financial condition and results of operations.
In addition, our projects can involve the handling of hazardous and other highly regulated materials, which, if improperly handled or disposed of, could subject us to civil and/or criminal liabilities. We are also subject to regulations dealing with occupational health and safety. Although we maintain functional groups whose primary purpose is to ensure we implement effective health, safety and environmental (“HSE”) work procedures throughout our organization, including construction sites and
Page 13
maintenance sites, the failure to comply with such regulations could subject us to liability. In addition, despite the work of our functional groups, we cannot guarantee the safety of our personnel or that there will be no damage to or loss of our work, equipment or supplies.
Our safety record is critical to our reputation. Many of our clients require that we meet certain safety criteria to be eligible to bid for contracts and many contracts provide for automatic termination or forfeiture of some or all of our contract fees or profit in the event we fail to meet certain measures. Accordingly, if we fail to maintain adequate safety standards, we could suffer reduced profitability or the loss of projects or clients, which could have a material adverse impact on our business, financial condition and results of operations.
Demand for our services is cyclical as the sectors and industries in which our clients operate are impacted by economic downturns, reductions in government or private spending and times of political uncertainty.
We provide technical, professional, construction and O&M services to clients operating in a number of sectors and industries, including oil and gas exploration, production and refining; programs for various national governments, including the U.S. federal government; chemicals and polymers; mining and minerals; pharmaceuticals and biotechnology; infrastructure; buildings; power; water; transportation; and other general industrial and consumer businesses and markets (such as technology and manufacturing; pulp and paper; and food and consumer products). These sectors and industries and the resulting demand for our services have been, and we expect will continue to be, cyclical and subject to significant fluctuations due to a variety of factors beyond our control, including economic conditions and changes in client spending, particularly during periods of economic or political uncertainty.
Uncertain global economic and political conditions may negatively impact our clients’ ability and willingness to fund their projects, including their ability to raise capital and pay, or timely pay, our invoices. They may also cause our clients to reduce their capital expenditures, alter the mix of services purchased, seek more favorable price and other contract terms and otherwise slow their spending on our services. For example, in the public sector, declines in state and local tax revenues as well as other economic declines may result in lower state and local government spending. In addition, under such conditions, many of our competitors may be more inclined to take greater or unusual risks or accept terms and conditions in contracts that we might not deem acceptable. These conditions may reduce the demand for our services, which may have a material adverse impact on our business, financial condition and results of operations.
Additionally, uncertain economic and political conditions may make it difficult for our clients, our vendors, and us to accurately forecast and plan future business activities. For example, recent changes to U.S. policies related to global trade and tariffs have resulted in uncertainty surrounding the future of the global economy as well as retaliatory trade measures implemented by other countries. The increasing cost of steel and aluminum may impact client spending. We cannot predict the outcome of these changing trade policies or other unanticipated political conditions, nor can we predict the timing, strength or duration of any economic recovery or downturn worldwide or in our clients’ markets. In addition, our business has traditionally lagged recoveries in the general economy and, therefore, may not recover as quickly as the economy at large. Weak economic conditions, a failure to obtain expected benefits from any increased infrastructure spending, or a reduction in government spending could have a material adverse impact on our business, financial condition and results of operations. Furthermore, if a significant portion of our clients or projects are concentrated in a specific geographic area or industry, our business may be disproportionately affected by negative trends or economic downturns in those specific geographic areas or industries.
Regardless of economic or market conditions, investment decisions by our customers may vary by location or as a result of other factors like the availability of labor or relative construction cost. Because we are dependent on the timing and funding of new awards, we are therefore vulnerable to changes in our clients’ markets and investment decisions. As a result, our past results have varied and may continue to vary depending upon the demand for future projects in the markets and the locations in which we operate.
Fluctuations in commodity prices may affect our customers’ investment decisions and therefore subject us to risks of cancellation, delays in existing work, or changes in the timing and funding of new awards.
Commodity prices can affect our customers in a number of ways. For example, for those customers that produce commodity products such as oil, gas, copper, or fertilizers, fluctuations in price can have a direct effect on their profitability and cash flow and, therefore, their willingness to continue to invest or make new capital investments. Furthermore, declines in commodity prices can negatively impact our business in regions whose economies are substantially dependent on commodity prices, such as the Middle East. To the extent commodity prices decline or fluctuate and our customers defer new investments or cancel or delay existing projects,
Showing the first 8K of 98K characters. Open the full section
Item 1B. UNRESOLVED STAFF COMMENTS
None.
Item 2. PROPERTIES
Our properties consist primarily of office space within general, commercial office buildings located in major cities primarily in the following countries: United States; Argentina; Armenia; Australia; Bahrain; Belgium; Brazil; Canada; Chile; China; Egypt; France; Germany; Greenland; Hong Kong; India; Indonesia; Iraq; Ireland; Italy; Kazakhstan; Korea (Republic of); Malaysia; Mexico; The Netherlands; New Zealand; Oman; Peru; The Philippines; Poland; Qatar; Romania; Russian Federation; Saudi Arabia; Singapore; South Africa; Spain; Sweden; Taiwan (Province of China); Thailand; Trinidad and Tobago; United Arab Emirates; United Kingdom and Vietnam. We also lease smaller offices located in certain other countries. Such space is used for operations (providing technical, professional, and other home office services), sales and administration. Most of our properties are leased. In addition, we have fabrication facilities located in Canada in Pickering, Ontario; St. John, New Brunswick; and Edmonton, Alberta and Lamont, Alberta. The total amount of space used by us for all of our operations is approximately 14.2 million square feet.
Item 3. LEGAL PROCEEDINGS
The information required by this Item 3 is included in Note 15 — Contractual Guarantees, Litigation, Investigations and Insurance of Notes to Consolidated Financial Statements beginning on page F-1 of this Annual Report on Form 10-K and is incorporated herein by reference.
Item 4. MINE SAFETY DISCLOSURE
Section 1503 of the Dodd-Frank Wall Street Reform and Consumer Protection Act (the “Dodd-Frank Act”) requires domestic mine operators to disclose violations and orders issued under the Federal Mine Safety and Health Act of 1977 (the “Mine Act”) by the federal Mine Safety and Health Administration. Under the Mine Act, an independent contractor, such as Jacobs, that performs services or construction of a mine is included within the definition of a mining operator. We do not act as the owner of any mines.
Information concerning mine safety violations or other regulatory matters required by Section 1503(a) of the Dodd-Frank Act and Item 104 of Regulation S-K is included in Exhibit 95.
Page 31
PART II
Item 5. MARKET FOR REGISTRANT'S COMMON EQUITY, RELATED STOCKHOLDER MATTERS AND ISSUER PURCHASES OF EQUITY SECURITIES
Market Information
Jacobs’ common stock is listed on the NYSE and trades under the symbol JEC. We provided to the NYSE, without qualification, the required annual certification of our Chief Executive Officer regarding compliance with the NYSE’s corporate governance listing standards. The following table sets forth the low and high sales prices of a share of our common stock during each of the fiscal quarters presented, based on the NYSE Composite Price History:
| Low Sales Price | High Sales Price | |||||||
| Fiscal 2018: | ||||||||
| First quarter | $ | 57.21 | $ | 69.35 | ||||
| Second quarter | $ | 55.42 | $ | 72.18 | ||||
| Third quarter | $ | 55.21 | $ | 66.72 | ||||
| Fourth quarter | $ | 62.79 | $ | 77.91 | ||||
| Fiscal 2017: | ||||||||
| First quarter | $ | 49.16 | $ | 63.42 | ||||
| Second quarter | $ | 52.39 | $ | 62.20 | ||||
| Third quarter | $ | 50.53 | $ | 55.97 | ||||
| Fourth quarter | $ | 49.31 | $ | 58.51 |
Shareholders
According to the records of our transfer agent, there were 3,684 shareholders of record as of November 12, 2018.
Share Repurchases
On July 23, 2015, the Board of Directors approved a program to repurchase up to $500.0 million of the Company’s common stock, to expire on July 31, 2018. On July 19, 2018, the Company's Board of Directors authorized the continuation of this share repurchase program for an additional three years, to expire on July 31, 2021. The following table summarizes the activity under this program during fiscal 2018:
| Average Price Per Share (1) | Shares Repurchased | Total Shares Retired | |||
| $500,000,000 | $60.77 | 49,074 | 49,074 |
(1) Includes commissions paid and calculated at the average price per share.
Share repurchases may be executed through various means including, without limitation, open market transactions, privately negotiated transactions or otherwise. The share repurchase program does not obligate the Company to purchase any shares. The authorization for the share repurchase program may be terminated, increased or decreased by the Company’s Board of Directors in its discretion at any time. The timing of share repurchases may depend upon market conditions, other uses of capital, and other factors.
Dividends
On December 1, 2016, the Company announced that the Board of Directors approved the initiation of a cash dividend program. In the fourth fiscal quarter of 2017, the Company declared a dividend of $0.15 per share of the Company’s common stock that was paid in the first fiscal quarter of 2018. In the second, third and fourth fiscal quarters of 2018, the Company declared and paid a dividend of $0.15 per share of the Company’s common stock, for a total of $0.60 per share paid during the year ended September 28, 2018. On September 11, 2018, the Company's Board of Directors declared a dividend of $0.15 per share of the Company's common stock that was paid on October 26, 2018 to shareholders of record on the close of business on September 28, 2018. Future dividend declarations are subject to review and approval by the Company’s Board of Directors.
Page 32
Unregistered Sales of Equity Securities.
None.
Performance Graph
The following graph and table shows the changes over the five-year period ended September 28, 2018 in the value of $100 as of the close of market on September 30, 2013 in (1) the common stock of Jacobs Engineering Group Inc., (2) the Standard & Poor’s 500 Stock Index, and (3) the Dow Jones Heavy Construction Group Index. The values of each investment are based on share price appreciation, with reinvestment of all dividends, provided any were paid. The investments are assumed to have occurred at the beginning of the period presented. The stock performance included in this graph is not necessarily indicative of future stock price performance.
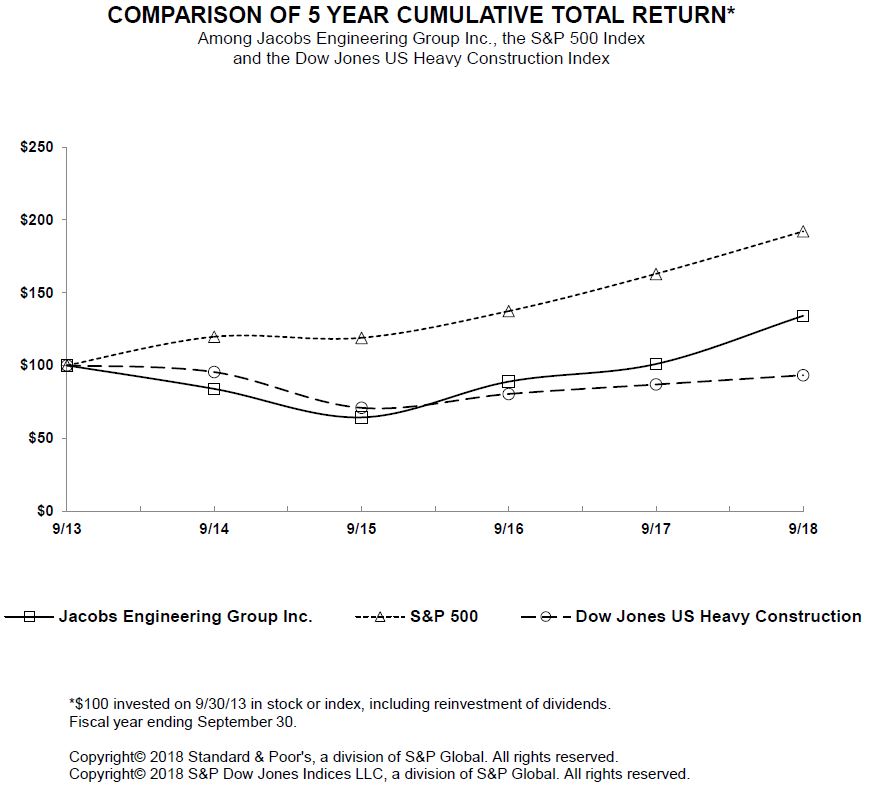
| 2013 | 2014 | 2015 | 2016 | 2017 | 2018 | ||||||||||||
| Jacobs Engineering Group Inc. | 100.00 | 83.91 | 64.33 | 88.90 | 100.99 | 134.11 | |||||||||||
| S&P 500 | 100.00 | 119.73 | 119.00 | 137.36 | 162.92 | 192.10 | |||||||||||
| Dow Jones US Heavy Construction | 100.00 | 95.45 | 70.89 | 80.42 | 86.92 | 93.30 |
Note: The above information was provided by Research Data Group, Inc.
Item 6. SELECTED FINANCIAL DATA
The following table presents selected financial data for each of the last five fiscal years. This selected financial data should be read in conjunction with the Consolidated Financial Statements and related notes beginning on page F-1 of this Annual Report on Form 10-K. Dollar amounts are presented in thousands, except for per share information:
Page 33
| 2018 (a) | 2017 (b) | 2016 (c) | 2015 (d) | 2014 (e) | |||||||||||||||
| Results of Operations: | |||||||||||||||||||
| Revenues | $ | 14,984,646 | $ | 10,022,788 | $ | 10,964,157 | $ | 12,114,832 | $ | 12,695,157 | |||||||||
| Net earnings attributable to Jacobs | $ | 163,431 | $ | 293,727 | $ | 210,463 | $ | 302,971 | $ | 328,108 | |||||||||
| Financial Position: | |||||||||||||||||||
| Current ratio | 1.45 to 1 | 1.56 to 1 | 1.61 to 1 | 1.58 to 1 | 1.58 to 1 | ||||||||||||||
| Working capital | $ | 1,410,891 | $ | 1,069,953 | $ | 1,081,784 | $ | 1,141,512 | $ | 1,372,332 | |||||||||
| Current assets | $ | 4,556,584 | $ | 2,996,180 | $ | 2,864,470 | $ | 3,122,678 | $ | 3,722,178 | |||||||||
| Total assets | $ | 12,645,795 | $ | 7,380,859 | $ | 7,360,022 | $ | 7,785,926 | $ | 8,453,659 | |||||||||
| Cash | $ | 793,358 | $ | 774,151 | $ | 655,716 | $ | 460,859 | $ | 732,647 | |||||||||
| Long-term debt | $ | 2,146,877 | $ | 235,000 | $ | 385,330 | $ | 584,434 | $ | 764,075 | |||||||||
| Total Jacobs stockholders’ equity | $ | 5,854,345 | $ | 4,428,352 | $ | 4,265,276 | $ | 4,291,745 | $ | 4,469,255 | |||||||||
| Return on average equity | 3.18 | % | 6.76 | % | 4.92 | % | 6.92 | % | 7.56 | % | |||||||||
| Backlog: | $ | 27,298,614 | $ | 19,788,613 | $ | 18,760,529 | $ | 18,806,570 | $ | 18,380,034 | |||||||||
| Per Share Information: | |||||||||||||||||||
| Basic earnings per share | $ | 1.18 | $ | 2.43 | $ | 1.75 | $ | 2.42 | $ | 2.51 | |||||||||
| Diluted earnings per share | $ | 1.17 | $ | 2.42 | $ | 1.73 | $ | 2.40 | $ | 2.48 | |||||||||
| Stockholders’ equity | $ | 42.21 | $ | 36.78 | $ | 35.26 | $ | 34.85 | $ | 33.92 | |||||||||
| Average Number of Shares of Common Stock and Common Stock Equivalents Outstanding (Diluted) | 138,712 | 120,147 | 121,483 | 126,110 | 132,371 | ||||||||||||||
| Common Shares Outstanding At Year End | 142,218 | 120,386 | 120,951 | 123,153 | 131,753 | ||||||||||||||
| Cash Dividends Declared Per Common Share | $ | 0.60 | $ | 0.60 | $ | — | $ | — | $ | — |
| (a) | Includes costs of $140.1 million, or $1.01 per diluted share, related to the Company's restructuring and other initiatives during fiscal 2018, which includes $21.0 million in loss related to the sale of the Company's investment in Guimar Engenharia Ltda. Also included in fiscal 2018 are after-tax charges of $60.7 million, or $0.44 per diluted share, in professional fees and related costs associated with the CH2M acquisition and pending ECR sale and $259.2 million, or $1.86 per diluted share, in benefits related to tax reform. |
| (b) | Includes costs of $87.9 million, or $0.73 per diluted share, related to the Company's restructuring and other initiatives during fiscal 2017. Also included in the fourth quarter of fiscal 2017 are after-tax charges of $10.6 million, or $0.09 per diluted share, respectively, in professional fees and related costs associated with the CH2M acquisition. |
| (c) | Includes costs of $135.6 million, or $1.12 per diluted share, related to the Company's restructuring initiatives during fiscal 2016. Also included in the fourth quarter of fiscal 2016 are (i) a loss on sale of our French subsidiary of $17.1 million or $0.14 per diluted share; and (ii) a non-cash write-off on an equity investment of $10.4 million or $0.09 per diluted share. |
| (d) | Includes costs of $107.9 million, or $0.86 per diluted share, related to the Company's restructuring initiatives during fiscal 2015. |
| (e) | Includes costs of $109.2 million, or $0.82 per diluted share, related to the Company's restructuring initiatives during fiscal 2014. |
Item 7. MANAGEMENT'S DISCUSSION AND ANALYSIS OF FINANCIAL CONDITION AND RESULTS OF OPERATIONS
Critical Accounting Policies and Estimates
In order to better understand the changes that occur to key elements of our financial condition, results of operations and cash flows, a reader of this Management’s Discussion and Analysis of Financial Condition and Results of Operations (“MD&A”) should be aware of the critical accounting policies we apply in preparing our consolidated financial statements.
The consolidated financial statements contained in this report were prepared in accordance with U.S. GAAP. The preparation of our consolidated financial statements and the financial statements of any business performing long-term engineering and construction-type contracts requires management to make certain estimates and judgments that affect both the entity’s results of operations and the carrying values of its assets and liabilities. Although our significant accounting policies are described in Note 2 - Significant Accounting Policies of Notes to Consolidated Financial Statements beginning on page F-1 of this Annual Report on Form 10-K, the following discussion is intended to highlight and describe those accounting policies that are especially critical to the preparation of our consolidated financial statements.
Page 34
Revenue Accounting for Contracts - We recognize revenue earned on our technical professional and field services projects under the percentage-of-completion method described in ASC 605-35, Construction-Type and Production-Type Contracts. In general, we recognize revenues at the time we provide services. Pre-contract costs are generally expensed as incurred, unless they are directly associated with an anticipated contract and recoverability from that contract is probable. Contracts are generally segmented between types of services, such as engineering and construction, and accordingly, gross margin related to each activity is recognized as those separate services are rendered. For multiple contracts with a single customer we account for each contract separately.
The percentage-of-completion method of accounting is applied by comparing contract costs incurred to date to the total estimated costs at completion. Contract losses are provided for in their entirety in the period they become known, without regard to the percentage-of-completion.
Unapproved change orders are included in the contract price to the extent it is probable that such change orders will result in additional contract revenue and the amount of such additional revenue can be reliably estimated. Claims meeting these recognition criteria are included in revenues only to the extent of the related costs incurred.
Certain cost-reimbursable contracts include incentive-fee arrangements. These incentive fees can be based on a variety of factors but the most common are the achievement of target completion dates, target costs, and/or other performance criteria. Failure to meet these targets can result in unrealized incentive fees. We recognize incentive fees based on expected results using the percentage-of-completion method of accounting. As the contract progresses and more information becomes available, the estimate of the anticipated incentive fee that will be earned is revised as necessary. We bill incentive fees based on the terms and conditions of the individual contracts. In certain situations, we are allowed to bill a portion of the incentive fees over the performance period of the contract. In other situations, we are allowed to bill incentive fees only after the target criterion has been achieved. Incentive fees which have been recognized but not billed are included in receivables in the accompanying Consolidated Balance Sheets.
Certain cost-reimbursable contracts with government customers as well as certain commercial clients provide that contract costs are subject to audit and adjustment. In this situation, revenues are recorded at the time services are performed based upon the amounts we expect to realize upon completion of the contracts. In those situations where an audit indicates that we may have billed a client for costs not allowable under the terms of the contract, we estimate the amount of such nonbillable costs and adjust our revenues accordingly.
When we are directly responsible for subcontractor labor or third-party materials and equipment, we reflect the costs of such items in both revenues and costs (and we refer to such costs as “pass-through” costs). On those projects where the client elects to pay for such items directly and we have no associated responsibility for such items, these amounts are not reflected in either revenues or costs.
Joint Ventures - As is common to the industry, we execute certain contracts jointly with third parties through various forms of joint ventures. Although the joint ventures own and hold the contracts with the clients, the services required by the contracts are typically performed by us and our joint venture partners, or by other subcontractors under subcontracting agreements with the joint ventures. Many of these joint ventures are formed for a specific project. The assets of our joint ventures generally consist almost entirely of cash and receivables (representing amounts due from clients), and the liabilities of our joint ventures generally consist almost entirely of amounts due to the joint venture partners (for services provided by the partners to the joint ventures under their individual subcontracts) and other subcontractors. In general, at any given time, the equity of our joint ventures represents the undistributed profits earned on contracts the joint ventures hold with clients. Very few of our joint ventures have employees or third-party debt or credit facilities. The debt held by the joint ventures is non-recourse to the general credit of Jacobs. The assets of a joint venture are restricted for use to the obligations of the particular joint venture and are not available for general operations of the Company. Our risk of loss on these arrangements is usually shared with our partners. The liability of each partner is usually joint and several, which means that each partner may become liable for the entire risk of loss on the project. Furthermore, on some of our projects, the Company has granted guarantees which may encumber both our contracting subsidiary company and the Company for the entire risk of loss on the project. See Note 15- Contractual Guarantees, Litigation, Investigations and Insurance for further discussion.
Many of the joint ventures are deemed to be variable interest entities (“VIE”) because they lack sufficient equity to finance the activities of the joint venture. The Company uses a qualitative approach to determine if the Company is the primary beneficiary of the VIE, which considers factors that indicate a party has the power to direct the activities that most significantly impact the joint venture’s economic performance. These factors include the composition of the governing board, how board decisions are approved, the powers granted to the operational manager(s) and partner that holds that position(s), and to a certain extent, the partner’s economic interest in the joint venture. The Company analyzes each joint venture initially to determine if it should be consolidated or unconsolidated.
Page 35
| • | Consolidated if the Company is the primary beneficiary of a VIE, or holds the majority of voting interests of a non-VIE (and no significant participative rights are available to the other partners). |
| • | Unconsolidated if the Company is not the primary beneficiary of a VIE, or does not hold the majority of voting interest of a non-VIE. |
Share-Based Payments - We measure the value of services received from employees and directors in exchange for an award of an equity instrument based on the grant-date fair value of the award. The computed value is recognized as a non-cash cost on a straight-line basis over the period the individual
Showing the first 8K of 85K characters. Open the full section
Item 7A. QUANTITATIVE AND QUALITATIVE DISCLOSURES ABOUT MARKET RISK
We do not enter into derivative financial instruments for trading, speculation or other purposes that would expose the Company to market risk. In the normal course of business, our results of operations are exposed to risks associated with fluctuations in interest rates and currency exchange rates.
Interest Rate Risk
Please see the Note 9- Borrowings in Notes to Consolidated Financial Statements beginning on Page F-1 of this Annual report on Form 10-K, which is incorporated herein by reference, for a discussion of the Revolving Credit Facility, Term Loan Facility and Note Purchase Agreement.
Our Term Loan Facility, Revolving Credit Facility, and certain other debt obligations are subject to variable rate interest which could be adversely affected by an increase in interest rates. As of September 28, 2018, we had an aggregate of $1.65 billion in outstanding borrowings under our Term Loan Facility and our Revolving Credit Facility. Interest on amounts borrowed under these agreements is subject to adjustment based on the Company’s Consolidated Leverage Ratio (as defined in the credit agreements governing the Term Loan Facility and Revolving Credit Facility). Depending on the Company’s Consolidated Leverage Ratio, borrowings under the Term Loan Facility and Revolving Credit Facility bear interest at a Eurocurrency rate plus a margin of between 1.0% and 1.5% or a base rate plus a margin of between 0% and 0.5%. Additionally, if our consolidated leverage ratio exceeds a certain amount, the interest on the Senior Notes may increase by 75 basis points.
For the year ended September 28, 2018, our weighted average floating rate borrowings were approximately $2.0 billion. If floating interest rates had increased by 1.00%, our interest expense for the year ended September 28, 2018 would have increased by approximately $20.4 million.
Foreign Currency Risk
In situations where our operations incur contract costs in currencies other than their functional currency, we attempt to have a portion of the related contract revenues denominated in the same currencies as the costs. In those situations, where revenues and costs are transacted in different currencies, we sometimes enter into foreign exchange contracts in order to limit our exposure to fluctuating foreign currencies. We follow the provisions of ASC No. 815, Derivatives and Hedging in accounting for our derivative contracts. The Company does not currently have exchange rate sensitive instruments that would have a material effect on our consolidated financial statements or results of operations.
Item 8. FINANCIAL STATEMENTS AND SUPPLEMENTARY DATA
The information required by this Item 8 is submitted as a separate section beginning on page F-1 of this Annual Report on Form 10-K and is incorporated herein by reference.
Page 52
Item 9. CHANGES IN AND DISAGREEMENTS WITH ACCOUNTANTS ON ACCOUNTING AND FINANCIAL DISCLOSURE
None.
Item 9A. CONTROLS AND PROCEDURES
Evaluation of Disclosure Controls and Procedures
The Company’s management, with the participation of its Chief Executive Officer and Chief Financial Officer, evaluated the effectiveness of the Company’s disclosure controls and procedures as defined by Rule 13a-15(e) of the Securities Exchange Act of 1934, as amended (the “Exchange Act”) as of September 28, 2018, the end of the period covered by this Annual Report on Form 10-K (the “Evaluation Date”). Based on that evaluation, and as a result of the material weakness in our internal control over financial reporting described below under Management's Annual Report on Internal Control Over Financial Reporting, the Chief Executive Officer and Chief Financial Officer have concluded that the Company’s disclosure controls and procedures (as defined in Rule 13a-15(e) under the Exchange Act) were not functioning effectively as of the Evaluation Date to provide reasonable assurance that the information required to be disclosed by the Company in reports filed or submitted under the Exchange Act is recorded, processed, summarized and reported within the time periods specified in the SEC’s rules and forms and that such information is accumulated and communicated to the Company’s management, including the Chief Executive Officer and Chief Financial Officer, as appropriate to allow timely decisions regarding required disclosure.
As permitted by SEC guidance for newly acquired businesses, management’s assessment of the Company’s disclosure controls and procedures did not include an assessment of those disclosure controls and procedures of CH2M HILL Companies, Ltd. (CH2M) that are subsumed by internal control over financial reporting. CH2M accounted for approximately 42% of total assets as of September 28, 2018, and 25% of revenues and 30% of operating profit for the fiscal year ended on September 28, 2018.
Management’s Annual Report on Internal Control Over Financial Reporting
Management is responsible for establishing and maintaining for the Company adequate internal control over financial reporting, as defined in Rule 13a-15(f) under the Exchange Act. Management, with the participation of its Chief Executive Officer and Chief Financial Officer, has assessed the effectiveness of the Company’s internal control over financial reporting as of the Evaluation Date based on the framework established in “Internal Control—Integrated Framework,” issued by the Committee of Sponsoring Organizations of the Treadway Commission (2013 framework). Based on this assessment and the material weakness identified below, management has concluded that the Company’s internal control over financial reporting as of the Evaluation Date was ineffective. As permitted by SEC guidance for newly acquired businesses, management’s assessment of the Company’s internal control over financial reporting did not include an assessment of internal control over financial reporting of CH2M. CH2M accounted for approximately 42% of total assets as of September 28, 2018, and 25% of revenues and 30% of operating profit for the fiscal year ended on September 28, 2018.
Management has identified the following material weakness as of September 28, 2018: A material weakness related to internal control deficiencies over the accounting for income taxes in connection with a business combination, specifically related to the ineffective design and operating effectiveness of controls over the completeness and accuracy of deferred taxes and the evaluation of the recoverability of deferred taxes associated with the CH2M acquisition.
The material weakness did not result in any material misstatements to the Company’s previously issued financial statements, nor in the financial statements included in this Form 10-K.
The Company's independent registered public accounting firm, Ernst & Young LLP, that audited the Company's consolidated financial statements included in this Annual Report on Form 10-K, also audited the effectiveness of our internal control over financial reporting as of September 28, 2018, as stated in their report included in this Annual Report on Form 10-K.
Remediation Plan
The Company's management is committed to maintaining a strong internal control environment. In response to the identified material weakness, management, with the oversight of the Audit Committee of the Board of Directors, will take comprehensive actions to remediate the material weakness in internal control over financial reporting, including implementing additional specific enhanced control procedures for the review, analysis and reporting of its deferred income tax accounts, including control procedures relating to the recoverability of deferred taxes associated with acquired businesses in a business combination. The Company has commenced its remediation plan, with the goal of remediating this material weakness as soon as possible, subject to the conclusion by management that the enhanced internal control over financial reporting is operating effectively following appropriate testing. The
Page 53
remediation efforts are intended both to address the identified material weakness and to enhance our overall financial control environment. As management continues to evaluate and work to improve the Company's disclosure controls and procedures and internal control over financial reporting, the Company may take additional measures to address these deficiencies or modify certain of the remediation measures described above.
Changes in Internal Control
Subject to the above, there were no changes in the Company’s internal control over financial reporting during the Company’s fiscal quarter ended September 28, 2018 that have materially affected, or are reasonably likely to materially affect, the Company’s internal control over financial reporting.
Limitations on Effectiveness of Controls
The Company’s management, including its Chief Executive Officer and Chief Financial Officer, does not expect that its disclosure controls and procedures or its system of internal control over financial reporting will prevent or detect all errors and all fraud. A control system, no matter how well designed or operated, can provide only reasonable, but not absolute, assurance that the objectives of the system of internal control are met. The design of the Company’s control system reflects the fact that there are resource constraints, and that the benefits of such control systems must be considered relative to their costs. Further, because of the inherent limitations in all control systems, no evaluation of controls can provide absolute assurance that all control failures and instances of fraud, if any, within the Company have been detected. These inherent limitations include the realities that judgments in decision-making can be faulty and that breakdowns can occur because of simple error or mistake. Additionally, controls can be circumvented by the intentional acts of individuals, by collusion of two or more people, or by management override of the controls. The design of any system of controls is also based in part on certain assumptions about the likelihood of future events, and there can be no assurance that the design of any particular control will always succeed in achieving its objective under all potential future conditions.
Item 9B. OTHER INFORMATION
None.
Page 54
PART III
Item 10. DIRECTORS, EXECUTIVE OFFICERS AND CORPORATE GOVERNANCE
Directors, Executive Officers, Promoters and Control Persons
The information required by Paragraph (a), and Paragraphs (c) through (g) of Item 401 of Regulation S-K (except for information required by Paragraph (e) of that Item to the extent the required information pertains to our executive officers) and Item 405 of Regulation S-K is set forth under the captions “Members of the Board of Directors,” “Corporate Governance” and “Section 16(a) Beneficial Ownership Reporting Compliance” in our definitive proxy statement to be filed with the SEC pursuant to Regulation 14A within 120 days after the close of our fiscal year and is incorporated herein by reference. The information required by Paragraph (b) of Item 401 of Regulation S-K, as well as the information required by Paragraph (e) of that Item to the extent the required information pertains to our executive officers, is set forth in Part I, Item 1 of this Annual Report on Form 10-K under the heading “Executive Officers of the Registrant.”
Code of Ethics
We have adopted a code of ethics for our Chief Executive Officer and senior financial officers; a code of business conduct and ethics for members of our Board of Directors and corporate governance guidelines. The full text of these codes of ethics and corporate governance guidelines are available at our website at www.jacobs.com. In the event we make any amendment to, or grant any waiver from, a provision of the code of ethics that applies to the principal executive officer, principal financial officer or principal accounting officer that requires disclosure under applicable SEC rules, we will disclose such amendment or waiver and the reasons therefor on our website. We will provide any person without charge a copy of any of the aforementioned codes of ethics upon receipt of a written request. Requests should be addressed to: Jacobs Engineering Group Inc., 1999 Bryan Street, Suite 1200, Dallas, Texas 75201, Attention: Corporate Secretary.
Corporate Governance
The information required by Items 407(d)(4) and (d)(5) of Regulation S-K is set forth under the caption “Corporate Governance” in our definitive proxy statement to be filed with the SEC pursuant to Regulation 14A within 120 days after the close of our fiscal year and is incorporated herein by reference.
Item 11. EXECUTIVE COMPENSATION
The information required by this Item is set forth under the captions “Corporate Governance,” “Compensation Committee Report,” “Compensation Discussion and Analysis” and “Executive Compensation” in our definitive proxy statement to be filed with the SEC pursuant to Regulation 14A within 120 days after the close of our fiscal year and is incorporated herein by reference.
Item 12. SECURITY OWNERSHIP OF CERTAIN BENEFICIAL OWNERS AND MANAGEMENT AND RELATED STOCKHOLDER MATTERS
Securities Authorized for Issuance Under Equity Compensation Plans
The following table presents certain information about our equity compensation plans as of September 28, 2018:
Page 55
| Column A | Column B | Column C | |||||||
| Plan Category | Number of securities to be issued upon exercise of outstanding options, warrants, and rights | Weighted- average exercise price of outstanding options, warrants, and rights | Number of securities remaining available for future issuance under equity compensation plans (excluding securities reflected in Column A) | ||||||
| Equity compensation plans approved by shareholders (a) | 1,766,759 | $ | 45.53 | 5,631,371 | |||||
| Equity compensation plans not approved by shareholders | — | — | — | ||||||
| Total | 1,766,759 | 45.53 | 5,631,371 |
| (a) | The number in Column A excludes purchase rights accruing under our two, broad-based, shareholder-approved employee stock purchase plans: The Jacobs Engineering Group Inc. 1989 Employee Stock Purchase Plan, as amended and restated (the “1989 ESPP”), and the Global Employee Stock Purchase Plan, as amended and restated (the “GESPP”). These plans give employees the right to purchase shares at an amount and price that are not determinable until the end of the specified purchase periods, which occur monthly. Our shareholders have authorized a total of 32.3 million shares of common stock to be issued through the 1989 ESPP and the GESPP. From the inception of the 1989 ESPP and the GESPP through September 28, 2018, a total of 28.0 million shares have been issued, leaving 4.3 million shares of common stock available for future issuance at that date. |
The information required by Item 403 of Regulation S-K is set forth under the caption “Security Ownership” in our definitive proxy statement to be filed with the SEC pursuant to Regulation 14A within 120 days after the close of our fiscal year and is incorporated herein by reference.
Item 13. CERTAIN RELATIONSHIPS AND RELATED TRANSACTIONS AND DIRECTOR INDEPENDENCE
The information required by this Item is set forth under the captions “Members of The Board of Directors,” “Corporate Governance,” and “Certain Relationships and Related Transactions” in our definitive proxy statement to be filed with the SEC pursuant to Regulation 14A within 120 days after the close of our fiscal year and is incorporated herein by reference.
Item 14. PRINCIPAL ACCOUNTING FEES AND SERVICES
The information required by this Item is set forth under the captions “Report of the Audit Committee” and “Audit and Non-Audit Fees” in our definitive proxy statement to be filed with the SEC pursuant to Regulation 14A within 120 days after the close of our fiscal year and is incorporated herein by reference.
Page 56
PART IV
EXHIBITS AND FINANCIAL STATEMENTS
Item 15. EXHIBITS AND FINANCIAL STATEMENT SCHEDULES
(a) Documents filed as part of this report:
| (1) | The Company’s Consolidated Financial Statements at September 28, 2018 and September 29, 2017 and for each of the three years in the period ended September 28, 2018, and the notes thereto, together with the report of the independent auditors on those Consolidated Financial Statements are hereby filed as part of this report, beginning on page F-1. |
| (2) | Financial statement schedules – no financial statement schedules are presented as the required information is either not applicable, or is included in the consolidated financial statements or notes thereto. |
| (3) | See Exhibit Index below. |
(b) Exhibit Index:
Page 57
Showing the first 8K of 247K characters. Open the full section