 filings.tools
J.B. Hunt Transport Services (JBHT) 10-K risk factor changes: FY2019 vs FY2018
The 2019-12-31 10-K against the 2018-12-31 one, compared heading by heading and sentence by sentence. One of these filings carries no fiscal year tag, so its year is the calendar year of the period end.
Item 1A10 rewritten9 added17 removed74 unchanged
All filing items691 rewritten290 added183 removed825 unchanged
Summary
counted, not written
- Item 1A lists 14 risk factor headings: 2 new, 0 reworded and 12 unchanged since FY2018. 1 heading from FY2018 no longer appears.
- Sentence by sentence, 290 added, 183 removed, 691 rewritten and 825 unchanged across 19 items that differ.
New Item 1A headings (2)
- Our business is significantly impacted by economic conditions, customer business cycles and seasonal factors.
- Our operations are subject to various environmental laws and regulations, including legislative and regulatory responses to climate change. Compliance with environmental requirements could result in significant expenditures and the violation of these regulations could result in substantial fines or penalties.
Removed Item 1A headings (1)
- Our operations are subject to various environmental laws and regulations, the violation of which could result in substantial fines or penalties.
A heading is new when no FY2018 heading matches it after ignoring case and punctuation, and reworded when it shares at least 60 percent of its words with one that went away. All current risk factor headings.
Sentences by item
21 items, with every count and a link to each item that changed
Underlined words on a shaded ground are new in FY2019; struck-through words were in FY2018. Sentences that are wholly new or wholly gone are labelled rather than marked.
Item 1A. RISK FACTORS
10 rewritten, 9 added, 17 removed, 74 unchanged
In addition to the [removed: forward-looking statements] [added: factors] outlined previously in this Form 10-K [added: regarding forward-looking statements] and other comments regarding risks and uncertainties, the following risk factors should be carefully considered when evaluating our business.
[removed: Economic] [added: Adverse economic] conditions [removed: represent a greater potential for loss, and we] may [removed: be required] [added: also require us] to increase our reserve for bad debt losses.
As of December 31, [removed: 2018,] [added: 2019,] we had no derivative financial instruments to reduce our exposure to fuel-price fluctuations.
We have policies in place for [removed: 2019] [added: 2020] with substantially the same terms as our [removed: 2018] [added: 2019] policies for personal injury, property damage, workers’ compensation, and cargo loss or [removed: damage, with the exception of decreasing our self-insured portion of workers’ compensation claims to zero for nearly all states.][added: damage.]
For the calendar year ended December 31, [removed: 2018,] [added: 2019,] our top 10 customers, based on revenue, accounted for approximately [removed: 30%] [added: 32%] of our revenue.
[removed: Tax] [added: Federal] and [added: state legislation as well as tax and] other regulatory authorities [removed: often seek] [added: have sought] to assert that independent contractors in the transportation service industry are employees rather than independent contractors.
There can be no assurance that interpretations that support the independent contractor status will not [removed: change] [added: change, that other federal] or [added: state legislation will not be enacted or] that various authorities will not successfully assert a position that re-classifies independent contractors to be employees.
We rely [removed: significantly on] [added: significantly on] our information technology systems, a disruption, failure or security breach of which could have a material adverse effect on our business.
[removed: Our] [added: Each of our] information technology systems may be susceptible to various interruptions, including equipment or network failures, failed upgrades or replacement of software, user error, power outages, natural disasters, cyber-attacks, terrorist attacks, computer viruses, hackers, or other security breaches.
[removed: Our operations are subject to various] [added: Compliance with] environmental [removed: laws and regulations, the violation of which] [added: requirements] could result in [added: significant expenditures and the violation of these regulations could result in] substantial fines or penalties.
Our business is significantly impacted by economic conditions, customer business cycles and seasonal factors.
Our business is dependent on the freight shipping needs of our customers, which can be heavily impacted by economic conditions and other factors affecting their businesses.
Recessionary economic cycles and downturns in customers’ business cycles, particularly in market segments and industries where we have a significant concentration of customers, may substantially reduce freight volumes for which our customers need transportation services and lead to excess capacity in the industry and resulting pressure on the rates we are able to obtain for our services.
Any of these factors could have a significant adverse effect on our financial condition and results of operations.
An example of such legislation recently enacted in California is currently under a judicial stay with respect to trucking companies while a legal challenge to the law is pending.
We have also invested significantly in the development of our Marketplace for J.B. Hunt 360 online freight matching platform, through which we are generating an increasing amount of revenue.
Our operations are subject to various environmental laws and regulations, including legislative and regulatory responses to climate change.
We are also subject to existing and potential future laws and regulations with regards to public policy on climate change.
If current regulatory requirements become more stringent or new environmental laws and regulations regarding climate change are introduced, we could be required to make significant expenditures or abandon certain activities, which could have a material adverse effect on our business and operating results.
Our business is dependent upon a number of factors that may have a material adverse effect on the results of our operations, many of which are beyond our control.
In addition to general U.S. economic trends, and to a lesser extent global economic trends, these factors include interference with or termination of our relationships with certain railroads; rail service delays; disruptions to U.S. port-of-call activity; significant increases or rapid fluctuations in fuel prices, fuel taxes, interest rates, insurance premiums, self-insurance levels, excess capacity in the intermodal or trucking industries, or license and registration fees; terrorist attacks or actions; acts of war; adverse weather conditions; disruption or failure of information technology systems; increased costs for new revenue equipment or decreases in the value of used equipment; increased tariffs assessed on or disruptions in the procurement of imported revenue equipment; volatile financial credit markets; operational disruption or adverse effects of business acquisitions; and difficulty in attracting and retaining qualified drivers, independent contractors, and third-party carriers.
We are also affected by recessionary economic cycles and downturns in customers’ business cycles, particularly in market segments and industries where we have a significant concentration of customers.
In January 2017, we exercised our right to utilize the arbitration process to review the division of revenue collected beginning May 1, 2016, as well as to clarify other issues, under our Joint Service Agreement with BNSF.
BNSF requested the same, and the arbitration process is on-going.
On October 5, 2018, we received the arbitrators’ Interim Award.
The details of the Interim Award are confidential and require the parties to submit additional information requested by the arbitrators to decide certain unresolved matters.
For the determined components of the Interim Award, we recorded an $18.3 million pre-tax charge in the third quarter 2018, related to certain charges claimed by BNSF for specific services requested for customers from April 2014 through May 2018.
On December 7, 2018 the arbitrators’ issued their Clarified Interim Award of October 5, 2018 resulting from some of the parties’ additional submissions to the Panel regarding certain issues related to determining the revenue division between the parties.
On January 11, 2019, the Panel issued its Second Interim Award ordering that $89.4 million is due from the Company to BNSF resulting from the adjusted revenue divisions relating to the 2016 period at issue ($52.1 million) and for calendar year 2017 ($37.3 million).
The parties have been instructed to make further submissions on the revenue divisions for calendar year 2018 and going forward, as well as other confidential issues raised during the arbitration process so that the panel can issue an appropriate interim and/or final award regarding all issues raised during the proceeding.
We recorded pretax charges for contingent liabilities in the fourth quarter 2018 of $89.4 million claimed by the BNSF for the period May 1, 2016 through December 31, 2017 and $44.6 million for the period January 1, 2018 through December 31, 2018, for a total of $134 million.
The other financial implications from the Interim Award and the Clarified Interim Award will not be fully determined until the arbitrators issue additional award(s) following their review of each party’s requested additional submissions.
At this time, we are unable to reasonably predict the final outcome of the arbitration, and, as such, no further gain or loss contingency can be determined or recorded.
If decided adversely, this matter could result in a liability material to our financial condition or results of operations.
BNSF provides a significant amount of rail transportation services to our JBI business segment.
Normal commercial business activity between the parties, including load tendering, load tracing, billing and payments, is expected to continue on a timely basis.
Item 7. MANAGEMENT’S DISCUSSION AND ANALYSIS OF FINANCIAL CONDITION AND RESULTS OF OPERATIONS
127 rewritten, 53 added, 36 removed, 171 unchanged
We have policies in place for [removed: 2019] [added: 2020] with substantially the same terms as our [removed: 2018] [added: 2019] policies for personal injury, property damage, workers’ compensation, and cargo loss or [removed: damage, with the exception of decreasing our self-insured portion of workers’ compensation claims to zero for nearly all states.][added: damage.]
At December 31, [removed: 2018,] [added: 2019,] we had an accrual of approximately [removed: $260] [added: $263] million for estimated claims.
At December 31, [removed: 2018,] [added: 2019,] we have recorded [removed: $261] [added: $281] million of expected reimbursement for covered excess claims, other insurance deposits, and prepaid insurance premiums.
We have not identified any impairment to our assets at December 31, [removed: 2018.][added: 2019.]
| | | [removed: 2018] [added: 2019] | | | | [removed: 2017] [added: 2018] | | | | [removed: 2016] [added: 2017] | | | | [removed: 2018] [added: 2019] vs. [removed: 2017] [added: 2018] | | | | [removed: 2017] [added: 2018] vs. [removed: 2016] [added: 2017] | | |
| Operating revenues | | | 100.0 | % | | | 100.0 | % | | | 100.0 | % | | | [removed: 19.8] [added: 6.4] | % | | | [removed: 9.7] [added: 19.8] | % |
| Rents and purchased transportation | | | [removed: 51.5] [added: 49.4] | | | | [removed: 50.8] [added: 51.5] | | | | [removed: 49.7] [added: 50.8] | | | | [removed: 21.5] [added: 2.1] | | | | [removed: 12.1] [added: 21.5] | |
| Salaries, wages and employee benefits | | | [removed: 22.4] [added: 23.7] | | | | 22.4 | | | | 22.4 | | | | [removed: 19.8] [added: 12.5] | | | | [removed: 9.5] [added: 19.8] | |
| Fuel and fuel taxes | | | [removed: 5.3] [added: 5.1] | | | | [removed: 4.8] [added: 5.3] | | | | [removed: 4.3] [added: 4.8] | | | | [removed: 32.1] [added: 0.9] | | | | [removed: 22.6] [added: 32.1] | |
| Depreciation and amortization | | | [removed: 5.1] [added: 5.4] | | | | [removed: 5.3] [added: 5.1] | | | | [removed: 5.5] [added: 5.3] | | | | [removed: 13.7] [added: 14.5] | | | | [removed: 6.1] [added: 13.7] | |
| Operating supplies and expenses | | | [removed: 3.5] [added: 3.6] | | | | [removed: 3.6] [added: 3.5] | | | | 3.6 | | | | [removed: 18.0] [added: 9.7] | | | | [removed: 10.3] [added: 18.0] | |
| General and administrative expenses, net of asset dispositions | | | [removed: 1.8] [added: 2.1] | | | | 1.8 | | | | [removed: 1.3] [added: 1.8] | | | | [removed: 29.7] [added: 17.6] | | | | [removed: 44.6] [added: 29.7] | |
| Insurance and claims | | | [removed: 1.5] [added: 1.7] | | | | [removed: 1.7] [added: 1.5] | | | | [removed: 1.2] [added: 1.7] | | | | [removed: 4.7] [added: 21.5] | | | | [removed: 57.6] [added: 4.7] | |
| Operating taxes and licenses | | | 0.6 | | | | 0.6 | | | | [removed: 0.7] [added: 0.6] | | | | [removed: 14.0] [added: 8.3] | | | | [removed: (2.5] [added: 14.0] | [removed: )] |
| Communication and utilities | | | 0.4 | | | | [removed: 0.3] [added: 0.4] | | | | 0.3 | | | | [removed: 28.9] [added: 12.6] | | | | [removed: 20.1] [added: 28.9] | |
| Total operating expenses | | | [removed: 92.1] [added: 92.0] | | | | [removed: 91.3] [added: 92.1] | | | | [removed: 89.0] [added: 91.3] | | | | [removed: 20.8] [added: 6.3] | | | | [removed: 12.5] [added: 20.8] | |
| Operating income | | | [removed: 7.9] [added: 8.0] | | | | [removed: 8.7] [added: 7.9] | | | | [removed: 11.0] [added: 8.7] | | | | [removed: 9.2] [added: 7.8] | | | | [removed: (13.5] [added: 9.2] | [removed: )] |
| Net interest expense | | | [removed: 0.5] [added: 0.6] | | | | [removed: 0.4] [added: 0.5] | | | | 0.4 | | | | [removed: 40.8] [added: 31.7] | | | | [removed: 13.2] [added: 40.8] | |
| Earnings before income taxes | | | 7.4 | | | | [removed: 8.3] [added: 7.4] | | | | [removed: 10.6] [added: 8.3] | | | | [removed: 7.7] [added: 6.3] | | | | [removed: (14.5] [added: 7.7] | [removed: )] |
| Income taxes | | | [removed: 1.7] [added: 1.8] | | | | [removed: (1.2] [added: 1.7] | [removed: )] | | | [removed: 4.0] [added: (1.2] | [added: )] | | | [removed: 266.1] [added: 8.8] | | | | [removed: (134.5] [added: 266.1] | [removed: )] |
| Net earnings | | | [removed: 5.7] [added: 5.6] | % | | | [removed: 9.5] [added: 5.7] | % | | | [removed: 6.6] [added: 9.5] | % | | | [removed: (28.7] [added: 5.5] | [removed: %)] [added: %] | | | [removed: 58.8] [added: (28.7] | [removed: %] [added: %)] |
[removed: 2018] [added: 2019] Compared With [removed: 2017][added: 2018]
In addition, our JBI segment incurred charges of $152.3 million to rail purchase transportation expense related to the [removed: ongoing] arbitration with BNSF.
We operated four business segments during calendar year [removed: 2018.][added: 2019.]
| | | [removed: 2018] [added: 2019] | | | | [removed: 2017] [added: 2018] | | | | [removed: 2016] [added: 2017] | | |
| JBI | | $ | [removed: 4,717] [added: 4,745] | | | $ | [removed: 4,084] [added: 4,717] | | | $ | [removed: 3,796] [added: 4,084] | |
| DCS | | | [removed: 2,163] [added: 2,695] | | | | [removed: 1,719] [added: 2,163] | | | | [removed: 1,533] [added: 1,719] | |
| ICS | | | [removed: 1,335] [added: 1,348] | | | | [removed: 1,025] [added: 1,335] | | | | [removed: 852] [added: 1,025] | |
| JBT | | | [removed: 417] [added: 389] | | | | [removed: 378] [added: 417] | | | | [removed: 388] [added: 378] | |
| Total segment revenues | | | [removed: 8,632] [added: 9,177] | | | | [removed: 7,206] [added: 8,632] | | | | [removed: 6,569] [added: 7,206] | |
| Intersegment eliminations | | | [removed: (17] [added: (12] | ) | | | [removed: (16] [added: (17] | ) | | | [removed: (14] [added: (16] | ) |
| Total | | $ | [removed: 8,615] [added: 9,165] | | | $ | [removed: 7,190] [added: 8,615] | | | $ | [removed: 6,555] [added: 7,190] | |
| JBI | | $ | [removed: 401] [added: 447] | | | $ | [removed: 407] [added: 401] | | | $ | [removed: 450] [added: 407] | |
| DCS | | | [removed: 193] [added: 269] | | | | [removed: 171] [added: 193] | | | | [removed: 205] [added: 171] | |
| ICS | | | [removed: 50] [added: (11] | [added: )] | | | [removed: 23] [added: 50] | | | | [removed: 36] [added: 23] | |
| JBT | | | [removed: 37] [added: 29] | | | | [removed: 23] [added: 37] | | | | [removed: 30] [added: 23] | |
| Total | | $ | [removed: 681] [added: 734] | | | $ | [removed: 624] [added: 681] | | | $ | [removed: 721] [added: 624] | |
| Loads | | | [removed: 2,049,014] [added: 1,979,169] | | | | [removed: 1,999,807] [added: 2,049,014] | | | | [removed: 1,916,303] [added: 1,999,807] | |
| Average length of haul (miles) | | | [removed: 1,648] [added: 1,679] | | | | [removed: 1,681] [added: 1,648] | | | | [removed: 1,657] [added: 1,681] | |
| Revenue per load | | $ | [removed: 2,302] [added: 2,397] | | | $ | [removed: 2,042] [added: 2,302] | | | $ | [removed: 1,981] [added: 2,042] | |
For 2017 and 2018, we were self-insured for $500,000 per occurrence for personal injury and property damage and self-insured for $100,000 per workers’ compensation claim.
For 2019, we were self-insured for $500,000 per occurrence for personal injury and property damage and fully insured for workers’ compensation claims for nearly all states.
Our total consolidated operating revenues increased 6.4% to $9.17 billion in 2019, compared to $8.61 billion in 2018, primarily due to increased revenue in DCS related to an increase in revenue producing trucks, higher truck productivity, defined as revenue per truck per week, and an acquisition in the first quarter 2019.
The increase in revenue was further attributable to increased load volumes in ICS and higher revenue per load in JBI, partially offset by a decrease in JBI load volumes and a reduction in rates per loaded mile and the number of operating tractors in JBT.
Fuel surcharge revenues decreased 1.4% to $1.04 billion in 2019, compared to $1.06 billion in 2018.
Rents and purchased transportation costs increased 2.1% in 2019, primarily due to increased rail and truck purchased transportation rates within JBI and ICS segments and JBI rail purchased transportation costs, including a $26.8 million charge in 2019, resulting from the issuance of an award regarding our arbitration with BNSF.
The current year increase in rents and purchased transportation costs was partially offset by a $152.3 million BNSF arbitration related charge recorded by JBI in 2018.
Operating supplies and expenses increased 9.7%, driven primarily by higher equipment maintenance and tire expenses due to increased equipment counts, increased toll costs, higher travel costs, and higher facility maintenance expenses.
General and administrative expenses increased 17.6% from 2018, primarily due to increased technology spend on the J.B. Hunt 360 platform and legacy system upgrades, higher Final Mile Services® (FMS) network facility costs, and increased advertising expenses.
Insurance and claims expense increased 21.5% in 2019, primarily due to 2019 including a $17.4 million reserve charge for arbitration related legal fees, costs and interest claimed by BNSF and the inclusion of a $20.0 million FMS claim charge within DCS, partially offset by 2018 including specific reserve charges for the settlement of lawsuits with current and former drivers.
The increase in 2019 was primarily due to a reduction in discreet tax benefits recognized related to share-based compensation vesting, partially offset by favorable settlements of state income tax audits during 2019.
| | | 2019 | | | | 2018 | | | | 2017 | | |
| --- | --- | --- | --- | --- | --- | --- | --- | --- | --- | --- | --- | --- |
| | | 2019 | | | | 2018 | | | | 2017 | | |
| Marketplace for J.B. Hunt 360: | | | | | | | | | | | | |
| Approximate carrier tractor count (end of period) | | | 682,000 | | | | 529,000 | | | | 312,000 | |
| Revenue (millions) | | $ | 839.8 | | | $ | 557.8 | | | $ | 125.8 | |
| --- | --- |
| --- | --- |
Eastern network load volumes decreased 9% and transcontinental loads increased 1% compared to 2018.
Revenue per load excluding fuel surcharges increased approximately 6% compared to 2018.
Benefits from customer rate increases and freight mix were partially offset by decreased volumes, which includes volume lost to rail rationalization, increased rail purchased transportation costs, higher equipment ownership and maintenance costs, increased technology modernization expenses, lower box turns, higher box repositioning costs and increased driver wages and recruiting costs.
Current year operating income was further impacted by a $26.8 million charge to rail purchase transportation expense resulting from the issuance of an award regarding our arbitration with BNSF and a $17.4 million charge to insurance and claims expense, for arbitration related legal fees, costs and interest claimed by BNSF.
JBI recorded $152.3 million of additional BNSF arbitration related charges in 2018.
Excluding these 2018 charges and the 2019 arbitration related charges of $44.2 million, operating income for 2019, decreased 11% when compared to 2018.
DCS segment revenue increased 25% to $2.69 billion in 2019, from $2.16 billion in 2018.
The increase in productivity was primarily a result of the acquisition of Cory 1st Choice Home Delivery (Cory), better integration of assets between customer accounts, customer rate increases, and increased customer supply chain fluidity during 2019 compared to 2018.
In addition, the growth in DCS revenue includes an increase of $187 million in FMS revenue, the majority of which was derived from the first quarter 2019 Cory acquisition.
Approximately 58% of these additions represent private fleet conversions and 15% represent FMS versus traditional dedicated capacity fleets.
Customer retention rates remain above 98%.
The increase is primarily due to increased productivity and additional trucks under contract, partially offset by higher insurance and claims costs, which included a $20.0 million FMS claim charge in the second quarter 2019, higher costs from the expanded FMS network, increased driver wages and recruiting costs, and additional non-cash amortization expense of $3.8 million compared to 2018.
ICS segment revenue increased 1% to $1.35 billion in 2019, from $1.33 billion in 2018.
Revenue per load remained flat when compared to 2018 primarily due to customer mix changes, a lower spot pricing market and a competitive pricing environment for contractual truckload business, when compared to 2018.
ICS segment incurred an operating loss of $11 million in 2019, compared to operating income of $50 million in 2018.
The decrease in operating income was primarily due to lower gross profit margins, increased expenses to expand capacity and functionality of the Marketplace for J.B. Hunt 360, higher personnel costs, and increased digital marketing expenses.
Gross profit margin decreased to 13.1% in the current year versus 15.4% last year primarily due to weaker spot market activity and lower contractual rates on committed business compared to 2018.
Approximately $840 million of ICS revenue for 2019 was executed through the Marketplace for J.B. Hunt 360 compared to $558 million in 2018.
JBT segment revenue decreased 7% to $389 million in 2019, from $417 million in 2018.
At the end of 2019, JBT operated 1,831 tractors compared to 2,112 at the end of 2018.
The decrease in operating income was driven primarily by lower spot market activity, higher empty miles per load, increased driver wages and recruiting costs, and the reduction in overall load volumes.
If our suppliers were unable to perform under the terms of our agreements for trade-in values, it could have a material adverse effect on our financial results.
| | | | | | | | | | | | | |
Our total consolidated operating revenues increased 9.7% to $7.19 billion in 2017, compared to $6.56 billion in 2016, primarily due to overall increased load volume and higher revenue per load in our JBI, DCS, and ICS segments.
Fuel surcharge revenues increased 37.5% to $754 million in 2017, compared to $548 million in 2016.
Rents and purchased transportation costs increased 12.1% in 2017, primarily due to increased rail and truck purchased transportation rates and the increase in load volume, which increased services provided by third-party rail and truck carriers within JBI and ICS segments.
In addition, 2016 included a $15.2 million benefit recorded to reflect a change in our employee paid time off policy.
Operating supplies and expenses increased 10.3%, driven primarily by increased mileage activity and tire expense.
General and administrative expenses increased 44.6% from 2016, primarily due to a $20.2 million reserve of a cash advance for the purchases of new trailing equipment from a manufacturer that did not meet delivery, increased building rental expense, higher professional fee expenses, higher computer software subscription costs, and increased net losses from asset sales and disposals in 2017.
Insurance and claims expense increased 57.6% in 2017, primarily due to higher incident volume and accident severity and an $18.6 million increase in reserves for certain claims not covered by insurance.
The decrease in 2017 was primarily due to a $309.2 million decrease in income tax expense resulting from adjustments to our deferred tax balances at December 31, 2017, for the change in future tax rates prescribed by the Tax Cuts and Jobs Act.
Load volume in our transcontinental loads grew 7.2% while our eastern network was relatively flat compared to 2016.
Revenue per load excluding fuel surcharge was flat in 2017 when compared to 2016.
Benefits from volume growth and increased revenue per load were offset by increases in rail purchased transportation costs, rail inefficiencies, higher driver wages and recruiting costs, higher equipment ownership costs, increased insurance and claims costs, which included an $8.5 million increase in reserves for certain insurance and claims, and the $20.2 million expense for the reserve of a cash advance for the purchases of new trailing equipment from a manufacturer that did not meet delivery.
In addition, 2016 included a $5.7 million, one-time benefit from the change in paid time off policy.
DCS segment revenue increased 12.1% to $1.72 billion in 2017, from $1.53 billion in 2016.
The increase in revenue in 2017 was primarily a result of better integration of assets among customer accounts and customer rate increases, partially offset by lower productivity under new customer contracts, compared to 2016.
The increase in revenue and improved asset utilization were offset by higher driver wages and recruiting costs, increased insurance and claims cost, which included a $7.6 million increase in reserves for certain insurance and claims, increased start up expenditures for new customer contracts, higher equipment ownership costs, and the addition of acquisition costs and intangible asset amortization associated with the purchase of SLD when compared to 2016.
In addition, 2016 included a $7.3 million, one-time benefit from the change in paid time off policy.
ICS segment revenue increased 20.3% to $1.02 billion in 2017, from $852 million in 2016.
Revenue per load increased 3.3% primarily due to freight mix changes driven by customer demand.
Operating income decreased to $23 million in 2017, from $36 million in 2016, primarily due to lower gross profit margins, increased insurance and claims cost, which included a $1.8 million increase in reserves for certain insurance and claims, increased number of branches less than two years old, and higher technology development costs.
ICS gross profit margin decreased to 13.3% for 2017 from 14.3% for 2016.
In addition, 2016 included a $1.0 million, one-time benefit from the change in paid time off policy.
JBT segment revenue decreased 2.4% to $378 million in 2017, from $388 million in 2016, primarily from a 3.8% decrease in load count partially offset by a 1.4% increase in revenue per load.
The decrease in operating income was driven primarily by lower revenue, increased driver wages and recruiting costs, higher independent contractor cost per mile, increased insurance and claims cost, which included an $0.7 million increase in reserves for certain insurance and claims, and increased tractor maintenance costs compared to 2016.
In addition, 2016 included a $1.2 million, one-time benefit from the change in paid time off policy.
This increase was primarily due to the increase in pre-tax earnings and the reduction in the U.S. federal corporate tax rate as a result of the Tax Cuts and Jobs Act, in 2018.
The increase resulted primarily from an increase in equipment purchases, net of proceeds from the sale of equipment, in 2018, partially offset by the 2017 purchase of SLD.
For our senior notes maturing in 2019, it is our intent to pay the entire outstanding balances in full, on or before the maturity dates, using our existing senior revolving line of credit or other sources of long-term financing.
In addition, we have a shelf registration filed with the SEC and may draw upon it as warranted.
As previously mentioned above, the Tax Cuts and Jobs Act was enacted in December 2017.
Beginning in 2018, the Act reduced the U.S. federal corporate tax rate from 35% to 21%, which had a positive effect on our overall liquidity.
As of December 31, 2018, we had approximately $117.8 million of obligations, primarily related to facility leases.
| Operating leases | | $ | 117.8 | | | $ | 34.9 | | | $ | 50.6 | | | $ | 21.9 | | | $ | 10.4 | |
| Interest payments on debt (1) | | | 154.3 | | | | 36.1 | | | | 68.5 | | | | 47.3 | | | | 2.4 | |
| Total | | $ | 1,812.7 | | | $ | 702.6 | | | $ | 119.1 | | | $ | 728.2 | | | $ | 262.8 | |
An excerpt. Shown here: 40 of 127 rewritten, 40 of 53 added and all 36 removed. The counts are complete. For every sentence, read Item 7. MANAGEMENT’S DISCUSSION AND ANALYSIS OF FINANCIAL CONDITION AND RESULTS OF OPERATIONS in the FY2019 filing and the FY2018 filing.
Item 7A. QUANTITATIVE AND QUALITATIVE DISCLOSURES ABOUT MARKET RISK
6 rewritten, 0 added, 0 removed, 11 unchanged
Our senior notes have fixed interest rates ranging from [removed: 2.40%] [added: 3.30%] to [removed: 3.85%.][added: 3.875%.]
We currently have [added: an] interest rate swap [removed: agreements] [added: agreement] which effectively [removed: convert our $250 million of 2.40% fixed-rate senior notes due March 2019 and] [added: converts] our $350 million of 3.30% fixed-rate senior notes due August 2022 to [added: a] variable [removed: rates.][added: rate.]
The applicable interest [removed: rates] [added: rate] under [removed: these] [added: this] swap [removed: agreements are] [added: agreement is] based on LIBOR plus an established margin.
At our current level of borrowing, a one-percentage-point increase in our applicable rate would reduce annual pretax earnings by [removed: $9.1] [added: $3.5] million.
Additionally, foreign currency transaction gains and losses were not material to our results of operations for the year ended December 31, [removed: 2018.][added: 2019.]
As of December 31, [removed: 2018,] [added: 2019,] we had no derivative financial instruments to reduce our exposure to fuel-price fluctuations.
Item 1. BUSINESS
30 rewritten, 11 added, 4 removed, 75 unchanged
[removed: Utilizing] [added: We also provide comprehensive transportation and logistics services with] a network of thousands of reliable third-party [removed: carriers, we also provide comprehensive transportation and logistics services.][added: carriers.]
Our [removed: customers’ business activities are extremely diverse, and our] customer base includes a large number of Fortune 500 companies.
These segments include Intermodal (JBI), Dedicated Contract Services® (DCS), Integrated Capacity [removed: Solutions] [added: Solutions™] (ICS), and Truckload (JBT).
Our business [removed: is somewhat seasonal, with] [added: usually involves] slightly higher freight volumes [removed: typically experienced during] [added: in] August through early November.
[removed: Our] [added: Meanwhile,] DCS [removed: segment] is subject to [removed: somewhat] less seasonal variation than our other segments.
We forge long-term [removed: partnerships] [added: relationships] with key customers that include supply-chain management as an integral part of their strategies.
We continually analyze [removed: where we believe] [added: opportunities for] additional capital [removed: should be invested] [added: investment] and [added: where] management’s resources should be focused to provide [removed: added] [added: more] benefits to our customers.
Segment information is also included in Note [removed: 13] [added: 14] to our Consolidated Financial Statements.
JBI operates [removed: 88,739] [added: 96,743] pieces of company-owned trailing equipment systemwide.
We own and maintain our own chassis fleet, consisting of [removed: 81,442] [added: 82,731] units.
JBI also manages a fleet of [removed: 5,017] [added: 4,989] company-owned tractors, [removed: 633] [added: 570] independent contractor trucks, and [removed: 6,208] [added: 6,376] company drivers.
At December 31, [removed: 2018,] [added: 2019,] the total JBI employee count was [removed: 7,081.][added: 7,281.]
Revenue for the JBI segment in [removed: 2018] [added: 2019] was [removed: $4.72] [added: $4.74] billion.
Our final-mile delivery services are supported with a network of approximately [removed: 102] [added: 120] cross-dock and other delivery system network locations nationwide, with 98% of the continental U.S. population living within 150 miles of a network location.
At December 31, [removed: 2018,] [added: 2019,] this segment operated [removed: 9,652] [added: 10,542] company-owned trucks, [removed: 412] [added: 505] customer-owned trucks, and [removed: 51] [added: 40] independent contractor trucks.
DCS also operates [removed: 20,344] [added: 20,860] owned pieces of trailing equipment and [removed: 6,366] [added: 7,258] customer-owned trailers.
The DCS segment employed [removed: 13,747] [added: 15,019] people, including [removed: 11,331] [added: 12,181] drivers, at December 31, [removed: 2018.][added: 2019.]
DCS revenue for [removed: 2018] [added: 2019] was [removed: $2.16] [added: $2.69] billion.
ICS [added: also] provides single-source logistics management for customers desiring to outsource their transportation functions and utilize our proven supply-chain technology and design expertise to improve efficiency.
ICS operates [removed: 44] [added: 37] remote sales offices or branches, as well as on-site logistics personnel working in direct contact with customers.
At December 31, [removed: 2018,] [added: 2019,] the ICS segment employed [removed: 1,142] [added: 1,213] people, with a carrier base of approximately [removed: 73,100.][added: 84,400.]
ICS revenue for [removed: 2018] [added: 2019] was [removed: $1.33] [added: $1.35] billion.
At December 31, [removed: 2018,] [added: 2019,] the JBT segment operated [removed: 1,139] [added: 845] company-owned tractors and employed [removed: 1,440] [added: 1,102] people, [removed: 1,200] [added: 868] of whom were drivers.
At December 31, [removed: 2018,] [added: 2019,] we had [removed: 973] [added: 986] independent contractors operating in the JBT segment.
JBT revenue for [removed: 2018] [added: 2019] was [removed: $417] [added: $389] million.
As of December 31, [removed: 2018,] [added: 2019,] we had [removed: 27,621] [added: 29,056] employees, which consisted of [removed: 18,739] [added: 19,425] company drivers, [removed: 7,589] [added: 8,292] office personnel, [removed: and 1,293] [added: 1,137] maintenance [removed: technicians.][added: technicians, and 202 delivery and material assistants.]
We also had arrangements with approximately [removed: 1,657] [added: 1,596] independent contractors to transport freight in our trailing equipment.
As of December 31, [removed: 2018,] [added: 2019,] our company-owned tractor and truck fleet consisted of [removed: 15,808] [added: 16,376] units.
In addition, we had [removed: 1,657] [added: 1,596] independent contractors who operate their own tractors but transport freight in our trailing equipment.
At December 31, [removed: 2018,] [added: 2019,] the average age of our combined tractor fleet was 2.3 years, while our containers averaged [removed: 6.4] [added: 7.0] years of age and our trailers averaged [removed: 6.3] [added: 6.5] years.
Our customers, who include many Fortune 500 companies, have extremely diverse businesses.
Many of them are served by J.B. Hunt 360○®, an online platform that offers shippers and carriers greater access, visibility and transparency of the supply chain.
Our Company’s mission, to create the most efficient transportation network in North America, focuses on delivering both for our customers across all of our business segments.
We seek to accomplish this by maintaining a modern fleet to maximize fuel efficiency, converting loads from truck to rail with our intermodal service, and introducing technologies to optimize freight flows in the supply chain by eliminating waste.
Additionally, we continue to test and explore the usage of alternative fuel vehicles.
Efforts to improve fleet fuel efficiency and reduce greenhouse gas emissions are ongoing.
We are an Environmental Protection Agency (EPA) SmartWay® Transport Partner, and proud to have been awarded the EPA’s SmartWay® Excellence Award each of the last twelve years.
Furthermore, we offer an online multimodal marketplace via J.B. Hunt 360 that matches the right load with the right carrier and the best mode.
We provide many transportation services that meet the supply-chain logistics needs of shippers.
In addition to our sales teams, J.B. Hunt 360 offers instant access to a wide array of technology-driven solutions for customers and carriers.
Through the platform, businesses of all sizes can quote and book shipments, view analytics, and gain visibility into freight movement.
Our intermodal service addresses both demands.
Further, we are customizing dedicated solutions aimed at minimizing transportation-related carbon emissions.
Efforts to improve fleet fuel efficiency are ongoing, and we are an Environmental Protection Agency (EPA) SmartWaySM Transport Partner.
We provide a broad range of transportation services to shippers seeking to use a variety of transportation options to optimize their supply-chain logistics needs.
Item 3. LEGAL PROCEEDINGS
4 rewritten, 6 added, 15 removed, 7 unchanged
In January [removed: 2017,] [added: 2017] we exercised our right to utilize the arbitration process to review the division of revenue collected beginning May 1, 2016, as well as to clarify other issues, under our Joint Service Agreement with BNSF.
[removed: On] [added: In] October [removed: 5, 2018,] [added: 2018] we received the arbitrators’ Interim Award.
For the determined components of the Interim Award, we recorded an $18.3 million pre-tax charge in the third quarter [removed: 2018,] [added: 2018] related to certain charges claimed by BNSF for specific services requested for customers from April 2014 through May 2018.
[removed: On] [added: In] January [removed: 11, 2019,] [added: 2019] the Panel issued its Second Interim Award ordering that $89.4 million is due from the Company to BNSF resulting from the adjusted revenue divisions relating to the 2016 period at issue ($52.1 million) and for calendar year 2017 ($37.3 million).
BNSF requested the same.
In October 2019 the arbitrators issued a Final Award.
As a result, we recorded pre-tax charges in the third quarter 2019 of $26.8 million related to certain charges claimed by BNSF for the period January 1, 2018 through December 31, 2018 and no material adjustments for the period January 1, 2019 through September 30, 2019.
In addition, we recorded a $17.4 million charge in the third quarter 2019 for legal fees, costs and interest claimed by BNSF, for a total of $44.2 million.
On January 17, 2020, we filed under seal in the United States District Court for the Western District of Arkansas a motion to confirm and enforce the Final Award, seeking the Court’s specific enforcement of certain confidential contractual rights the arbitrators decided in our favor.
BNSF has moved to confirm the Final Award in the United States District Court for the District of Columbia.
We are a defendant in certain alleged class-action lawsuits in which the plaintiffs are current and former California-based drivers who allege claims for unpaid wages, failure to provide meal and rest periods, and other items.
In the lead class-action, we reached an agreement and recorded a reserve in September 2018 to resolve all pending claims for a class settlement payment of $15 million, subject to Court approval.
The Court granted preliminary settlement approval in November 2018.
Notice of the settlement has been mailed to all settlement class members and the deadline for objections to the settlement passed without any objections filed.
We expect the Court’s order granting final approval to be issued in April 2019.
The overlapping claims in the other alleged class-action lawsuits remain stayed pending final approval of the settlement in the lead class-action case.
BNSF requested the same, and the arbitration process is on-going.
The details of the Interim Award are confidential and require the parties to submit additional information requested by the arbitrators to decide certain unresolved matters.
On December 7, 2018 the arbitrators’ issued their Clarified Interim Award of October 5, 2018 resulting from some of the parties’ additional submissions to the Panel regarding certain issues related to determining the revenue division between the parties.
The parties have been instructed to make further submissions on the revenue divisions for calendar year 2018 and going forward, as well as other confidential issues raised during the arbitration process so that the panel can issue an appropriate interim and/or final award regarding all issues raised during the proceeding.
The other financial implications from the Interim Award and the Clarified Interim Award will not be fully determined until the arbitrators issue additional award(s) following their review of each party’s requested additional submissions.
At this time, we are unable to reasonably predict the final outcome of the arbitration, and, as such, no further gain or loss contingency can be determined or recorded.
If decided adversely, this matter could result in a liability material to our financial condition or results of operations.
BNSF provides a significant amount of rail transportation services to our JBI business segment.
Normal commercial business activity between the parties, including load tendering, load tracing, billing and payments, is expected to continue on a timely basis.
Cover and table of contents
21 rewritten, 14 added, 5 removed, 31 unchanged
[added: | | ☒ |] ANNUAL REPORT PURSUANT TO SECTION 13 OR 15(d) [removed: OF][added: OF THE SECURITIES EXCHANGE ACT OF 1934 |]
[removed: THE SECURITIES EXCHANGE ACT OF 1934][added: | | ☐ | Transition Report Pursuant to Section 13 or 15(d) of the Securities Exchange Act of 1934 for the transition Period from __________to__________ |]
[removed: |] For the fiscal year ended [removed: | Commission file number |]
| [removed: |] Arkansas | 71-0335111 | [removed: |]
| [removed: |] (State or other jurisdiction of | (I.R.S. Employer | [removed: |]
| [removed: |] incorporation or organization) | Identification No.) | [removed: |]
| [removed: |] 615 J.B. Hunt Corporate Drive | 72745-0130 | [removed: |]
| [removed: |] Lowell, Arkansas | (ZIP Code) | [removed: |]
| [removed: |] (Address of principal executive offices) | | [removed: |]
Securities registered pursuant to Section 12(g) of the Act: [removed: Common Stock, $0.01 Par Value]
Yes [removed: X] [added: ☒] No [removed: _____][added: ☐]
Yes [removed: _____] [added: ☐] No [removed: X][added: ☒]
Indicate by check mark whether the registrant has submitted electronically every Interactive Data File required to be submitted pursuant to Rule 405 of Regulation S-T (§232.405 of this chapter) during the preceding 12 months (or for such shorter period that the registrant was required to submit [removed: and post] such files).
Indicate by check mark whether the registrant is a large accelerated filer, an accelerated filer, a non-accelerated filer, [removed: or a] smaller reporting [added: company, or an emerging growth] company.
See the definitions of “large accelerated filer,” “accelerated filer,” [added: “non-accelerated filer,”] “smaller reporting company,” and “emerging growth company” in Rule 12b-2 of the Exchange Act.
[added: |] Large accelerated filer [removed: X] [added: ☒ |] Accelerated filer [removed: _____] [added: ☐ |] Non-accelerated filer [removed: _____] [added: ☐ |] Smaller reporting company [removed: _____] [added: ☐ |] Emerging growth company [added: ☐ |]
The aggregate market value of [removed: 86,721,074] [added: 84,485,328] shares of the registrant’s $0.01 par value common stock held by non-affiliates as of June 30, [removed: 2018,] [added: 2019,] was [removed: $10.5] [added: $7.7] billion (based upon [removed: $121.55] [added: $91.41] per share).
As of February [removed: 12, 2019,] [added: 18, 2020,] the number of outstanding shares of the registrant’s common stock was [removed: 108,738,788.][added: 106,258,961.]
Certain portions of the Notice and Proxy Statement for the Annual Meeting of Stockholders, to be held April [removed: 18, 2019,] [added: 23, 2020,] are incorporated by reference in Part III of this Form 10-K.
For The [removed: Fiscal Year] [added: Fiscal Year] Ended December 31, [removed: 2018][added: 2019]
Properties [removed: 10][added: 9]
December 31, 2019
| or |
| --- |
| --- | --- | --- |
| Commission file number 0-11757 |
| --- |
| Title of each class | Trading Symbol(s) | Name of each exchange on which registered |
| --- | --- | --- |
| Common Stock, $0.01 par value | JBHT | NASDAQ |
Yes ☒ No ☐
Yes ☒ No ☐
| --- | --- | --- | --- | --- |
Yes ☐ No ☒
| --- | --- | --- |
10-K 1 jbht20181231_10k.htm FORM 10-K
| December 31, 2018 | 0-11757 |
| --- | --- | --- | --- |
Indicate by check mark if disclosure of delinquent filers pursuant to Item 405 of Regulation S-K (§229.405 of this chapter) is not contained herein, and will not be contained, to the best of the registrant’s knowledge, in definitive proxy or information statements incorporated by reference in Part III of this Form 10-K or any amendment to this Form 10-K.
\[ \]
Item 4. Mine Safety Disclosures 10
7 rewritten, 0 added, 0 removed, 11 unchanged
Market for Registrant’s Common Equity, Related Stockholder Matters and Issuer Purchases of Equity Securities [removed: 12][added: 11]
Selected Financial Data [removed: 14][added: 13]
Management’s Discussion and Analysis of Financial Condition and Results of Operations [removed: 15][added: 14]
Quantitative and Qualitative Disclosures About Market Risk [removed: 25][added: 24]
Financial Statements and Supplementary Data [removed: 26][added: 25]
Changes in and Disagreements with Accountants on Accounting and Financial Disclosure [removed: 26][added: 25]
Controls and Procedures [removed: 26][added: 25]
Item 9B. Other Information 26
8 rewritten, 0 added, 0 removed, 24 unchanged
Directors, Executive Officers and Corporate Governance [removed: 27][added: 26]
Executive Compensation [removed: 27][added: 26]
Security Ownership of Certain Beneficial Owners and Management and Related Stockholder Matters [removed: 27][added: 26]
Certain Relationships and Related Transactions, and Director Independence [removed: 28][added: 27]
Principal Accounting Fees and Services [removed: 28][added: 27]
Exhibits, Financial Statement Schedules [removed: 29][added: 28]
| Signatures | | [removed: 31] [added: 30] |
Some of the factors and events that are not within our control and that could have a material impact on future operating results [removed: include: general] [added: include_ _the following:_ _general] economic and business [removed: conditions, competition] [added: conditions__;_ _competition] and competitive rate [removed: fluctuations, cost and availability of diesel fuel, ability to attract and retain qualified drivers_ _and delivery personnel__, a] [added: fluctuations__;_ _excess capacity in the intermodal or trucking industries;_ _a] loss of one or more major [removed: customers, interference] [added: customers__;_ _cost and availability of diesel fuel__;_ _interference] with or termination of our relationships with certain [removed: railroads,_] [added: railroads__;_] _rail service [removed: delays,_ _insurance costs] [added: delays__; disruptions to U.S. port-of-call activity;_ _ability to attract] and [removed: availability, claims expense, retention] [added: retain qualified drivers__,_ _delivery personnel__, independent contractors, and third-party carriers;_ _retention] of key [removed: employees, terrorist attacks or actions, acts of war, adverse weather conditions,_ _disruption or failure of information systems,_] [added: employees__;_ _insurance costs and availability__;_ _litigation and_ _claims expense__; determination that independent contractors are employees;_] _new or different environmental or other laws and [removed: regulations,_ _operational_] [added: regulations__; volatile financial credit markets or interest rates;_ _terrorist attacks or actions__;_ _acts of war__;_ _adverse weather conditions__;_] _disruption or [added: failure of information systems__;_ _operational disruption or] adverse effects of business [removed: acquisitions,_] [added: acquisitions;_] _increased costs for new revenue [removed: equipment] [added: equipment__; increased tariffs assessed on] or [removed: decreases] [added: disruptions] in the [added: procurement of imported revenue equipment;_ _decreases in the] value of used [removed: equipment__,_] [added: equipment__;_] _and the ability of revenue equipment manufacturers to perform in accordance with agreements for [removed: guarant__e__ed] [added: guaranteed] equipment trade-in [removed: values._][added: values__._]
Item 2. PROPERTIES
9 rewritten, 1 added, 2 removed, 5 unchanged
In addition, we own or lease [removed: a number of] buildings in Lowell that we utilize for administrative [removed: support, customer service, freight dispatch, data processing and warehousing, and data backup] [added: support] and [removed: disaster recovery.][added: warehousing.]
We also own or lease [removed: 43] [added: 46] other significant facilities across the United States where we perform maintenance on our equipment, provide bulk fuel, and employ personnel to support operations.
In addition, we have [removed: 98] [added: 117] leased [added: or owned] facilities in our DCS cross-dock and other delivery system networks, with the remaining [removed: four] [added: three] locations outsourced, and [removed: 44] [added: 37] leased or owned remote sales offices or branches in our ICS segment.
| Type | | Acreage | | | | [added: |] Maintenance Shop/ Cross-dock Facility (square feet) | | | | Office Space (square feet) | | |
| Maintenance and support facilities | | | [removed: 443] [added: 488] | | | | [removed: 1,020,000] | [added: 1,065,000] | | | [removed: 190,000] | [added: 196,000] | [added: |]
| Cross-dock and delivery system facilities | | | [removed: 24] [added: 20] | | | | [removed: 2,308,000] | [added: 3,348,000] | | | [removed: 124,000] | [added: 125,000] | [added: |]
| Corporate [removed: headquarters,] [added: headquarters campus,] Lowell, Arkansas | | | [removed: 88] [added: 119] | | | | [added: |] \- | | | | [removed: 407,000] [added: 600,000] | |
| Branch sales offices | | | \- | | | | [added: |] \- | | | | [removed: 92,000] [added: 91,000] | |
| Other facilities, offices, and parking yards | | | [removed: 343] [added: 335] | | | | [removed: 211,000] | [added: 129,000] | | | [removed: 129,000] | [added: 253,000] | [added: |]
| --- | --- | --- | --- | --- | --- | --- | --- | --- | --- | --- | --- | --- | --- |
| --- | --- | --- | --- | --- | --- | --- | --- | --- | --- | --- | --- | --- |
| Offices and data center, Lowell, Arkansas | | | 8 | | | | \- | | | | 60,000 | |
Item 5. MARKET FOR REGISTRANT’S COMMON EQUITY, RELATED STOCKHOLDER MATTERS AND ISSUER PURCHASES OF EQUITY SECURITIES
9 rewritten, 8 added, 8 removed, 13 unchanged
Our common stock is traded on the NASDAQ Global Select Market (NASDAQ) under the symbol “JBHT.” At December 31, [removed: 2018,] [added: 2019,] we were authorized to issue up to 1 billion shares of our common stock, and 167.1 million shares were issued.
We had [removed: 108.7] [added: 106.2] million and [removed: 109.8] [added: 108.7] million shares outstanding as of December 31, [removed: 2018] [added: 2019] and [removed: 2017,] [added: 2018,] respectively.
On February [removed: 12, 2019,] [added: 18, 2020,] we had [removed: 1,133] [added: 1,011] stockholders of record of our common stock.
On January [removed: 23, 2019,] [added: 22, 2020,] we announced an increase in our quarterly cash dividend from [removed: $0.24 to] $0.26 [added: to $0.27] per share, which will be paid February [removed: 22, 2019,] [added: 21, 2020,] to stockholders of record on February [removed: 8, 2019.][added: 7, 2020.]
The following table summarizes purchases of our common stock during the three months ended December 31, [removed: 2018:][added: 2019:]
The following graph compares the cumulative 5-year total return of stockholders of our common stock with the cumulative total returns of the S&P 500 index and [removed: two] [added: a] customized peer [removed: groups.][added: group.]
The peer group [removed: labeled “Peer Group 2017”] consists of [removed: 13 companies: C.H. Robinson Worldwide Inc., CSX Corp, Expeditors International Of Washington Inc., Hub Group Inc., Kansas City Southern, Norfolk Southern Corp, Old Dominion Freight Line Inc., Republic Services Inc., Ryder System Inc., Schneider National Inc., Stericycle Inc., Waste Management Inc. and XPO Logistics Inc. The peer group labeled “Peer Group 2018” consists of] 14 companies: C.H. Robinson Worldwide Inc., CSX [removed: Corp,] [added: Corporation,] Expeditors International [removed: Of] [added: of] Washington Inc., Hub Group Inc., Kansas City Southern, Knight-Swift Transportation Holdings Inc., Norfolk Southern [removed: Corp,] [added: Corporation,] Old Dominion Freight Line Inc., Republic Services Inc., Ryder System Inc., Schneider National Inc., Stericycle Inc., Waste Management [removed: Inc.] [added: Inc.,] and XPO Logistics Inc. The graph assumes the value of the investment in our common stock, in the index, and in [removed: each of] the peer [removed: groups] [added: group] (including reinvestment of dividends) was $100 on December 31, [removed: 2013,] [added: 2014] and tracks it through December 31, [removed: 2018.][added: 2019.]
[removed: 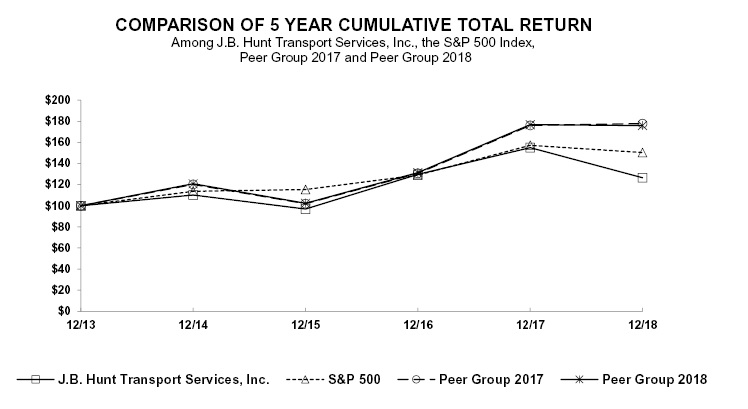][added: ]
| | | [removed: 2013 | | | |] 2014 | | | | 2015 | | | | 2016 | | | | 2017 | | | | 2018 | | | [added: | 2019 | | |]
| October 1 through October 31, 2019 | | | \- | | | $ | \- | | | | \- | | | $ | 145 | |
| November 1 through November 30, 2019 | | | \- | | | | \- | | | | \- | | | | 145 | |
| December 1 through December 31, 2019 | | | 441,097 | | | | 113.30 | | | | 441,097 | | | | 95 | |
| Total | | | 441,097 | | | $ | 113.30 | | | | 441,097 | | | $ | 95 | |
On January 22, 2020, our Board of Directors authorized an additional purchase of up to $500 million of our common stock.
| J.B. Hunt Transport Services, Inc. | | $ | 100.00 | | | $ | 87.97 | | | $ | 117.70 | | | $ | 140.76 | | | $ | 114.85 | | | $ | 145.58 | |
| S&P 500 | | | 100.00 | | | | 101.38 | | | | 113.51 | | | | 138.29 | | | | 132.23 | | | | 173.86 | |
| Peer Group | | | 100.00 | | | | 84.66 | | | | 108.63 | | | | 146.15 | | | | 145.42 | | | | 186.63 | |
| October 1 through October 31, 2018 | | | \- | | | $ | \- | | | | \- | | | $ | 421 | |
| November 1 through November 30, 2018 | | | \- | | | | \- | | | | \- | | | | 421 | |
| December 1 through December 31, 2018 | | | 493,905 | | | | 101.86 | | | | 493,905 | | | | 371 | |
| Total | | | 493,905 | | | $ | 101.86 | | | | 493,905 | | | $ | 371 | |
| J.B. Hunt Transport Services, Inc. | | $ | 100.00 | | | $ | 110.12 | | | $ | 96.88 | | | $ | 129.61 | | | $ | 155.01 | | | $ | 126.48 | |
| S&P 500 | | | 100.00 | | | | 113.69 | | | | 115.26 | | | | 129.05 | | | | 157.22 | | | | 150.33 | |
| Peer Group 2017 | | | 100.00 | | | | 120.17 | | | | 102.00 | | | | 130.72 | | | | 176.06 | | | | 177.76 | |
| Peer Group 2018 | | | 100.00 | | | | 120.90 | | | | 102.35 | | | | 131.32 | | | | 176.84 | | | | 175.96 | |
Item 6. SELECTED FINANCIAL DATA
30 rewritten, 1 added, 1 removed, 4 unchanged
| Earnings data for the years ended December 31, | | [removed: 2018] [added: 2019] | | | | [removed: 2017] [added: 2018] | | | | [removed: 2016] [added: 2017] | | | | [removed: 2015] [added: 2016] | | | | [removed: 2014] [added: 2015] | | |
| Operating revenues | | $ | [removed: 8,615] [added: 9,165] | | | $ | [removed: 7,190] [added: 8,615] | | | $ | [removed: 6,555] [added: 7,190] | | | $ | [removed: 6,188] [added: 6,555] | | | $ | [removed: 6,165] [added: 6,188] | |
| Operating income | | | [removed: 681] [added: 734] | | | | [removed: 624] [added: 681] | | | | [removed: 721] [added: 624] | | | | [removed: 716] [added: 721] | | | | [removed: 632] [added: 716] | |
| Net earnings | | | [removed: 490] [added: 516] | | | | [removed: 686] [added: 490] | | | | [removed: 432] [added: 686] | | | | [removed: 427] [added: 432] | | | | [removed: 375] [added: 427] | |
| Basic earnings per share | | | [removed: 4.48] [added: 4.81] | | | | [removed: 6.24] [added: 4.48] | | | | [removed: 3.84] [added: 6.24] | | | | [removed: 3.69] [added: 3.84] | | | | [removed: 3.20] [added: 3.69] | |
| Diluted earnings per share | | | [removed: 4.43] [added: 4.77] | | | | [removed: 6.18] [added: 4.43] | | | | [removed: 3.81] [added: 6.18] | | | | [removed: 3.66] [added: 3.81] | | | | [removed: 3.16] [added: 3.66] | |
| Cash dividends per share | | | [removed: 0.96] [added: 1.04] | | | | [removed: 0.92] [added: 0.96] | | | | [removed: 0.88] [added: 0.92] | | | | [removed: 0.84] [added: 0.88] | | | | [removed: 0.80] [added: 0.84] | |
| Rents and purchased transportation | | | [removed: 51.5] [added: 49.4] | % | | | [removed: 50.8] [added: 51.5] | % | | | [removed: 49.7] [added: 50.8] | % | | | [removed: 48.4] [added: 49.7] | % | | | [removed: 50.0] [added: 48.4] | % |
| Salaries, wages and employee benefits | | | [removed: 22.4] [added: 23.7] | | | | 22.4 | | | | 22.4 | | | | [removed: 22.5] [added: 22.4] | | | | [removed: 20.9] [added: 22.5] | |
| Fuel and fuel taxes | | | [removed: 5.3] [added: 5.1] | | | | [removed: 4.8] [added: 5.3] | | | | [removed: 4.3] [added: 4.8] | | | | [removed: 5.1] [added: 4.3] | | | | [removed: 7.4] [added: 5.1] | |
| Depreciation and amortization | | | [removed: 5.1] [added: 5.4] | | | | [removed: 5.3] [added: 5.1] | | | | [removed: 5.5] [added: 5.3] | | | | 5.5 | | | | [removed: 4.8] [added: 5.5] | |
| Operating supplies and expenses | | | [removed: 3.5] [added: 3.6] | | | | [removed: 3.6] [added: 3.5] | | | | 3.6 | | | | 3.6 | | | | [removed: 3.5] [added: 3.6] | |
| General and administrative expenses, net of asset dispositions | | | [removed: 1.8] [added: 2.1] | | | | 1.8 | | | | [removed: 1.3] [added: 1.8] | | | | [removed: 1.1] [added: 1.3] | | | | [removed: 0.8] [added: 1.1] | |
| Insurance and claims | | | [removed: 1.5] [added: 1.7] | | | | [removed: 1.7] [added: 1.5] | | | | [removed: 1.2] [added: 1.7] | | | | 1.2 | | | | [removed: 1.3] [added: 1.2] | |
| Operating taxes and licenses | | | 0.6 | | | | 0.6 | | | | [removed: 0.7] [added: 0.6] | | | | 0.7 | | | | 0.7 | |
| Communication and utilities | | | 0.4 | | | | [removed: 0.3] [added: 0.4] | | | | 0.3 | | | | 0.3 | | | | [removed: 0.4] [added: 0.3] | |
| Total operating expenses | | | [removed: 92.1] [added: 92.0] | | | | [removed: 91.3] [added: 92.1] | | | | [removed: 89.0] [added: 91.3] | | | | [removed: 88.4] [added: 89.0] | | | | [removed: 89.8] [added: 88.4] | |
| Operating income | | | [removed: 7.9] [added: 8.0] | | | | [removed: 8.7] [added: 7.9] | | | | [removed: 11.0] [added: 8.7] | | | | [removed: 11.6] [added: 11.0] | | | | [removed: 10.2] [added: 11.6] | |
| Net interest expense | | | [removed: 0.5] [added: 0.6] | | | | [removed: 0.4] [added: 0.5] | | | | 0.4 | | | | 0.4 | | | | 0.4 | |
| Earnings before income taxes | | | 7.4 | | | | [removed: 8.3] [added: 7.4] | | | | [removed: 10.6] [added: 8.3] | | | | [removed: 11.2] [added: 10.6] | | | | [removed: 9.8] [added: 11.2] | |
| Income taxes | | | [added: 1.8 | | | |] 1.7 | | | | (1.2 | ) | | | 4.0 | | | | 4.3 | | [removed: | | 3.7 | |]
| Net earnings | | | [removed: 5.7] [added: 5.6] | % | | | [removed: 9.5] [added: 5.7] | % | | | [removed: 6.6] [added: 9.5] | % | | | [removed: 6.9] [added: 6.6] | % | | | [removed: 6.1] [added: 6.9] | % |
| Balance sheet data as of December 31, | | [removed: 2018] [added: 2019] | | | | [removed: 2017] [added: 2018] | | | | [removed: 2016] [added: 2017] | | | | [removed: 2015] [added: 2016] | | | | [removed: 2014] [added: 2015] | | |
| Working capital ratio | | | [removed: 1.11] [added: 1.43] | | | | [removed: 1.45] [added: 1.11] | | | | [removed: 1.65] [added: 1.45] | | | | [removed: 1.61] [added: 1.65] | | | | [removed: 1.11] [added: 1.61] | |
| Total assets (millions) | | $ | [removed: 5,092] [added: 5,471] | | | $ | [removed: 4,465] [added: 5,092] | | | $ | [removed: 3,951] [added: 4,465] | | | $ | [removed: 3,630] [added: 3,951] | | | $ | [removed: 3,374] [added: 3,630] | |
| Stockholders’ equity (millions) | | $ | [removed: 2,101] [added: 2,267] | | | $ | [removed: 1,839] [added: 2,101] | | | $ | [removed: 1,414] [added: 1,839] | | | $ | [removed: 1,300] [added: 1,414] | | | $ | [removed: 1,205] [added: 1,300] | |
| Current portion of long-term debt (millions) | | [removed: $] | [removed: 251] [added: \-] | | | [added: $] | [removed: \-] [added: 251] | | | | \- | | | | \- | | | [removed: $] | [removed: 250] [added: \-] | |
| Total debt (millions) | | $ | [removed: 1,149] [added: 1,296] | | | $ | [removed: 1,086] [added: 1,149] | | | $ | [removed: 986] [added: 1,086] | | | $ | [removed: 998] [added: 986] | | | $ | [removed: 929] [added: 998] | |
| Total debt to equity | | | [removed: 0.55] [added: 0.57] | | | | [removed: 0.59] [added: 0.55] | | | | [removed: 0.70] [added: 0.59] | | | | [removed: 0.77] [added: 0.70] | | | | 0.77 | |
| Total debt as a percentage of total capital | | | [removed: 35] [added: 36] | % | | | [removed: 37] [added: 35] | % | | | [removed: 41] [added: 37] | % | | | [removed: 43] [added: 41] | % | | | [removed: 44] [added: 43] | % |
| --- | --- | --- | --- | --- | --- | --- | --- | --- | --- | --- | --- | --- | --- | --- | --- | --- | --- | --- | --- | --- |
| | | | | | | | | | | | | | | | | | | | | |
Item 8. FINANCIAL STATEMENTS AND SUPPLEMENTARY DATA
4 rewritten, 0 added, 0 removed, 3 unchanged
Consolidated Balance Sheets as of December 31, [removed: 2018] [added: 2019] and [removed: 2017][added: 2018]
Consolidated Statements of Earnings for years ended December 31, [added: 2019,] 2018, [removed: 2017,] and [removed: 2016][added: 2017]
Consolidated Statements of Stockholders’ Equity for years ended December 31, [added: 2019,] 2018, [removed: 2017,] and [removed: 2016][added: 2017]
Consolidated Statements of Cash Flows for years ended December 31, [added: 2019,] 2018, [removed: 2017,] and [removed: 2016][added: 2017]
Item 9A. CONTROLS AND PROCEDURES
5 rewritten, 0 added, 0 removed, 15 unchanged
Based upon that evaluation, our Chief Executive Officer and Chief Financial Officer concluded that our disclosure controls and procedures were effective as of December 31, [removed: 2018.][added: 2019.]
Management assessed the effectiveness of our internal control over financial reporting as of December 31, [removed: 2018.][added: 2019.]
In making this assessment, management used the criteria set forth by the Committee of Sponsoring Organizations of the Treadway Commission (COSO) in _Internal Control – Integrated_ _Framework (2013_ _Framework)__._ Based on our assessment, we believe that as of December 31, [removed: 2018,] [added: 2019,] our internal control over financial reporting is effective based on those criteria.
The effectiveness of internal control over financial reporting as of December 31, [removed: 2018,] [added: 2019,] has been audited by Ernst & Young LLP, an independent registered public accounting firm that also audited our Consolidated Financial Statements.
There has been no change in our internal control over financial reporting during the fourth quarter ended December 31, [removed: 2018,] [added: 2019,] that has materially affected, or is reasonably likely to materially affect, our internal control over financial reporting.
Item 10. DIRECTORS, EXECUTIVE OFFICERS AND CORPORATE GOVERNANCE
1 rewritten, 0 added, 0 removed, 0 unchanged
The information required for Item 10 is hereby incorporated by reference from the Notice and Proxy Statement for the Annual Meeting of Stockholders to be held April [removed: 18, 2019.][added: 23, 2020.]
Item 11. EXECUTIVE COMPENSATION
1 rewritten, 0 added, 0 removed, 0 unchanged
The information required for Item 11 is hereby incorporated by reference from the Notice and Proxy Statement for the Annual Meeting of Stockholders to be held April [removed: 18, 2019.][added: 23, 2020.]
Item 12. SECURITY OWNERSHIP OF CERTAIN BENEFICIAL OWNERS AND MANAGEMENT AND RELATED STOCKHOLDER MATTERS
4 rewritten, 2 added, 2 removed, 5 unchanged
Except as set forth below, the information required for Item 12 is hereby incorporated by reference from the Notice and Proxy Statement for the Annual Meeting of Stockholders to be held April [removed: 18, 2019.][added: 23, 2020.]
The following table summarizes, as of December 31, [removed: 2018,] [added: 2019,] information about compensation plans under which equity securities of the Company are authorized for issuance.
| Plan Category(1) | | Number of Securities To Be Issued Upon Exercise of Outstanding Options, Warrants, and Rights | | | [removed: Weighted-average] [added: | Weighted- average] Exercise Price of Outstanding Options, Warrants, and Rights | | | [added: |] Number of Securities Remaining Available for Future Issuance Under Equity Compensation Plans (Excluding Securities Reflected in Column (A)) | | [added: |]
| Equity compensation plans approved by security holders | | [removed: 1,606,347] | [added: 1,688,946] | | [added: |] $ [removed: -] [added: | \- |] (2) | | | [removed: 6,260,958] [added: 5,710,001] | |
| --- | --- | --- | --- | --- | --- | --- | --- | --- | --- | --- | --- | --- |
| | | (A) | | | | (B) | | | | (C) | | |
| --- | --- | --- | --- | --- | --- | --- | --- | --- | --- |
| | | (A) | | | (B) | | | (C) | |
Item 13. CERTAIN RELATIONSHIPS AND RELATED TRANSACTIONS, AND DIRECTOR INDEPENDENCE
1 rewritten, 0 added, 0 removed, 0 unchanged
The information required for Item 13 is hereby incorporated by reference from the Notice and Proxy Statement for the Annual Meeting of Stockholders to be held April [removed: 18, 2019.][added: 23, 2020.]
Item 14. PRINCIPAL ACCOUNTING FEES AND SERVICES
1 rewritten, 0 added, 0 removed, 1 unchanged
The information required for Item 14 is hereby incorporated by reference from the Notice and Proxy Statement for the Annual Meeting of Stockholders to be held April [removed: 18, 2019.][added: 23, 2020.]
Item 15. EXHIBITS, FINANCIAL STATEMENT SCHEDULES
413 rewritten, 185 added, 93 removed, 373 unchanged
[removed: | |] (A) [removed: |] Financial Statements, Financial Statement Schedules and Exhibits: [removed: |]
[removed: | |] (1) [removed: |] Financial Statements [removed: |]
[removed: | |] (2) [removed: |] Financial Statement Schedules [removed: |]
All other schedules have been omitted either because they are [removed: not] [added: _not_] applicable or because the required information is included in our Consolidated Financial Statements or the notes thereto.
[removed: | |] (3) [removed: |] Exhibits [removed: |]
| [removed: Exhibit] Number | | | Description |
| [removed: 10.1] [added: 4.2] | | | [removed: [Amended and Restated Employee Retirement Plan] [added: [Indenture] (incorporated by reference from Exhibit [removed: 99] [added: 4.1] of the Company’s registration statement on Form [removed: S-8] [added: S-3ASR] (File No. [removed: 033-57127),] [added: 333-169365),] filed [removed: December 30, 1994)](http://www.sec.gov/Archives/edgar/data/728535/0000930661-94-000006.txt)] [added: September 14, 2010)](http://www.sec.gov/Archives/edgar/data/728535/000143774910002996/ex4-1.htm)] |
| [removed: 10.2] [added: 10.1] | | | [Third Amended and Restated Management Incentive Plan (incorporated by reference from Appendix A of the Company’s definitive proxy statement on Schedule 14A, filed March 9, 2017)](http://www.sec.gov/Archives/edgar/data/728535/000119312517075917/d324322ddef14a.htm) |
| 10.3 | | | [Summary of Compensation Arrangements with Named Executive Officers for [removed: 2018] [added: 2019] (incorporated by reference from Exhibit 99.1 of the Company’s current report on Form 8-K, filed January 25, [removed: 2018)](http://www.sec.gov/Archives/edgar/data/728535/000143774918001149/ex_103589.htm)] [added: 2019)](http://www.sec.gov/Archives/edgar/data/728535/000143774919001348/ex_133346.htm)] |
| 10.4 | | | [Summary of Compensation Arrangements with Named Executive Officers for [removed: 2019] [added: 2020] (incorporated by reference from Exhibit 99.1 of the Company’s current report on Form [removed: 8-K,] [added: 8-K/A,] filed [removed: January 25, 2019)](http://www.sec.gov/Archives/edgar/data/728535/000143774919001348/ex_133346.htm)] [added: February 3, 2020)](http://www.sec.gov/Archives/edgar/data/728535/000143774920001559/ex_171160.htm)] |
| [removed: 10.5] [added: 4.5] | | | [removed: [Indenture] [added: [Base Indenture, dated as of March 1, 2019] (incorporated by reference from Exhibit 4.1 of the Company’s [removed: registration statement] [added: current report] on Form [removed: S-3ASR (File No. 333-169365),] [added: 8-K,] filed [removed: September 14, 2010)](http://www.sec.gov/Archives/edgar/data/728535/000143774910002996/ex4-1.htm)] [added: March 1, 2019)](http://www.sec.gov/Archives/edgar/data/728535/000143774919003755/ex_136073.htm)] |
| [removed: 10.6] [added: 4.3] | | | [removed: [Second] [added: [Third] Supplemental Indenture (incorporated by reference from Exhibit [removed: 4.2] [added: 4.4] of the Company’s current report on Form 8-K, filed March 6, [removed: 2014)](http://www.sec.gov/Archives/edgar/data/728535/000143774914003579/ex4-2.htm)] [added: 2014)](http://www.sec.gov/Archives/edgar/data/728535/000143774914003579/ex4-4.htm)] |
| [removed: 10.7] [added: 4.4] | | | [removed: [Third] [added: [Fourth] Supplemental Indenture (incorporated by reference from Exhibit [removed: 4.4] [added: 4.3] of the Company’s current report on Form 8-K, filed [removed: March] [added: August] 6, [removed: 2014)](http://www.sec.gov/Archives/edgar/data/728535/000143774914003579/ex4-4.htm)] [added: 2015)](http://www.sec.gov/Archives/edgar/data/728535/000143774915015006/ex4-3.htm)] |
| [removed: 10.8] [added: 4.6] | | | [removed: [Fourth] [added: [First] Supplemental [removed: Indenture] [added: Indenture, dated as of March 1, 2019] (incorporated by reference from Exhibit [removed: 4.3] [added: 4.2] of the Company’s current report on Form 8-K, filed [removed: August 6, 2015)](http://www.sec.gov/Archives/edgar/data/728535/000143774915015006/ex4-3.htm)] [added: March 1, 2019)](http://www.sec.gov/Archives/edgar/data/728535/000143774919003755/ex_136213.htm)] |
| [removed: 10.9] [added: 10.7] | | | [Credit Agreement and related documents (incorporated by reference from Exhibit 10.1 of the Company’s current report on Form 8-K, filed September 28, 2018)](http://www.sec.gov/Archives/edgar/data/728535/000143774918017588/ex_124627.htm) |
| 21.1 | | | [Subsidiaries of J.B. Hunt Transport Services, [removed: Inc.](https://www.sec.gov/Archives/edgar/data/728535/000143774919003134/ex_135141.htm)] [added: Inc.](https://www.sec.gov/Archives/edgar/data/728535/000143774920004119/ex_174335.htm)] |
| 23.1 | | | [Consent of Ernst & Young [removed: LLP](https://www.sec.gov/Archives/edgar/data/728535/000143774919003134/ex_135142.htm)] [added: LLP](https://www.sec.gov/Archives/edgar/data/728535/000143774920004119/ex_174336.htm)] |
| 31.1 | | | [Rule 13a-14(a)/15d-14(a) [removed: Certification](https://www.sec.gov/Archives/edgar/data/728535/000143774919003134/ex_135143.htm)] [added: Certification](https://www.sec.gov/Archives/edgar/data/728535/000143774920004119/ex_174337.htm)] |
| 31.2 | | | [Rule 13a-14(a)/15d-14(a) [removed: Certification](https://www.sec.gov/Archives/edgar/data/728535/000143774919003134/ex_135144.htm)] [added: Certification](https://www.sec.gov/Archives/edgar/data/728535/000143774920004119/ex_174338.htm)] |
| 32.1 | | | [Section 1350 [removed: Certification](https://www.sec.gov/Archives/edgar/data/728535/000143774919003134/ex_135145.htm)] [added: Certification](https://www.sec.gov/Archives/edgar/data/728535/000143774920004119/ex_174339.htm)] |
| 101.INS | | | [added: Inline] XBRL Instance Document |
| 101.SCH | | | [added: Inline] XBRL Taxonomy Extension Schema Document |
| 101.CAL | | | [added: Inline] XBRL Taxonomy Extension Calculation Linkbase Document |
| 101.DEF | | | [added: Inline] XBRL Taxonomy Extension Definition Linkbase Document |
| 101.LAB | | | [added: Inline] XBRL Taxonomy Extension Label Linkbase Document |
| 101.PRE | | | [added: Inline] XBRL Taxonomy Extension Presentation Linkbase Document |
Pursuant to the requirements of Sections 13 or 15(d) of the Securities Exchange Act of 1934, the registrant has duly caused this report to be signed on its behalf by the undersigned thereunto duly authorized, in the City of Lowell, Arkansas, on the [removed: 22nd] [added: 2nd] day of [removed: February 2019.][added: March 2020.]
| | [removed: |] J.B. HUNT TRANSPORT SERVICES, INC. | [removed: | |]
| | [removed: | |] (Registrant) | [removed: |]
| | By: | [removed: |] /s/ John N. Roberts, III | [removed: |]
| [removed: | | |] [added: /s/] John N. Roberts, III | | [added: /s/ John Kuhlow | |]
| | | [removed: |] [added: John N. Roberts, III] President and Chief Executive Officer | [removed: |]
Pursuant to the requirements of the Securities Exchange Act of 1934, this report has been signed below by the following persons on the [removed: 22nd] [added: 2nd] day of [removed: February 2019,] [added: March 2020,] on behalf of the registrant and in the capacities indicated.
| [removed: |] /s/ John N. Roberts, III | | President and Chief Executive Officer, Member |
| [removed: |] John N. Roberts, III | | of the Board of Directors |
| | | [removed: |] (Principal Executive Officer) |
| [removed: | /s/ David G. Mee] [added: President and Chief Executive Officer] | | [removed: Executive] [added: Senior] Vice [removed: President, Finance and] [added: President Finance, Controller,] | [added: |]
| | [removed: David G. Mee] | [removed: | Administration,] Chief Financial Officer | [added: |]
| | | [removed: |] [added: Chief Financial Officer] (Principal Financial Officer) |
| [removed: |] /s/ John Kuhlow | | Senior Vice President Finance, Controller, |
| December 31, 2019 | | | 35.8 | | | | 34.2 | | | | (47.5 | ) | | | 22.5 | |
The above schedule reports allowances related to trade accounts receivable and other receivables.
| Exhibit | | | |
| 4.1 | | | [Description of Capital Stock of J.B. Hunt Transport Services, Inc.](https://www.sec.gov/Archives/edgar/data/728535/000143774920004119/ex_174405.htm) |
| 10.2 | | | [Amendment to J.B. Hunt Transport Services, Inc. Third Amended and Restated Management Incentive Plan (incorporated by reference from Exhibit 10.2 of the Company’s current report on Form 8-K, filed April 22, 2019)](http://www.sec.gov/Archives/edgar/data/728535/000143774919007691/ex_141397.htm) |
| 10.5* | | | [Executive Retirement Agreement with David G. Mee, dated February 6, 2020 (incorporated by reference from Exhibit 10.1 of the Company’s current report on Form 8-K, filed February 10, 2020)](http://www.sec.gov/Archives/edgar/data/728535/000143774920002187/ex_171755.htm) |
| 10.6* | | | [Executive Retirement Agreement with Terrance D. Matthews, dated February 6, 2020 (incorporated by reference from Exhibit 10.2 of the Company’s current report on Form 8-K, filed February 10, 2020)](http://www.sec.gov/Archives/edgar/data/728535/000143774920002187/ex_171757.htm) |
| 10.8 | | | [First Amendment to Credit Agreement, dated as of March 1, 2019 (incorporated by reference from Exhibit 10.2 of the Company’s current report on Form 8-K, filed March 1, 2019)](http://www.sec.gov/Archives/edgar/data/728535/000143774919003755/ex_136049.htm) |
| 99.2 | | | [Asset Purchase Agreement dated January 7, 2019 (incorporated by reference from Exhibit 99.2 of the Company’s current report on Form 8-K, filed January 10, 2019)](http://www.sec.gov/Archives/edgar/data/728535/000143774919000637/ex_132700.htm) |
| 104 | | | Cover Page Interactive Data File (embedded within the Inline XBRL Document) |
* Portions of this exhibit have been omitted pursuant to Item 601(b)(10)(iv) of Regulation S-K.
| | | |
| | | |
| | | |
| | | |
| | | |
| | | |
| | | |
| | | |
| | | |
| | | |
Critical Audit Matters
The critical audit matters communicated below are matters arising from the current period audit of the financial statements that were communicated or required to be communicated to the audit committee and that: (1) relate to accounts or disclosures that are material to the financial statements and (2) involved our especially challenging, subjective or complex judgments.
The communication of critical audit matters does not alter in any way our opinion on the consolidated financial statements, taken as a whole, and we are not, by communicating the critical audit matters below, providing separate opinions on the critical audit matters or on the accounts or disclosures to which they relate.
_Claims Accruals_
| _Description of the Matter_ | | At December 31, 2019, the Company’s aggregate claims accrual was $263 million, which is primarily related to casualty and workers’ compensation claims, inclusive of amounts expected to be paid by the Company’s insurers above its self-insured retention limits. As explained in Note 2 of the financial statements, the Company recognizes a liability at the time of the incident based upon the nature and severity of the claim and analyses provided by third-party claims administrators. The Company uses an actuarial method to develop currently known claim information to derive an estimate of the ultimate claim liability to account for estimated incurred but not reported losses (“IBNR”). Auditing the Company's claims accruals is complex and involves significant measurement uncertainty associated with the estimate, the application of significant management judgment, and the use of various actuarial methods. In addition, the estimate for claims accruals is sensitive to significant management assumptions, including the frequency and severity assumptions used to derive the computation of the IBNR, and the case reserves and loss development factors for reported claims. |
| _How We Addressed the Matter in Our Audit_ | | We obtained an understanding, evaluated the design and tested the operating effectiveness of internal controls over the claims accrual process, including management’s assessment of the assumptions and data underlying the IBNR reserve. To evaluate the claims accruals, our audit procedures included, among others, testing the completeness and accuracy of the underlying claims by performing a test of details over a representative sample. Furthermore, we involved our actuarial specialist to assist in our evaluation of the methodologies applied by management in determining the calculated reserve. We compared the Company’s reserved amount to a range which our actuarial specialist developed based on independently selected assumptions. |
_Accounting for Acquisition of Cory 1__st_ _Choice Home Delivery_
| _Description of the Matter_ | | During 2019, the Company completed its acquisition of Cory 1st Choice Home Delivery (“Cory”) for net consideration of $100 million, as disclosed in Note 12 to the consolidated financial statements. The transaction was accounted for as a business combination. Auditing the Company's accounting for its acquisition of Cory was complex due to the significant estimation required by management to determine the fair value of acquired customer-related intangible assets and goodwill of $45.8 million and $48.2 million, respectively. The significant estimation was primarily due to the complexity of the valuation methods used by management to measure the fair value of the intangible assets and the sensitivity of the respective fair values to the significant underlying assumptions. The significant assumptions used in the valuation included volatility, discount rate, and revenue projections. The Company used the multi-period excess earnings, relief from royalty, and with-and-without methods to measure the intangible assets. The significant assumptions used to estimate the value of the intangible assets included discount rates and certain assumptions that form the basis of the forecasted results (e.g., revenue growth rates, attrition rate and market participant synergies). These significant assumptions are forward looking and could be affected by future economic and market conditions. |
| --- | --- | --- |
| | | |
| _How We Addressed the Matter in Our Audit_ | | We obtained an understanding, evaluated the design and tested the operating effectiveness of the Company's controls over its accounting for acquisitions. Our tests included controls over the estimation process supporting the recognition and measurement of consideration transferred, and the intangible assets. We also tested management’s review of assumptions used in the valuation models. To test the estimated fair value of the intangible assets, we performed audit procedures that included, among others, evaluating the Company's selection of the valuation methodology, evaluating the methods and significant assumptions used in the Company’s valuation models, and evaluating the completeness and accuracy of the underlying data supporting the significant assumptions and estimates. We involved our valuation specialists to assist with our evaluation of the methodology used by the Company and significant assumptions included in the fair value estimates. For example, we compared the significant assumptions to current industry, market and economic trends, to the assumptions used to value similar assets in other acquisitions, to the historical results of the acquired business and to other guidelines used by companies within the same industry. We involved our valuation specialists to assist in our evaluation of the significant assumptions, including revenue growth rates and discount rate, and to assist with reconciling the prospective financial information with other prospective financial information prepared by the Company. |
March 2, 2020
March 2, 2020
| | | 2019 | | | | 2018 | | |
| Net earnings | | | \- | | | | \- | | | | 516,320 | | | | \- | | | | 516,320 | |
| Balances at December 31, 2019 | | $ | 1,671 | | | $ | 374,049 | | | $ | 4,592,938 | | | $ | (2,701,629 | ) | | $ | 2,267,029 | |
| --- |
| Net earnings | | $ | 516,320 | | | $ | 489,585 | | | $ | 686,263 | |
| Depreciation and amortization | | | 499,145 | | | | 435,893 | | | | 383,518 | |
| December 31, 2016 | | | 9.9 | | | | 19.5 | | | | (16.0 | ) | | | 13.4 | |
| --- | --- | --- | --- |
| | | | |
| | | | | |
| John N. Roberts, III | | David G. Mee | |
| (Principal Executive Officer) | | Administration, Chief Financial Officer | |
February 22, 2019
| --- | --- | --- | --- | --- | --- | --- | --- | --- |
| Balances at December 31, 2015 | | $ | 1,671 | | | $ | 268,728 | | | $ | 2,885,843 | | | $ | (1,855,890 | ) | | $ | 1,300,352 | |
| Net earnings | | | \- | | | | \- | | | | 432,090 | | | | \- | | | | 432,090 | |
| Tax benefit of stock options exercised and restricted shares issued | | | \- | | | | 7,044 | | | | \- | | | | \- | | | | 7,044 | |
| --- | --- | --- | --- | --- | --- | --- | --- | --- | --- | --- | --- | --- | --- | --- | --- |
| Stock option exercises and other | | | 967 | | | | 1,100 | | | | 1,341 | |
| Stock repurchased for payroll taxes | | | (20,530 | ) | | | (19,215 | ) | | | (18,641 | ) |
| Tax benefit of stock options exercised and restricted shares issued | | | \- | | | | \- | | | | 7,044 | |
ASU 2016-02 is to be applied using a modified retrospective method and is effective for us on January 1, 2019.
We do not expect the adoption of the standard to have a material impact on our earnings or debt covenant compliance and no impact on our cash flows.
In August 2018, the FASB issued ASU 2018-15, Intangibles – Goodwill and Other – Internal-Use Software, which aligns the requirements for capitalizing implementation costs incurred in a hosting arrangement that is a service contract with the requirements for capitalizing implementation costs incurred to develop or obtain internal-use software.
The new standard is effective for us on January 1, 2020, but early adoption is permitted.
ASU 2018-15 can be applied either retrospectively or prospectively to all implementation costs incurred after the date of adoption.
In May 2014, the FASB issued ASU No. 2014-09, Revenue from Contracts with Customers, which supersedes virtually all existing revenue recognition guidance.
The new standard requires an entity to recognize revenue when it transfers promised goods or services to customers in an amount that reflects the consideration the entity expects to receive in exchange for those goods or services.
This update also requires additional disclosure about the nature, amount, timing, and uncertainty of revenue and cash flows arising from customer contracts, including significant judgments and changes in judgments and assets recognized from costs incurred to obtain or fulfill a contract.
We adopted ASU 2014-09 in the first quarter 2018, using the modified retrospective transition approach, which did not have a material impact on how we recognize revenue or to our financial statements or disclosures.
In September 2018, we replaced our $500 million senior revolving credit facility dated September 2015 with a new credit facility authorizing us to borrow up to $750 million under a senior revolving line of credit, which is supported by a credit agreement with a group of banks.
The first and second issuances are $250 million of 2.40% senior notes due March 2019 and $250 million of 3.85% senior notes due March 2024, respectively, both of which were issued in March 2014.
Interest payments under both notes are due semiannually in March and September of each year.
The third issuance is $350 million of 3.30% senior notes due August 2022, issued in August 2015.
Interest payments under this note are due semiannually in February and August of each year, beginning February 2016.
All three senior notes were issued by J.B. Hunt Transport Services, Inc., a parent-level holding company with no significant assets or operations.
All notes are unsecured obligations and rank equally with our existing and future senior unsecured debt.
For our senior notes maturing in 2019, it is our intent to pay the entire outstanding balances in full, on or before the maturity dates, using our existing senior revolving line of credit or other sources of long-term financing.
In addition, we have a shelf registration filed with the SEC and may draw upon it as warranted.
The swaps expire when the corresponding senior notes are due.
The fair values of these swaps are recorded in other assets and other long-term liabilities in our Consolidated Balance Sheet at December 31, 2018.
We had no outstanding shares of preferred stock at December 31, 2018 or 2017.
On January 23, 2019, we announced an increase in our quarterly cash dividend from $0.24 to $0.26 per share, which will be paid February 22, 2019, to stockholders of record on February 8, 2019.
In the past, nonstatutory stock options have been granted to key employees for the purchase of our common stock for 100% of the fair market value of the common stock at the grant date as awarded by the Compensation Committee.
These options generally vested over a 10-year period and were forfeited immediately if the employee terminated for any reason other than death, disability or retirement after age 55.
We did not grant any stock options during the years ended December 31, 2018, 2017, and 2016.
An excerpt. Shown here: 40 of 413 rewritten, 40 of 185 added and 40 of 93 removed. The counts are complete. For every sentence, read Item 15. EXHIBITS, FINANCIAL STATEMENT SCHEDULES in the FY2019 filing and the FY2018 filing.