 filings.tools
Jabil 10-K 2019-08-31
Filed 2019-10-22. 22 sections, 440K characters. Original on sec.gov · Markdown · JSON
Cover and table of contents
10-K 1 d782178d10k.htm 10-K
Table of Contents
UNITED STATES
SECURITIES AND EXCHANGE COMMISSION
Washington, D.C. 20549
FORM 10-K
(Mark One)
| ☒ | ANNUAL REPORT PURSUANT TO SECTION 13 OR 15(d) OF THE SECURITIES EXCHANGE ACT OF 1934 |
|---|
For the fiscal year ended August 31, 2019
or
| ☐ | TRANSITION REPORT PURSUANT TO SECTION 13 OR 15(d) OF THE SECURITIES EXCHANGE ACT OF 1934 |
|---|
For the transition period from to
Commission file number 001-14063

JABIL INC.
(Exact name of registrant as specified in its charter)
| Delaware | 38-1886260 | |
| (State or other jurisdiction of incorporation or organization) | (I.R.S. Employer Identification No.) |
10560 Dr. Martin Luther King, Jr. Street North, St. Petersburg, Florida 33716
(Address of principal executive offices) (Zip Code)
(727) 577-9749
Registrant’s telephone number, including area code
Securities registered pursuant to Section 12(b) of the Act:
| Title of each class | Trading Symbol(s) | Name of each exchange on which registered | ||
| Common Stock, $0.001 par value per share | JBL | New York Stock Exchange |
Securities registered pursuant to Section 12(g) of the Act: None
Indicate by check mark if the registrant is a well-known seasoned issuer, as defined in Rule 405 of the Securities Act. Yes ☒ No ☐
Indicate by check mark if the registrant is not required to file reports pursuant to Section 13 or Section 15(d) of the Act. Yes ☐ No ☒
Indicate by check mark whether the registrant (1) has filed all reports required to be filed by Section 13 or 15(d) of the Securities Exchange Act of 1934 during the preceding 12 months (or for such shorter period that the registrant was required to file such reports), and (2) has been subject to such filing requirements for the past 90 days. Yes ☒ No ☐
Indicate by check mark whether the registrant has submitted electronically every Interactive Data File required to be submitted pursuant to Rule 405 of Regulation S-T (§ 232.405 of this chapter) during the preceding 12 months (or for such shorter period that the registrant was required to submit such files). Yes ☒ No ☐
Indicate by check mark whether the registrant is a large accelerated filer, an accelerated filer, a non-accelerated filer, a smaller reporting company, or an emerging growth company. See the definitions of “large accelerated filer,” “accelerated filer,” “smaller reporting company,” and “emerging growth company” in Rule 12b-2 of the Exchange Act.
| Large accelerated filer | ☒ | Accelerated filer | ☐ | |||
| Non-accelerated filer | ☐ | Smaller reporting company | ☐ | |||
| Emerging growth company | ☐ |
If an emerging growth company, indicate by check mark if the registrant has elected not to use the extended transition period for complying with any new or revised financial accounting standards provided pursuant to Section 13(a) of the Exchange Act. ☐
Indicate by check mark whether the registrant is a shell company (as defined in Rule 12b-2 of the Act). Yes ☐ No ☒
The aggregate market value of the voting common stock held by non-affiliates of the registrant based on the closing sale price of the Common Stock as reported on the New York Stock Exchange on February 28, 2019 was approximately $4.2 billion. For purposes of this determination, shares of Common Stock held by each officer and director and by each person who owns 10% or more of the outstanding Common Stock have been excluded in that such persons may be deemed to be affiliates. This determination of affiliate status is not necessarily a conclusive determination for other purposes. The number of outstanding shares of the registrant’s Common Stock as of the close of business on October 14, 2019, was 152,656,443. The registrant does not have any non-voting stock outstanding.
DOCUMENTS INCORPORATED BY REFERENCE
The registrant’s definitive Proxy Statement for the Annual Meeting of Stockholders scheduled to be held on January 23, 2020 is incorporated by reference in Part III of this Annual Report on Form 10-K to the extent stated herein.
Table of Contents
JABIL INC. AND SUBSIDIARIES
2019 FORM 10-K ANNUAL REPORT
TABLE OF CONTENTS
Table of Contents
References in this report to “the Company,” “Jabil,” “we,” “our,” or “us” mean Jabil Inc. together with its subsidiaries, except where the context otherwise requires. This Annual Report on Form 10-K contains certain statements that are, or may be deemed to be, forward-looking statements within the meaning of Section 27A of the Securities Act of 1933, as amended (the “Securities Act”) and Section 21E of the Securities Exchange Act of 1934, as amended (the “Exchange Act”). These forward-looking statements (such as when we describe what “will,” “may,” or “should” occur, what we “plan,” “intend,” “estimate,” “believe,” “expect” or “anticipate” will occur, and other similar statements) include, but are not limited to, statements regarding future sales and operating results, potential risks pertaining to these future sales and operating results, future prospects, anticipated benefits of proposed (or future) acquisitions, dispositions and new facilities, growth, the capabilities and capacities of business operations, any financial or other guidance, expected capital expenditures and dividends, expected restructuring charges and related savings and all statements that are not based on historical fact, but rather reflect our current expectations concerning future results and events. We make certain assumptions when making forward-looking statements, any of which could prove inaccurate, including assumptions about our future operating results and business plans. Therefore, we can give no assurance that the results implied by these forward-looking statements will be realized. Furthermore, the inclusion of forward-looking information should not be regarded as a representation by the Company or any other person that future events, plans or expectations contemplated by the Company will be achieved. The following important factors, among others, could affect future results and events, causing those results and events to differ materially from those expressed or implied in our forward-looking statements:
| • | fluctuation in our operating results; |
|---|
| • | our dependence on a limited number of customers; |
|---|
| • | our ability to manage growth effectively; |
|---|
| • | competitive factors affecting our customers’ businesses and ours; |
|---|
| • | the susceptibility of our production levels to the variability of customer requirements; |
|---|
| • | our ability to keep pace with technological changes and competitive conditions; |
|---|
| • | our reliance on a limited number of suppliers for critical components; |
|---|
| • | exposure to financially troubled customers and suppliers; |
|---|
| • | our exposure to the risks of a substantial international operation; and |
|---|
| • | our ability to achieve the expected profitability from our acquisitions. |
|---|
For a further list and description of various risks, factors and uncertainties that could cause future results or events to differ materially from those expressed or implied in our forward-looking statements, see the “Risk Factors” and “Management’s Discussion and Analysis of Financial Condition and Results of Operations” sections contained in this document, and any subsequent reports on Form 10-Q and Form 8-K, and other filings we make with the Securities and Exchange Commission (“SEC”). Given these risks and uncertainties, the reader should not place undue reliance on these forward-looking statements.
All forward-looking statements included in this Annual Report on Form 10-K are made only as of the date of this Annual Report on Form 10-K, and we do not undertake any obligation to publicly update or correct any forward-looking statements to reflect events or circumstances that subsequently occur, or of which we hereafter become aware. You should read this document completely and with the understanding that our actual future results or events may be materially different from what we expect. All forward-looking statements attributable to us are expressly qualified by these cautionary statements.
Table of Contents
PART I
Item 1. Business
The Company
We are one of the leading providers of worldwide manufacturing services and solutions. We provide comprehensive electronics design, production and product management services to companies in various industries and end markets. Our services enable our customers to reduce manufacturing costs, improve supply-chain management, reduce inventory obsolescence, lower transportation costs and reduce product fulfillment time. Our manufacturing and supply chain management services and solutions include innovation, design, planning, fabrication and assembly, delivery and managing the flow of resources and products.
We serve our customers primarily through dedicated business units that combine highly automated, continuous flow manufacturing with advanced electronic design and design for manufacturability. We depend, and expect to continue to depend, upon a relatively small number of customers for a significant percentage of our net revenue, which in turn depends upon their growth, viability and financial stability. Based on net revenue, for the fiscal year ended August 31, 2019, our largest customers include Amazon.com, Inc., Apple, Inc., Cisco Systems, Inc., GoPro, Inc., Hewlett-Packard Company, Ingenico Group, Keysight Technologies, LM Ericsson Telephone Company, NetApp, Inc. and Nokia Networks. For the fiscal year ended August 31, 2019, we had net revenues of $25.3 billion and net income attributable to Jabil Inc. of $287.1 million.
We conduct our operations in facilities that are located worldwide, including but not limited to, China, Hungary, Malaysia, Mexico, Singapore and the United States. Our global manufacturing production sites allow customers to manufacture products simultaneously in the optimal locations for their products. Our global presence is key to assessing and executing on our business opportunities.
We have two reporting segments: Electronics Manufacturing Services (“EMS”) and Diversified Manufacturing Services (“DMS”), which are organized based on the economic profiles of the services performed, including manufacturing capabilities, market strategy, margins, return on capital and risk profiles. Our EMS segment is focused around leveraging IT, supply chain design and engineering, technologies largely centered on core electronics, utilizing our large-scale manufacturing infrastructure and our ability to serve a broad range of end markets. Our EMS segment is a high-volume business that produces products at a quicker rate (i.e. cycle time) and in larger quantities and includes customers primarily in the automotive and transportation, capital equipment, cloud, computing and storage, defense and aerospace, industrial and energy, networking and telecommunications, print and retail, and smart home and appliances industries. Our DMS segment is focused on providing engineering solutions, with an emphasis on material sciences, technologies and healthcare. Our DMS segment includes customers primarily in the edge devices and accessories, healthcare, mobility and packaging industries.
Additional financial information regarding our reportable operating segments is included in Item 7 of this report and Note 12 – “Concentration of Risk and Segment Data” to the Consolidated Financial Statements.
Industry Background
The industry in which we operate has historically been composed of companies that provide a range of design and manufacturing services to companies that utilize electronics components in their products.
We monitor the current economic environment and its potential impact on both the customers we serve as well as our end markets and closely manage our costs and capital resources so that we can respond appropriately as circumstances change. Over the long term we believe the factors driving our customers and potential customers to use our industry’s services include:
| • | Efficient Manufacturing. Manufacturing service providers are often able to manufacture products at a reduced total cost to companies. These cost advantages result from higher utilization of capacity and efficiencies of scale because of diversified product demand and, generally, a greater focus on the components of manufacturing cost. Companies are increasingly seeking to reduce their investment in inventory, facilities and equipment used in manufacturing and prioritizing capital investments in other activities such as sales and marketing and research and development (“R&D”). This strategic shift in capital deployment has contributed to increased demand for and interest in outsourcing to external manufacturing service providers. |
|---|
| • | Accelerated Product Time-to-Market and Time-to-Volume. Manufacturing service providers are often able to deliver accelerated production start-ups and achieve high efficiencies in bringing new products to production. Providers are also able to more rapidly scale production for changing markets and to position themselves in global locations that serve the leading world markets. With increasingly shorter product life cycles, these key services allow new products to be sold in the marketplace in an accelerated time frame. |
|---|
Table of Contents
| • | Access to Advanced Design and Manufacturing Technologies. By utilizing manufacturing service providers, customers gain access to additional advanced technologies in manufacturing processes, as well as to product and production design, which can offer customers significant improvements in the performance, quality, cost, time-to-market and manufacturability of their products. |
|---|
| • | Improved Inventory Management and Purchasing Power. Manufacturing service providers are often able to more efficiently manage both procurement and inventory, and have demonstrated proficiency in purchasing components at improved pricing due to the scale of their operations and continuous interaction with the materials marketplace. |
|---|
Our Strategy
Our vision for the future is to become the world’s most technologically advanced manufacturing services and solutions provider. As we work to achieve our vision, we continue to pursue the following strategies:
| • | Establish and Maintain Long-Term Customer Relationships. An important element of our strategy is to establish and maintain long-term relationships with leading companies in expanding industries with size and growth characteristics that can benefit from highly automated, continuous flow manufacturing on a global scale. We focus on maintaining long-term relationships with our customers and seek to expand these relationships to include additional product lines and services. In addition, we focus on identifying and developing relationships with new customers that meet our targeted profile, which includes financial stability, the need for technology-driven turnkey manufacturing, anticipated unit volume and long-term relationship stability. |
|---|
| • | Product Diversification. We focus on balancing our portfolio of products and product families to those that align with higher return areas of our business, including manufacturing, supply chain management services, comprehensive electronics design, production and product management services. We have made concentrated efforts to diversify our industry sectors and customer base. Because of these efforts, we have experienced business growth from both existing and new customers as well as from acquisitions. |
|---|
| • | Utilize Customer-Centric Business Units. Most of our business units are dedicated to serve one customer each and operate by primarily utilizing dedicated production equipment, production workers, supervisors, buyers, planners and engineers to provide comprehensive manufacturing solutions that are customized to each customer’s needs. We believe our customer-centric business units promote increased responsiveness to our customers’ needs, particularly for customer relationships that extend across multiple production locations. |
|---|
| • | Leverage Global Production. We believe that global production is a key strategy to reduce obsolescence risk and secure the lowest possible landed costs while simultaneously supplying products of equivalent or comparable quality throughout the world. Consistent with this strategy, we have established or acquired operations in Europe, Asia, Latin America and Africa. |
|---|
| • | Offer Systems Assembly, Direct-Order Fulfillment and Configure-to-Order Services. Our systems assembly, direct-order fulfillment and configure-to-order services allow our customers to reduce product cost and risk of product obsolescence by reducing total work-in-process and finished goods inventory. These services are available at all of our manufacturing locations. |
|---|
| • | Offer Design Services. We offer a wide spectrum of value-add design services to achieve improvements in performance, cost, time-to-market and manufacturability. |
|---|
| • | Pursue Acquisition Opportunities Selectively. Traditionally, electronics manufacturing service companies have acquired manufacturing capacity from their customers to drive growth, expand their footprint and gain new customers. In recent years, our acquisition strategy has expanded to include opportunities to acquire competitors who are focused on our key growth areas, which include specialized manufacturing in key markets, materials technology and design operations, as well as other acquisition opportunities complementary to our services offerings. The primary goals of our acquisition strategy are to complement our current capabilities, diversify our business into new industry sectors and with new customers and expand the scope of the services we can offer to our customers. |
|---|
Table of Contents
Our Approach to Manufacturing
To achieve high levels of manufacturing performance, we have adopted the following approaches:
| • | Decentralized Business Unit Model. Most of our business units are dedicated to serve one customer each and are empowered to formulate strategies tailored to individual customer’s needs. Our business units generally have dedicated production lines consisting of equipment, production workers, supervisors, buyers, planners and engineers. Under certain circumstances, a production line may serve more than one business unit to maximize resource utilization. Business units have direct responsibility for manufacturing results and time-to-volume production, thereby promoting a sense of individual commitment and ownership. The business unit approach is modular and enables us to grow incrementally without disrupting the operations of other business units. Business unit management reviews the customer financial information to assess whether the business units are meeting their designated responsibilities and to ensure that the daily execution of manufacturing activities is being effectively managed. The business units aggregate into operating segments based on the economic profiles of the services performed, including manufacturing capabilities, market share strategy, margins, return on capital and risk profiles. |
|---|
| • | Automated Continuous Flow. We use a highly automated, continuous flow approach to manufacturing, whereby different pieces of equipment are joined directly or by conveyor to create an in-line assembly process. This process contrasts with a batch approach, whereby individual pieces of assembly equipment are operated as freestanding work-centers. The elimination of waiting time prior to sequential operations results in faster manufacturing, which improves production efficiencies and quality control, and reduces inventory work-in-process. We believe continuous flow manufacturing provides cost reductions and quality improvement when applied to high volumes of product. |
|---|
| • | Computerized Control and Monitoring. We support all aspects of our manufacturing activities with advanced computerized control and monitoring systems. Component inspection and vendor quality are monitored electronically in real-time. Materials planning, purchasing, stockroom and shop floor control systems are supported through a computerized manufacturing resource planning system, which provides customers with the ability to continuously monitor material availability and track work-in-process on a real-time basis. In addition, manufacturing processes are supported by a computerized statistical process control system, whereby customers can remotely access our computer systems to monitor real-time yields, inventory positions, work-in-process status and vendor quality data. |
|---|
| • | Electronic Supply Chain Management. We make available to our customers and suppliers an electronic commerce system/electronic data interchange and web-based tools to implement a variety of supply chain management programs. Our customers use these tools to share demand and product forecasts and deliver purchase orders, and we use these tools with our suppliers for just-in-time delivery, supplier-managed inventory and consigned supplier-managed inventory. |
|---|
Table of Contents
Our Design Services
We offer a wide spectrum of value-add design services to enhance our relationships with current customers and to help develop relationships with our new customers. Our teams are strategically staffed to support Jabil customers for all development projects, including turnkey system design and design for manufacturing activities. These design services include:
| • | Electronic Design. Our Electronic Design team provides electronic circuit design services, including application-specific integrated circuit design, firmware development and rapid prototyping services. These services have been used by our customers for a variety of products including smart phones and accessory products, notebook and personal computers, servers, radio frequency products, video set-top boxes, optical communications products, communication and broadband products, and automotive and consumer appliance controls. |
|---|
| • | Industrial Design. Our Industrial Design team designs the “look and feel” of the plastic and metal enclosures that house the products’ electro-mechanics, including the printed circuit board assemblies (“PCBA”). |
|---|
| • | Mechanical Design. Our Mechanical Design team specializes in three-dimensional mechanical design with the analysis of electronic, electro-mechanical and optical assemblies using state of the art modeling and analytical tools. This team has extended Jabil’s product design offering capabilities to include all aspects of industrial design, advance mechanism development and tooling management. |
|---|
| • | Computer-Assisted Design. Our Computer-Assisted Design (“CAD”) team provides PCBA design services using advanced CAD engineering tools, PCBA design validation and verification services, and other consulting services, which include generating a bill of materials, approved vendor list and assembly equipment configuration for a particular PCBA design. We believe that our CAD services result in PCBA designs that are optimized for manufacturability and cost efficiencies and accelerate a product’s time-to-market and time-to-volume production. |
|---|
| • | Product Validation. Our Product Validation team provides complete product and process validation. This includes product system tests, product safety, regulatory compliance and reliability tests. |
|---|
| • | Manufacturing Test Solution Development. Our Manufacturing Test Solution Development team provides integral support to the design teams to embed design with testability and to promote efficient capital and resource investment in the manufacturing process. The use of software driven instrumentation and test process design and management has enhanced our product quality and reduced our operating costs relative to human dependent test processes. The full electronic test data-log of customer products has allowed customer product test traceability and visibility throughout the manufacturing test process. |
|---|
Fabrication and Assembly
We offer systems assembly, test, direct-order fulfillment and configure-to-order services to our customers. Our systems assembly services extend our range of assembly activities to include assembly of higher-level sub-systems and systems incorporating multiple PCBAs. In addition, based on quality assurance programs developed with our customers, we provide testing services for our PCBAs, sub-systems and systems products. Our quality assurance programs include circuit testing under various environmental conditions to ensure that our products meet or exceed required customer specifications. We also offer direct-order fulfillment and configure-to-order services for delivery of final products.
Technology and Research and Development
We believe that our manufacturing and testing technologies are among the most advanced in our industry. To meet our customers’ increasingly sophisticated needs, we continuously engage in R&D activities designed to create new and improved products and manufacturing solutions for our customers. Through our R&D efforts, we intend to continue to offer our customers highly automated, continuous flow manufacturing process technologies for precise and aesthetic mechanical components and system assembly. These technologies and R&D activities include:
| • | Automation, including automated tooling |
|---|
| • | Electronic interconnection |
|---|
| • | Advanced polymer and metal material science |
|---|
| • | Single/multi-shot injection molding, stamping and in-mold labeling |
|---|
Table of Contents
| • | Multi-axis computer numerical control |
|---|
| • | Vacuum metallization |
|---|
| • | Physical vapor deposition |
|---|
| • | Digital printing |
|---|
| • | Anodization |
|---|
| • | Thermal-plastic composite formation |
|---|
| • | Plastic with embedded electronics |
|---|
| • | Metal and plastic covers with insert-molded or dies-casting features for assembly |
|---|
| • | Display cover with integrated touch sensor |
|---|
| • | Material processing research (including plastics, metal, glass and ceramic) |
|---|
We engage in R&D activities for many products including mobile internet devices and associated accessories, multi-media tablets, two-way radios, health care and life science products, server and storage products, set-top and digital home products and printing products.
Customers and Marketing
A key tenet of our strategy is to establish and maintain long-term relationships with leading companies in expanding industries with the size and growth characteristics that can benefit from highly automated, continuous flow manufacturing on a global scale. A small number of customers and significant industry sectors have historically comprised a major portion of our net revenue. We also market our services and solutions through our website and our Blue Sky Innovation Centers.
In fiscal year 2019, our five largest customers accounted for approximately 42% of our net revenue and 85 customers accounted for approximately 90% of our net revenue. The table below sets forth the respective portion of net revenue attributable to the customers that accounted for approximately 10% or more of our net revenue during the periods indicated:
| Fiscal Year Ended August 31, | ||||||||||||
| 2019 | 2018 | 2017 | ||||||||||
| Apple, Inc. | 22 | % | 28 | % | 24 | % |
Competition
Our business is highly competitive. We compete against numerous domestic and foreign electronic manufacturing service providers, diversified manufacturing service providers and design providers. We also face competition from the manufacturing operations of our current and potential customers, who are continually evaluating the merits of manufacturing products internally against the advantages of outsourcing.
We compete with different companies depending on the type of service we are providing or the geographic area in which an activity takes place. We believe that the principal competitive factors in the manufacturing services market are: cost; accelerated production time-to-market; higher efficiencies; global locations; rapid scale production; advanced technologies; quality; improved pricing of components. We believe we are extremely competitive with regard to all of these factors.
Backlog
Our order backlog as of August 31, 2019 and 2018 was valued at approximately $6.2 billion and $6.8 billion, respectively. Our order backlog is expected to be filled within the current fiscal year. Although our backlog consists of firm purchase orders, the level of backlog at any particular time may not be necessarily indicative of future sales. Given the nature of our relationships with our customers, and the fact that we generally do not enter into long-term purchase commitments with our customers, we frequently allow our customers to cancel or reschedule deliveries, and therefore, backlog is often not a meaningful indicator of future financial results.
Components Procurement
We procure components from a broad group of suppliers, determined on an assembly-by-assembly basis. Some of the products we manufacture contain one or more components that are only available from a single source. Some of these components are allocated from time to time in response to supply shortages. In some cases, supply shortages will substantially curtail production of all assemblies using a particular component.
Table of Contents
Proprietary Rights
We regard certain aspects of our design, production and product management services as proprietary intellectual property. To protect our trade secrets, manufacturing know-how and other proprietary rights, we rely largely upon a combination of intellectual property laws, non-disclosure agreements with our customers, employees, and suppliers and our internal security systems, policies and procedures. We currently have a relatively modest number of patents for various innovations. We believe that our research and design activities, along with developments relating thereto, may result in growth of our patent portfolio and its importance to us, particularly as we expand our business activities. Other factors significant to our proprietary rights include the knowledge and experience of our management and personnel and our ability to develop, enhance and market manufacturing services.
We license some technology and intellectual property rights from third parties that we use in providing some of our design, production and product management services to our customers. Generally, the license agreements that govern such third-party technology and intellectual property rights grant us the right to use the subject technology anywhere in the world and terminate upon a material breach by us.
Employees
As of August 31, 2019, we employed approximately 200,000 people worldwide. None of our U.S. domestic employees are represented by a labor union. In certain international locations, our employees are represented by labor unions and by works councils. We have never experienced a significant work stoppage or strike and we believe that our employee relations are good.
Environmental
We are subject to a variety of federal, state, local and foreign environmental, health and safety, product stewardship and producer responsibility laws and regulations, including those relating to the use, storage, discharge and disposal of hazardous chemicals used during our manufacturing process, those governing worker health and safety, those requiring design changes, supply chain investigation or conformity assessments or those relating to the recycling or reuse of products we manufacture.
Information about our Executive Officers
Executive officers are appointed by the Board of Directors and serve at the discretion of the Board. Except as otherwise noted below, each executive officer is a full-time employee of Jabil. There are no family relationships among our executive officers and directors. There are no arrangements or understandings between any of our executive officers and any other persons pursuant to which any of such executive officers were selected. Below is a list of our executive officers:
Steven D. Borges (age 51) was named Executive Vice President, Chief Executive Officer, Healthcare in September 2016. Mr. Borges joined Jabil in 1993 and has global experience in positions of increasing responsibility in Operations, Business Development, Manufacturing Operations and Supply Chain Management. He holds a Bachelor’s Degree in Business Administration and Management from Fitchburg State University.
Sergio A. Cadavid (age 63) was named Senior Vice President, Treasurer in September 2013. Mr. Cadavid joined Jabil in 2006 as Treasurer. Prior to joining Jabil, Mr. Cadavid was Corporate Assistant Treasurer for Owens-Illinois, Inc. in Toledo, Ohio. He has also held various positions with The Quaker Oats Company, Arthur Andersen & Co. and J.M. Family Enterprises, Inc. He holds an M.B.A. from the University of Florida and a B.B.A. from Florida International University.
Brenda Chamulak (age 48) was named Senior Vice President, Chief Executive Officer, Jabil Packaging Solutions in July 2018. Prior to joining Jabil, Ms. Chamulak was Vice President and General Manager of Personal Care & Home Care, a business unit of Aptar Inc., a global supplier of dispensing and sealing solutions based in Crystal Lake, Illinois. Ms. Chamuluk served as the President, Global Market Development for Aptar’s Beauty + Home, Personal Care Business Unit from 2016 to 2017 and served as the General Manager, Aptar Midland from 2013 to 2016. She joined Aptar in 1992 and held positions of increasing responsibility with Aptar. Ms. Chamulak has a B.A. in Marketing and International Business from Carthage College and an MBA from Marquette University.
Michael Dastoor (age 54) was named Executive Vice President, Chief Financial Officer effective September 2018. Mr. Dastoor joined Jabil in 2000 as Regional Controller – Asia Pacific and was named Controller in June 2004 and Senior Vice President, Controller in July 2010. Prior to joining Jabil, Mr. Dastoor was a Regional Financial Controller for Inchcape PLC. He holds a degree in Finance and Accounting from the University of Bombay. Mr. Dastoor is a Chartered Accountant from the Institute of Chartered Accountants in England and Wales.
Table of Contents
Bruce A. Johnson (age 63) was named Senior Vice President, Chief Human Resources Officer in January 2017. Mr. Johnson joined Jabil in 2015 as Vice President, Human Resources. Prior to joining Jabil, Mr. Johnson was Chief Organizational Effectiveness Officer/Executive Vice President, Human Resources for C&S Wholesale Grocers, Inc., a wholesale distributor of food and grocery items with headquarters in Keene, New Hampshire from 2007 to 2014. Mr. Johnson also served in senior roles at The Timberland Company, a footwear and apparel designer, retailer and manufacturer in New Hampshire, and E.I. Du Pont De Nemours and Company (Du Pont) in Delaware. He holds a Bachelor of Arts in History from Middlebury College in Vermont.
Robert L. Katz (age 57) joined Jabil in March 2016 and was named Executive Vice President, General Counsel and Corporate Secretary in September 2016. Mr. Katz transitioned the Corporate Secretary role to a member of his staff in April 2017. In April 2019 he was named Chief Ethics & Compliance Officer. Prior to joining Jabil, Mr. Katz served as Executive Vice President, General Counsel and Secretary of SharkNinja, a vacuum and kitchen appliance manufacturer. He was previously Senior Vice President and General Counsel of Ingersoll Rand plc, a diversified industrial manufacturer, from 2010 to 2015. Mr. Katz served as Senior Vice President, General Counsel, Corporate Secretary and Chief Compliance Officer of Federal-Mogul Corporation from 2007 to 2010. From 1999 to 2007 he was General Counsel—EMEA for Delphi Corporation in Paris, France. He began his career with Milbank, Tweed, Hadley & McCloy working in the Mergers and Acquisitions and General Corporate Group in New York and London. He earned a Bachelor of Laws (LL.B.) and a Bachelor of Civil Law (B.C.L.) from McGill University. He is a member of the New York Bar.
Michael J. Loparco (age 48) was named Executive Vice President, Chief Executive Officer, Engineered Solutions Group in January 2016. Previously, Mr. Loparco served as Executive Vice President, Chief Executive Officer, Industrial and Energy, Senior Vice President, Global Business Units in Jabil’s High Velocity business and held a variety of global management positions. Before joining Jabil in 1999, Mr. Loparco was an attorney at Holland & Knight, LLP, practicing corporate and commercial litigation. He holds a Juris Doctorate from Stetson University College of Law. He holds a Bachelor of Arts in International Business, with minor degrees in Spanish and Business Management, from Eckerd College.
Mark Mondello (age 55) has served as Chief Executive Officer and a member of the Board of Directors since March 2013. Mr. Mondello joined Jabil in 1992 as a manufacturing supervisor. Mr. Mondello was promoted to Project Manager in 1993, named Vice President, Business Development in 1997, Senior Vice President, Business Development in 1999 and served as Chief Operating Officer from 2002 to 2013. Prior to joining Jabil, Mr. Mondello was a commercial and defense-related aerospace project manager for Moog, Inc. He holds a B.S. in Mechanical Engineering from the University of South Florida.
Alessandro Parimbelli (age 51) was named Executive Vice President, Chief Executive Officer, Enterprise and Infrastructure in July 2013. Mr. Parimbelli joined Jabil in 1998 as a Test Engineering Manager. At Jabil, Mr. Parimbelli served in business management positions in Boise, Idaho and Paris, France before being promoted to Vice President, Global Business Units in 2006. From 2010 through 2012, Mr. Parimbelli was Senior Vice President, Global Business Units and was responsible for Jabil’s Enterprise and Infrastructure business. Prior to joining Jabil, Mr. Parimbelli held various engineering positions within Hewlett-Packard and other software engineering companies. He holds an MBA from Colorado State University and a Software Engineering degree from Politecnico of Milan, Italy.
Courtney J. Ryan (age 49) was named Executive Vice President, Corporate Development/Chief of Staff in July 2016. Mr. Ryan joined Jabil in 1993 as a Quality Engineer and worked his way through various operations and business development management positions. He was named Senior Vice President, Global Business Units in 2007. Mr. Ryan served as Executive Vice President, Chief Executive Officer, Nypro from July 2013 to June 2016. Mr. Ryan holds an MBA with a concentration in Decision and Information Science and a Bachelor of Arts in Economics, both from the University of Florida. He also serves on the University of Florida’s MBA and Supply Chain Advisory Board.
Daryn Smith (age 49) was named Senior Vice President, Enterprise & Commercial Controller effective September 2018. Mr. Smith served as Chief Financial Officer of EMS from June 2013 through June 2018. Mr. Smith joined Jabil in 2002 and he has held various leadership roles in Risk and Assurance, Financial Planning and Analysis, and Controllership for Jabil. Prior to joining Jabil, Mr. Smith was with the Assurance and Advisory Services practice for Arthur Andersen. He holds a Bachelor’s degree in Accounting from the University of South Florida and an MBA from the University of Florida.
Kenneth S. Wilson (age 54) was named Executive Vice President and CEO of Jabil Green Point in 2017. Prior to that, Mr. Wilson was Senior Vice President of the Telecommunications Infrastructure Sector within Jabil’s Enterprise & Infrastructure group. He first joined Jabil in 2000 as a business unit manager; and has held various leadership roles, including VP of Global Business Units, running businesses such as consumer electronics and telecommunications. Prior to Jabil, he spent 8 years at Motorola, where he served as Operations Director in their Handset Division. Mr. Wilson has a Bachelor’s degree in Manufacturing Engineering and a MBA from Edinburgh Business School.
Table of Contents
Additional Information
Our principal executive offices are located at 10560 Dr. Martin Luther King, Jr. Street North, St. Petersburg, Florida 33716, and our telephone number is (727) 577-9749. We were incorporated in Delaware in 1992. Our website is located at http://www.jabil.com. Through a link on the “Investors” section of our website, we make available our Annual Report on Form 10-K, our Quarterly Reports on Form 10-Q, our Current Reports on Form 8-K and any amendments to those reports, free of charge, as soon as reasonably practicable after they are electronically filed with, or furnished to, the SEC. The SEC maintains an Internet site that contains reports, proxy and information statements, and other information regarding issuers that file electronically with the SEC (http://www.sec.gov). The “Investors” section of our website contains a significant amount of information about our Company, including financial and other information for investors. The information that we post on the “Investors” section of our website could be deemed to be material information. We encourage investors, the media and others interested in Jabil to visit our website. Information on our website, however, is not a part of this report.
Table of Contents
Item 1A. Risk Factors
Our operating results may fluctuate due to a number of factors, many of which are beyond our control.
Our annual and quarterly operating results are affected by a number of factors, including:
| • | adverse changes in current macro-economic conditions, both in the U.S. and internationally; |
|---|
| • | how well we execute on our strategy and operating plans, and the impact of changes in our business model; |
|---|
| • | the volume and timing of orders placed by our customers; |
|---|
| • | the level of capacity utilization of our manufacturing facilities and associated fixed costs; |
|---|
| • | the composition of the costs of revenue among materials, labor and manufacturing overhead; |
|---|
| • | price competition; |
|---|
| • | changes in demand for our products or services, as well as the volatility of these changes; |
|---|
| • | changes in demand in our customers’ end markets, as well as the volatility of these changes; |
|---|
| • | our exposure to financially-troubled customers; |
|---|
| • | any potential future termination, or substantial winding down, of significant customer relationships; |
|---|
| • | our level of experience in manufacturing particular products; |
|---|
| • | the degree of automation used in our assembly process; |
|---|
| • | the efficiencies achieved in managing inventories and property, plant and equipment; |
|---|
| • | significant costs incurred in acquisitions and other transactions; |
|---|
| • | fluctuations in the cost and availability of materials; |
|---|
| • | adverse changes in political conditions, both in the U.S. and internationally, including among other things, adverse changes in tax laws and rates (and government interpretations thereof), adverse changes in trade policies and adverse changes in fiscal and monetary policies; |
|---|
| • | seasonality in customers’ product demand; |
|---|
| • | the timing of expenditures in anticipation of increased sales, customer product delivery requirements and shortages of components or labor; |
|---|
| • | changes in stock-based compensation expense due to changes in the expected vesting of performance-based equity awards comprising a portion of such stock-based compensation expense; and |
|---|
| • | failure to comply with foreign laws, which could result in increased costs and/or taxes. |
|---|
Any one or a combination of these factors could adversely affect our annual and quarterly results of operations in the future. See “Management’s Discussion and Analysis of Financial Condition and Results of Operations – Results of Operations.”
If we do not manage our growth effectively, our profitability could decline.
Our business at times experiences periods of rapid growth which can place considerable demands upon our management team and our operational, financial and management information systems. Our ability to manage growth effectively requires us to continue to implement and improve these systems; avoid cost overruns; maintain customer, supplier and other favorable business relationships during transition periods; efficiently and effectively dedicate resources to existing customers as well as new projects; acquire or construct additional facilities; occasionally transfer operations to different facilities; acquire equipment in anticipation of demand; continue to develop the management skills of our managers and supervisors; adapt relatively quickly to new markets or technologies and continue to hire, train, motivate and manage our employees. Our failure to effectively manage growth, as well as our failure to realize the anticipated benefits of the actions we take to try to manage our growth, could have a material adverse effect on our results of operations. See “Management’s Discussion and Analysis of Financial Condition and Results of Operations.”
Table of Contents
Because we depend on a limited number of customers, a reduction in sales to any one of those customers could cause a significant decline in our revenue.
We currently depend, and expect to continue to depend for the foreseeable future, upon a relatively small number of customers for a significant percentage of our net revenue and upon their growth, viability and financial stability. See “Business – The Company.” In some instances, particular manufacturing services we provide for a customer represent a significant portion of the overall revenue we receive from that customer. As a result of this concentration, a reduction in business from one or more of our largest customers could have a material adverse effect on our results of operations. In addition, if one or more of our significant customers were to become insolvent or otherwise become unable to pay us on a timely basis, or at all, our operating results and financial condition could be adversely affected.
Consolidation among our customers exposes us to increased risks, including reduced revenue and dependence on a smaller number of customers. Increasing consolidation in industries that utilize our services may occur as companies combine to achieve further economies of scale and other synergies, which could result in an increase in excess manufacturing capacity as companies seek to divest manufacturing operations or eliminate duplicative product lines. Excess manufacturing capacity may increase pricing and competitive pressures for our industry as a whole and for us in particular. In addition, if one of our customers is acquired by another company that does not rely on us to provide services and has its own production facilities or relies on another provider of similar services, we may lose that customer’s business. Such consolidation among our customers may further reduce the number of customers that generate a significant percentage of our net revenue and expose us to increased risks relating to dependence on a small number of customers.
Our customers face numerous competitive challenges, which may materially adversely affect their business and ours.
Factors adversely affecting our customers may also adversely affect us. These factors include:
| • | recessionary periods in our customers’ markets; |
|---|
| • | the inability of our customers to adapt to rapidly changing technology and evolving industry standards, which may contribute to short product life cycles or shifts in our customers’ strategies; |
|---|
| • | the inability of our customers to develop, market or gain commercial acceptance of their products, some of which are new and untested; |
|---|
| • | the potential that our customers’ products become commoditized or obsolete; |
|---|
| • | loss of business or a reduction in pricing power experienced by our customers; |
|---|
| • | the emergence of new business models or more popular products and shifting patterns of demand; and |
|---|
| • | a highly-competitive consumer products industry, which is often subject to shorter product lifecycles, shifting end-user preferences and higher revenue volatility. |
|---|
If our customers are unsuccessful in addressing these competitive challenges, their businesses may be materially adversely affected, reducing the demand for our services, decreasing our revenues or altering our production cycles and inventory management, each of which could adv
Showing the first 8K of 73K characters. Open the full section
Item 1B. Unresolved Staff Comments
There are no unresolved written comments from the SEC staff regarding our periodic or current reports.
Table of Contents
Item 2. Properties
We own or lease facilities located primarily in the countries listed below. We believe that our properties are generally in good condition, are well maintained and are generally suitable and adequate to carry out our business at expected capacity for the foreseeable future. The majority of the square footage is active manufacturing space and are reported in both the EMS and DMS operating segments, as both use these properties. Our corporate headquarters is located in St. Petersburg, Florida.
The table below lists the approximate square footage for our facilities as of August 31, 2019 (in thousands):
| Location | Approximate Square Footage | |
| Asia | 32,620 | |
| Americas | 15,425 | |
| Europe | 4,791 | |
| Total as of August 31, 2019 (1)(2) | 52,836 | |
| (1) | Approximately 11% of our total square footage is not currently used in business operations. |
|---|
| (2) | Consists of 18.1 million square feet in facilities that we own with the remaining 34.7 million square feet in leased facilities. |
|---|
Our manufacturing facilities are ISO certified to ISO 9001:2008 standards and most are also certified to ISO-14001:2004 environmental standards.
Item 3. Legal Proceedings
We are party to certain lawsuits in the ordinary course of business. We do not believe that these proceedings, individually or in the aggregate, will have a material adverse effect on our financial position, results of operations or cash flows.
Item 4. Mine Safety Disclosures
Item 5. Market for Registrant’s Common Equity, Related Stockholder Matters and Issuer Purchases of Equity Securities
Market Information and Dividends
Our common stock trades on the New York Stock Exchange under the symbol “JBL.” See discussion of our cash dividends declared to common shareholders in Note 11—“Stockholders’ Equity” to the Consolidated Financial Statements.
We expect to continue to declare and pay quarterly dividends of an amount similar to our past declarations. However, the declaration and payment of future dividends are discretionary and will be subject to determination by our Board of Directors each quarter following its review of our financial performance.
On October 14, 2019, the closing sales price for our common stock as reported on the New York Stock Exchange was $35.64. As of October 14, 2019, there were 1,313 holders of record of our common stock. A substantially greater number of holders of our common stock are “street name” or beneficial holders, whose shares are held of record by banks, brokers, and other financial institutions.
Information regarding equity compensation plans is incorporated by reference to the information set forth in Item 12 of Part III of this report.
Stock Performance Graph
The performance graph and table show a comparison of cumulative total stockholder return, assuming the reinvestment of dividends, from a $100 investment in the common stock of Jabil over the five-year period ending August 31, 2019, with the cumulative stockholder return of the (1) S&P MidCap 400 Index and (2) peer group which includes Celestica Inc., Catcher Technology Co., Ltd, Flex Ltd., Hon-Hai Precision Industry Co. Ltd, Plexus Corp., and Sanmina Corp.
Comparison of 5 Year Cumulative Total Return
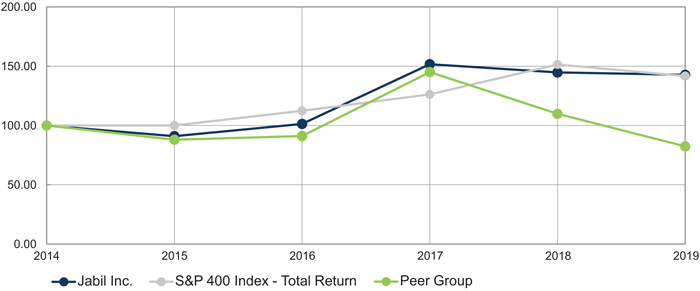
| August 31 | 2014 | 2015 | 2016 | 2017 | 2018 | 2019 | ||||||||||||||||||
| Jabil Inc. | $ | 100 | $ | 91 | $ | 101 | $ | 152 | $ | 145 | $ | 143 | ||||||||||||
| S&P MidCap 400 Index – Total Returns | 100 | 100 | 112 | 126 | 151 | 142 | ||||||||||||||||||
| Peer Group | 100 | 88 | 91 | 145 | 110 | 82 |
Table of Contents
Issuer Purchases of Equity Securities
The following table provides information relating to our repurchase of common stock during the three months ended August 31, 2019:
| Period | Total Number of Shares Purchased(1) | Average Price Paid per Share | Total Number of Shares Purchased as Part of Publicly Announced Program(2) | Approximate Dollar Value of Shares that May Yet Be Purchased Under the Program (in thousands)(2) | ||||||||||||
| June 1, 2019 - June 30, 2019 | 45 | $ | 26.92 | — | $ | — | ||||||||||
| July 1, 2019 - July 31, 2019 | 633 | $ | 30.92 | — | $ | — | ||||||||||
| August 1, 2019 - August 31, 2019 | — | $ | — | — | $ | — | ||||||||||
| Total | 678 | $ | 30.65 | — |
| (1) | The purchases include amounts that are attributable to shares surrendered to us by employees to satisfy, in connection with the vesting of restricted stock units and the exercise of stock options and stock appreciation rights, their tax withholding obligations. |
|---|
| (2) | In September 2019, our Board of Directors (“the Board”) authorized the repurchase of up to $600.0 million of our common stock as publicly announced in a press release on September 24, 2019 (“the 2020 Share Repurchase Program”). From September 24, 2019 through October 14, 2019, we repurchased 874,475 shares, utilizing a total of $30.8 million of the $600.0 million authorized by our Board of Directors. |
|---|
Table of Contents
Item 6. Selected Financial Data
The following selected data is derived from our Consolidated Financial Statements. This data should be read in conjunction with the Consolidated Financial Statements and notes thereto incorporated into Item 8, “Financial Statements and Supplementary Data” and with Item 7, “Management’s Discussion and Analysis of Financial Condition and Results of Operations.”
| Fiscal Year Ended August 31, | ||||||||||||||||||||
| 2019 | 2018 | 2017 | 2016 | 2015 | ||||||||||||||||
| (in thousands, except for per share data) | ||||||||||||||||||||
| Consolidated Statement of Operations Data: | ||||||||||||||||||||
| Net revenue | $ | 25,282,320 | $ | 22,095,416 | $ | 19,063,121 | $ | 18,353,086 | $ | 17,899,196 | ||||||||||
| Operating income | 701,356 | 542,153 | 410,230 | 522,833 | 555,411 | |||||||||||||||
| Income from continuing operations before tax | 450,704 | 373,401 | 256,233 | 387,045 | 431,646 | |||||||||||||||
| Income from continuing operations, net of tax | 289,474 | 87,541 | 127,167 | 254,896 | 294,185 | |||||||||||||||
| Discontinued operations, net of tax(1) | — | — | — | — | (8,573 | ) | ||||||||||||||
| Net income | 289,474 | 87,541 | 127,167 | 254,896 | 285,612 | |||||||||||||||
| Net income attributable to Jabil Inc. | $ | 287,111 | $ | 86,330 | $ | 129,090 | $ | 254,095 | $ | 284,019 | ||||||||||
| Earnings per share attributable to the stockholders of Jabil Inc.: | ||||||||||||||||||||
| Basic: | ||||||||||||||||||||
| Income from continuing operations, net of tax | $ | 1.85 | $ | 0.50 | $ | 0.71 | $ | 1.33 | $ | 1.51 | ||||||||||
| Discontinued operations, net of tax(1) | $ | — | $ | — | $ | — | $ | — | $ | (0.04 | ) | |||||||||
| Net income | $ | 1.85 | $ | 0.50 | $ | 0.71 | $ | 1.33 | $ | 1.47 | ||||||||||
| Diluted: | ||||||||||||||||||||
| Income from continuing operations, net of tax | $ | 1.81 | $ | 0.49 | $ | 0.69 | $ | 1.32 | $ | 1.49 | ||||||||||
| Discontinued operations, net of tax(1) | $ | — | $ | — | $ | — | $ | — | $ | (0.04 | ) | |||||||||
| Net income | $ | 1.81 | $ | 0.49 | $ | 0.69 | $ | 1.32 | $ | 1.45 | ||||||||||
| August 31, | ||||||||||||||||||||
| 2019 | 2018 | 2017 | 2016 | 2015 | ||||||||||||||||
| (in thousands) | ||||||||||||||||||||
| Consolidated Balance Sheets Data: | ||||||||||||||||||||
| Working capital(2) | $ | (187,020 | ) | $ | 319,050 | $ | (243,910 | ) | $ | 280,325 | $ | 191,168 | ||||||||
| Total assets | $ | 12,970,475 | $ | 12,045,641 | $ | 11,095,995 | $ | 10,322,677 | $ | 9,591,600 | ||||||||||
| Current installments of notes payable and long-term debt | $ | 375,181 | $ | 25,197 | $ | 444,255 | $ | 44,689 | $ | 321,964 | ||||||||||
| Notes payable and long-term debt, less current installments | $ | 2,121,284 | $ | 2,493,502 | $ | 1,606,017 | $ | 2,046,655 | $ | 1,308,663 | ||||||||||
| Total Jabil Inc. stockholders’ equity | $ | 1,887,443 | $ | 1,950,257 | $ | 2,353,514 | $ | 2,438,171 | $ | 2,314,856 | ||||||||||
| Common stock shares outstanding | 153,520 | 164,588 | 177,728 | 186,998 | 192,068 | |||||||||||||||
| Fiscal Year Ended August 31, | ||||||||||||||||||||
| 2019 | 2018 | 2017 | 2016 | 2015 | ||||||||||||||||
| (in thousands) | ||||||||||||||||||||
| Consolidated Cash Flow Data: | ||||||||||||||||||||
| Investing activities: | ||||||||||||||||||||
| Acquisition of property, plant and equipment | $ | (1,005,480 | ) | $ | (1,036,651 | ) | $ | (716,485 | ) | $ | (924,239 | ) | $ | (963,145 | ) | |||||
| Proceeds and advances from sale of property, plant and equipment | $ | 218,708 | $ | 350,291 | $ | 175,000 | $ | 26,031 | $ | 15,784 | ||||||||||
| Financing activities: | ||||||||||||||||||||
| Payments to acquire treasury stock | $ | (350,323 | ) | $ | (450,319 | ) | $ | (306,640 | ) | $ | (148,340 | ) | $ | (85,576 | ) |
| (1) | During fiscal year 2014, we sold our Aftermarket Services business for consideration of $725.0 million. |
|---|
| (2) | Working capital is defined as current assets minus current liabilities. |
|---|
Table of Contents
Item 7. Management’s Discussion and Analysis of Financial Condition and Results of Operations
Overview
We are one of the leading providers of worldwide manufacturing services and solutions. We provide comprehensive electronics design, production and product management services to companies in various industries and end markets. We derive substantially all of our revenue from production and product management services (collectively referred to as “manufacturing services”), which encompass the act of producing tangible components that are built to customer specifications and are then provided to the customer.
We have two reporting segments: Electronics Manufacturing Services (“EMS”) and Diversified Manufacturing Services (“DMS”), which are organized based on the economic profiles of the services performed, including manufacturing capabilities, market strategy, margins, return on capital and risk profiles. Our EMS segment is focused around leveraging IT, supply chain design and engineering, technologies largely centered on core electronics, utilizing our large scale manufacturing infrastructure and our ability to serve a broad range of end markets. Our EMS segment is a high volume business that produces product at a quicker rate (i.e. cycle time) and in larger quantities and includes customers primarily in the automotive and transportation, capital equipment, cloud, computing and storage, defense and aerospace, industrial and energy, networking and telecommunications, print and retail, and smart home and appliances industries. Our DMS segment is focused on providing engineering solutions, with an emphasis on material sciences, technologies and healthcare. Our DMS segment includes customers primarily in the edge devices and accessories, healthcare, mobility and packaging industries.
Our cost of revenue includes the cost of electronic components and other materials that comprise the products we manufacture; the cost of labor and manufacturing overhead; and adjustments for excess and obsolete inventory. As a provider of turnkey manufacturing services, we are responsible for procuring components and other materials. This requires us to commit significant working capital to our operations and to manage the purchasing, receiving, inspecting and stocking of materials. Although we bear the risk of fluctuations in the cost of materials and excess scrap, our ability to purchase components and materials efficiently may contribute significantly to our operating results. While we periodically negotiate cost of materials adjustments with our customers, rising component and material prices may negatively affect our margins. Net revenue from each product that we manufacture consists of an element based on the costs of materials in that product and an element based on the labor and manufacturing overhead costs allocated to that product. Our gross margin for any product depends on the mix between the cost of materials in the product and the cost of labor and manufacturing overhead allocated to the product.
Our operating results are impacted by the level of capacity utilization of manufacturing facilities; indirect labor costs; and selling, general and administrative expenses. Operating income margins have generally improved during periods of high production volume and high capacity utilization. During periods of low production volume, we generally have reduced operating income margins.
We monitor the current economic environment and its potential impact on both the customers we serve as well as our end markets and closely manage our costs and capital resources so that we can try to respond appropriately as circumstances change.
We have consistently utilized advanced circuit design, production design and manufacturing technologies to meet the needs of our customers. To support this effort, our engineering staff focuses on developing and refining design and manufacturing technologies to meet specific needs of specific customers. Most of the expenses associated with these customer-specific efforts are reflected in our cost of revenue. In addition, our engineers engage in research and development (“R&D”) of new technologies that apply generally to our operations. The expenses of these R&D activities are reflected in the research and development line item within our Consolidated Statement of Operations.
An important element of our strategy is the expansion of our global production facilities. The majority of our revenue and materials costs worldwide are denominated in U.S. dollars, while our labor and utility costs in operations outside the U.S. are denominated in local currencies. We economically hedge certain of these local currency costs, based on our evaluation of the potential exposure as compared to the cost of the hedge, through the purchase of foreign currency exchange contracts. Changes in the fair market value of such hedging instruments are reflected within the Consolidated Statement of Operations and the Consolidated Statement of Comprehensive Income.
See Note 12 – “Concentration of Risk and Segment Data” to the Consolidated Financial Statements.
Table of Contents
Summary of Results
The following table sets forth, for the periods indicated, certain key operating results and other financial information (in thousands, except per share data):
| Fiscal Year Ended August 31, | ||||||||||||
| 2019 | 2018 | 2017 | ||||||||||
| Net revenue | $ | 25,282,320 | $ | 22,095,416 | $ | 19,063,121 | ||||||
| Gross profit | $ | 1,913,401 | $ | 1,706,792 | $ | 1,545,643 | ||||||
| Operating income | $ | 701,356 | $ | 542,153 | $ | 410,230 | ||||||
| Net income attributable to Jabil Inc. | $ | 287,111 | $ | 86,330 | $ | 129,090 | ||||||
| Earnings per share – basic | $ | 1.85 | $ | 0.50 | $ | 0.71 | ||||||
| Earnings per share – diluted | $ | 1.81 | $ | 0.49 | $ | 0.69 |
Key Performance Indicators
Management regularly reviews financial and non-financial performance indicators to assess the Company’s operating results. The following table sets forth, for the quarterly periods indicated, certain of management’s key financial performance indicators:
| Three Months Ended | ||||||||||||||||
| August 31, 2019 | May 31, 2019 | February 28, 2019 | November 30, 2018 | |||||||||||||
| Sales cycle(1) | 19 days | 27 days | 25 days | 16 days | ||||||||||||
| Inventory turns (annualized)(2) | 6 turns | 6 turns | 6 turns | 6 turns | ||||||||||||
| Days in accounts receivable(3) | 38 days | 39 days | 38 days | 38 days | ||||||||||||
| Days in inventory(4) | 58 days | 64 days | 65 days | 60 days | ||||||||||||
| Days in accounts payable(5) | 77 days | 76 days | 78 days | 82 days | ||||||||||||
| Three Months Ended | ||||||||||||||||
| August 31, 2018 | May 31, 2018 | February 28, 2018 | November 30, 2017 | |||||||||||||
| Sales cycle(1) | 1 day | 9 days | 3 days | (2) days | ||||||||||||
| Inventory turns (annualized) | 6 turns | 6 turns | 6 turns | 6 turns | ||||||||||||
| Days in accounts receivable | 26 days | 26 days | 26 days | 25 days | ||||||||||||
| Days in inventory(4) | 58 days | 60 days | 62 days | 58 days | ||||||||||||
| Days in accounts payable(5) | 83 days | 77 days | 85 days | 85 days |
| (1) | T
Showing the first 8K of 84K characters. Open the full section
Item 7A. Quantitative and Qualitative Disclosures About Market Risk
Foreign Currency Exchange Risks
We transact business in various foreign countries and are, therefore, subject to risk of foreign currency exchange rate fluctuations. We enter into forward contracts to economically hedge transactional exposure associated with commitments arising from trade accounts receivable, trade accounts payable, intercompany transactions and fixed purchase obligations denominated in a currency other than the functional currency of the respective operating entity. We do not, and do not intend to use derivative financial instruments for speculative or trading purposes. All derivative instruments are recorded on our Consolidated Balance Sheets at their respective fair values.
The forward contracts (both those that are designated and not designated as accounting hedging instruments) will generally expire in less than three months, with 12 months being the maximum term of the contracts outstanding as of August 31, 2019. The change in fair value related to contracts designated as accounting hedging instruments is initially reported as a component of AOCI and subsequently reclassified to the revenue or expense line in which the underlying transaction occurs within our Consolidated Statements of Operations. The change in fair value related to contracts not designated as accounting hedging instruments will be reflected in cost of revenue within our Consolidated Statements of Operations. The forward contracts are primarily denominated in Chinese yuan renminbi, Euros and Mexican pesos.
Based on our overall currency rate exposures as of August 31, 2019, including the derivative financial instruments intended to hedge the nonfunctional currency-denominated monetary assets and liabilities, an immediate 10% hypothetical change of foreign currency exchange rates would not have a material effect on our Consolidated Financial Statements. See Note 13 — “Derivative Financial Instruments and Hedging Activities” to the Consolidated Financial Statements for additional information.
Interest Rate Risk
Our exposure to market risk includes changes in interest rates that could affect the Consolidated Balance Sheet, Consolidated Statement of Operations, and the Consolidated Statement of Cash Flows. We are exposed to interest rate risk primarily on variable rate borrowings under the 2017 Credit Facility and 2018 Credit Facility. There were $804.9 million in borrowings outstanding under debt facilities with variable interest rates as of August 31, 2019. See “Management’s Discussion and Analysis of Financial Condition and Results of Operations — Liquidity and Capital Resources” and Note 8 — “Notes Payable and Long-Term Debt” to the Consolidated Financial Statements for additional information regarding our outstanding debt obligations.
To manage our exposure to market risk, we use derivative financial instruments when deemed appropriate. In connection with our variable interest rate debt, we have interest rate swaps with aggregate notional amounts of $200.0 million and $350.0 million, which expire on August 31, 2020 and August 24, 2020, respectively. See Note 13 — “Derivative Financial Instruments and Hedging Activities” to the Consolidated Financial Statements for additional information regarding our interest rate swap transactions. We do not, and do not intend to, use derivative financial instruments for speculative or trading purposes.
We utilize valuation models to estimate the effects of sudden interest rate changes. The impact of a hypothetical change of 10.0% in variable interest rates would result in an increase or decrease in interest expense of approximately $4.2 million for fiscal year 2020.
Item 8. Financial Statements and Supplementary Data
Certain information required by this item is included in Item 7 of Part II of this Report under the heading “Quarterly Results” and is incorporated into this item by reference. All other information required by this item is included in Item 15 of Part IV of this Report and is incorporated into this item by reference.
Table of Contents
Item 9. Changes in and Disagreements With Accountants on Accounting and Financial Disclosure
There have been no changes in or disagreements with our accountants on accounting and financial disclosure.
Item 9A. Controls and Procedures
(a) Evaluation of Disclosure Controls and Procedures
We carried out an evaluation required by Rules 13a-15 and 15d-15 under the Exchange Act (the “Evaluation”), under the supervision and with the participation of our Chief Executive Officer (“CEO”) and Chief Financial Officer (“CFO”), of the effectiveness of our disclosure controls and procedures as defined in Rules 13a-15 and 15d-15 under the Exchange Act as of August 31, 2019. Based on the Evaluation, our CEO and CFO concluded that the design and operation of our disclosure controls were effective to ensure that information required to be disclosed by us in reports that we file or submit under the Exchange Act is (i) recorded, processed, summarized and reported within the time periods specified in SEC rules and forms, and (ii) accumulated and communicated to our senior management, including our CEO and CFO, to allow timely decisions regarding required disclosure.
(b) Management’s Report on Internal Control over Financial Reporting
We assessed the effectiveness of our internal control over financial reporting as of August 31, 2019. Management’s report on internal control over financial reporting as of August 31, 2019 is incorporated herein at Item 15. Ernst & Young LLP, our independent registered public accounting firm, issued an audit report on the effectiveness of our internal control over financial reporting as of August 31, 2019, which is incorporated herein at Item 15.
Our management, including our CEO and CFO, does not expect that our internal control over financial reporting will prevent all errors and all fraud. A control system, no matter how well conceived and operated, can provide only reasonable, not absolute, assurance that the objectives of the control system are met. Further, the design of a control system must reflect the fact that there are resource constraints, and the benefits of controls must be considered relative to their costs. Because of the inherent limitations in all control systems, no evaluation of controls can provide absolute assurance that all control issues and instances of fraud, if any, within the Company have been detected. These inherent limitations include the realities that judgments in decision-making can be faulty, and that breakdowns can occur because of simple error or mistake. Additionally, controls may be circumvented by the individual acts of some persons, by collusion of two or more people, or by management override of the control.
The design of any system of controls also is based in part upon certain assumptions about the likelihood of future events, and there can be no assurance that any design will succeed in achieving its stated goals under all potential future conditions; over time, a control may become inadequate because of changes in conditions, or the degree of compliance with the policies or procedures may deteriorate. Because of the inherent limitations in a cost-effective control system, misstatements due to error or fraud may occur and not be detected.
Notwithstanding the foregoing limitations on the effectiveness of controls, we have reached the conclusions set forth in Management’s report on internal control over financial reporting as of August 31, 2019.
The SEC’s general guidance permits the exclusion of an assessment of the effectiveness of a registrant’s controls and procedures as they relate to its internal control over financial reporting for an acquired business during the first year following such acquisition if, among other circumstances and factors, there is not an adequate amount of time between the acquisition date and the date of assessment. On February 25, 2019 and April 29, 2019, we completed the initial closing and second closing, respectively, of our acquisition of certain assets of Johnson & Johnson Medical Devices Companies (“JJMD”). In accordance with the SEC guidance, the scope of our evaluation of internal controls over financial reporting as of August 31, 2019 did not include the internal control over financial reporting of these acquired operations. Assets acquired from JJMD represent 1.8% of our total consolidated assets at August 31, 2019. Net revenue generated by JJMD subsequent to the dates of acquisition represents 1.3% of our consolidated net revenue for the fiscal year ended August 31, 2019. We continue to evaluate internal controls over financial reporting for these acquired operations. From the acquisition dates to August 31, 2019, the processes and systems of the acquired operations did not significantly impact our internal control over financial reporting.
(c) Changes in Internal Control over Financial Reporting
For our fiscal quarter ended August 31, 2019, we did not identify any modifications to our internal control over financial reporting that have materially affected, or are reasonably likely to materially affect, our internal control over financial reporting.
Table of Contents
Item 9B. Other Information
Item 10. Directors, Executive Officers and Corporate Governance
Information regarding our executive officers is included in Item 1 of Part I of this Report under the heading “Information about our Executive Officers.”
The other information required by this item is incorporated by reference to the information set forth under the captions “Election of Directors”, “Beneficial Ownership – Delinquent Section 16(a) Reports” and “Corporate Governance” and “Board of Directors” in our Proxy Statement for the Annual Meeting of Stockholders to be filed with the SEC within 120 days after the end of our fiscal year ended August 31, 2019 (“Proxy Statement”).
Item 11. Executive Compensation
The information required by this item is incorporated by reference to the information set forth under the captions “Compensation Matters – Compensation Discussion and Analysis”, “Board of Directors – Director Compensation”, “Corporate Governance – Compensation Committee Interlocks and Insider Participation” in our Proxy Statement.
Item 12. Security Ownership of Certain Beneficial Owners and Management and Related Stockholder Matters
The information required by this item is incorporated by reference to the information set forth under the captions “Beneficial Ownership – Share Ownership by Principal Stockholders and Management” and “Compensation Matters – Equity Compensation Plan Information” in our Proxy Statement.
Item 13. Certain Relationships and Related Transactions, and Director Independence
The information required by this item is incorporated by reference to the information set forth under the captions “Corporate Governance – Related Party Transactions – Certain Related Party Transactions”, “Corporate Governance –Determinations of Director Independence” in our Proxy Statement.
Item 14. Principal Accounting Fees and Services
The information required by this item is incorporated by reference to the information set forth under the captions “Audit Committee Matters – Principal Accounting Fees and Services”, “– Policy on Audit Committee Pre-Approval of Audit, Audit-Related and Permissible Non-Audit Services” and ”– Ratification of Appointment of Independent Registered Public Accounting Firm” in our Proxy Statement.
Table of Contents
PART IV
Item 15. Exhibits and Financial Statement Schedules
| (a) | The following documents are filed as part of this Report: |
|---|
| 1 | Financial Statements. Our consolidated financial statements, and related notes thereto, with the independent registered public accounting firm reports thereon are included in Part IV of this report on the pages indicated by the Index to Consolidated Financial Statements and Schedule. |
|---|
| 2 | Financial Statement Schedule. Our financial statement schedule is included in Part IV of this report on the page indicated by the Index to Consolidated Financial Statements and Schedule. This financial statement schedule should be read in conjunction with our consolidated financial statements, and related notes thereto. |
|---|
Schedules not listed in the Index to Consolidated Financial Statements and Schedule have been omitted because they are not applicable, not required, or the information required to be set forth therein is included in the consolidated financial statements or notes thereto.
| 3 | Exhibits. See Item 15(b) below. |
|---|
| (b) | Exhibits. The following exhibits are included as part of, or incorporated by reference into, this Report. |
|---|
EXHIBIT LIST
Table of Contents
Showing the first 8K of 204K characters. Open the full section
Item 16. Form 10-K Summary
Not applicable.
Table of Contents
SIGNATURES
Pursuant to the requirements of Section 13 or 15(d) of the Securities Exchange Act of 1934, the registrant has duly caused this report to be signed on its behalf by the undersigned, thereunto duly authorized.
| JABIL INC. Registrant | ||
| By: | /s/ MARK T. MONDELLO | |
| Mark T. Mondello | ||
| Chief Executive Officer |
Date: October 22, 2019
Table of Contents
POWER OF ATTORNEY
KNOW ALL THESE PERSONS BY THESE PRESENTS, that each person whose signature appears below constitutes and appoints Mark T. Mondello and Michael Dastoor and each of them, jointly and severally, his or her attorneys-in-fact, each with full power of substitution, for him or her in any and all capacities, to sign any and all amendments to this Annual Report on Form 10-K, and to file the same, with exhibits thereto and other documents in connection therewith, with the Securities and Exchange Commission, hereby ratifying and confirming all that each said attorneys-in-fact or his substitute or substitutes, may do or cause to be done by virtue hereof.
Pursuant to the requirements of the Securities Exchange Act of 1934, this report has been signed below by the following persons on behalf of the registrant and in the capacities and on the dates indicated:
| Signature | Title | Date | ||||
| By: | /s/ TIMOTHY L. MAIN Timothy L. Main | Chairman of the Board of Directors | October 22, 2019 | |||
| By: | /s/ THOMAS A. SANSONE Thomas A. Sansone | Vice Chairman of the Board of Directors | October 22, 2019 | |||
| By: | /s/ MARK T. MONDELLO Mark T. Mondello | Chief Executive Officer and Director (Principal Executive Officer) | October 22, 2019 | |||
| By: | /s/ MICHAEL DASTOOR Michael Dastoor | Chief Financial Officer (Principal Financial and Accounting Officer) | October 22, 2019 | |||
| By: | /s/ ANOUSHEH ANSARI Anousheh Ansari | Director | October 22, 2019 | |||
| By: | /s/ MARTHA F. BROOKS Martha F. Brooks | Director | October 22, 2019 | |||
| By: | /s/ CHRISTOPHER S. HOLLAND Christopher S. Holland | Director | October 22, 2019 | |||
| By: | /s/ JOHN C. PLANT John C. Plant | Director | October 22, 2019 | |||
| By: | /s/ STEVEN A. RAYMUND Steven A. Raymund | Director | October 22, 2019 | |||
| By: | /s/ DAVID M. STOUT David M. Stout | Director | October 22, 2019 | |||
| By: | /s/ KATHLEEN A. WALTERS Kathleen A. Walters | Director | October 22, 2019 |
Table of Contents
SCHEDULE II
JABIL INC. AND SUBSIDIARIES
SCHEDULE OF VALUATION AND QUALIFYING ACCOUNTS
(in thousands)
| Balance at Beginning of Period | Additions and Adjustments Charged to Costs and Expenses | Additions/ (Reductions) Charged to Other Accounts | Write-offs | Balance at End of Period | ||||||||||||||||
| Allowance for uncollectible accounts receivable: | ||||||||||||||||||||
| Fiscal year ended August 31, 2019 | $ | 15,181 | $ | 15,867 | $ | — | $ | (13,827 | ) | $ | 17,221 | |||||||||
| Fiscal year ended August 31, 2018 | $ | 14,134 | $ | 12,545 | $ | — | $ | (11,498 | ) | $ | 15,181 | |||||||||
| Fiscal year ended August 31, 2017 | $ | 11,094 | $ | 6,255 | $ | — | $ | (3,215 | ) | $ | 14,134 | |||||||||
| Balance at Beginning of Period | Additions and Adjustments Charged to Costs and Expenses | Additions/ (Reductions) Charged to Other Accounts | Write-offs | Balance at End of Period | ||||||||||||||||
| Reserve for excess and obsolete inventory: | ||||||||||||||||||||
| Fiscal year ended August 31, 2019 | $ | 60,940 | $ | 34,091 | $ | — | $ | (25,478 | ) | $ | 69,553 | |||||||||
| Fiscal year ended August 31, 2018 | $ | 46,013 | $ | 35,538 | $ | — | $ | (20,611 | ) | $ | 60,940 | |||||||||
| Fiscal year ended August 31, 2017 | $ | 32,221 | $ | 46,030 | $ | — | $ | (32,238 | ) | $ | 46,013 | |||||||||
| Balance at Beginning of Period | Additions Charged to Costs and Expenses(1) | Additions/ (Reductions) Charged to Other Accounts(2) | Reductions Charged to Costs and Expenses(3) | Balance at End of Period | ||||||||||||||||
| Valuation allowance for deferred taxes: | ||||||||||||||||||||
| Fiscal year ended August 31, 2019 | $ | 223,487 | $ | 22,750 | $ | 58,117 | $ | (16,750 | ) | $ | 287,604 | |||||||||
| Fiscal year ended August 31, 2018 | $ | 285,559 | $ | 18,418 | $ | (886 | ) | $ | (79,604 | ) | $ | 223,487 | ||||||||
| Fiscal year ended August 31, 2017 | $ | 344,828 | $ | 65,300 | $ | (97,203 | ) | $ | (27,366 | ) | $ | 285,559 | ||||||||
| (1) | During the fiscal years ended August 31, 2019, 2018 and 2017, the additions charged to costs and expenses primarily relate to the increase of deferred tax assets for sites with existing valuation allowances. |
|---|
| (2) | During the fiscal year ended August 31, 2019, the additions charged to other accounts primarily relate to the increase of net operating loss carry forwards due to the release of a non-U.S. unrecognized tax benefit. During the fiscal year ended August 31, 2017, the reductions charged to other accounts primarily relate to the decrease of net operating loss carry forwards due to non-U.S. unrecognized tax benefits and a non-U.S. tax audit. |
|---|
| (3) | During the fiscal years ended August 31, 2019 and 2018, the reductions charged to costs and expenses primarily relate to the decrease of U.S. net operating loss carry forwards and tax credits due to utilization against the one-time transition tax as a result of the Tax Act. During the fiscal year ended August 31, 2019, an additional reduction charged to costs and expenses relates to the $17.5 million income tax benefit for the reversal of a U.S. valuation allowance due to an intangible asset reclassification from indefinite-life to finite-life. During the fiscal year ended August 31, 2017, the reductions charged to costs and expenses primarily relate to the release of certain non-U.S. valuation allowances. |
|---|
See accompanying report of independent registered public accounting firm.