 filings.tools
Jabil (JBL) 10-K risk factor changes: FY2021 vs FY2020
The 2021-08-31 10-K against the 2020-08-31 one, compared heading by heading and sentence by sentence.
Item 1A111 rewritten23 added20 removed251 unchanged
All filing items1,196 rewritten1,100 added608 removed1,039 unchanged
Summary
counted, not written
- Item 1A lists 35 risk factor headings: 1 new, 4 reworded and 30 unchanged since FY2020. 1 heading from FY2020 no longer appears.
- Sentence by sentence, 1,100 added, 608 removed, 1,196 rewritten and 1,039 unchanged across 13 items that differ.
New Item 1A headings (1)
- Our operations result in exposure to intellectual property claims.
Removed Item 1A headings (1)
- Our manufacturing, production and design processes and services may result in exposure to intellectual property infringement and other claims.
Reworded Item 1A headings (4)
- The effect of COVID-19 on our operations and the operations of our customers, suppliers and logistics providers
[removed: has,][added: has had,] and[removed: is expected to continue to][added: may in the future again] have, a material and adverse impact on our financial condition and results of operations. - Customer relationships with emerging companies
[removed: may]present more risks than with established companies. - We compete with numerous other diversified manufacturing service providers, electronic manufacturing
[removed: services and][added: services,] design providers and others. - We derive a substantial majority of our revenues from our international operations, which
[removed: may be][added: are] subject to a number of different risks and often require more management time and expense than our domestic operations.
A heading is new when no FY2020 heading matches it after ignoring case and punctuation, and reworded when it shares at least 60 percent of its words with one that went away. All current risk factor headings.
Sentences by item
22 items, with every count and a link to each item that changed
| Item | Added | Removed | Rewritten | Unchanged |
|---|---|---|---|---|
| Item 1A. Risk Factors | 23 | 20 | 111 | 251 |
| Item 7. Management’s Discussion and Analysis of Financial Condition and Results of Operations | 298 | 169 | 186 | 158 |
| Item 7A. Quantitative and Qualitative Disclosures About Market Risk | 1 | 2 | 7 | 16 |
| Item 1. Business | 112 | 26 | 59 | 119 |
| Item 3. Legal Proceedings | 1 | 2 | 0 | 0 |
| Cover and table of contents | 17 | 9 | 43 | 43 |
| Item 1B. Unresolved Staff Comments | 0 | 0 | 0 | 1 |
| Item 2. Properties | 30 | 4 | 8 | 5 |
| Item 4. Mine Safety Disclosures | 0 | 0 | 0 | 2 |
| Item 5. Market for Registrant’s Common Equity, Related Stockholder Matters and Issuer Purchases of Equity Securities | 11 | 11 | 10 | 10 |
| Item 6. [Reserved] | 0 | 33 | 0 | 0 |
| Item 8. Financial Statements and Supplementary Data | 0 | 0 | 0 | 2 |
| Item 9. Changes in and Disagreements With Accountants on Accounting and Financial Disclosure | 0 | 0 | 0 | 1 |
| Item 9A. Controls and Procedures | 0 | 7 | 6 | 12 |
| Item 9B. Other Information | 0 | 0 | 0 | 2 |
| Item 10. Directors, Executive Officers and Corporate Governance | 0 | 0 | 1 | 1 |
| Item 11. Executive Compensation | 0 | 0 | 0 | 1 |
| Item 12. Security Ownership of Certain Beneficial Owners and Management and Related Stockholder Matters | 0 | 0 | 0 | 1 |
| Item 13. Certain Relationships and Related Transactions, and Director Independence | 0 | 0 | 0 | 1 |
| Item 14. Principal Accounting Fees and Services | 0 | 0 | 0 | 2 |
| Item 15. Exhibits and Financial Statement Schedules | 583 | 313 | 729 | 400 |
| Item 16. Form 10-K Summary | 24 | 12 | 36 | 11 |
Underlined words on a shaded ground are new in FY2021; struck-through words were in FY2020. Sentences that are wholly new or wholly gone are labelled rather than marked.
Item 1A. Risk Factors
111 rewritten, 23 added, 20 removed, 251 unchanged
[removed: Operational] [added: Business and Operational] Risks
The effect of COVID-19 on our operations and the operations of our customers, suppliers and logistics providers [removed: has,] [added: has had,] and [removed: is expected to continue to] [added: may in the future again] have, a material and adverse impact on our financial condition and results of operations.
COVID-19 [removed: has now] [added: continues to] spread across the globe and is impacting worldwide economic activity, including our global manufacturing production sites.
COVID-19 has also impacted our customers and [removed: may create] [added: creates] unpredictable reductions or increases in demand for our manufacturing services.
The ability of our employees to work [added: has been, and] may [added: again] be significantly impacted by individuals contracting or being exposed to COVID-19.
While we are following the requirements of governmental authorities and taking preventative and protective measures to prioritize the safety of our employees, these measures [removed: may] [added: are] not [removed: be successful,] [added: always successful] and we [removed: may be] [added: have been] required to temporarily close facilities or take other measures.
In addition, responding to the continuing pandemic [removed: could divert] [added: diverts] management’s attention from our key strategic priorities, [added: and may] cause us to reduce, delay, alter or abandon initiatives that may otherwise increase our long-term value or otherwise disrupt our business operations.
We believe COVID-19 [removed: will continue to have] [added: has had, and may in the future again have,] a material and adverse impact on our consolidated financial position, results of operations and cash [removed: flows in the near term.][added: flows.]
See “Business – The Company.” In some instances, particular manufacturing services we provide for a customer represent a significant [removed: portion of the overall revenue we receive from that customer.]
Increasing consolidation in industries that utilize our services may occur as companies combine to achieve further economies of scale and other synergies, which could result in an increase in excess manufacturing capacity as [added: companies seek to divest manufacturing operations or eliminate duplicative product lines.]
[removed: | • |] [added: -] recessionary periods in our customers’ markets; [removed: |]
[removed: | • |] [added: -] the inability of our customers to adapt to rapidly changing technology and evolving industry standards, which may contribute to short product life cycles or shifts in our customers’ strategies; [removed: |]
[removed: | • |] [added: -] the inability of our customers to develop, market or gain commercial acceptance of their products, some of which are new and untested; [removed: |]
[removed: | • |] [added: -] the potential that our customers’ products become commoditized or obsolete; [removed: |]
[removed: | • |] [added: -] loss of business or a reduction in pricing power experienced by our customers; [removed: |]
[removed: | • |] [added: -] the emergence of new business models or more popular products and shifting patterns of demand; and [removed: |]
[removed: | • |] [added: -] a highly-competitive consumer products industry, which is often subject to shorter product lifecycles, shifting end-user preferences and higher revenue volatility. [removed: |]
Our inability to forecast the level of customer orders with certainty makes it difficult to schedule production and maximize utilization of our manufacturing [removed: capacity.][added: capacity and supply chain capabilities.]
On occasion, customers [removed: may require] [added: have required] rapid increases in production for one or more of their products or [removed: request] [added: requested] that we relocate our manufacturing operations or transfer manufacturing from one facility to another, which [removed: can stress] [added: stresses] our resources and [added: may] reduce operating margins.
Customer relationships with emerging companies [removed: may] present more risks than with established companies.
We sometimes offer these customers extended payment terms, loans and other support and financial accommodations which [removed: may increase] [added: increases] our financial [removed: exposure.][added: exposure and has impacted our financial results in the past.]
The success of new business models or programs depends on a number of factors including, but not limited to, a sufficient understanding of the new business or markets, timely and successful product development (by us and/or our customer), market acceptance, our ability to manage the risks associated with new [added: business models or programs and new] product production ramp-up, the effective management of purchase commitments and inventory levels in line with anticipated product demand, our development or acquisition of appropriate intellectual property, the availability of supplies in adequate quantities and at appropriate costs to meet anticipated demand, and the risk that new products may have quality or other defects in the early stages of introduction.
As a result, we must make long-term investments, develop or obtain appropriate intellectual property and commit significant resources before knowing whether our assumptions will accurately reflect customer [removed: demand for our services or for our customer’s products.][added: demand.]
After the development of a new business model or program, we [added: typically] must be able to manufacture appropriate volumes quickly and at low cost.
To accomplish this, we endeavor to accurately forecast volumes, mixes of products and configurations that meet customer requirements; however, we [removed: may] [added: do] not [added: always] succeed at doing so.
We compete with numerous other diversified manufacturing service providers, electronic manufacturing [removed: services and] [added: services,] design providers and others.
We compete against numerous domestic and foreign electronic manufacturers, manufacturing service [added: providers, design] providers and [removed: design providers.][added: others.]
The significant purchasing power and market power of these [added: competitors, many] large [removed: companies] [added: companies,] could increase pricing and competitive pressures for us.
[removed: | • |] [added: -] respond more quickly to new or emerging technologies or changes in customer requirements; [removed: |]
[removed: | • |] [added: -] have technological expertise, engineering capabilities and/or manufacturing resources that are greater than ours; [removed: |]
[removed: | • |] [added: -] have greater name recognition, critical mass and geographic market presence; [removed: |]
[removed: | • |] [added: -] be better able to take advantage of acquisition opportunities; [removed: |]
[removed: | • |] [added: -] devote greater resources to the development, promotion and sale of their services and execution of their strategy; [removed: |]
[removed: | • |] [added: -] be better positioned to compete on price for their services; [removed: |]
[removed: | • |] [added: -] have excess capacity, and be better able to utilize such excess capacity; [removed: |]
[removed: | • |] [added: -] have greater direct buying power from component suppliers, distributors and raw material suppliers; [removed: |]
[removed: | • |] [added: -] have lower cost structures as a result of their geographic location or the services they provide; [removed: |]
[removed: | • |] [added: -] be willing or able to make sales or provide services at lower margins than we do; [removed: |]
[removed: | • |] [added: -] have increased vertical capabilities providing them greater cost savings. [removed: |]
The actions of competitors and current and potential customers [added: have and] could cause a decline in our sales and/or compression of our profits.
Our suppliers have experienced facility closures or reductions in their capacity utilization levels, which in some cases are ongoing.
Our suppliers may experience closures or reductions again in the future.
When this occurs we have and may in the future again have difficulty sourcing materials necessary to fulfill production requirements which could lead to higher material and freight costs.
portion of the overall revenue we receive from that customer.
- the impact of the COVID-19 pandemic on our customers;
- higher potential for theft, misappropriation or unauthorized access to or use of technology, data or intellectual property; and
- international trade disputes could result in tariffs and other protectionist measures that could adversely affect our business.
Tariffs could increase the costs of the components and raw materials we use in the manufacturing process as well as import and export costs for finished products.
Countries could adopt other protectionist measures that could limit our ability to manufacture products or provide services.
Increased costs to our U.S. customers who use our non-U.S. manufacturing sites and components may adversely impact demand for our services and our results of operation and financial condition.
Additionally, international trade disputes may cause our customers to decide to relocate the manufacturing of their products to another location, either within country, or into a new country.
Relocations may require considerable management time as well as expenses related to market, personnel and facilities development before any significant revenue is generated, which may negatively affect our margin.
Furthermore, there can be no assurance that all customer manufacturing needs can be met in available locations within the desired timeframe, or at all, which may cause us to lose business, which may negatively affect our financial condition and results of operation.
market, personnel and facilities development before any significant revenue is generated.
those that we have traditionally faced in making acquisitions.
We are subject to extensive government regulation and industry standards relating to the products we design and manufacture as well as how we conduct our business, including regulations and standards relating to labor and employment
We are subject to a variety of federal, state, local and foreign environmental, health and safety, product stewardship and producer responsibility laws and regulations, including those arising from global pandemics or relating to the use, generation,
Our operations result in exposure to intellectual property claims.
Providing turnkey design solutions, designs, technology and other services may expose us to different or greater potential liabilities than those we face providing traditional manufacturing services.
In addition, the U. K.’s Financial Conduct Authority, which regulates LIBOR, announced that it intends to phase out LIBOR by the end of 2021, though the ICE Benchmark Administration, the administrator of LIBOR, announced that it would consider ceasing the publication of the one week and two-month U.S. dollar LIBOR settings at the end of 2021 and phase out the remaining U.S. dollar LIBOR settings by June 30, 2023.
The transition from LIBOR to a new replacement benchmark is
uncertain at this time and the consequences of such developments cannot be entirely predicted but could result in an increase in the cost of borrowings on our variable rate debt, which could adversely impact our interest expense, results of operations and cash flows.
While we maintain similar manufacturing capacities at different locations and coordinate multi-source supplier
If our suppliers experience additional closures or reductions in their capacity utilization levels in the future, we may have difficulty sourcing materials necessary to fulfill production requirements.
companies seek to divest manufacturing operations or eliminate duplicative product lines.
| | |
| --- | --- |
components and materials needed to manufacture customer products at favorable prices.
| • | international trade disputes could result in tariffs and other protectionist measures that could adversely affect our business. Tariffs could increase the costs of the components and raw materials we use in the manufacturing process as well as import and export costs for finished products. Countries could adopt other protectionist measures that could limit our ability to manufacture products or provide services. Increased costs to our U.S. customers who use our non-U.S. manufacturing sites and components may adversely impact demand for our services and our results of operation and financial condition. Additionally, international trade disputes may cause our customers to decide to relocate the manufacturing of their products to another location, either within country, or into a new country. Relocations may require considerable management time as well as expenses related to market, personnel and facilities development before any significant revenue is generated, which may negatively affect our margin. Furthermore, there can be no assurance that all customer manufacturing needs can be met in available locations within the desired timeframe, or at all, which may cause us to lose business, which may negatively affect our financial condition and results of operation. |
Similarly, we cannot assure you that we will
Soil and
Our manufacturing, production and design processes and services may result in exposure to intellectual property infringement and other claims.
In addition, we may be responsible for claims that our manufacturing processes or components used in manufacturing infringe third party intellectual property rights.
In the event of a claim, we may be required to spend significant amounts of money and effort to develop non-infringing alternatives or obtain and maintain licenses.
We may not be successful in developing such alternatives or obtaining or maintaining such licenses on reasonable terms or at all.
We, our suppliers or our customers may be required to or decide to discontinue products, and such discontinuance may result in a significant decrease in our business, and could have a material adverse effect on our results of operations and financial position.
However, we
If any of the foregoing occur, it could impair our ability to compete with others in our industry, result in a significant decrease in our business and/or could have material adverse effect on our results of operations and financial position.
operations, we are unable to predict how any expirations will impact us in the future.
In addition, the U. K.’s Financial Conduct Authority, which regulates LIBOR, announced that it intends to phase out LIBOR by the end of 2021.
The alternative reference rates for U.S. dollar LIBOR and other currencies have been announced.
At this time, we cannot predict how markets will respond to these proposed alternative rates or the effect of any changes to LIBOR or the discontinuation of LIBOR.
If LIBOR is no longer available or if our lenders have increased costs due to changes in LIBOR, we may experience potential increases in interest rates on our variable rate debt, which could adversely impact our interest expense, results of operations and cash flows.
An excerpt. Shown here: 40 of 111 rewritten, all 23 added and all 20 removed. The counts are complete. For every sentence, read Item 1A. Risk Factors in the FY2021 filing and the FY2020 filing.
Item 7. Management’s Discussion and Analysis of Financial Condition and Results of Operations
186 rewritten, 298 added, 169 removed, 158 unchanged
Our EMS segment is focused around leveraging IT, supply chain design and engineering, technologies largely centered on core electronics, utilizing our [removed: large-scale] [added: large scale] manufacturing infrastructure and our ability to serve a broad range of end markets.
Our DMS segment includes customers primarily in the [added: automotive and transportation,] connected devices, [removed: healthcare, mobility] [added: healthcare] and [removed: packaging] [added: packaging, and mobility] industries.
As of September 1, 2020, certain customers [removed: have been] [added: were] realigned within our operating segments.
[removed: Beginning in fiscal year 2021, customers] [added: Customers] within the automotive and transportation and smart home and appliances industries [removed: will be] [added: are now] presented within the DMS segment.
[removed: Changes] in the fair market value of such hedging instruments are reflected within the Consolidated Statement of Operations and the Consolidated Statement of Comprehensive Income.
The COVID-19 pandemic, which began to impact us in January 2020, has continued to affect our business and the businesses of our customers and [removed: suppliers into our fiscal fourth quarter.][added: suppliers.]
During the fiscal year ended August 31, 2020, we incurred approximately [removed: $141.9] [added: $142] million in direct costs associated with the COVID-19 outbreak, primarily due to incremental and idle labor costs [removed: leading to a reduction in factory utilization as a result of the travel disruptions] and [removed: governmental restrictions and] the procurement of personal protection equipment for our employees globally.
[removed: Additionally, certain of the Company’s] [added: The impact on our] suppliers [removed: were similarly impacted by the COVID-19 pandemic, leading] [added: has led] to supply chain constraints, including difficulty sourcing materials necessary to fulfill customer production requirements and challenges in transporting completed products to our end customers.
[removed: In connection with reducing our worldwide workforce, we incurred $56.6] [added: (1)As the Company continued to optimize its cost structure and improve operational efficiencies, $57] million of [added: employee] severance and benefit costs [added: was incurred in connection with a reduction in the worldwide workforce] during the fiscal year ended August 31, 2020.
[removed: In addition, we] [added: We] completed our annual impairment [removed: test] [added: analysis] for goodwill and indefinite-lived intangible assets during the fourth quarter of fiscal year [removed: 2020 and determined there was no impairment of our goodwill, intangible assets or long-lived assets.][added: 2021.]
The following table sets forth, for the periods indicated, certain key operating results and other financial information (in [removed: thousands,] [added: millions,] except per share data):
| | [added: | |] Fiscal Year Ended August 31, | | | | | | | | | | | [added: | | | |]
| | [removed: 2020] | | [added: 2021] | | [removed: 2019] | | | | [removed: 2018] [added: 2020] | | | [added: | | | 2019 | | |]
| Net revenue | [added: | |] $ | [removed: 27,266,438] [added: 29,285] | | | [added: | |] $ | [removed: 25,282,320] [added: 27,266] | | | [added: | |] $ | [removed: 22,095,416] [added: 25,282] | |
| Net income attributable to Jabil Inc. | [added: | |] $ | [removed: 53,912] [added: 696] | | | [added: | |] $ | [removed: 287,111] [added: 54] | | | [added: | |] $ | [removed: 86,330] [added: 287] | |
| Earnings per share – basic | [added: | |] $ | [removed: 0.36] [added: 4.69] | | | [added: | |] $ | [removed: 1.85] [added: 0.36] | | | [added: | |] $ | [removed: 0.50] [added: 1.85] | |
| Earnings per share – diluted | [added: | |] $ | [removed: 0.35] [added: 4.58] | | | [added: | |] $ | [removed: 1.81] [added: 0.35] | | | [added: | |] $ | [removed: 0.49] [added: 1.81] | |
| | [added: | |] Three Months Ended | | | | | | | [added: | | | | | | | | | | | | | | | | |]
| | [added: | |] August 31, [removed: 2020] [added: 2021] | | [added: | | | |] May 31, [removed: 2020] [added: 2021] | | [removed: February 29,] [added: | | | | August 31,] 2020 | | [removed: November 30, 2019] | [added: | | | | | | | | |]
| Sales cycle(1) | [removed: 16 days] | | [removed: 27] [added: 19] days | | [removed: 30] [added: | | | | 25] days | | [removed: 23] [added: | | | | 16] days | [added: | | | | | | | | | | |]
| Inventory turns (annualized)(2) | [removed: 6 turns] | | 5 turns | | [added: | | | |] 5 turns | | [added: | | | |] 6 turns | [added: | | | | | | | | | | |]
| Days in accounts receivable(3) | [removed: 35 days] | | [removed: 37] [added: 38] days | | [removed: 34] [added: | | | | 40] days | | [removed: 43] [added: | | | | 35] days | [added: | | | | | | | | | | |]
| Days in inventory(4) | [removed: 56 days] | | [removed: 67] [added: 71] days | | [removed: 70] [added: | | | | 68] days | | [removed: 57] [added: | | | | 56] days | [added: | | | | | | | | | | |]
| Days in accounts payable(5) | [removed: 75 days] | | [removed: 77] [added: 90] days | | [removed: 74] [added: | | | | 84] days | | [removed: 77] [added: | | | | 75] days | [added: | | | | | | | | | | |]
[removed: | (1) | The] [added: (1)The] sales cycle is calculated as the sum of days in accounts receivable and days in inventory, less the days in accounts payable; accordingly, the variance in the sales cycle quarter over quarter is a direct result of changes in these indicators. [removed: |]
[removed: | (2) | Inventory] [added: (2)Inventory] turns (annualized) are calculated as 360 days divided by days in inventory. [removed: |]
[removed: | (3) | Days in accounts receivable is calculated as accounts receivable, net, divided by net revenue multiplied by 90 days.] During the three months ended [removed: May] [added: August] 31, [removed: 2020 and November 30, 2019,] [added: 2021,] the increase in days in accounts receivable from the [removed: prior sequential quarter] [added: three months ended August 31, 2020] was primarily due to an increase in accounts receivable, primarily driven by higher sales and [removed: timing of collections. During] the [removed: three months ended February 29, 2020, the decrease in days in accounts receivable from the prior sequential quarter is primarily driven by lower sales and the] timing of [removed: collections in the second quarter. |][added: collections.]
[removed: | (5) | Days in accounts payable is calculated as accounts payable divided by cost of revenue multiplied by 90 days.] During the three months ended [removed: May] [added: August] 31, [removed: 2019,] [added: 2021,] the [removed: decrease] [added: increase] in days in accounts payable from the [removed: prior sequential quarter was primarily due to timing of purchases and cash payments for purchases during the quarter. During the] three months ended [removed: February 28, 2019, the decrease in days in accounts payable from the prior sequential quarter] [added: May 31, 2021 and August 31, 2020] was primarily due [removed: |][added: to an increase in materials purchases and timing of payments.]
[removed: Circumstances that may lead to impairment of property, plant and equipment include unforeseen decreases in future] performance or industry demand and the restructuring of our operations resulting from a change in our business strategy or adverse economic conditions.
We perform a goodwill impairment analysis [removed: using the two-step method] on an annual basis and whenever events or changes in circumstances indicate that the carrying value may not be recoverable.
If the carrying amount of the reporting unit exceeds its fair value, goodwill is considered impaired and a [removed: second test] [added: loss] is [removed: performed to measure] [added: recognized in] the amount [removed: of loss, if any.][added: equal to that excess.]
[removed: We completed our annual impairment test] [added: The qualitative assessment was used] for [removed: goodwill and indefinite-lived intangible assets during the fourth quarter of fiscal year 2020] [added: all reporting units] and [added: we] determined that [added: it is more likely than not that] the fair values of our reporting units and the indefinite-lived intangible assets are in excess of the carrying values and that no impairment existed as of the date of the impairment [removed: test.][added: analysis.]
"Management's Discussion and Analysis of Financial Condition and Results of Operations" section contained in our Annual Report on Form 10-K for the fiscal year ended August 31, [removed: 2019] [added: 2020] for the results of operations discussion for the fiscal year ended August 31, [removed: 2019] [added: 2020] compared to the fiscal year ended August 31, [removed: 2018.][added: 2019.]
| | [added: | |] Fiscal Year Ended August 31, | | | | | | | | | | | | [added: | | | | | |] Change | | | | | [added: | | | |]
| (dollars in millions) | [added: | | 2021 | | | | | |] 2020 | | | | [removed: 2019] | | [added: 2019] | | [removed: 2018] | | | | [removed: 2020] [added: 2021] vs. [removed: 2019] [added: 2020] | | | [removed: 2019] [added: | | | 2020] vs. [removed: 2018] [added: 2019(1)] | | [added: |]
[removed: *2020] [added: | | | | 2021 | | | | | | 2020 | | | | | | 2019 | | | | | | 2021] vs. [removed: 2019*][added: 2020 | | | | | | 2020 vs. 2019 | | |]
Specifically, the EMS segment revenues increased [removed: 8%] [added: 9%] primarily due to (i) a 10% increase in revenues from existing customers within our [added: 5G, wireless and] cloud business and (ii) a [removed: 2%] [added: 3%] increase in revenues from existing customers within our [added: industrial and] capital equipment business.
The increase is partially offset by (i) a [removed: 3%] [added: 2%] decrease from existing customers within our networking and [removed: telecommunications] [added: storage] business and (ii) a [removed: 1%] [added: 2%] decrease in revenues from existing customers within our [added: digital] print and retail business.
DMS segment revenues increased [removed: 8%] [added: 7%] due to [added: (i)] an [removed: 11%] [added: 8%] increase in revenues from new and existing customers in our healthcare [added: and packaging businesses and (ii) a 1% increase in revenues from existing customers in our automotive and transportation] business.
The increase is partially offset by a [removed: 3%] [added: 2%] decrease in revenue from customers within our [removed: edge] [added: connected] devices [removed: and accessories businesses.][added: business.]
Our EMS segment is a high volume business that produces product at a quicker rate (i.e. cycle time) and in larger quantities and includes customers primarily in the 5G, wireless and cloud, digital print and retail, industrial and semi-cap, and networking and storage industries.
Prior period disclosures are restated to reflect the realignment.
At times, we collect deposits from our customers related to the purchase of inventory in order to effectively manage our working capital.
Changes
Essential activity exceptions from these restrictions have allowed us to continue to operate but virus containment efforts have resulted in additional direct costs.
| Gross profit | | | $ | 2,359 | | | | | $ | 1,931 | | | | | $ | 1,913 | |
| Operating income | | | $ | 1,055 | | | | | $ | 500 | | | | | $ | 701 | |
| | | | | | | | | | | | | | | | | | | | | | | | | | | |
| --- | --- | --- | --- | --- | --- | --- | --- | --- | --- | --- | --- | --- | --- | --- | --- | --- | --- | --- | --- | --- | --- | --- | --- | --- | --- | --- |
| | | | | | | | | | | | | | | | | | | | | | | | | | | |
| | | | | | | | | | | | | | | | | | | | | | | | | | | |
| | | | | | | | | | | | | | | | | | | | | | | | | | | |
| | | | | | | | | | | | | | | | | | | | | | | | | | | |
| | | | | | | | | | | | | | | | | | | | | | | | | | | |
| | | | | | | | | | | | | | | | | | | | | | | | | | | |
| | | | | | | | | | | | | | | | | | | | | | | | | | | |
(3)Days in accounts receivable is calculated as accounts receivable, net, divided by net revenue multiplied by 90 days.
During the three months ended August 31, 2021, the decrease in days in accounts receivable from the prior sequential quarter was driven primarily by the timing of collections.
(4)Days in inventory is calculated as inventory and contract assets divided by cost of revenue multiplied by 90 days.
During the three months ended August 31, 2021, the increase in days in inventory from the three months ended August 31, 2020 was primarily to support expected sales levels in the first quarter of fiscal year 2022 and supply-chain constraints as a result of the COVID-19 pandemic.
During the three months ended August 31, 2021, the increase in days in inventory from the prior sequential quarter was primarily driven by supply-chain constraints as a result of the COVID-19 pandemic.
(5)Days in accounts payable is calculated as accounts payable divided by cost of revenue multiplied by 90 days.
Circumstances that may lead to impairment of property, plant and equipment include unforeseen decreases in future
| | | | | | | | | | | | | | | | | | | | | | | | | | | | | | |
| --- | --- | --- | --- | --- | --- | --- | --- | --- | --- | --- | --- | --- | --- | --- | --- | --- | --- | --- | --- | --- | --- | --- | --- | --- | --- | --- | --- | --- | --- |
| | | | | | | | | | | | | | | | | | | | | | | | | | | | | | |
| | | | | | | | | | | | | | | | | | | | | | | | | | | | | | |
| | | | | | | | | | | | | | | | | | | | | | | | | | | | | | |
| Net revenue | | | $ | 29,285 | | | | | $ | 27,266 | | | | | $ | 25,282 | | | | | 7.4 | | % | | | | 7.8 | | % |
| | | | | | | | | | | | | | | | | | | | | | | | | | | | | | |
| | | | | | | | | | | | | | | | | | | | | | | | | | | | | | |
| | | | | | | | | | | | | | | | | | | | | | | | | | | | | | |
| | | | | | | | | | | | | | | | | | | | | | | | | | | | | | |
| | | | | | | | | | | | | | | | | | | | | | | | | | | | | | |
| | | | | | | | | | | | | | | | | | | | | | | | | | | | | | |
| | | | | | | | | | | | | | | | | | | | | | | | | | | | | | |
(1)As of September 1, 2020, certain customers were realigned within our operating segments.
Our operating segments, which are the reporting segments, continue to consist of the DMS and EMS segments.
Customers within the automotive and transportation and smart home and appliances industries are now presented within the DMS segment.
Prior period disclosures are restated to reflect the realignment.
Our EMS segment includes customers primarily in the automotive and transportation, capital equipment, cloud, networking and storage, defense and aerospace, industrial and energy, print and retail, and smart home and appliances industries.
With the exception of certain jurisdictions, essential activity exceptions from these restrictions have allowed us to continue to operate.
Nevertheless, virus containment efforts during the fiscal year ended August 31, 2020, led to a disruption in operations and certain facility or intermittent business closures in areas such as China, Malaysia, India, Mexico and California, which resulted in additional direct costs and a reduction in revenue in certain end markets.
Our first priority has been the health and safety of our employees and so we have incurred additional costs in order to procure the necessary equipment, including face masks, thermometers, hand sanitizers and personal protection equipment, to keep our employees safe.
We have implemented risk-mitigation activities including travel restrictions, social distancing practices, additional cleaning procedures within our facilities, contact tracing, COVID-19 testing, restricting the number of visitors to our sites and requiring employees and visitors to have their temperatures taken and wear masks when they are at our sites.
This increase in costs was partially offset by governmental subsidies, such as lower payroll taxes or social insurance in certain countries, related to COVID-19 incentives.
We have implemented efforts across the organization to enhance our financial position, increase liquidity and reduce costs.
During the fiscal year ended August 31, 2020, we added incremental short-term committed revolving credit agreements of $625.0 million.
We also issued $600.0 million of 10-year Senior Notes in July 2020, which was used to: (i) pay $400.0 million of Senior Notes due in December 2020 and (ii) increase our cash on hand.
In addition, we have taken aggressive steps to reduce expenses, including suspending base salary increases for Fiscal Year 2021.
Our Chief Executive Officer, Chief Financial Officer and other executive vice presidents will reduce their base salaries by 25% from June 1, 2020 through November 30, 2020 and will forego any bonus that would otherwise be due to them under Jabil’s Fiscal Year 2020 short-term incentive program.
Members of Jabil’s Board of Directors will also reduce by 25% their annual cash retainers that would otherwise be payable during the period from June 1, 2020 through November 30, 2020.
In order to further decrease operating expenses and better align with the needs of the business, we have reduced our worldwide workforce and implemented voluntary early retirement programs.
Following this reduction in headcount, we expect annual savings beginning in Fiscal Year 2021 of approximately $40.0 million to $50.0 million.
We continue to focus on prioritizing spending related to future business.
We do not expect any material impairments or adjustments to the fair value of our assets as a result of the COVID-19 pandemic.
Our performance is subject to global economic conditions, as well as their impacts on levels of consumer spending and the production of goods.
These current conditions are significantly impacted by COVID-19, have had a negative impact on our results of operations during the fiscal year ended August 31, 2020 and will continue to have a negative impact on our operations over the next fiscal year and likely beyond.
| | | | | | | | | | | | |
| --- | --- | --- | --- | --- | --- | --- | --- | --- | --- | --- | --- |
| Gross profit | $ | 1,930,813 | | | $ | 1,913,401 | | | $ | 1,706,792 | |
| Operating income | $ | 499,846 | | | $ | 701,356 | | | $ | 542,153 | |
| | | | | | | | |
| --- | --- | --- | --- | --- | --- | --- | --- |
| | August 31, 2019 | | May 31, 2019 | | February 28, 2019 | | November 30, 2018 |
| Sales cycle(1) | 19 days | | 27 days | | 25 days | | 16 days |
| Inventory turns (annualized)(2) | 6 turns | | 6 turns | | 6 turns | | 6 turns |
| Days in accounts receivable(3) | 38 days | | 39 days | | 38 days | | 38 days |
| Days in inventory(4) | 58 days | | 64 days | | 65 days | | 60 days |
| Days in accounts payable(5) | 77 days | | 76 days | | 78 days | | 82 days |
| | |
| --- | --- |
| (4) | Days in inventory is calculated as inventory and contract assets divided by cost of revenue multiplied by 90 days. During the three months ended August 31, 2020, May 31, 2020 and August 31, 2019, the decrease in days in inventory from the prior sequential quarter was primarily due to increased sales activity during the quarter. During the three months ended February 29, 2020, the increase in days in inventory from the prior sequential quarter is primarily driven by idle capacity and supply chain constraints, largely in China due to COVID-19. During the three months ended February 28, 2019, days in inventory increased from the prior sequential quarter to support anticipated ramps and expected sales levels in the second half of fiscal year 2019 and due to the acquisition of certain assets of Johnson & Johnson Medical Devices Companies (“JJMD”) facilities at the end of February. |
to lower materials purchases during the quarter and timing of purchases and cash payments for purchases during the quarter.
*Allowance for Doubtful Accounts*
We maintain an allowance for doubtful accounts related to receivables not expected to be collected from our customers.
This allowance is based on management’s assessment of specific customer balances after considering the age of receivables and financial stability of the customer.
If there is an adverse change in the financial condition and circumstances of our customers, or if actual defaults are higher than provided for, an addition to the allowance may be necessary.
We determine the fair value of our reporting units based on an average weighting of both projected discounted future results and the use of comparative market multiples.
We determine the fair value of our indefinite-lived intangible assets principally based on a variation of the income approach, known as the relief from royalty method.
An excerpt. Shown here: 40 of 186 rewritten, 40 of 298 added and 40 of 169 removed. The counts are complete. For every sentence, read Item 7. Management’s Discussion and Analysis of Financial Condition and Results of Operations in the FY2021 filing and the FY2020 filing.
Item 7A. Quantitative and Qualitative Disclosures About Market Risk
7 rewritten, 1 added, 2 removed, 16 unchanged
The forward contracts (both those that are designated and not designated as accounting hedging instruments) will generally expire in less than three months, with [removed: 12] [added: 11] months being the maximum term of the contracts outstanding as of August 31, [removed: 2020.][added: 2021.]
The change in fair value related to contracts not designated as [added: accounting hedging instruments will be reflected in cost of revenue within our Consolidated Statements of Operations.]
The forward contracts are primarily denominated in Chinese yuan renminbi, Euros, [added: Indian Rupee,] Malaysian [removed: ringgit, Mexican pesos] [added: ringgit] and [removed: Swiss francs.][added: Mexican pesos.]
Based on our overall currency rate exposures as of August 31, [removed: 2020,] [added: 2021,] including the derivative financial instruments intended to hedge the nonfunctional currency-denominated monetary assets and liabilities, an immediate 10% hypothetical change of foreign currency exchange rates would not have a material effect on our Consolidated Financial Statements.
There were [removed: $349.5 million in] [added: no] borrowings outstanding under debt facilities with variable interest rates as of August 31, [removed: 2020.][added: 2021.]
Primarily due to the current low interest rates, the impact of a hypothetical change of [removed: 10.0%] [added: 10%] in variable interest rates would not have a material effect on our Consolidated Financial Statements.
We have interest rate swap agreements with a notional value of [removed: $200.0] [added: $50] million, with [added: a] mandatory termination [removed: dates from August 15, 2020 to] [added: date of] February 15, 2022 (the “2020 Extended Interest Rate Swaps”).
In connection with our anticipated debt issuance, we have interest rate swaps with aggregate notional amounts of $250 million and $150 million, which expire on July 31, 2024.
accounting hedging instruments will be reflected in cost of revenue within our Consolidated Statements of Operations.
We are monitoring developments related to LIBOR; see “Risk Factors” for additional information.
Item 1. Business
59 rewritten, 112 added, 26 removed, 119 unchanged
We conduct our operations in facilities that are located worldwide, including but not limited to, China, [added: Hungary,] Malaysia, Mexico, Singapore, [added: and] the United [removed: States and Vietnam.][added: States.]
Our EMS segment is focused around leveraging IT, supply chain design and engineering, technologies largely centered on core electronics, utilizing our [removed: large-scale] [added: large scale] manufacturing infrastructure and our ability to serve a broad range of end markets.
Our DMS segment is focused on providing engineering solutions, with an emphasis on material sciences, [removed: technologies] [added: machining, tooling,] and [removed: healthcare.][added: molding of highly engineered plastic and metal parts.]
Our DMS [removed: segment] includes customers primarily in the [added: automotive and transportation,] connected devices, [removed: healthcare, mobility] [added: healthcare] and [removed: packaging] [added: packaging, and mobility] industries.
As of September 1, 2020, certain customers [removed: have been] [added: were] realigned within our operating segments.
[removed: Beginning in fiscal year 2021, customers] [added: Customers] within the automotive and transportation and smart home and appliances industries [removed: will be] [added: are now] presented within the DMS segment.
[removed: | • | Accelerated] [added: - Accelerated] Product Time-to-Market and Time-to-Volume. Manufacturing service providers are often able to deliver accelerated production start-ups and achieve high efficiencies in bringing new products to production. [removed: Providers are also able to more rapidly scale production for changing markets and to position themselves in global locations that serve the leading world markets. With increasingly shorter product life cycles, these key services allow new products to be sold in the marketplace in an accelerated time frame. |]
[removed: | • | Access] [added: - Access] to Advanced Design and Manufacturing Technologies. By utilizing manufacturing service providers, customers gain access to additional advanced technologies in manufacturing processes, as well as to product and production design, which can offer customers significant improvements in the performance, quality, cost, time-to-market and manufacturability of their products. [removed: |]
[removed: | • | Improved] [added: - Improved] Inventory Management and Purchasing Power. Manufacturing service providers are often able to more efficiently manage both procurement and inventory, and have demonstrated proficiency in purchasing components at improved pricing due to the scale of their operations and continuous interaction with the materials marketplace. [removed: |]
[removed: | • | Establish and Maintain Long-Term Customer Relationships. An important element of our strategy is to establish and maintain long-term relationships with leading companies in expanding industries with size and growth characteristics that can benefit from highly automated, continuous flow manufacturing on a global scale. We focus on maintaining long-term relationships with our customers and seek to expand these relationships to include additional product lines and services.] In addition, we focus on identifying and developing relationships with new customers that meet our targeted profile, which includes financial stability, the need for technology-driven turnkey manufacturing, anticipated unit volume and long-term relationship stability. [removed: |]
[removed: | • | Product] [added: - Product] Diversification. We focus on balancing our portfolio of products and product families to those that align with higher return areas of our business, including manufacturing, supply chain management services, comprehensive electronics design, production and product management [removed: services. We have made concentrated efforts to diversify our industry sectors] [added: services, 5G wireless, cloud, healthcare, automotive] and [removed: customer base. Because of these efforts, we have experienced business growth from both existing] [added: transportation,] and [removed: new customers as well as from acquisitions. |][added: capital equipment.]
[removed: | • | Utilize] [added: - Utilize] Customer-Centric Business Units. Most of our business units are dedicated to serve one customer each and operate by primarily utilizing dedicated production equipment, production workers, supervisors, buyers, planners and engineers to provide comprehensive manufacturing solutions that are customized to each customer’s needs. [removed: We believe our customer-centric business units promote increased responsiveness to our customers’ needs, particularly for customer relationships that extend across multiple production locations. |]
[removed: | • | Leverage] [added: - Leverage] Global Production. We believe that global production is a key strategy to reduce obsolescence risk and secure the lowest possible landed costs while simultaneously supplying products of equivalent or comparable quality throughout the world. [removed: Consistent with this strategy, we have established or acquired operations in the Americas, Europe, Asia and Africa. Our extensive global footprint positions us well to implement safe and practical solutions in order to select production locations which best serve the needs of our customers. |]
[removed: | • | Offer] [added: - Offer] Systems Assembly, Direct-Order Fulfillment and Configure-to-Order Services. Our systems assembly, direct-order fulfillment and configure-to-order services allow our customers to reduce product cost and risk of product obsolescence by reducing total work-in-process and finished goods inventory. [removed: These services are available at all of our manufacturing locations. |]
[removed: | • | Offer] [added: - Offer] Design Services. We offer a wide spectrum of value-add design services to achieve improvements in performance, cost, time-to-market and manufacturability. [removed: |]
[added: - Pursue Acquisition Opportunities Selectively. The primary goals of] our acquisition strategy are to complement our current capabilities, diversify our business into new industry sectors and with new customers and expand the scope of the services we can offer to our customers.
[removed: | • | Computerized Control and Monitoring. We support all aspects of our manufacturing activities with advanced computerized control and monitoring systems. Component inspection and vendor quality are monitored electronically in real-time.] Materials planning, purchasing, stockroom and shop floor control systems are supported through a computerized manufacturing resource planning system, which provides customers with the ability to continuously monitor material availability and track work-in-process on a real-time basis. [removed: In addition, manufacturing processes are supported by a computerized statistical process control system, whereby customers can remotely access our computer systems to monitor real-time yields, inventory positions, work-in-process status and vendor quality data. |]
[removed: | • | Electronic Supply Chain Management. We make available to our customers and suppliers an electronic commerce system/electronic data interchange and web-based tools to implement a variety of supply chain management programs.] Our customers use these tools to share demand and product forecasts and deliver purchase orders, and we use these tools with our suppliers for just-in-time delivery, supplier-managed inventory and consigned supplier-managed inventory. [removed: |]
[removed: | • | Electronic Design. Our Electronic Design team provides electronic circuit design services, including application-specific integrated circuit design, firmware development and rapid prototyping services.] These services have been used by our customers for a variety of products including smart phones and accessory products, notebook and personal computers, [added: connected consumer products and appliances,] servers, radio frequency products, [removed: video set-top boxes,] optical communications products, communication and broadband products, and automotive and [removed: consumer appliance controls. |][added: healthcare components and devices.]
[removed: | • | Industrial] [added: - Industrial] Design. Our Industrial Design team designs the “look and feel” of the plastic and metal enclosures that house the products’ electro-mechanics, including the printed circuit board assemblies (“PCBA”). [removed: |]
[removed: | • | Mechanical] [added: - Mechanical] Design. Our Mechanical Design team specializes in three-dimensional mechanical design with the analysis of electronic, electro-mechanical and optical assemblies using state of the art modeling and analytical tools. [removed: This team has extended Jabil’s product design offering capabilities to include all aspects of industrial design, advance mechanism development and tooling management. |]
[removed: | • | Computer-Assisted] [added: - Computer-Assisted] Design. Our Computer-Assisted Design (“CAD”) team provides PCBA design services using advanced CAD engineering tools, PCBA design validation and verification services, and other consulting services, which include generating a bill of materials, approved vendor list and assembly equipment configuration for a particular PCBA design. [removed: We believe that our CAD services result in PCBA designs that are optimized for manufacturability and cost efficiencies and accelerate a product’s time-to-market and time-to-volume production. |]
[removed: | • | Product Validation. Our Product Validation team provides complete product and process validation.] This includes product system tests, product safety, regulatory compliance and reliability tests. [removed: |]
[removed: | • | Manufacturing] [added: - Manufacturing] Test Solution Development. Our Manufacturing Test Solution Development team provides integral support to the design teams to embed design with testability and to promote efficient capital and resource investment in the manufacturing process. [removed: The use of software driven instrumentation and test process design and management has enhanced our product quality and reduced our operating costs relative to human dependent test processes. The full electronic test data-log of customer products has allowed customer product test traceability and visibility throughout the manufacturing test process. |]
[removed: | • |] [added: -] Automation, including automated tooling [removed: |]
[removed: | • |] [added: -] Electronic interconnection [removed: |]
[removed: | • |] [added: -] Advanced polymer and metal material science [removed: |]
[removed: | • |] [added: -] Single/multi-shot injection molding, stamping and in-mold labeling [removed: |]
[removed: | • |] [added: -] Multi-axis computer numerical control [removed: |]
[removed: | • |] [added: -] Vacuum metallization [removed: |]
[removed: | • |] [added: -] Physical vapor deposition [removed: |]
[removed: | • |] [added: -] Digital printing [removed: |]
[removed: | • |] [added: -] Anodization [removed: |]
[removed: | • |] [added: -] Thermal-plastic composite formation [removed: |]
[removed: | • |] [added: -] Plastic with embedded electronics [removed: |]
[removed: | • |] [added: -] Metal and plastic covers with insert-molded or dies-casting features for assembly [removed: |]
[removed: | • |] [added: -] Display cover with integrated touch sensor [removed: |]
[removed: | • |] [added: -] Material processing research (including plastics, metal, glass and ceramic) [removed: |]
[removed: | • |] [added: -] Additive manufacturing [removed: |]
In fiscal year [removed: 2020,] [added: 2021,] our five largest customers accounted for approximately 47% of our net revenue and [removed: 73] [added: 82] customers accounted for approximately 90% of our net revenue.
For the fiscal year ended August 31, 2021, we had net revenues of $29.3 billion and net income attributable to Jabil Inc. of $696 million.
Our EMS segment is a high volume business that produces product at a quicker rate (i.e. cycle time) and in larger quantities and includes customers primarily in the 5G, wireless and cloud, digital print and retail, industrial and semi-cap, and networking and storage industries.
Prior period disclosures are restated to reflect the realignment.
In recent years, the industry has expanded to include customers that require products and services beyond electronic components including plastics and metal components, packaging, and injection molding.
- Efficient Manufacturing. Manufacturing service providers are often able to manufacture products at a reduced total cost to companies.
These cost advantages result from higher utilization of capacity and efficiencies of scale because of diversified product demand and, generally, a greater focus on the components of manufacturing cost.
Companies are increasingly seeking to reduce their investment in inventory, facilities and equipment used in manufacturing and prioritizing capital investments in other activities such as sales and marketing and research and development (“R&D”).
This strategic shift in capital deployment has contributed to increased demand for and interest in outsourcing to external manufacturing service providers.
Providers are also able to more rapidly scale production for changing markets and to position themselves in global locations that
serve the leading world markets.
With increasingly shorter product life cycles, these key services allow new products to be sold in the marketplace in an accelerated time frame.
- Establish and Maintain Long-Term Customer Relationships. An important element of our strategy is to establish and maintain long-term relationships with leading companies in expanding industries with size and growth characteristics that can benefit from highly automated, continuous flow manufacturing on a global scale.
We focus on maintaining long-term relationships with our customers and seek to expand these relationships to include additional product lines and services.
We have made concentrated efforts to diversify our industry sectors and customer base.
Because of these efforts, we have experienced business growth from both existing and new customers as well as from acquisitions.
We believe our customer-centric business units promote increased responsiveness to our customers’ needs, particularly for customer relationships that extend across multiple production locations.
Consistent with this strategy, we have established or acquired operations in the Americas, Europe, Asia and Africa.
Our extensive global footprint positions us well to implement safe and practical solutions in order to select production locations which best serve the needs of our customers.
We believe that our global footprint is strengthened by our centralized procurement process, which when coupled with our single Enterprise Resource Planning system affords our customers with end-to-end supply chain visibility.
These services are available at all of our manufacturing locations.
- Decentralized Business Unit Model. Most of our business units are dedicated to serve one customer each and are empowered to formulate strategies tailored to individual customer’s needs.
Our business units generally have dedicated production lines consisting of equipment, production workers, supervisors, buyers, planners and engineers.
Under certain circumstances, a production line may serve more than one business unit to maximize resource utilization.
Business units have direct responsibility for manufacturing results and time-to-volume production, thereby promoting a sense of individual commitment and ownership.
The business unit approach is modular and enables us to grow incrementally without disrupting the operations of other business units.
Business unit management reviews the customer financial information to assess whether the business units are meeting their designated responsibilities and to ensure that the daily execution of manufacturing activities is being effectively managed.
The business units aggregate into operating segments based on the economic profiles of the services performed, including manufacturing capabilities, market share strategy, margins, return on capital and risk profiles.
- Automated Continuous Flow. We use a highly automated, continuous flow approach to manufacturing, whereby different pieces of equipment are joined directly or by conveyor to create an in-line assembly process.
This process contrasts with a batch approach, whereby individual pieces of assembly equipment are operated as freestanding work-centers.
The elimination of waiting time prior to sequential operations results in faster manufacturing, which improves production efficiencies and quality control, and reduces inventory work-in-process.
We believe continuous flow manufacturing provides cost reductions and quality improvement when applied to high volumes of product.
- Computerized Control and Monitoring. We support all aspects of our manufacturing activities with advanced computerized control and monitoring systems.
Component inspection and vendor quality are monitored electronically in real-time.
In addition, manufacturing processes are supported by a computerized statistical process control system, whereby customers can remotely access our computer systems to monitor real-time yields, inventory positions, work-in-process status and vendor quality data.
- Electronic Supply Chain Management. We make available to our customers and suppliers an electronic commerce system/electronic data interchange and web-based tools to implement a variety of supply chain management programs.
- Electronic Design. Our Electronic Design team provides electronic circuit design services, including application-specific integrated circuit design, firmware development and rapid prototyping services.
This team has extended Jabil’s product design offering capabilities to include all aspects of industrial design, advance mechanism development and tooling management.
We believe that our CAD services result in PCBA designs that are optimized for manufacturability and cost efficiencies and accelerate a product’s time-to-market and time-to-volume production.
- Product Validation. Our Product Validation team provides complete product and process validation.
The use of software driven instrumentation and test process design and management has enhanced our product quality and reduced our operating costs relative to human dependent test processes.
We depend, and expect to continue to depend, upon a relatively small number of customers for a significant percentage of our net revenue, which in turn depends upon their growth, viability and financial stability.
Based on net revenue, for the fiscal year ended August 31, 2020, our largest customers include Amazon.com, Inc., Apple, Inc., Cisco Systems, Inc., Hewlett-Packard Company, Ingenico Group, Johnson and Johnson, LM Ericsson Telephone Company, NetApp, Inc., SolarEdge Technologies Inc., and Tesla, Inc. For the fiscal year ended August 31, 2020, we had net revenues of $27.3 billion and net income attributable to Jabil Inc. of $53.9 million.
Our EMS segment includes customers primarily in the automotive and transportation, capital equipment, cloud, networking and storage, defense and aerospace, industrial and energy, print and retail, and smart home and appliances industries.
| | |
| --- | --- |
| • | Efficient Manufacturing. Manufacturing service providers are often able to manufacture products at a reduced total cost to companies. These cost advantages result from higher utilization of capacity and efficiencies of scale because of diversified product demand and, generally, a greater focus on the components of manufacturing cost. Companies are increasingly seeking to reduce their investment in inventory, facilities and equipment used in manufacturing and prioritizing capital investments in other activities such as sales and marketing and research and development (“R&D”). This strategic shift in capital deployment has contributed to increased demand for and interest in outsourcing to external manufacturing service providers. |
| • | Pursue Acquisition Opportunities Selectively. Traditionally, electronics manufacturing service companies have acquired manufacturing capacity from their customers to drive growth, expand their footprint and gain new customers. In recent years, our acquisition strategy has expanded to include opportunities to acquire competitors who are focused on our key growth areas, which include specialized manufacturing in key markets, materials technology and design operations, as well as other acquisition opportunities complementary to our services offerings. The primary goals of |
| • | Decentralized Business Unit Model. Most of our business units are dedicated to serve one customer each and are empowered to formulate strategies tailored to individual customer’s needs. Our business units generally have dedicated production lines consisting of equipment, production workers, supervisors, buyers, planners and engineers. Under certain circumstances, a production line may serve more than one business unit to maximize resource utilization. Business units have direct responsibility for manufacturing results and time-to-volume production, thereby promoting a sense of individual commitment and ownership. The business unit approach is modular and enables us to grow incrementally without disrupting the operations of other business units. Business unit management reviews the customer financial information to assess whether the business units are meeting their designated responsibilities and to ensure that the daily execution of manufacturing activities is being effectively managed. The business units aggregate into operating segments based on the economic profiles of the services performed, including manufacturing capabilities, market share strategy, margins, return on capital and risk profiles. |
| • | Automated Continuous Flow. We use a highly automated, continuous flow approach to manufacturing, whereby different pieces of equipment are joined directly or by conveyor to create an in-line assembly process. This process contrasts with a batch approach, whereby individual pieces of assembly equipment are operated as freestanding work-centers. The elimination of waiting time prior to sequential operations results in faster manufacturing, which improves production efficiencies and quality control, and reduces inventory work-in-process. We believe continuous flow manufacturing provides cost reductions and quality improvement when applied to high volumes of product. |
| | | | | | | | | |
| Amazon.com | 11 | % | | * | | | * | |
* Amount was less than 10% of total.
Backlog
Our order backlog as of August 31, 2020 and 2019 was valued at approximately $7.4 billion and $6.2 billion, respectively.
Our order backlog is expected to be filled within the current fiscal year.
Although our backlog consists of firm purchase orders, the level of backlog at any particular time may not be necessarily indicative of future sales.
Given the nature of our relationships with our customers, and the fact that we generally do not enter into long-term purchase commitments with our customers, we frequently allow our customers to cancel or reschedule deliveries, and therefore, backlog is often not a meaningful indicator of future financial results.
Employees
As of August 31, 2020, we employed approximately 240,000 people worldwide.
Except as otherwise noted below, each executive officer is a full-time employee of Jabil.
Sergio A.
Cadavid (age 64) was named Senior Vice President, Treasurer in September 2013.
Mr. Cadavid joined Jabil in 2006 as Treasurer.
Prior to joining Jabil, Mr. Cadavid was Corporate Assistant Treasurer for Owens-Illinois, Inc. in Toledo, Ohio.
He has also held various positions with The Quaker Oats Company, Arthur Andersen & Co. and J.M. Family Enterprises, Inc. He holds an M.B.A. from the University of Florida and a B.B.A. from Florida International University.
certain strategic investments.
An excerpt. Shown here: 40 of 59 rewritten, 40 of 112 added and all 26 removed. The counts are complete. For every sentence, read Item 1. Business in the FY2021 filing and the FY2020 filing.
Item 3. Legal Proceedings
0 rewritten, 1 added, 2 removed, 0 unchanged
See the discussion in Note 18 - “Commitments and Contingencies” to the Consolidated Financial Statements.
We are party to certain lawsuits in the ordinary course of business.
We do not believe that these proceedings, individually or in the aggregate, will have a material adverse effect on our financial position, results of operations or cash flows.
Cover and table of contents
43 rewritten, 17 added, 9 removed, 43 unchanged
[removed: FORM 10-K][added: FORM 10-K]
| ☒ | [added: | |] ANNUAL REPORT PURSUANT TO SECTION 13 OR 15(d) OF THE SECURITIES EXCHANGE ACT OF 1934 | [added: | |]
For the fiscal year [removed: ended August] [added: ended August] 31, [removed: 2020][added: 2021]
| ☐ | [added: | |] TRANSITION REPORT PURSUANT TO SECTION 13 OR 15(d) OF THE SECURITIES EXCHANGE ACT OF 1934 | [added: | |]
Commission file [removed: number 001-14063][added: number 001-14063]
[removed: ][added: ]
| Delaware | | [added: | | | |] 38-1886260 | [added: | |]
| (State or other jurisdiction [removed: of incorporation] [added: of incorporation] or organization) | | [added: | | | |] (I.R.S. [removed: Employer Identification] [added: Employer Identification] No.) | [added: | |]
10560 Dr. Martin Luther King, Jr. Street [removed: North, St. Petersburg, Florida 33716][added: North, St. Petersburg, Florida 33716]
[removed: (727) 577-9749][added: (727) 577-9749]
| Title of each class | [added: | |] Trading Symbol(s) | [added: | |] Name of each exchange on which registered | [added: | |]
| Common Stock, $0.001 par value per share | [added: | |] JBL | [added: | |] New York Stock Exchange | [added: | |]
| Large accelerated filer | [added: | |] ☒ | | [added: | | | |] Accelerated filer | [added: | |] ☐ | [added: | |]
| Non-accelerated filer | [added: | |] ☐ | | [added: | | | |] Smaller reporting company | [added: | |] ☐ | [added: | |]
| | | | [added: | | | | | |] Emerging growth company | [added: | |] ☐ | [added: | |]
The aggregate market value of the voting common stock held by non-affiliates of the registrant based on the closing sale price of the Common Stock as reported on the New York Stock Exchange on February [removed: 29, 2020] [added: 28, 2021] was approximately [removed: $4.7] [added: $5.3] billion.
The number of outstanding shares of the registrant’s Common Stock as of the close of business on October 14, [removed: 2020,] [added: 2021,] was [removed: 149,550,360.][added: 143,334,977.]
We have incorporated by reference portions of our Proxy Statement for our annual meeting of shareholders expected to be held on January [removed: 21, 2021] [added: 20, 2022] into Part III hereof, to the extent indicated herein.
[removed: 2020 FORM] [added: 2021 FORM] 10-K ANNUAL REPORT
| Part I. | | | [added: | | | | | |]
| Item 1. | [removed: [Business](#s883525FE79E658B492EDEEE928611694)] | [removed: [2](#s883525FE79E658B492EDEEE928611694)] | [added: [Business](#id077949108c34c15b89a23b1817f8147_16) | | | [2](#id077949108c34c15b89a23b1817f8147_16) | | |]
| Item 1A. | [added: | |] [Risk [removed: Factors](#s69812B3A806E5D70B709C4AEE2CD138C)] [added: Factors](#id077949108c34c15b89a23b1817f8147_22)] | [removed: [9](#s69812B3A806E5D70B709C4AEE2CD138C)] | [added: | [11](#id077949108c34c15b89a23b1817f8147_22) | | |]
| Item 1B. | [added: | |] [Unresolved Staff [removed: Comments](#s923DC208268755F69161A8ADACE8DD2E)] [added: Comments](#id077949108c34c15b89a23b1817f8147_25)] | [removed: [23](#s923DC208268755F69161A8ADACE8DD2E)] | [added: | [25](#id077949108c34c15b89a23b1817f8147_25) | | |]
| Item 2. | [removed: [Properties](#sC83548D13A305EB7859C21D2F0EC0286)] | [removed: [23](#sC83548D13A305EB7859C21D2F0EC0286)] | [added: [Properties](#id077949108c34c15b89a23b1817f8147_28) | | | [25](#id077949108c34c15b89a23b1817f8147_28) | | |]
| Item 3. | [added: | |] [Legal [removed: Proceedings](#s0DD0423D78D650F0A9B740560467788A)] [added: Proceedings](#id077949108c34c15b89a23b1817f8147_31)] | [removed: [23](#s0DD0423D78D650F0A9B740560467788A)] | [added: | [25](#id077949108c34c15b89a23b1817f8147_31) | | |]
| Item 4. | [added: | |] [Mine Safety [removed: Disclosures](#s35D9B826E2D15CF499CB91CE41E4E5AB)] [added: Disclosures](#id077949108c34c15b89a23b1817f8147_34)] | [removed: [23](#s35D9B826E2D15CF499CB91CE41E4E5AB)] | [added: | [25](#id077949108c34c15b89a23b1817f8147_34) | | |]
| Part II. | | | [added: | | | | | |]
| Item 5. | [added: | |] [Market for Registrant’s Common Equity, Related Stockholder Matters and Issuer Purchases of Equity [removed: Securities](#s7125B6E1A8635C53B9F30008BCE123A2)] [added: Securities](#id077949108c34c15b89a23b1817f8147_40)] | [removed: [24](#s7125B6E1A8635C53B9F30008BCE123A2)] | [added: | [26](#id077949108c34c15b89a23b1817f8147_40) | | |]
| Item 7. | [added: | |] [Management’s Discussion and Analysis of Financial Condition and Results of [removed: Operations](#sF31CCCAE92995C3FA69E86FD094F0E5E)] [added: Operations](#id077949108c34c15b89a23b1817f8147_46)] | [removed: [27](#sF31CCCAE92995C3FA69E86FD094F0E5E)] | [added: | [28](#id077949108c34c15b89a23b1817f8147_46) | | |]
| Item 7A. | [added: | |] [Quantitative and Qualitative Disclosures About Market [removed: Risk](#s09FC3B52B31A5863A291C44F16537184)] [added: Risk](#id077949108c34c15b89a23b1817f8147_85)] | [removed: [44](#s09FC3B52B31A5863A291C44F16537184)] | [added: | [42](#id077949108c34c15b89a23b1817f8147_85) | | |]
| Item 8. | [added: | |] [Financial Statements and Supplementary [removed: Data](#s48C4AD95FB21515A904F53F2A2554CF2)] [added: Data](#id077949108c34c15b89a23b1817f8147_88)] | [removed: [45](#s48C4AD95FB21515A904F53F2A2554CF2)] | [added: | [43](#id077949108c34c15b89a23b1817f8147_88) | | |]
| Item 9. | [added: | |] [Changes in and Disagreements With Accountants on Accounting and Financial [removed: Disclosure](#sD54AF7EB018057829DFCFF86B17842A3)] [added: Disclosure](#id077949108c34c15b89a23b1817f8147_91)] | [removed: [45](#sD54AF7EB018057829DFCFF86B17842A3)] | [added: | [43](#id077949108c34c15b89a23b1817f8147_91) | | |]
| Item 9A. | [added: | |] [Controls and [removed: Procedures](#s02CD06D315AC5926A998FAF427CB1860)] [added: Procedures](#id077949108c34c15b89a23b1817f8147_94)] | [removed: [46](#s02CD06D315AC5926A998FAF427CB1860)] | [added: | [43](#id077949108c34c15b89a23b1817f8147_94) | | |]
| Item 9B. | [added: | |] [Other [removed: Information](#s183B7013F62A594C868494EA7A9ED81D)] [added: Information](#id077949108c34c15b89a23b1817f8147_97)] | [removed: [46](#s183B7013F62A594C868494EA7A9ED81D)] | [added: | [44](#id077949108c34c15b89a23b1817f8147_97) | | |]
| Part III. | | | [added: | | | | | |]
| Item 10. | [added: | |] [Directors, Executive Officers and Corporate [removed: Governance](#sE987BD1208025FAA8D7EB0118232017F)] [added: Governance](#id077949108c34c15b89a23b1817f8147_103)] | [removed: [48](#sE987BD1208025FAA8D7EB0118232017F)] | [added: | [45](#id077949108c34c15b89a23b1817f8147_103) | | |]
| Item 11. | [added: | |] [Executive [removed: Compensation](#s56CF7ABED9B45DC489707B1080BE5607)] [added: Compensation](#id077949108c34c15b89a23b1817f8147_106)] | [removed: [48](#s56CF7ABED9B45DC489707B1080BE5607)] | [added: | [45](#id077949108c34c15b89a23b1817f8147_106) | | |]
| Item 12. | [added: | |] [Security Ownership of Certain Beneficial Owners and Management and Related Stockholder [removed: Matters](#s1A227480AC5C5B7D827A98715DD14372)] [added: Matters](#id077949108c34c15b89a23b1817f8147_109)] | [removed: [48](#s1A227480AC5C5B7D827A98715DD14372)] | [added: | [45](#id077949108c34c15b89a23b1817f8147_109) | | |]
| Item 13. | [added: | |] [Certain Relationships and Related Transactions, and Director [removed: Independence](#s051592C1019D5C04931103BB5BE6055B)] [added: Independence](#id077949108c34c15b89a23b1817f8147_112)] | [removed: [48](#s051592C1019D5C04931103BB5BE6055B)] | [added: | [45](#id077949108c34c15b89a23b1817f8147_112) | | |]
| Item 14. | [added: | |] [Principal Accounting Fees and [removed: Services](#s676FA0410DB6571D8099C399A7864696)] [added: Services](#id077949108c34c15b89a23b1817f8147_115)] | [removed: [48](#s676FA0410DB6571D8099C399A7864696)] | [added: | [45](#id077949108c34c15b89a23b1817f8147_115) | | |]
| | | | | | |
| --- | --- | --- | --- | --- | --- |
| | | | | | |
| --- | --- | --- | --- | --- | --- |
JABIL INC.
| | | | | | | | | |
| --- | --- | --- | --- | --- | --- | --- | --- | --- |
| | | | | | | | | |
| --- | --- | --- | --- | --- | --- | --- | --- | --- |
| | | | | | | | | | | | | | | |
| --- | --- | --- | --- | --- | --- | --- | --- | --- | --- | --- | --- | --- | --- | --- |
| | | | | | | | | | | | | | | |
| | | | | | | | | | | | | | | |
| | | | | | | | | |
| --- | --- | --- | --- | --- | --- | --- | --- | --- |
| Item 6. | | | [\[Reserved\]](#id077949108c34c15b89a23b1817f8147_43) | | | [27](#id077949108c34c15b89a23b1817f8147_43) | | |
| [Signatures](#id077949108c34c15b89a23b1817f8147_256) | | | | | | [89](#id077949108c34c15b89a23b1817f8147_256) | | |
| | |
| --- | --- |
JABIL INC.
| | | |
| --- | --- | --- |
| | | | | |
| --- | --- | --- | --- | --- |
| Item 6. | [Selected Financial Data](#sE813B34618D55A87BE115630A998E077) | [26](#sE813B34618D55A87BE115630A998E077) |
| [Signatures](#sB432561E64B15AF1831526ACC33776AD) | | [95](#sB432561E64B15AF1831526ACC33776AD) |
An excerpt. Shown here: 40 of 43 rewritten, all 17 added and all 9 removed. The counts are complete. For every sentence, read Cover and table of contents in the FY2021 filing and the FY2020 filing.
Item 2. Properties
8 rewritten, 30 added, 4 removed, 5 unchanged
The table below lists the approximate square footage for our facilities as of August 31, [removed: 2020] [added: 2021] (in [removed: thousands):][added: millions):]
| Location | [removed: Approximate Square] [added: | | Approximate Square] Footage | | [added: | | | | | | |]
| Asia | [removed: 33,161] | | [added: 34 | | | | | | | | |]
| Americas | [removed: 15,645] | | [added: 16 | | | | | | | | |]
| Europe | [removed: 5,052] | | [added: 5 | | | | | | | | |]
| Total as of August 31, [removed: 2020] [added: 2021] (1)(2) | [removed: 53,858] | | [added: 55 | | | | | | | | |]
[removed: | (1) | Approximately 14%] [added: (1)Approximately 12%] of our total square footage is not currently used in business operations. [removed: |]
[removed: | (2) | Consists] [added: (2)Consists] of [removed: 18.2] [added: 19] million square feet in facilities that we own with the remaining [removed: 35.7] [added: 36] million square feet in leased facilities. [removed: |]
| | | | | | | | | | | | |
| --- | --- | --- | --- | --- | --- | --- | --- | --- | --- | --- | --- |
| | | | | | | | | | | | |
| | | | | | | | | | | | |
| | | | | | | | | | | | |
| | | | | | | | | | | | |
| | | | | | | | | | | | |
| | | | | | | | | | | | |
| | | | | | | | | | | | |
| | | | | | | | | | | | |
| | | | | | | | | | | | |
| | | | | | | | | | | | |
| | | | | | | | | | | | |
| | | | | | | | | | | | |
| | | | | | | | | | | | |
| | | | | | | | | | | | |
| | | | | | | | | | | | |
| | | | | | | | | | | | |
| | | | | | | | | | | | |
| | | | | | | | | | | | |
| | | | | | | | | | | | |
| | | | | | | | | | | | |
| | | | | | | | | | | | |
| | | | | | | | | | | | |
| | | | | | | | | | | | |
| | | | | | | | | | | | |
| | | | | | | | | | | | |
| | | | | | | | | | | | |
| | | | | | | | | | | | |
| | | | | | | | | | | | |
| | | |
| --- | --- | --- |
| | |
| --- | --- |
Item 5. Market for Registrant’s Common Equity, Related Stockholder Matters and Issuer Purchases of Equity Securities
10 rewritten, 11 added, 11 removed, 10 unchanged
On October 14, [removed: 2020,] [added: 2021,] the closing sales price for our common stock as reported on the New York Stock Exchange was [removed: $35.63.][added: $62.97.]
As of October 14, [removed: 2020,] [added: 2021,] there were [removed: 1,266] [added: 1,207] holders of record of our common stock.
The performance graph and table show a comparison of cumulative total stockholder return, assuming the reinvestment of dividends, from a $100 investment in the common stock of Jabil over the five-year period ending August 31, [removed: 2020,] [added: 2021,] with the cumulative stockholder return of the (1) S&P MidCap 400 Index and (2) peer group which includes Celestica Inc., [removed: Catcher Technology Co., Ltd,] Flex Ltd., Hon-Hai Precision Industry Co. Ltd, Plexus Corp., and Sanmina Corp.
[removed: 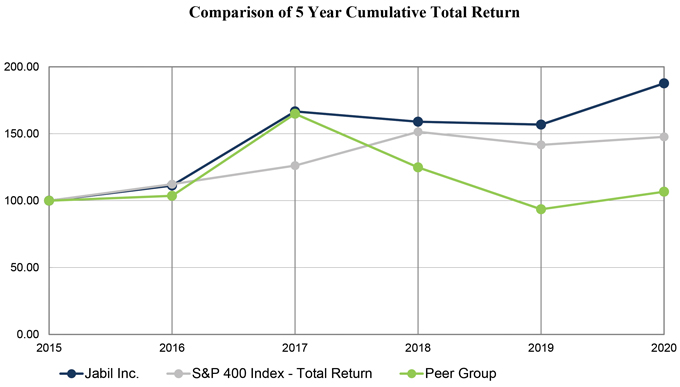][added: 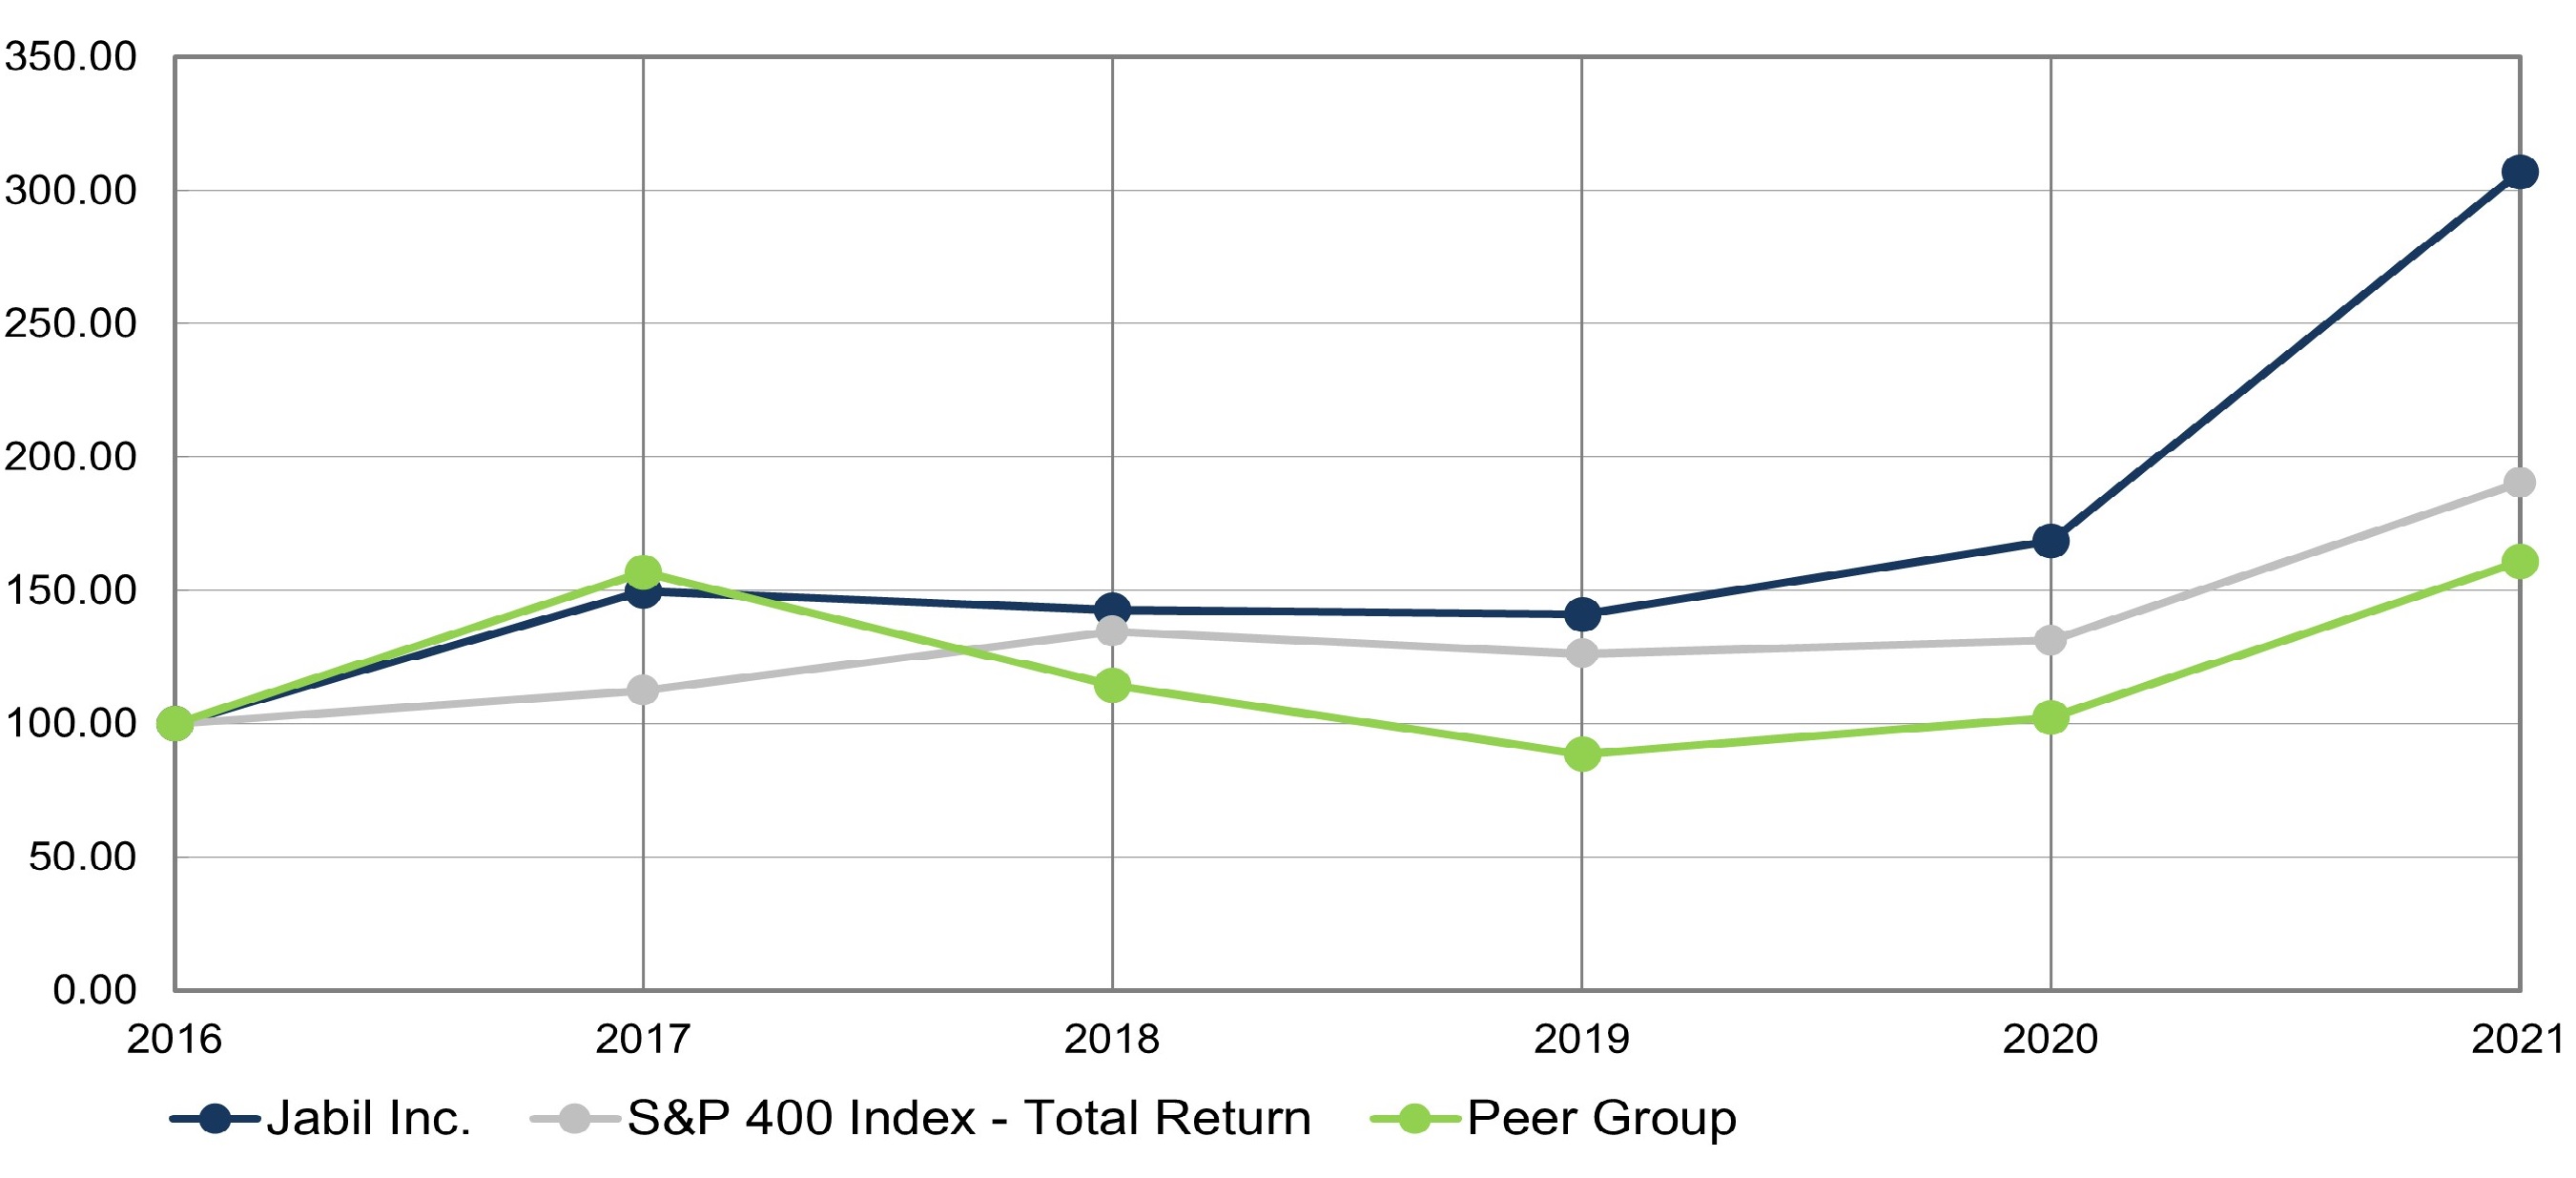]
| August 31 | [removed: 2015] | | [added: 2016] | | [removed: 2016] | | | | 2017 | | | | [added: | |] 2018 | | | | [added: | |] 2019 | | | | [added: | |] 2020 | | | [added: | | | 2021 | | |]
| S&P MidCap 400 Index – Total Returns | [added: | | $ |] 100 | | | | [added: | $ |] 112 | | | | [removed: 126] | [added: $] | [added: 135] | | [removed: 151] | | | [added: $] | [removed: 142] [added: 126] | | | | [removed: 148] | [added: $] | [added: 132] | [added: | | | | $ | 190 | |]
The following table provides information relating to our repurchase of common stock during the three months ended August 31, [removed: 2020:][added: 2021:]
| Period | [added: | |] Total Number of Shares Purchased(1) | | | [added: | | |] Average [removed: Price Paid] [added: Price Paid] per Share | | | | [added: | |] Total Number of Shares Purchased as Part of Publicly Announced [removed: Program(2)] [added: Program(2)(3)] | | | [added: | | |] Approximate Dollar Value of Shares that May Yet Be Purchased Under the Program (in [removed: thousands)(2)] [added: millions)(2)(3)] | | |
[removed: | (1) | The] [added: (1)The] purchases include amounts that are attributable to [removed: 1,319] [added: 8,988] shares surrendered to us by employees to satisfy, in connection with the vesting of restricted stock units and the exercise of stock options and stock appreciation rights, their tax withholding obligations. [removed: |]
[removed: | (2) | In] [added: (2)In] September 2019, our Board of Directors authorized the repurchase of up to [removed: $600.0] [added: $600] million of our common stock as publicly announced in a press release on September 24, 2019 (the “2020 Share Repurchase Program”). [removed: |]
Comparison of 5 Year Cumulative Total Return
| | | | | | | | | | | | | | | | | | | | | | | | | | | | | | | | | | | | |
| --- | --- | --- | --- | --- | --- | --- | --- | --- | --- | --- | --- | --- | --- | --- | --- | --- | --- | --- | --- | --- | --- | --- | --- | --- | --- | --- | --- | --- | --- | --- | --- | --- | --- | --- | --- |
| Jabil Inc. | | | $ | 100 | | | | | $ | 150 | | | | | $ | 143 | | | | | $ | 141 | | | | | $ | 169 | | | | | $ | 307 | |
| Peer Group | | | $ | 100 | | | | | $ | 157 | | | | | $ | 114 | | | | | $ | 89 | | | | | $ | 102 | | | | | $ | 161 | |
| June 1, 2021 - June 30, 2021 | | | 1,034,236 | | | | | | $ | 56.75 | | | | | 1,034,236 | | | | | | $ | 66 | |
| July 1, 2021 - July 31, 2021 | | | 900,245 | | | | | | $ | 56.31 | | | | | 891,375 | | | | | | $ | 1,015 | |
| August 1, 2021 - August 31, 2021 | | | 959,938 | | | | | | $ | 59.72 | | | | | 959,820 | | | | | | $ | 958 | |
| Total | | | 2,894,419 | | | | | | $ | 57.60 | | | | | 2,885,431 | | | | | | | | |
No authorization remains under the 2020 Share Repurchase Program as of August 31, 2021.
(3)In July 2021, our Board of Directors authorized the repurchase of up to $1.0 billion of our common stock as publicly announced in a press release on July 23, 2021 (the “2022 Share Repurchase Program”).
| | | | | | | | | | | | | | | | | | | | | | | | |
| Jabil Inc. | $ | 100 | | | $ | 111 | | | $ | 167 | | | $ | 159 | | | $ | 157 | | | $ | 188 | |
| Peer Group | 100 | | | | 104 | | | | 165 | | | | 125 | | | | 94 | | | | 107 | | |
| | | | | | | | | | | | | | |
| --- | --- | --- | --- | --- | --- | --- | --- | --- | --- | --- | --- | --- | --- |
| June 1, 2020 - June 30, 2020 | 80,750 | | | $ | 31.52 | | | 80,750 | | | $ | 408,525 | |
| July 1, 2020 - July 31, 2020 | 457,212 | | | $ | 32.23 | | | 455,893 | | | $ | 393,829 | |
| August 1, 2020 - August 31, 2020 | 223,628 | | | $ | 34.67 | | | 223,628 | | | $ | 386,076 | |
| Total | 761,590 | | | $ | 32.87 | | | 760,271 | | | | | |
| | |
| --- | --- |
Item 6. [Reserved]
0 rewritten, 0 added, 33 removed, 0 unchanged
The following selected data is derived from our Consolidated Financial Statements.
This data should be read in conjunction with the Consolidated Financial Statements and notes thereto incorporated into Item 8, “Financial Statements and Supplementary Data” and with Item 7, “Management’s Discussion and Analysis of Financial Condition and Results of Operations.”
| | | | | | | | | | | | | | | | | | | | |
| --- | --- | --- | --- | --- | --- | --- | --- | --- | --- | --- | --- | --- | --- | --- | --- | --- | --- | --- | --- |
| | Fiscal Year Ended August 31, | | | | | | | | | | | | | | | | | | |
| | 2020 | | | | 2019 | | | | 2018 | | | | 2017 | | | | 2016 | | |
| | (in thousands, except for per share data) | | | | | | | | | | | | | | | | | | |
| Consolidated Statement of Operations Data: | | | | | | | | | | | | | | | | | | | |
| Net revenue | $ | 27,266,438 | | | $ | 25,282,320 | | | $ | 22,095,416 | | | $ | 19,063,121 | | | $ | 18,353,086 | |
| Operating income | 499,846 | | | | 701,356 | | | | 542,153 | | | | 410,230 | | | | 522,833 | | |
| Income before income tax | 260,738 | | | | 450,704 | | | | 373,401 | | | | 256,233 | | | | 387,045 | | |
| Net income | 56,779 | | | | 289,474 | | | | 87,541 | | | | 127,167 | | | | 254,896 | | |
| Net income attributable to Jabil Inc. | $ | 53,912 | | | $ | 287,111 | | | $ | 86,330 | | | $ | 129,090 | | | $ | 254,095 | |
| Earnings per share attributable to the stockholders of Jabil Inc.: | | | | | | | | | | | | | | | | | | | |
| Basic | $ | 0.36 | | | $ | 1.85 | | | $ | 0.50 | | | $ | 0.71 | | | $ | 1.33 | |
| Diluted | $ | 0.35 | | | $ | 1.81 | | | $ | 0.49 | | | $ | 0.69 | | | $ | 1.32 | |
| | (in thousands) | | | | | | | | | | | | | | | | | | |
| Consolidated Balance Sheets Data: | | | | | | | | | | | | | | | | | | | |
| Working capital(1) | $ | 75,402 | | | $ | (187,020 | ) | | $ | 319,050 | | | $ | (243,910 | ) | | $ | 280,325 | |
| Total assets | $ | 14,397,416 | | | $ | 12,970,475 | | | $ | 12,045,641 | | | $ | 11,095,995 | | | $ | 10,322,677 | |
| Current installments of notes payable and long-term debt | $ | 50,194 | | | $ | 375,181 | | | $ | 25,197 | | | $ | 444,255 | | | $ | 44,689 | |
| Notes payable and long-term debt, less current installments | $ | 2,678,288 | | | $ | 2,121,284 | | | $ | 2,493,502 | | | $ | 1,606,017 | | | $ | 2,046,655 | |
| Total Jabil Inc. stockholders’ equity | $ | 1,811,384 | | | $ | 1,887,443 | | | $ | 1,950,257 | | | $ | 2,353,514 | | | $ | 2,438,171 | |
| Common stock shares outstanding | 150,330 | | | | 153,520 | | | | 164,588 | | | | 177,728 | | | | 186,998 | | |
| Consolidated Cash Flow Data: | | | | | | | | | | | | | | | | | | | |
| Investing activities: | | | | | | | | | | | | | | | | | | | |
| Acquisition of property, plant and equipment | $ | (983,035 | ) | | $ | (1,005,480 | ) | | $ | (1,036,651 | ) | | $ | (716,485 | ) | | $ | (924,239 | ) |
| Proceeds and advances from sale of property, plant and equipment | $ | 186,655 | | | $ | 218,708 | | | $ | 350,291 | | | $ | 175,000 | | | $ | 26,031 | |
| Financing activities: | | | | | | | | | | | | | | | | | | | |
| Payments to acquire treasury stock | $ | (214,510 | ) | | $ | (350,323 | ) | | $ | (450,319 | ) | | $ | (306,640 | ) | | $ | (148,340 | ) |
| | |
| --- | --- |
| (1) | Working capital is defined as current assets minus current liabilities. |
Item 9A. Controls and Procedures
6 rewritten, 0 added, 7 removed, 12 unchanged
We carried out an evaluation required by Rules 13a-15 and 15d-15 under the Exchange Act (the “Evaluation”), under the supervision and with the participation of our Chief Executive Officer (“CEO”) and Chief Financial Officer (“CFO”), of the effectiveness of our disclosure controls and procedures as defined in Rules 13a-15 and 15d-15 under the Exchange Act as of August 31, [removed: 2020.][added: 2021.]
We assessed the effectiveness of our internal control over financial reporting as of August 31, [removed: 2020.][added: 2021.]
Management’s report on internal control over financial reporting as of August 31, [removed: 2020] [added: 2021] is incorporated herein at Item 15.
Ernst & Young LLP, our independent registered public accounting firm, issued an audit report on the effectiveness of our internal control over financial reporting as of August 31, [removed: 2020,] [added: 2021,] which is incorporated herein at Item 15.
Notwithstanding the foregoing limitations on the effectiveness of controls, we have reached the conclusions set forth in Management’s report on internal control over financial reporting as of August 31, [removed: 2020.][added: 2021.]
For our fiscal quarter ended August 31, [removed: 2020,] [added: 2021,] we did not identify any modifications to our internal control over financial reporting that have materially affected, or are reasonably likely to materially affect, our internal control over financial reporting.
The SEC’s general guidance permits the exclusion of an assessment of the effectiveness of a registrant’s controls and procedures as they relate to its internal control over financial reporting for an acquired business during the first year following such acquisition if, among other circumstances and factors, there is not an adequate amount of time between the acquisition date and the date of assessment.
On September 30, 2019, we completed the third closing of our acquisition of certain assets of Johnson & Johnson Medical Devices Companies (“JJMD”).
In accordance with the SEC guidance, the scope of our evaluation of internal controls over financial reporting as of August 31, 2020 did not include the internal control over financial reporting of these acquired operations.
Assets acquired from JJMD during the third closing represent 2.1% of our total consolidated assets at August 31, 2020.
Net revenue generated by these assets subsequent to the date of acquisition represents 1.9% of our consolidated net revenue for the fiscal year ended August 31, 2020.
We continue to evaluate internal controls over financial reporting for these acquired operations.
From the acquisition date to August 31, 2020, the processes and systems of the acquired operations did not significantly impact our internal control over financial reporting.
Item 10. Directors, Executive Officers and Corporate Governance
1 rewritten, 0 added, 0 removed, 1 unchanged
The other information required by this item is incorporated by reference to the information set forth under the captions “Election of Directors”, “Beneficial Ownership – Delinquent Section 16(a) Reports”, “Corporate Governance”, “Board of Directors” and “Audit Committee Matters” in our Proxy Statement for the Annual Meeting of Stockholders to be filed with the SEC within 120 days after the end of our fiscal year ended August 31, [removed: 2020] [added: 2021] (“Proxy Statement”).
Item 15. Exhibits and Financial Statement Schedules
729 rewritten, 583 added, 313 removed, 400 unchanged
[removed: | (a) | The] [added: (a)The] following documents are filed as part of this Report: [removed: |]
| 1 | [added: | |] *Financial Statements.* Our consolidated financial statements, and related notes thereto, with the independent registered public accounting firm reports thereon are included in Part IV of this report on the pages indicated by the Index to Consolidated Financial Statements and Schedule. | [added: | |]
| 2 | [added: | |] *Financial Statement Schedule.* Our financial statement schedule is included in Part IV of this report on the page indicated by the Index to Consolidated Financial Statements and Schedule. This financial statement schedule should be read in conjunction with our consolidated financial statements, and related notes thereto. | [added: | |]
| 3 | [added: | |] *Exhibits.* See Item 15(b) below. | [added: | |]
[removed: | (b) | *Exhibits*.] The following exhibits are included as part of, or incorporated by reference into, this Report. [removed: |]
| | | | | | [added: | | | | | | | | | |] Incorporated by Reference Herein | | | | | | | [added: | | | | | | | | | | | | | |]
| Exhibit No. | | | [added: | | | | | |] Description | | [added: | | | |] Form | | [added: | | | |] Exhibit | | | [added: | | | | | |] Filing Date/ Period End | | [added: | | | |]
| 3.1 | | | [added: | | | | | |] [Registrant’s Certificate of Incorporation, as amended.](https://www.sec.gov/Archives/edgar/data/898293/000119312517219901/d387238dex31.htm) | | [added: | | | |] 10-Q | | [added: | | | |] 3.1 | | | [added: | | | | | |] 5/31/2017 | | [added: | | | |]
| 3.2 | | | [added: | | | | | |] [Registrant’s Bylaws, as amended.](https://www.sec.gov/Archives/edgar/data/898293/000119312517219901/d387238dex32.htm) | | [added: | | | |] 10-Q | | [added: | | | |] 3.2 | | | [added: | | | | | |] 5/31/2017 | | [added: | | | |]
| 4.1 | | | [added: | | | | | |] Form of Certificate for Shares of the Registrant’s Common Stock. (P) | | [added: | | | |] S-1 | | [added: | | | |] 1 | | [added: | | | |] 3/17/1993 | | | [added: | | | | | |]
| 4.2 | | | [added: | | | | | |] [Indenture, dated January 16, 2008, with respect to Senior Debt Securities of the Registrant, between the Registrant and [added: U.S. Bank National Association (as successor in interest to] The Bank of New York Mellon Trust Company, N.A. (formerly known as The Bank of New York [removed: Trust] [added: Trust)] Company, N.A.), as trustee.](https://www.sec.gov/Archives/edgar/data/898293/000119312508008114/dex42.htm) | | [added: | | | |] 8-K | | [added: | | | |] 4.2 | | [added: | | | |] 1/17/2008 | | | [added: | | | | | |]
| 4.3 | | | [added: | | | | | |] [Form of 4.700% Registered Senior Notes issued on August 3, 2012](https://www.sec.gov/Archives/edgar/data/898293/000119312512337903/d391683dex41.htm) | | [added: | | | |] 8-K | | [added: | | | |] 4.1 | | [added: | | | |] 8/6/2012 | | | [added: | | | | | |]
| 4.4 | | | [added: | | | | | |] [Officers’ Certificate of the Registrant pursuant to the Indenture, dated August 3, 2012.](https://www.sec.gov/Archives/edgar/data/898293/000119312512337903/d391683dex43.htm) | | [added: | | | |] 8-K | | [added: | | | |] 4.3 | | [added: | | | |] 8/6/2012 | | | [added: | | | | | |]
| 4.5 | | | [added: | | | | | |] [Officers’ Certificate, dated as of January 17, 2018, establishing the 3.950% Senior Notes due 2028.](https://www.sec.gov/Archives/edgar/data/898293/000119312518012295/d460944dex41.htm) | | [added: | | | |] 8-K | | [added: | | | |] 4.1 | | [added: | | | |] 1/17/2018 | | | [added: | | | | | |]
| 4.6 | | | [added: | | | | | |] [Officers’ Certificate, dated as of January 15, 2020, establishing the 3.600% Senior Notes due 2030.](https://www.sec.gov/Archives/edgar/data/898293/000119312520008126/d870866dex41.htm) | | [added: | | | |] 8-K | | [added: | | | |] 4.1 | | [added: | | | |] 1/15/2020 | | | [added: | | | | | |]
| 4.7 | | | [added: | | | | | |] [Officers’ Certificate, dated as of July 13, 2020, establishing the 3.000% Senior Notes due 2031.](https://www.sec.gov/Archives/edgar/data/898293/000119312520191916/d924129dex41.htm) | | [added: | | | |] 8-K | | [added: | | | |] 4.1 | | | | [added: | | | | | | | |] 7/13/2020 | [added: | |]
| [removed: 4.8] [added: 4.9*] | | | [added: | | | | | |] [Description of Jabil [removed: Securities](https://www.sec.gov/Archives/edgar/data/898293/000119312519271646/d782178dex48.htm)] [added: Securities.](https://www.sec.gov/Archives/edgar/data/898293/000119312521305429/d176971dex49.htm)] | | [removed: 10-K] | | [removed: 4.8] | | | | [removed: 8/31/2019] | [added: | | | | | | | | | | | | | | | | | |]
| 10.1† | | | [added: | | | | | |] Restated cash or deferred profit sharing plan under section 401(k). (P) | | [added: | | | |] S-1 | | | | | | [added: | | | | | | | | | | | |] 3/3/1993 | [added: | |]
| 10.2† | | | [added: | | | | | |] Form of Indemnification Agreement between the Registrant and its Officers and Directors. (P) | | [added: | | | |] S-1 | | | | | | [added: | | | | | | | | | | | |] 3/3/1993 | [added: | |]
| 10.3a | | | [added: | | | | | |] [Form of [removed: Performance-Based] [added: Jabil Inc.] Restricted Stock Unit Award Agreement (PBRSU EPS [removed: Officer] - [removed: EU5).](https://www.sec.gov/Archives/edgar/data/898293/000119312516742815/d126783dex106m.htm)] [added: Executive - EU)](https://www.sec.gov/Archives/edgar/data/898293/000119312519005404/d663336dex101.htm)] | | [removed: 10-K] | | [removed: 10.6m] | | [added: 10-Q] | | [removed: 8/31/2016] | [added: | | | 10.1 | | | | | | | | | | | | 11/30/2018 | | |]
| 10.3b | | | [added: | | | | | |] [Form of [removed: Performance-Based] [added: Jabil Inc.] Restricted Stock Unit Award Agreement (PBRSU EPS [removed: Officer] - [removed: Non-EU5).](https://www.sec.gov/Archives/edgar/data/898293/000119312516742815/d126783dex106n.htm)] [added: Executive - Non-EU)](https://www.sec.gov/Archives/edgar/data/898293/000119312519005404/d663336dex102.htm)] | | [removed: 10-K] | | [removed: 10.6n] | | [added: 10-Q] | | [removed: 8/31/2016] | [added: | | | 10.2 | | | | | | | | | | | | 11/30/2018 | | |]
| [removed: 10.3c] [added: 10.3i] | | | [added: | | | | | |] [Form of [removed: Performance-Based] [added: Jabil Inc.] Restricted Stock Unit Award Agreement (PBRSU EPS [removed: Non-Officer5).](https://www.sec.gov/Archives/edgar/data/898293/000119312516742815/d126783dex106o.htm)] [added: - Executive - Non-EU).](https://www.sec.gov/Archives/edgar/data/898293/000119312520001434/d852870dex102.htm)] | | [removed: 10-K] | | [removed: 10.6o] | | [added: 10-Q] | | [removed: 8/31/2016] | [added: | | | 10.2 | | | | | | | | | | | | 11/30/2019 | | |]
| 10.3d | | | [added: | | | | | |] [Form of [removed: Performance-Based] [added: Jabil Inc.] Restricted Stock Unit Award Agreement (PBRSU TSR [removed: Officer] - [removed: EU).](https://www.sec.gov/Archives/edgar/data/898293/000119312515345706/d48937dex106m.htm)] [added: OEU).](https://www.sec.gov/Archives/edgar/data/898293/000119312519005404/d663336dex104.htm)] | | [removed: 10-K] | | [removed: 10.6m] | | [added: 10-Q] | | [removed: 8/31/2015] | [added: | | | 10.4 | | | | | | | | | | | | 11/30/2018 | | |]
| [removed: 10.3e] [added: 10.3c] | | | [added: | | | | | |] [Form of [removed: Performance-Based] [added: Jabil Inc.] Restricted Stock Unit Award Agreement (PBRSU TSR [removed: Officer] - [removed: Non-EU).](https://www.sec.gov/Archives/edgar/data/898293/000119312515345706/d48937dex106n.htm)] [added: ONEU).](https://www.sec.gov/Archives/edgar/data/898293/000119312519005404/d663336dex103.htm)] | | [removed: 10-K] | | [removed: 10.6n] | | [added: 10-Q] | | [removed: 8/31/2015] | [added: | | | 10.3 | | | | | | | | | | | | 11/30/2018 | | |]
| 10.3f | | | [added: | | | | | |] [Form of [removed: Time-Based] [added: Jabil Inc.] Restricted Stock Unit Award Agreement [removed: (TBRSU DIR).](https://www.sec.gov/Archives/edgar/data/898293/000095012311063340/g26940exv10w4.htm)] [added: (TBRSU-OEU)](https://www.sec.gov/Archives/edgar/data/898293/000119312519005404/d663336dex106.htm)] | | [added: | | | |] 10-Q | | [removed: 10.4] | | | | [removed: 5/31/2011] [added: 10.6] | [added: | | | | | | | | | | | 11/30/2018 | | |]
| 10.3g | | | [added: | | | | | |] [Form of [removed: Time-Based] [added: Jabil Inc.] Restricted Stock Unit Award Agreement [removed: (TBRSU NON).](https://www.sec.gov/Archives/edgar/data/898293/000095012311063340/g26940exv10w5.htm)] [added: (TBRSU-DIR)](https://www.sec.gov/Archives/edgar/data/898293/000119312519005404/d663336dex107.htm)] | | [added: | | | |] 10-Q | | [removed: 10.5] | | | | [removed: 5/31/2011] [added: 10.7] | [added: | | | | | | | | | | | 11/30/2018 | | |]
| [removed: 10.3h] [added: 10.3m] | | | [added: | | | | | |] [Form of [removed: Time-Based] [added: Jabil Inc.] Restricted Stock Unit Award Agreement [removed: (TBRSU OEU).](https://www.sec.gov/Archives/edgar/data/898293/000095012311063340/g26940exv10w6.htm)] [added: (TBRSU-OEU).](https://www.sec.gov/Archives/edgar/data/898293/000119312520001434/d852870dex106.htm)] | | [added: | | | |] 10-Q | | [added: | | | |] 10.6 | | | | [removed: 5/31/2011] | [added: | | | | | | | 11/30/2019 | | |]
| [removed: 10.3i] [added: 10.3e] | | | [added: | | | | | |] [Form of [removed: Time-Based] [added: Jabil Inc.] Restricted Stock Unit Award Agreement [removed: (TBRSU ONEU).](https://www.sec.gov/Archives/edgar/data/898293/000095012311063340/g26940exv10w7.htm)] [added: (TBRSU-ONEU)](https://www.sec.gov/Archives/edgar/data/898293/000119312519005404/d663336dex105.htm)] | | [added: | | | |] 10-Q | | [removed: 10.7] | | | | [removed: 5/31/2011] [added: 10.5] | [added: | | | | | | | | | | | 11/30/2018 | | |]
| [removed: 10.3j] [added: 10.3l] | | | [added: | | | | | |] [Form of [removed: Time-Based] [added: Jabil Inc.] Restricted Stock Unit Award Agreement [removed: (ACQ TBRSU).](https://www.sec.gov/Archives/edgar/data/898293/000119312515230422/d931252dex101.htm)] [added: (TBRSU-ONEU).](https://www.sec.gov/Archives/edgar/data/898293/000119312520001434/d852870dex105.htm)] | | [added: | | | |] 10-Q | | [removed: 10.1] | | | | [removed: 5/31/2015] [added: 10.5] | [added: | | | | | | | | | | | 11/30/2019 | | |]
| 10.4† | | | [added: | | | | | |] [Jabil Inc. 2011 Employee Stock Purchase Plan, as [removed: amended](https://www.sec.gov/Archives/edgar/data/898293/000119312519005404/d663336dex108.htm)] [added: amended.](https://www.sec.gov/Archives/edgar/data/898293/000119312520313839/d27319ddef14a.htm#tx27319_79)] | | [removed: 10-Q] | | [removed: 10.8] | | [added: 14A] | | [removed: 11/30/2018] | [added: | | | B | | | | | | | | | | | | 12/9/2020 | | |]
| [removed: 10.4a] [added: 10.3h] | | | [added: | | | | | |] [Form of Jabil Inc. Restricted Stock Unit Award Agreement (PBRSU EPS - [removed: Executive - EU)](https://www.sec.gov/Archives/edgar/data/898293/000119312519005404/d663336dex101.htm)] [added: Executive-EU).](https://www.sec.gov/Archives/edgar/data/898293/000119312520001434/d852870dex101.htm)] | | [added: | | | |] 10-Q | | [added: | | | |] 10.1 | | | | [removed: 11/30/2018] | [added: | | | | | | | 11/30/2019 | | |]
| [removed: 10.4b] [added: 10.5d] | | | [added: | | | | | |] [Form of Jabil Inc. Restricted Stock Unit Award Agreement (PBRSU EPS [removed: - Executive - Non-EU)](https://www.sec.gov/Archives/edgar/data/898293/000119312519005404/d663336dex102.htm)] [added: – Executive).](https://www.sec.gov/Archives/edgar/data/898293/000119312521104662/d167671dex105.htm)] | | [added: | | | |] 10-Q | | [removed: 10.2] | | | | [removed: 11/30/2018] [added: 10.5] | [added: | | | | | | | | | | | 2/28/2021 | | |]
| [removed: 10.4c] [added: 10.3j] | | | [added: | | | | | |] [Form of Jabil Inc. Restricted Stock Unit Award Agreement (PBRSU TSR - [removed: ONEU).](https://www.sec.gov/Archives/edgar/data/898293/000119312519005404/d663336dex103.htm)] [added: ONEU).](https://www.sec.gov/Archives/edgar/data/898293/000119312520001434/d852870dex103.htm)] | | [added: | | | |] 10-Q | | [added: | | | |] 10.3 | | | | [removed: 11/30/2018] | [added: | | | | | | | 11/30/2019 | | |]
| [removed: 10.4d] [added: 10.3k] | | | [added: | | | | | |] [Form of Jabil Inc. Restricted Stock Unit Award Agreement (PBRSU TSR - [removed: OEU).](https://www.sec.gov/Archives/edgar/data/898293/000119312519005404/d663336dex104.htm)] [added: OEU).](https://www.sec.gov/Archives/edgar/data/898293/000119312520001434/d852870dex104.htm)] | | [added: | | | |] 10-Q | | [added: | | | |] 10.4 | | | | [removed: 11/30/2018] | [added: | | | | | | | 11/30/2019 | | |]
| [removed: 10.4e] [added: 10.3n] | | | [added: | | | | | |] [Form of Jabil Inc. Restricted Stock Unit Award Agreement [removed: (TBRSU-ONEU)](https://www.sec.gov/Archives/edgar/data/898293/000119312519005404/d663336dex105.htm)] [added: (TBRSU-DIR).](https://www.sec.gov/Archives/edgar/data/898293/000119312520001434/d852870dex107.htm)] | | [added: | | | |] 10-Q | | [removed: 10.5] | | | | [removed: 11/30/2018] [added: 10.7] | [added: | | | | | | | | | | | 11/30/2019 | | |]
| [removed: 10.4f] [added: 10.5a] | | | [added: | | | | | |] [Form of Jabil Inc. Restricted Stock Unit Award Agreement [removed: (TBRSU-OEU)](https://www.sec.gov/Archives/edgar/data/898293/000119312519005404/d663336dex106.htm)] [added: (TBRSU-Executive).](https://www.sec.gov/Archives/edgar/data/898293/000119312521104662/d167671dex102.htm)] | | [added: | | | |] 10-Q | | [removed: 10.6] | | | | [removed: 11/30/2018] [added: 10.2] | [added: | | | | | | | | | | | 2/28/2021 | | |]
| [removed: 10.4g] [added: 10.5b] | | | [added: | | | | | |] [Form of Jabil Inc. Restricted Stock Unit Award Agreement [removed: (TBRSU-DIR)](https://www.sec.gov/Archives/edgar/data/898293/000119312519005404/d663336dex107.htm)] [added: (TBRSU-Non-Employee Director).](https://www.sec.gov/Archives/edgar/data/898293/000119312521104662/d167671dex103.htm)] | | [added: | | | |] 10-Q | | [removed: 10.7] | | | | [removed: 11/30/2018] [added: 10.3] | [added: | | | | | | | | | | | 2/28/2021 | | |]
| [removed: 10.4h] [added: 10.5f] | | | [added: | | | | | |] [Form of Jabil Inc. [added: Two-Year] Restricted Stock Unit Award Agreement (PBRSU [removed: EPS - Executive-EU).](https://www.sec.gov/Archives/edgar/data/898293/000119312520001434/d852870dex101.htm)] [added: EPS-Executive).](https://www.sec.gov/Archives/edgar/data/898293/000119312521104662/d167671dex107.htm)] | | [added: | | | |] 10-Q | | [removed: 10.1] | | | | [removed: 11/30/2019] [added: 10.7] | [added: | | | | | | | | | | | 2/28/2021 | | |]
| [removed: 10.4i] [added: 10.5c] | | | [added: | | | | | |] [Form of Jabil Inc. Restricted Stock Unit Award Agreement (PBRSU [removed: EPS - Executive - Non-EU).](https://www.sec.gov/Archives/edgar/data/898293/000119312520001434/d852870dex102.htm)] [added: TSR – Executive).](https://www.sec.gov/Archives/edgar/data/898293/000119312521104662/d167671dex104.htm)] | | [added: | | | |] 10-Q | | [removed: 10.2] | | | | [removed: 11/30/2019] [added: 10.4] | [added: | | | | | | | | | | | 2/28/2021 | | |]
| [removed: 10.4j] [added: 10.5e] | | | [added: | | | | | |] [Form of Jabil Inc. [added: Two-Year Cliff] Restricted Stock Unit Award Agreement [removed: (PBRSU TSR - ONEU).](https://www.sec.gov/Archives/edgar/data/898293/000119312520001434/d852870dex103.htm)] [added: (TBRSU – Executive).](https://www.sec.gov/Archives/edgar/data/898293/000119312521104662/d167671dex106.htm)] | | [added: | | | |] 10-Q | | [removed: 10.3] | | | | [removed: 11/30/2019] [added: 10.6] | [added: | | | | | | | | | | | 2/28/2021 | | |]
| --- | --- | --- | --- | --- | --- |
(b)*Exhibits*.
| | | | | | | | | | | | | | | | | | | | | | | | | | | | | | | | | | | | |
| --- | --- | --- | --- | --- | --- | --- | --- | --- | --- | --- | --- | --- | --- | --- | --- | --- | --- | --- | --- | --- | --- | --- | --- | --- | --- | --- | --- | --- | --- | --- | --- | --- | --- | --- | --- |
| | | | | | | | | | | | | | | | | | | | | | | | | | | | | | | | | | | | |
| | | | | | | | | | | | | | | | | | | | | | | | | | | | | | | | | | | | |
| | | | | | | | | | | | | | | | | | | | | | | | | | | | | | | | | | | | |
| | | | | | | | | | | | | | | | | | | | | | | | | | | | | | | | | | | | |
| | | | | | | | | | | | | | | | | | | | | | | | | | | | | | | | | | | | |
| | | | | | | | | | | | | | | | | | | | | | | | | | | | | | | | | | | | |
| | | | | | | | | | | | | | | | | | | | | | | | | | | | | | | | | | | | |
| | | | | | | | | | | | | | | | | | | | | | | | | | | | | | | | | | | | |
| | | | | | | | | | | | | | | | | | | | | | | | | | | | | | | | | | | | |
| | | | | | | | | | | | | | | | | | | | | | | | | | | | | | | | | | | | |
| | | | | | | | | | | | | | | | | | | | | | | | | | | | | | | | | | | | |
| | | | | | | | | | | | | | | | | | | | | | | | | | | | | | | | | | | | |
| | | | | | | | | | | | | | | | | | | | | | | | | | | | | | | | | | | | |
| | | | | | | | | | | | | | | | | | | | | | | | | | | | | | | | | | | | |
| 4.8 | | | | | | | | | [Officers’ Certificate, dated as of April 14, 2021, establishing the 1.700% Senior Notes due 2026](https://www.sec.gov/Archives/edgar/data/898293/000119312521116248/d129266dex41.htm). | | | | | | 8-K | | | | | | 4.1 | | | | | | | | | | | | 4/14/2021 | | |
| | | | | | | | | | | | | | | | | | | | | | | | | | | | | | | | | | | | |
| | | | | | | | | | | | | | | | | | | | | | | | | | | | | | | | | | | | |
| | | | | | | | | | | | | | | | | | | | | | | | | | | | | | | | | | | | |
| | | | | | | | | | | | | | | | | | | | | | | | | | | | | | | | | | | | |
| | | | | | | | | | | | | | | | | | | | | | | | | | | | | | | | | | | | |
| | | | | | | | | | | | | | | | | | | | | | | | | | | | | | | | | | | | |
| | | | | | | | | | | | | | | | | | | | | | | | | | | | | | | | | | | | |
| | | | | | | | | | | | | | | | | | | | | | | | | | | | | | | | | | | | |
| | | | | | | | | | | | | | | | | | | | | | | | | | | | | | | | | | | | |
| | | | | | | | | | | | | | | | | | | | | | | | | | | | | | | | | | | | |
| | | | | | | | | | | | | | | | | | | | | | | | | | | | | | | | | | | | |
| | | | | | | | | | | | | | | | | | | | | | | | | | | | | | | | | | | | |
| | | | | | | | | | | | | | | | | | | | | | | | | | | | | | | | | | | | |
| | | | | | | | | | | | | | | | | | | | | | | | | | | | | | | | | | | | |
| | | | | | | | | | | | | | | | | | | | | | | | | | | | | | | | | | | | |
| | | | | | | | | | | | | | | | | | | | | | | | | | | | | | | | | | | | |
| | | | | | | | | | | | | | | | | | | | | | | | | | | | | | | | | | | | |
| | | | | | | | | | | | | | | | | | | | | | | | | | | | | | | | | | | | |
| | | | | | | | | | | | | | | | | | | | | | | | | | | | | | | | | | | | |
| | | | | | | | | | | | | | | | | | | | | | | | | | | | | | | | | | | | |
| | | | | | | | | | | | | | | | | | | | | | | | | | | | | | | | | | | | |
| | |
| --- | --- |
| | | | | | | | | | | | |
| --- | --- | --- | --- | --- | --- | --- | --- | --- | --- | --- | --- |
| 10.3† | | | [Jabil 2011 Stock Award and Incentive Plan, as Amended and Restated.](https://www.sec.gov/Archives/edgar/data/898293/000117494716003496/c454477_def14a.htm#a_109) | | 14A | | A | | | | 12/9/2016 |
| 10.3k | | | [Form of Stock Appreciation Right Award Agreement (SAR Officer - Non EU).](https://www.sec.gov/Archives/edgar/data/898293/000119312514377410/d768514dex107q.htm) | | 10-K | | 10.7q | | | | 8/31/2014 |
| 10.4k | | | [Form of Jabil Inc. Restricted Stock Unit Award Agreement (PBRSU TSR - OEU).](https://www.sec.gov/Archives/edgar/data/898293/000119312520001434/d852870dex104.htm) | | 10-Q | | 10.4 | | | | 11/30/2019 |
| 10.4l | | | [Form of Jabil Inc. Restricted Stock Unit Award Agreement (TBRSU-ONEU).](https://www.sec.gov/Archives/edgar/data/898293/000119312520001434/d852870dex105.htm) | | 10-Q | | 10.5 | | | | 11/30/2019 |
| 10.4m | | | [Form of Jabil Inc. Restricted Stock Unit Award Agreement (TBRSU-OEU).](https://www.sec.gov/Archives/edgar/data/898293/000119312520001434/d852870dex106.htm) | | 10-Q | | 10.6 | | | | 11/30/2019 |
| 10.4n | | | [Form of Jabil Inc. Restricted Stock Unit Award Agreement (TBRSU-DIR).](https://www.sec.gov/Archives/edgar/data/898293/000119312520001434/d852870dex107.htm) | | 10-Q | | 10.7 | | | | 11/30/2019 |
| 10.7 | | | [Credit Agreement dated as of April 24, 2020 among Jabil Inc.; the initial lenders named in the Credit Agreement; Mizuho Bank, Ltd. (“Mizuho”), as administrative agent; BNP Paribas and Sumitomo Mitsui Banking Corporation (“SMBC”), as co-syndication agents; Credit Agricole Corporate and Investment Bank, MUFG Union Bank, N.A. and U.S. Bank National Association as Documentation Agents; and Mizuho, BNP Paribas Securities Corp. and SMBC as joint lead arrangers and joint bookrunners.](https://www.sec.gov/Archives/edgar/data/898293/000119312520126289/d922269dex101.htm) | | 8-K | | 10.1 | | | | 4/29/2020 |
The SEC’s general guidance permits the exclusion of an assessment of the effectiveness of a registrant’s controls and procedures as they relate to its internal control over financial reporting for an acquired business during the first year following such acquisition if, among other circumstances and factors, there is not an adequate amount of time between the acquisition date and the date of assessment.
On September 30, 2019, we completed the third closing of our acquisition of certain assets of Johnson & Johnson Medical Devices Companies (“JJMD”).
In accordance with the SEC guidance, the scope of our evaluation of internal controls over financial reporting as of August 31, 2020 did not include the internal control over financial reporting of these acquired operations.
Assets acquired from JJMD during the third closing represent 2.1% of our total consolidated assets at August 31, 2020.
Net revenue generated by these assets subsequent to the date of acquisition represents 1.9% of our
We continue to evaluate internal controls over financial reporting for these acquired operations.
From the acquisition date to August 31, 2020, the processes and systems of the acquired operations did not significantly impact our internal control over financial reporting.
October 22, 2020
As indicated in the accompanying Management’s Report on Internal Control over Financial Reporting, management’s assessment of and conclusion on the effectiveness of internal control over financial reporting did not include the internal controls of the operations acquired in the third closing of the Company’s acquisition of certain assets of Johnson & Johnson Medical Devices Companies (JJMD), which are included in the 2020 consolidated financial statements of the Company and constituted 2.1% of consolidated total assets as of August 31, 2020 and 1.9% of consolidated net revenue for the year then ended.
Our audit of internal control over financial reporting of the Company also did not include an evaluation of the internal control over financial reporting of the operations acquired in the third closing of the Company’s acquisition of certain assets of JJMD.
| |
| --- |
Adoption of New Accounting Standard
As discussed in Note 13 to the consolidated financial statements, the Company changed its method of accounting for revenue from contracts with customers and certain fulfillment costs in 2019 due to the adoption of ASU No. 2014-09, *Revenue from Contracts with Customers (Topic 606)*.
| | | | | | | | |
| --- | --- | --- | --- | --- | --- | --- | --- |
| Contract assets | 1,104,700 | | | | 911,940 | | |
| Total current assets | 9,134,885 | | | | 8,345,085 | | |
| Goodwill | 696,853 | | | | 622,255 | | |
| Other liabilities | 268,925 | | | | 163,821 | | |
| Income tax liabilities | 148,629 | | | | 136,689 | | |
| Cost of revenue | 25,335,625 | | | | 23,368,919 | | | | 20,388,624 | | |
| Gross profit | 1,930,813 | | | | 1,913,401 | | | | 1,706,792 | | |
| Operating income | 499,846 | | | | 701,356 | | | | 542,153 | | |
| Other expense | 31,165 | | | | 53,750 | | | | 37,563 | | |
| Interest expense | 173,877 | | | | 188,730 | | | | 149,002 | | |
| Income before income tax | 260,738 | | | | 450,704 | | | | 373,401 | | |
| Income tax expense | 203,959 | | | | 161,230 | | | | 285,860 | | |
| Basic | 151,613 | | | | 155,613 | | | | 172,237 | | |
An excerpt. Shown here: 40 of 729 rewritten, 40 of 583 added and 40 of 313 removed. The counts are complete. For every sentence, read Item 15. Exhibits and Financial Statement Schedules in the FY2021 filing and the FY2020 filing.
Item 16. Form 10-K Summary
36 rewritten, 24 added, 12 removed, 11 unchanged
| | [added: | |] JABIL INC. Registrant | | [added: | | | |]
| | [added: | |] By: | [added: | |] /s/ MARK T. MONDELLO | [added: | |]
| | | [added: | | | |] Mark T. [removed: Mondello Chief] [added: Mondello Chief] Executive Officer | [added: | |]
Date: October 22, [removed: 2020][added: 2021]
| | [added: | |] Signature | | [added: | | | |] Title | [added: | |] Date | [added: | |]
| By: | [added: | |] /s/ TIMOTHY L. MAIN | | [added: | | | |] Chairman of the Board of Directors | [added: | |] October 22, [removed: 2020] [added: 2021] | [added: | |]
| | [added: | |] Timothy L. Main | | | | [added: | | | | | | | |]
| By: | [added: | |] /s/ THOMAS A. SANSONE | | [added: | | | |] Vice Chairman of the Board of Directors | [added: | |] October 22, [removed: 2020] [added: 2021] | [added: | |]
| | [added: | |] Thomas A. Sansone | | | | [added: | | | | | | | |]
| By: | [added: | |] /s/ MARK T. MONDELLO | | [added: | | | |] Chief Executive Officer and Director (Principal Executive Officer) | [added: | |] October 22, [removed: 2020] [added: 2021] | [added: | |]
| | [added: | |] Mark T. Mondello | | | | [added: | | | | | | | |]
| By: | [added: | |] /s/ MICHAEL DASTOOR | | [added: | | | |] Chief Financial Officer (Principal Financial and Accounting Officer) | [added: | |] October 22, [removed: 2020] [added: 2021] | [added: | |]
| | [added: | |] Michael Dastoor | | | | [added: | | | | | | | |]
| By: | [added: | |] /s/ ANOUSHEH ANSARI | | [added: | | | |] Director | [added: | |] October 22, [removed: 2020] [added: 2021] | [added: | |]
| | [added: | |] Anousheh Ansari | | | | [added: | | | | | | | |]
| By: | [added: | |] /s/ MARTHA F. BROOKS | | [added: | | | |] Director | [added: | |] October 22, [removed: 2020] [added: 2021] | [added: | |]
| | [added: | |] Martha F. Brooks | | | | [added: | | | | | | | |]
| By: | [added: | |] /s/ CHRISTOPHER S. HOLLAND | | [added: | | | |] Director | [added: | |] October 22, [removed: 2020] [added: 2021] | [added: | |]
| | [added: | |] Christopher S. Holland | | | | [added: | | | | | | | |]
| By: | [added: | |] /s/ JOHN C. PLANT | | [added: | | | |] Director | [added: | |] October 22, [removed: 2020] [added: 2021] | [added: | |]
| | [added: | |] John C. Plant | | | | [added: | | | | | | | |]
| By: | [added: | |] /s/ STEVEN A. RAYMUND | | [added: | | | |] Director | [added: | |] October 22, [removed: 2020] [added: 2021] | [added: | |]
| | [added: | |] Steven A. Raymund | | | | [added: | | | | | | | |]
| By: | [added: | |] /s/ DAVID M. STOUT | | [added: | | | |] Director | [added: | |] October 22, [removed: 2020] [added: 2021] | [added: | |]
| | [added: | |] David M. Stout | | | | [added: | | | | | | | |]
| By: | [added: | |] /s/ KATHLEEN A. WALTERS | | [added: | | | |] Director | [added: | |] October 22, [removed: 2020] [added: 2021] | [added: | |]
| | [added: | |] Kathleen A. Walters | | | | [added: | | | | | | | |]
| | | [added: | | | |] Balance [removed: at Beginning of] [added: at Beginning of] Period | | | | [added: | |] Additions [removed: and Adjustments Charged] [added: and Adjustments Charged] to [removed: Costs and] [added: Costs and] Expenses | | | | [removed: Additions/ (Reductions) Charged to] [added: | | Additions/ (Reductions) Charged to] Other Accounts | | | | [added: | |] Write-offs | | | | [added: | |] Balance [removed: at End] [added: at End] of Period | | |
| Fiscal year ended August 31, 2020 | | [added: | | | |] $ | [removed: 17,221] [added: 70] | | | [added: | |] $ | [removed: 24,574] [added: 60] | | | [added: | |] $ | — | | | [added: | |] $ | [removed: (15,968] [added: (45)] | [removed: )] | | [added: | |] $ | [removed: 25,827] [added: 85] | |
| Fiscal year ended August 31, 2019 | | [added: | | | |] $ | [removed: 15,181] [added: 61] | | | [added: | |] $ | [removed: 15,867] [added: 34] | | | [added: | |] $ | — | | | [added: | |] $ | [removed: (13,827] [added: (25)] | [removed: )] | | [added: | |] $ | [removed: 17,221] [added: 70] | |
| Fiscal year ended August 31, [removed: 2018] [added: 2021] | | [added: | | | |] $ | [removed: 14,134] [added: 85] | | | [added: | |] $ | [removed: 12,545] [added: 33] | | | [added: | |] $ | — | | | [added: | |] $ | [removed: (11,498] [added: (33)] | [removed: )] | | [added: | |] $ | [removed: 15,181] [added: 85] | |
| Reserve for excess and obsolete inventory: | | | | | | | | | | | | | | | | | | | | | [added: | | | | | | | | | | | |]
| Fiscal year ended August 31, 2020 | | [added: | | | |] $ | [removed: 69,553] [added: 288] | | | [added: | |] $ | [removed: 60,084] [added: 54] | | | [added: | |] $ | [removed: —] [added: 9] | | | [added: | |] $ | [removed: (44,378] [added: (10)] | [removed: )] | | [added: | |] $ | [removed: 85,259] [added: 341] | |
| Fiscal year ended August 31, 2019 | | [added: | | | |] $ | [removed: 60,940] [added: 223] | | | [added: | |] $ | [removed: 34,091] [added: 23] | | | [added: | |] $ | [removed: —] [added: 59] | | | [added: | |] $ | [removed: (25,478] [added: (17)] | [removed: )] | | [added: | |] $ | [removed: 69,553] [added: 288] | |
| | | [added: | | | |] Balance [removed: at Beginning of] [added: at Beginning of] Period | | | | [removed: Additions Charged to Costs and Expenses] | | [added: Additions Charged to Costs and Expenses] | | [removed: Additions/ (Reductions) Charged to] [added: | | | | Additions/ (Reductions) Charged to] Other Accounts | | | | [removed: Reductions Charged to Costs and Expenses] | | [added: Reductions Charged to Costs and Expenses] | | [added: | | | |] Balance [removed: at End] [added: at End] of Period | | |
| Valuation allowance for deferred taxes: | | | | | | | | | | | | | | | | | | | | | [added: | | | | | | | | | | | |]
| | | | | | | | | |
| --- | --- | --- | --- | --- | --- | --- | --- | --- |
| | | | | | | | | |
| | | | | | | | | | | | | | | |
| --- | --- | --- | --- | --- | --- | --- | --- | --- | --- | --- | --- | --- | --- | --- |
| | | | | | | | | | | | | | | |
| | | | | | | | | | | | | | | |
| | | | | | | | | | | | | | | |
| | | | | | | | | | | | | | | |
| | | | | | | | | | | | | | | |
| | | | | | | | | | | | | | | |
| | | | | | | | | | | | | | | |
| | | | | | | | | | | | | | | |
| | | | | | | | | | | | | | | |
| | | | | | | | | | | | | | | |
| | | | | | | | | | | | | | | |
(in millions)
| | | | | | | | | | | | | | | | | | | | | | | | | | | | | | | | | |
| --- | --- | --- | --- | --- | --- | --- | --- | --- | --- | --- | --- | --- | --- | --- | --- | --- | --- | --- | --- | --- | --- | --- | --- | --- | --- | --- | --- | --- | --- | --- | --- | --- |
| | | | | | | | | | | | | | | | | | | | | | | | | | | | | | | | | |
| | | | | | | | | | | | | | | | | | | | | | | | | | | | | | | | | |
| | | | | | | | | | | | | | | | | | | | | | | | | | | | | | | | | |
| --- | --- | --- | --- | --- | --- | --- | --- | --- | --- | --- | --- | --- | --- | --- | --- | --- | --- | --- | --- | --- | --- | --- | --- | --- | --- | --- | --- | --- | --- | --- | --- | --- |
| Fiscal year ended August 31, 2021 | | | | | | $ | 341 | | | | | $ | 18 | | | | | $ | — | | | | | $ | (6) | | | | | $ | 353 | |
| | | |
| --- | --- | --- |
| | | | | |
| --- | --- | --- | --- | --- |
(in thousands)
| | | | | | | | | | | | | | | | | | | | | |
| --- | --- | --- | --- | --- | --- | --- | --- | --- | --- | --- | --- | --- | --- | --- | --- | --- | --- | --- | --- | --- |
| Allowance for uncollectible accounts receivable: | | | | | | | | | | | | | | | | | | | | |
| Fiscal year ended August 31, 2018 | | $ | 46,013 | | | $ | 35,538 | | | $ | — | | | $ | (20,611 | ) | | $ | 60,940 | |
| Fiscal year ended August 31, 2020 | | $ | 287,604 | | | $ | 54,249 | | | $ | 9,664 | | | $ | (10,317 | ) | | $ | 341,200 | |
| Fiscal year ended August 31, 2019 | | $ | 223,487 | | | $ | 22,750 | | | $ | 58,117 | | | $ | (16,750 | ) | | $ | 287,604 | |
| Fiscal year ended August 31, 2018 | | $ | 285,559 | | | $ | 18,418 | | | $ | (886 | ) | | $ | (79,604 | ) | | $ | 223,487 | |